The citation disadvantage of clinical research
Abstract
Biomedical research encompasses diverse types of activities, from basic science (“bench”) to clinical medicine (“bedside”) to bench-to-bedside translational research. It, however, remains unclear whether different types of research receive citations at varying rates. Here we aim to answer this question by using a newly proposed paper-level indicator that quantifies the extent to which a paper is basic science or clinical medicine. Applying this measure to 5 million biomedical papers, we find a systematic citation disadvantage of clinical oriented papers; they tend to garner far fewer citations and are less likely to be hit works than papers oriented towards basic science. At the same time, clinical research has a higher variance in its citation. We also find that the citation difference between basic and clinical research decreases, yet still persists, if longer citation-window is used. Given the increasing adoption of short-term, citation-based bibliometric indicators in funding decisions, the under-cited effect of clinical research may provide disincentives for bio-researchers to venture into the translation of basic scientific discoveries into clinical applications, thus providing explanations of reasons behind the existence of the gap between basic and clinical research that is commented as “valley of death” and the commentary of “extinction” risk of translational researchers. Our work may provide insights to policy-makers on how to evaluate different types of biomedical research.
keywords:
biomedicine , basic research , clinical medicine , citation analysis , bias1 Introduction
Citation-based indicators, such as h-index [Hirsch, 2005] and Journal Impact Factor [Garfield, 2006], have been increasingly employed in the evaluation of research performance, playing a significant role in various decision-making processes, like funding, hiring, and promotion, and in the ranking of diverse actors in science. Such practice, however, has received criticisms [MacRoberts and MacRoberts, 1989, Seglen, 1997, Nature Editorial, 2005], and a major argument behind those criticisms is that citation data suffers from the presence of several biases. For example, it has been shown that citations have been inflating over time [Persson et al., 2004], so that later papers on average are cited more than earlier ones. Another bias is that there is a significant variation of citations for papers in different research fields [Bornmann and Daniel, 2008]; e.g., biology papers on average receive a larger number of citations than mathematics papers. Recently, Wang et al. [2017] found that there is also bias against novel researches—papers that make first-ever combinations of existing knowledge components; they are more likely to be hit works, but display delayed recognition and are published in journals with low Impact Factor (IF). Given the widespread usage of citation-based indicators, it is important to understand what other potential biases are and carry out citation analysis in a less biased way.
In this article, we focus on biomedical research and investigate whether and to what extent another bias, which we call research level bias, is present in citation data. Biomedicine is a broad area of science that studies biological process of life and the cause and treatment of disease. It is characterized by diverse types of research activities, ranging from basic science that advances the understanding of living organisms by announcing scientific discoveries, to clinical research that studies the treatment of disease, to translational research that aims for translating basic scientific discoveries into the development of useful clinical applications that benefit patients. The questions we seek to answer here are: Is there systematic difference in citations for papers belonging to different types of researches? Does certain type of biomedical research exhibit particular disadvantages in receiving citations? These questions are important because the existence of the research level bias in citations is of particular concerns for funding agencies and institutions, given that they have increasingly relied on citation-based bibliometric indicators for research evaluation. To the best of our knowledge, our work is the first to answer these questions systematically. We also remark that this potential research level bias goes beyond the well-known and widely discussed field bias, because one field may encompass more than one type of researches. For instance, within oncology, a well-operationalized field111In the Web of Science database, there is a Subject Category label called “Oncology.”, papers can be basic science about the identification of tumor suppressing genes, or clinical research about the development of cancer drugs.
Here, drawing on more than 5 million biomedical research papers indexed in the MEDLINE database and published in a 23-year period (1980–2002), we find that there is disadvantage in getting citations for clinical research papers. Our analysis relies on a newly minted paper-level indicator that quantifies the extent to which a biomedical paper is oriented towards basic science or clinical research. Our results suggest that papers that are oriented towards clinical research tend to garner far fewer citations than papers oriented towards basic science. Clinical papers also have a much lower chance for being ranked in the top 1% most cited papers among those in the same field and the same year. Our further analysis using short-, medium-, and long-term citation windows reveals that this citation disadvantage weakens, but still persists, as we increase window length.
To the extent of the reported citation disadvantage of clinical research is a long-standing concern about the existence of the gap between basic biomedical research and clinical research. It has been argued that tremendous progresses made in basic science do not give rise to commensurate, useful clinical applications that benefit patients [Butler, 2008]. In the attempt to bridge this gap, funding bodies have been increasingly emphasized the demonstration of societal impact (e.g., impact on patients) of research and made ongoing efforts to initialize large translational research programs like Clinical and Translational Science Awards [Zerhouni, 2003]. Translation, however, is a decade-long process with frequent failures [Contopoulos-Ioannidis et al., 2008, Morris et al., 2011], which makes the academic performance evaluation a rather challenging task. Convenient, citation-based metrics, such as the number of publications in high IF journals and h-index, are instead adopted for the task. This, however, may provide disincentives for basic researchers to venture into the translation of basic science results into clinical products, as clinical papers receive fewer citations, which in turn are emphasized in performance evaluation. The citation disadvantage of clinical research, therefore, may help explain and further reinforce the current situation in the biomedical research enterprise, where the gap has been described as the “valley of death” [Butler, 2008, Pasterkamp et al., 2016] and “translational researchers are at risk of becoming ‘extinct’” [Pasterkamp et al., 2016]. From a policy perspective, our findings may provide insights to policy-makers on how to evaluate different types of biomedical research.
2 Literature review
2.1 Basic and clinical research
The notions of basic and clinical research have long been adopted by diverse fields to characterize various aspects of the biomedical research enterprise. Moses et al. [2005], for example, examined U.S. funding trends of basic and clinical research received from government, foundations, industry and other sources. Zinner and Campbell [2009] conducted a mailed survey of faculty in U.S. academic medical centers, asking about type of research (basic, clinical trials, epidemiology etc.) as well as funding, publishing, and patenting behavior. They found that 33.6% of faculty exclusively performed basic research, in contrast to 9.1% translational researchers. Levitt and Levitt [2017] looked at the age structure of basic science faculty who are eligible for grant and found a steady decrease of the number of such faculty. Their analysis further indicates that the fraction of faculty who received R01 grant from the U.S. National Institutes of Health (NIH) decreased for younger faculty and increased for older ones. Many studies set out to understand the life-cycle of translational science and showed that this process takes many years and fails frequently [Contopoulos-Ioannidis et al., 2008, Khoury et al., 2010, Morris et al., 2011, Collins, 2011, Williams et al., 2015]. Finally, many scholars have argued for the public support of basic science [Lane and Bertuzzi, 2011, Moses and Martin, 2011, Press, 2013], and several prior works in the innovation literature studied the returns of investments in science and the interactions between basic scientific advances and practical technological progress [Toole, 2012, Li et al., 2017].
2.2 Indicators for research level
Given the widespread use of the two terms, how can one operationalize them at the individual paper level? How to infer whether a given paper is basic science or clinical research? Such an operationalization is especially important for science and technology studies, because the availability of an indicator for research level opens venues for systematic investigations of the aforementioned characterizations of biomedicine. In the present work, we study how the research level of a paper is associated with the number of citations it receives.
The earliest study that proposed an indicator for research level may be Narin et al. [1976], where they subjectively classified journals into four levels of biomedical research. They are, in the order from most basic to most clinical, basic research (L4), clinical investigation (L3), clinical mix (L2), and clinical observation (L1). For each level, they further selected one prototypical journal: Journal of Biological Chemistry for L4, Journal of Clinical Investigation for L3, New England Journal of Medicine for L2, and Journal of the American Medical Association for L1. All papers published in a journal then carry the research level of the journal. This four-level categorization has later been used by Narin and his colleagues in studies about patent-to-paper citations, showing that papers that are cited by patents are mostly from L4 and therefore arguing the advantage of basic research in generating technological innovations [Narin et al., 1997, McMillan et al., 2000]. The classification schema has also been employed in research evaluation [Lewison and Dawson, 1998, Lewison and Devey, 1999].
Recent proposals of research level indicators focused on papers rather than journals and leveraged Medical Subject Heading (MeSH) to quantify research level. MeSH terms are hierarchically-organized controlled medical vocabularies. They are maintained and used by the U.S. National Library of Medicine (NLM) to index and retrieve MEDLINE papers. The MeSH terms of a paper describe the content of the research, and the assignment of terms to papers are performed not by authors but rather by trained staffs at NLM, to guarantee the consistence of the assignment.
The main idea behind using MeSH terms to infer research level is that certain organism-related terms are for labeling the type of subjects studied, which corresponds to the key element in the commonly-adopted operational definitions of basic and clinical research. Basic science, for example, has been operationalized as researches with experiments performed at the level of cell and non-human animals. Those researches are conducted without a specific application objective (e.g., developing a new drug), but rather to make scientific discoveries222Curiosity Creates Cures: The Value and Impact of Basic Research; https://www.nigms.nih.gov/Education/Pages/factsheet_CuriosityCreatesCures.aspx. Basic research often uses model organism like Caenorhabditis elegans as experiment subject. The appearance of cell and animal MeSH terms in a paper therefore is indicative that it is basic science. Clinical research, on the other hand, has been defined as studies with human subjects333https://grants.nih.gov/grants/glossary.htm#ClinicalResearch. The presence of the term “Humans”444Unique ID D006801; https://meshb.nlm.nih.gov/record/ui?ui=D006801 in a paper can be used as a heuristic that the paper is about clinical research.
Based on this idea, Weber [2013] partitioned MEDLINE papers into seven categories, according to whether cell-, animal-, and human-related terms are present in the list of MeSH terms of a paper. The most basic papers are those with only cell and animal terms, papers with only human terms are instead considered as the most clinical, and papers with both are in between. Similarly, Li et al. [2017] assigned NIH grants to different animal kingdom categories, from virus, prokaryote up to primates and humans, based on the MeSH terms that were inferred from the texts of grant abstracts. They found that basic and applied grants are equal likely in generating papers that are subsequently cited by patents.
2.3 Citation difference by research level
Our research question is how the research level of a paper is associated with the number of citations it receives. Despite a few proposals of indicators for research level have been introduced as described above, this question has remained largely unexplored, and existing works seem to generate competing answers. Using visualization techniques, van Eck et al. [2013] showed that clinical words are associated with less citations. Pasterkamp et al. [2016] looked at journals that belong to various stages of the drug development pipeline (drug target discovery, pre-clinical studies, clinical trials, etc.) and found that for journals with the highest IF at each stage, there is a IF valley—journals that are located between basic and clinical research have the lowest IF. This observation reinforces the “valley of death” notion [Butler, 2008]. Opthof [2011] examined papers published in Circulation in year 1998 and found that clinical papers seem to have more citations than basic papers. Finally, Fu and Aliferis [2010] used content based features as derived from MeSH terms to predict citations of biomedical papers. The fact that there is a predictive power of MeSH terms suggests that there may be indeed citation difference for papers with different terms.
3 Level score: an indicator for biomedical research level
To study how research level is linked to citations, we adopted a newly minted measure called “level score” (LS) as the indicator for research level [Ke, 2019]. LS is a paper-level indicator that quantifies the extent to which a biomedical paper is oriented towards basic science or clinical research. By construction, a paper with LS closer to -1 is more oriented towards basic science and 1 clinical research. Compared with previous indicators that are nominal values, LS is continuous. The reason for continuity is because discrete value loses its ability in distinguishing papers with qualitatively distinct extent of basicness. For example, more than half of MEDLINE papers are associated with only human related MeSH terms, and existing indicators consider them with the same value of basicness. Their actual research levels, however, can be very broad: Phase I clinical trial papers are more basic than Phase IV papers, which are more basic than nursing papers. LS can instead capture this difference.
| Paper | LS | MeSH terms |
| Nature 391, 806 (1998) | -0.207 | Animals (-0.295); Caenorhabditis elegans (-0.169); |
| Caenorhabditis elegans Proteins (-0.186); Calmodulin-Binding Proteins (-0.252); | ||
| Gene Expression Regulation (-0.291); Genes, Helminth (-0.167); | ||
| Helminth Proteins (-0.231); Muscle Proteins (-0.223); Phenotype (-0.038); | ||
| RNA, Antisense (-0.307); RNA, Double-Stranded (-0.116) | ||
| NEJM 317, 185 (1987) | 0.257 | AIDS-Related Complex (0.228); Acquired Immunodeficiency Syndrome (0.447); |
| Antiviral Agents (-0.098); Clinical Trials as Topic (0.486); | ||
| Double-Blind Method (0.428); Female (–); Humans (0.580); Male (–); | ||
| Opportunistic Infections (0.262); Pneumonia, Pneumocystis (0.225); | ||
| Random Allocation (0.520); Sarcoma, Kaposi (0.253); | ||
| Thymidine (-0.348); Zidovudine (0.098) | ||
| NEJM 328, 1450 (1993) | 0.448 | Adult (0.631); Ascorbic Acid (-0.050); Carotenoids (0.078); |
| Confidence Intervals (0.748); Coronary Disease (0.450); Diet (0.224); | ||
| Follow-Up Studies (0.631); Humans (0.616); Male (–); Middle Aged (0.578); | ||
| Prospective Studies (0.687); Risk Factors (0.754); Vitamin E (0.030) | ||
| No appliedness scores are assigned to “Male” and “Female,” because they were excluded from the calculation, as they do not have tree numbers, which are required to check whether terms are cell-, animal-, or human-related. | ||
Here we briefly describe the main idea behind the calculation of LS and show the values for several exemplar papers, and the details of the calculation are provided in Ke [2019]. The derivation of LS is still based on the idea that certain MeSH terms indicates the level of experiment and is inspired from recent advances in representation learning in machine learning literature. In particular, it has been shown that vector-representations of words that are learned from large-scale text corpora capture semantic relationships between words, as exemplified by the equation , where denotes the vector of a word [Mikolov et al., 2013b, a]. From these vectors, one can induce the gender dimension by vector difference of pairs of words; a simple arithmetic operation of the above equation gives us , where both and are instances of the gender axis. Averaging over all these pairs of words (e.g., male and female) yields the gender dimension. One can then project a word onto the gender dimension to study the extent of its similarity to male and female. For example, studies have shown that—based on vectors learned from text corpora—computer programmer is more to male than female, and further found that this type of analogy reflects societal bias, which can be quantified through word vectors [Garg et al., 2018].
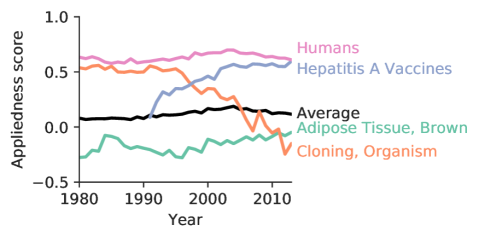
The calculation of LS resembles the process described above. First, popular methods are used to learn vector-representations of MeSH terms555MeSH terms are organized into a hierarchy with 16 branches, and most terms are associated with one or more tree numbers, indicating their locations in the tree structure. Only terms that have tree numbers and are located in branches A–E, G, M, and N are considered.. Then, in the same way for identifying the gender axis, the translation axis (TA)—a vector pointing from basic science MeSH terms to clinical research terms—is identified in the vector space, where cell- and animal-related terms are used as basic science terms and human-related terms as clinical. Next, each MeSH term are projected onto TA to obtain its “appliedness” score. The LS of a paper is the average appliedness score of its MeSH terms, indicating averaged position of its MeSH terms on TA.
Note that when calculating LS of a focal paper, only MeSH terms that appeared in papers published in the last 5 years were considered. This is based on the consideration that biomedical research has been evolving. For example, Ke [2019] showed some MeSH terms whose appliedness scores have exhibited noticeable changes during the studied period. One may, therefore, concern if the scores have also changed for some very general terms such as “Humans.” Figure A.1 shows that this is not the case; its appliedness score remains relatively stable over time, exhibiting a similar trend to the average of all terms.
To demonstrate the validity of LS, let us present some case studies of individual papers. In Figure 1, we first show the histogram of LS for all the 5 million papers in our sample (see § 4.1 for sample selection), serving as the background distribution against which we compare with several exemplar papers. The histogram exhibits bimodality, with the two modes corresponding to basic science and clinical medicine. Bimodality also indicates relatively less amount of published translational science papers compared to either basic or clinical papers, reflecting the gap between basic and clinical science.
On top of the histogram, we highlight LS of the following papers. The first one [ Nature 391, 806 (1998)] discovered the RNA interference phenomenon and wined the 2006 Nobel Prize in Physiology or Medicine [Fire et al., 1998]. The first row in Table 1 lists the 11 MeSH terms associated to the paper and their appliedness scores in parentheses. Two terms, namely “Animals” and “Caenorhabditis elegans,” describe that the research was conducted on the Caenorhabditis elegans model organism666“Caenorhabditis elegans” is a descendant node of “Animals” in the MeSH tree., and hence the paper is considered as basic research using previous indicators. This is consistent with its LS, as suggested from Figure 1 showing that the LS of the paper is located around the peak of the histogram that corresponds to basic science, therefore indicating that it is a typical basic science paper.
The second paper [ NEJM 317, 185 (1987)] is a highly-cited, clinical trial study that tested the effectiveness of Zidovudine, a medication for HIV infection [Fischl et al., 1987]. The second row in Table 1 enumerates its terms, and the fact that “Humans” is one of them means that the paper is categorized as clinical medicine by existing indicators. The LS of the paper also indicates that it is a clinical paper, as seen from Figure 1. Yet, LS can further capture that compared with typical clinical papers, it is more orientated toward basic science. This is because the paper is about drug development, which follows the pipeline that active drug ingredients first need to test on animals before entering the clinical trial stage.
The third paper [ NEJM 328, 1450 (1993)] is a highly-cited, prospective study on the association between dietary antioxidants consumption and the risk of primary coronary artery disease in men [Rimm et al., 1993]. Its MeSH terms contain “Humans,” it is therefore classified as clinical research by existing indicators, as well as by its LS. However, this paper is a typical epidemiology study, without testing new drugs, thus is actually considered as less basic than the second paper. This can be captured by LS, as can be seen from Figure 1 that its LS is larger than that of the second paper.
Going beyond individual examples, Ke [2019] presented systematic validations of LS. For example, papers that are labeled as clinical trials are more oriented towards clinical research, with level scores getting progressively larger for papers of later stages clinical trial. Aggregating LS onto the field level, it was shown that cell biology and biochemistry are the most basic fields, whereas nursing the most clinical.
4 Data and methods
4.1 Sample selection
To address our research question, we analyze papers indexed in MEDLINE, a publicly available database curated by the NLM for biomedical research literature. Our unit of analysis is a scientific paper. The papers in our sample were published between 1980 and 2002, so that every paper has at least 15 years to garner citations. We use Web of Science (WoS) data to obtain additional information about papers. In particular, we limit our attention to papers that are designated as articles in WoS and further get their field labels, as specified as WoS subject category, and their total citation counts, regardless of the fields where citing papers are from. Our sample contains over 5 million papers. Table A.1 presents the top 30 largest fields based on the number of papers in the sample. These fields accounts for 78.2% of all papers in the sample.
4.2 Dependent variables
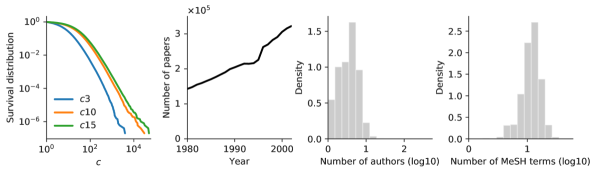
The number of forward citations a paper receives has been widely used as an indicator for its scientific impact. We introduce two groups of dependent variables. The first group is the total number of forward citations that a focal paper has accrued within the 3-, 10-, and 15-year windows after its publication, denoted as , , and , respectively. We consider different lengths of citation-windows to account for the paper- and time-dependent tendency to acquire citations.
Since citations are heterogeneously distributed, spanning orders of magnitude (Table A.2), to capture the right tail of citation distribution, our second group of dependent variables is binary variables that indicates whether a focal paper is a hit one, defined as its total citation count is ranked into the top 1% among all papers in the same field and the same publication year. We use the same three window lengths, and the three dependent variables are similarly denoted as , , and .
4.3 Independent variables
Our main independent variable of interest is the level score of a focal paper, denoted as .
In light of prior research, we consider the following control variables. The first is the number of authors, as previous studies have repeatedly demonstrated the increasing prevalence of collaboration in knowledge production [Wuchty et al., 2007] and the positive association between collaboration and citations [Bornmann et al., 2012, Peng and Zhu, 2012, Didegah and Thelwall, 2013, Fanelli, 2013]. The second control variable is whether a focal paper involves international collaboration, which has been shown to have a positive link to citations [Sin, 2011]. The third is the number of MeSH terms, as it has a positive effect on citations [Chai and Menon, 2019].
Table A.2 reports the summary statistics of all the variables introduced. Figure A.2 shows the distributions of non-indicator variables except LS, which has been shown in Figure 1.
Aside from the above control variables, we include the field and publication year fixed effects. Therefore, our estimations of the effect of research level on citations are within the same field but not across fields. Publication year fixed effect is included to address the concern that ignoring year would make it an omitted variable; it controls for characteristics that are fixed within a year but vary across time, such as the number of publications and the amount of funding.
4.4 Model specification
We use generalized negative binomial (GNB) regression, as provided by the gnbreg function in STATA, to model the association between research level and citation count. We choose GNB because (1) it can model over-dispersed count variable, which is the case for citation count, and (2) it can model not only the mean but also the dispersion parameter. The model specification is as follows:
| (1) |
where is the coefficient of interest for the research level independent variable, is a dummy variable for WoS subject category (field fixed effect), is a dummy for publication year, and is the noise term.
We employ logistic regression model to estimate the effect of level score on being a hit paper, controlling for other confounding variables. The model specification is similar to the GNB one.
5 Results
5.1 Clinical papers are undercited
Table 2 groups papers into 10 categories base on their LS and show mean and standard deviation summary statistics of citations for papers in each group. We observe that average number of citations decreases as we move along the spectrum from basic to clinical research.
We further test whether the observation showed in Table 2 holds after controlling for other confounding factors. We run negative binomial regressions to estimate 3-, 10-, and 15-year citations of papers and report the full regression results in Tables A.3–A.5. These results fully support Table 2, reassuring a negative association between research level and citation counts.
| Level score range | Mean | Std. Dev. | Mean | Std. Dev. | Mean | Std. Dev. |
|---|---|---|---|---|---|---|
| 13.691 | 24.619 | 34.425 | 66.751 | 41.522 | 84.190 | |
| 10.766 | 20.601 | 29.606 | 69.053 | 37.723 | 98.234 | |
| 6.706 | 13.976 | 20.015 | 48.280 | 26.372 | 80.252 | |
| 5.049 | 11.702 | 16.736 | 39.610 | 22.859 | 58.260 | |
| 4.445 | 10.034 | 17.241 | 39.490 | 25.199 | 67.556 | |
Let us first describe the results for 3-year citations (Table A.3). Model 1 in Table A.3 indicates that after controling only for the publication year fixed effect, a one-unit increase in level score is linked to () decrease of . Model 2 in Table A.3 suggests that after controlling for the field fixed effect, for each one-unit increase in level score, the expected citation count in 3 years decreases by . If we additionally include the publication year fixed effect, the effect size is more pronounced— decrease, as shown in Model 3. In Model 4, we further consider all independent control variables and find that one-unit increase in LS translates to significant decrease of 3-year citations. As side results, Model 4 reinforces several previous studies; that is, both the number of authors and international collaboration are positively linked to the number of citations.
Next, we explore how the effect of research level on citations may have changed over time. In doing so, we divide the full sample into three disjoint subsamples, each corresponding to the decade of publication year. Models 5–7 in Table A.3 display the modeling results. We find that the effect size decreases over time; for papers published in 1980s, one-unit increase in level score is associated with a sizable () decrease of 3-year citations, and such negative effect had weakened to in 1990s and in 2000–2002. Understanding factors behind this shrinking effect is beyond the scope of this work, but serves as an important future study. We nevertheless conjecture that an account for this is the growing importance of clinical medicine.
The results presented so far are based on 3-year citations. To understand how the effect of research level on citations may vary for different lengths of citation windows, we separately model citations in 10 and 15 years, which serve as the proxies for medium- and long-term scientific impact, whereas 3-year citation is for short-term impact. In both cases, we consider the full sample as well as subsamples of papers grouped by decade. Tables A.4 and A.5 respectively present the results for 10- and 15-year citations. To facilitate comparisons, we summarize all the modeling results in Figure 2, where we plot the effect sizes () of LS on citations.
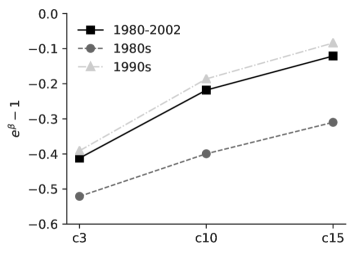
Figure 2 first indicates that LS consistently has a negative effect on citations. This means that papers that are more orientated towards clinical medicine tend to acquire fewer citations. The extent, however, varies across time and citation-window length. Looking at the full sample, Figure 2 (see also Models 4 in Tables A.3–A.5) suggests a stronger effect for shorter citation window. In particular, one-unit increase in LS is associated with decrease of 3-year citations (), decrease of and decrease of . Turning to the decade subsamples, we observe a similar weakening influence of research level on citations as we increase window length. For papers published in 1980s, the size of the negative effect decreases from for to for to for (Models 5 in Tables A.3–A.5). For papers in 1990s, the size shrinks from for to for to for (Models 6 in Tables A.3–A.5). These results signify that life-cycles of papers’ citations may differ by their research levels: Shortly after publication, citations of clinical orientated papers may be less saturated, we thus observe a strong effect of research level on citations; as we increase the citation window, their citations become more saturated, and the effect correspondingly becomes weaker.
Aside from modeling mean citations, we also examine the dispersion of citations. Tables A.6–A.8, which provide estimates from GNB models, demonstrate a consistently positive association between LS and dispersion of citations, regardless of window length and publication time. This implies that clinical oriented papers have higher dispersion in citations.
5.2 Probability of hit papers
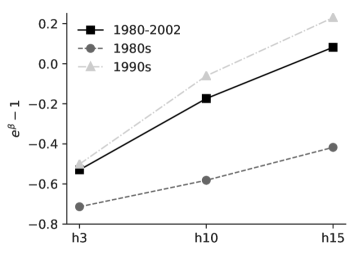
As citation count exhibits over-dispersion, we investigate the right tail of the distributions and model the probability of breakthrough papers. We again use 3-, 10-, and 15-year citations as the short-, medium-, and long-term scientific impact, and utilize logistic regression to model whether a paper is among the top 1% most cited ones clustered by field and publication year. Similar to the regression case, we summarize all the effect size results of LS in Figure 3, and model estimates are instead detailed in Tables A.9–A.11.
Focusing on the full sample, Figure 3 (see also Model 4 in Table A.9) shows that after controlling for field and year fixed effects and all other confounders, a one-unit increase of LS is linked to a ( - 1) significant decrease in the odds of being made in the top 1% most cited papers based on 3-year citations. For 10-year citations, LS is still negatively correlated with being a “hit” paper, but the effect size is much smaller than the 3-year citation case, reaching to only (Model 4 in Table A.10). As we continue to expand the length of citation-window to 15 years, we observe that there is actually a increase in the odds of becoming hit papers (Model 4 in Table A.11).
We explore time trends of the effect of research level on being a hit paper. For papers in 1980s, we find a negative yet weakening effect. Each one-unit increase of LS translates to , , and significant decrease in the odds of being recognized as breakthroughs after 3, 10, and 15 years of publication, respectively. For papers in the 1990s, we see a negative-to-positive transition of the effect, similar to the full sample case.
6 Concluding discussion
Biomedical research has two broad goals: advancing the understandings of living organisms through basic science and improving human health through clinical research. The purpose of this work was to understand whether there is any systematic differences in the amount of citations received for the two types of research. This is important, because citation-based indicators for scientific impact have been increasingly used for research evaluation. We have used a paper-level indicator that quantifies the extent of basicness and studied its association with short-, medium-, and long-term citations for a large-scale corpus of more than 5 million papers published in 1980-2002. Our analysis has pointed out the disadvantage of clinical orientated research in accruing citations; clinical papers tend to have fewer citations than basic papers and are less likely to become hit works. We have further found that such difference is more pronounced for short-term citations.
These results may speak to the policy literature. Bio-researchers appear to be facing a dilemma posing by current science policy. On one hand, a proven record of individual excellence in publications and citations is underscored in funding and tenure decisions. On the other, the public, government, and funding bodies have been increasingly calling for researchers to demonstrate the direct impact of their research on the improvement of human health and the societal impact in general. The demonstration of clinical relevance requires the translation of basic scientific discoveries into clinical applications, from which patients can benefit. This process, however, may take decades with frequent failures [Contopoulos-Ioannidis et al., 2008], which results in less number of publications and less amount of citations accrued, which in turn makes translational researchers less competitive in evaluation. This may provide disincentive to researchers to work on the translation of basic science, resulting in a gap between basic science and clinical research that is coined as “valley of death” [Butler, 2008]. Given the current citation under-appreciation of clinical research, funding bodies may seek to have comprehensive evaluation of output beyond scholarly publications and short-term based citations. Examples can be looking at citations in other types of documents such as clinical guidance [Grant et al., 2000] and drug development documents [Williams et al., 2015].
Our work also adds to the bibliometrics literature that has studied potential biases in citation data. One of the most well-known biases is the field bias [Bornmann and Daniel, 2008]; that is, papers in certain fields on average have more citations than other fields. Reasons for such difference may include varying number of papers and number of references in a paper. Many methods have been proposed in attempting to alleviate this problem [Radicchi et al., 2008]. The key idea behind these methods is to compare a paper’s raw number of citations with citations of papers in the same field, resulting in field-normalized indicators. This procedure considers cross-field citation difference only, thus fails to account for within-filed case, which, as we have shown, happens for papers that are in the same field but belong to different types of researches. Field-normalized indicators, therefore, are not able to correct research level bias. Proposing citation indicators that can mitigate such bias remains to be an important future work.
Acknowledgments
Computing resources and the Stata software provided by Northeastern University are gratefully acknowledged.
Appendix A
| Field | Papers | Percentage |
|---|---|---|
| Biochemistry & Molecular Biology | 524373 | 10.44 |
| Medicine, General & Internal | 263400 | 5.24 |
| Pharmacology & Pharmacy | 228988 | 4.56 |
| Neurosciences | 222744 | 4.43 |
| Surgery | 221762 | 4.41 |
| Immunology | 199624 | 3.97 |
| Oncology | 198047 | 3.94 |
| Cardiac & Cardiovascular Systems | 146685 | 2.92 |
| Endocrinology & Metabolism | 134664 | 2.68 |
| Radiology, Nuclear Medicine & Medical Imaging | 121995 | 2.43 |
| Cell Biology | 117688 | 2.34 |
| Public, Environmental & Occupational Health | 108608 | 2.16 |
| Clinical Neurology | 101155 | 2.01 |
| Microbiology | 100888 | 2.01 |
| Genetics & Heredity | 97359 | 1.94 |
| Multidisciplinary Sciences | 93317 | 1.86 |
| Physiology | 92344 | 1.84 |
| Urology & Nephrology | 85991 | 1.71 |
| Obstetrics & Gynecology | 82911 | 1.65 |
| Pediatrics | 81059 | 1.61 |
| Veterinary Sciences | 80957 | 1.61 |
| Ophthalmology | 79952 | 1.59 |
| Gastroenterology & Hepatology | 79522 | 1.58 |
| Hematology | 75930 | 1.51 |
| Pathology | 72687 | 1.45 |
| Psychiatry | 72197 | 1.44 |
| Dentistry, Oral Surgery & Medicine | 69106 | 1.38 |
| Dermatology | 61867 | 1.23 |
| Medicine, Research & Experimental | 60229 | 1.20 |
| Virology | 53014 | 1.06 |
| Variable | Mean | Std. Dev. | Min | Max | N |
|---|---|---|---|---|---|
| c3 | 8.033 | 17.068 | 0 | 3933 | |
| c10 | 23.387 | 56.281 | 0 | 30327 | |
| c15 | 30.504 | 82.453 | 0 | 49315 | |
| h3 | 0.0104 | 0.101 | 0 | 1 | |
| h10 | 0.010 | 0.100 | 0 | 1 | |
| h15 | 0.010 | 0.100 | 0 | 1 | |
| year | 1992.631 | 6.563 | 1980 | 2002 | |
| ls | 0.114 | 0.310 | -0.609 | 0.897 | |
| authornum | 4.082 | 2.690 | 1 | 546 | |
| authorintl | 0.109 | 0.312 | 0 | 1 | |
| meshnum | 12.19 | 4.447 | 1 | 60 |
| (1) | (2) | (3) | (4) | (5) | (6) | (7) | |
| c3 | 1980–2002 | 1980–2002 | 1980–2002 | 1980–2002 | 1980–1989 | 1990–1999 | 2000–2002 |
| ls | -1.309∗∗∗ | -0.496∗∗∗ | -0.678∗∗∗ | -0.531∗∗∗ | -0.736∗∗∗ | -0.496∗∗∗ | -0.409∗∗∗ |
| (0.00191) | (0.00274) | (0.00280) | (0.00294) | (0.00587) | (0.00412) | (0.00599) | |
| ln_authornum | 0.310∗∗∗ | 0.365∗∗∗ | 0.295∗∗∗ | 0.264∗∗∗ | |||
| (0.00101) | (0.00194) | (0.00145) | (0.00206) | ||||
| meshnum | 0.0427∗∗∗ | 0.0604∗∗∗ | 0.0432∗∗∗ | 0.0358∗∗∗ | |||
| (0.000134) | (0.000333) | (0.000188) | (0.000234) | ||||
| authorintl | 0.146∗∗∗ | 0.105∗∗∗ | 0.160∗∗∗ | 0.161∗∗∗ | |||
| (0.00174) | (0.00460) | (0.00242) | (0.00297) | ||||
| Constant | 1.810∗∗∗ | 1.643∗∗∗ | 1.567∗∗∗ | 0.899∗∗∗ | 0.994∗∗∗ | 0.697∗∗∗ | 1.014∗∗∗ |
| (0.00363) | (0.0532) | (0.0535) | (0.0604) | (0.109) | (0.0918) | (0.108) | |
| Field fe | |||||||
| Year fe | |||||||
| Observations | 5024732 | 5024732 | 5024732 | 4111637 | 1172896 | 1997524 | 941217 |
| Standard errors in parentheses | |||||||
| ∗ , ∗∗ , ∗∗∗ | |||||||
| (1) | (2) | (3) | (4) | (5) | (6) | (7) | |
| c10 | 1980–2002 | 1980–2002 | 1980–2002 | 1980–2002 | 1980–1989 | 1990–1999 | 2000–2002 |
| ls | -0.963∗∗∗ | -0.185∗∗∗ | -0.397∗∗∗ | -0.246∗∗∗ | -0.510∗∗∗ | -0.206∗∗∗ | -0.0884∗∗∗ |
| (0.00181) | (0.00265) | (0.00270) | (0.00283) | (0.00574) | (0.00392) | (0.00579) | |
| ln_authornum | 0.293∗∗∗ | 0.348∗∗∗ | 0.280∗∗∗ | 0.246∗∗∗ | |||
| (0.000980) | (0.00191) | (0.00138) | (0.00199) | ||||
| meshnum | 0.0429∗∗∗ | 0.0632∗∗∗ | 0.0434∗∗∗ | 0.0353∗∗∗ | |||
| (0.000130) | (0.000327) | 0.000181) | (0.000229) | ||||
| authorintl | 0.144∗∗∗ | 0.0991∗∗∗ | 0.155∗∗∗ | 0.164∗∗∗ | |||
| (0.00171) | (0.00461) | (0.00236) | (0.00291) | ||||
| Constant | 2.832∗∗∗ | 2.934∗∗∗ | 2.836∗∗∗ | 2.177∗∗∗ | 2.155∗∗∗ | 2.094∗∗∗ | 2.588∗∗∗ |
| (0.00360) | (0.0519) | (0.0517) | (0.0576) | (0.105) | (0.0852) | (0.107) | |
| Field fe | |||||||
| Year fe | |||||||
| Observations | 5024732 | 5024732 | 5024732 | 4111637 | 1172896 | 1997524 | 941217 |
| Standard errors in parentheses | |||||||
| ∗ , ∗∗ , ∗∗∗ | |||||||
| (1) | (2) | (3) | (4) | (5) | (6) | (7) | |
| c15 | 1980–2002 | 1980–2002 | 1980–2002 | 1980–2002 | 1980–1989 | 1990–1999 | 2000–2002 |
| ls | -0.835∗∗∗ | -0.0394∗∗∗ | -0.277∗∗∗ | -0.129∗∗∗ | -0.371∗∗∗ | -0.0876∗∗∗ | 0.0117∗ |
| (0.00182) | (0.00268) | (0.00272) | (0.00286) | (0.00579) | (0.00396) | (0.00590) | |
| ln_authornum | 0.281∗∗∗ | 0.335∗∗∗ | 0.270∗∗∗ | 0.233∗∗∗ | |||
| (0.000994) | (0.00193) | (0.00140) | (0.00204) | ||||
| meshnum | 0.0420∗∗∗ | 0.0626∗∗∗ | 0.0426∗∗∗ | 0.0341∗∗∗ | |||
| (0.000132) | (0.000330) | (0.000183) | (0.000234) | ||||
| authorintl | 0.148∗∗∗ | 0.102∗∗∗ | 0.159∗∗∗ | 0.169∗∗∗ | |||
| (0.00174) | (0.00466) | (0.00240) | (0.00298) | ||||
| Constant | 3.059∗∗∗ | 3.263∗∗∗ | 3.151∗∗∗ | 2.501∗∗∗ | 2.402∗∗∗ | 2.451∗∗∗ | 3.081∗∗∗ |
| (0.00367) | (0.0528) | (0.0524) | (0.0583) | (0.106) | (0.0850) | (0.114) | |
| Field fe | |||||||
| Year fe | |||||||
| Observations | 5024732 | 5024732 | 5024732 | 4111637 | 1172896 | 1997524 | 941217 |
| Standard errors in parentheses | |||||||
| ∗ , ∗∗ , ∗∗∗ | |||||||
| (1) | (2) | (3) | (4) | (5) | (6) | (7) | |
| lnalpha | 1980–2002 | 1980–2002 | 1980–2002 | 1980–2002 | 1980–1989 | 1990–1999 | 2000-2002 |
| ls | 0.498∗∗∗ | 0.406∗∗∗ | 0.499∗∗∗ | 0.344∗∗∗ | 0.397∗∗∗ | 0.308∗∗∗ | 0.363∗∗∗ |
| (0.00229) | (0.00352) | (0.00365) | (0.00407) | (0.00805) | (0.00570) | (0.00865) | |
| ln_authornum | -0.0863∗∗∗ | -0.133∗∗∗ | -0.0636∗∗∗ | -0.0651∗∗∗ | |||
| (0.00140) | (0.00264) | (0.00199) | (0.00297) | ||||
| meshnum | -0.0253∗∗∗ | -0.0244∗∗∗ | -0.0258∗∗∗ | -0.0283∗∗∗ | |||
| (0.000187) | (0.000453) | (0.000261) | (0.000345) | ||||
| authorintl | -0.0859∗∗∗ | -0.0770∗∗∗ | -0.0914∗∗∗ | -0.103∗∗∗ | |||
| (0.00250) | (0.00654) | (0.00344) | (0.00446) | ||||
| Constant | 0.510∗∗∗ | 0.240∗∗∗ | 0.266∗∗∗ | 0.743∗∗∗ | 0.969∗∗∗ | 0.823∗∗∗ | -0.0185 |
| (0.00433) | (0.0689) | (0.0688) | (0.0743) | (0.111) | (0.118) | (0.198) | |
| Field fe | |||||||
| Year fe | |||||||
| Observations | 5024732 | 5024732 | 5024732 | 4111637 | 1172896 | 1997524 | 941217 |
| Standard errors in parentheses | |||||||
| ∗ , ∗∗ , ∗∗∗ | |||||||
| (1) | (2) | (3) | (4) | (5) | (6) | (7) | |
| lnalpha | 1980–2002 | 1980–2002 | 1980–2002 | 1980–2002 | 1980–1989 | 1990–1999 | 2000-2002 |
| ls | 0.402∗∗∗ | 0.314∗∗∗ | 0.414∗∗∗ | 0.262∗∗∗ | 0.276∗∗∗ | 0.235∗∗∗ | 0.303∗∗∗ |
| (0.00197) | (0.00297) | (0.00307) | (0.00343) | (0.00663) | (0.00483) | (0.00737) | |
| ln_authornum | -0.112∗∗∗ | -0.163∗∗∗ | -0.0864∗∗∗ | -0.0884∗∗∗ | |||
| (0.00117) | (0.00218) | (0.00169) | (0.00251) | ||||
| meshnum | -0.0245∗∗∗ | -0.0235∗∗∗ | -0.0251∗∗∗ | -0.0267∗∗∗ | |||
| (0.000161) | (0.000378) | (0.000226) | (0.000298) | ||||
| authorintl=1 | -0.0667∗∗∗ | -0.0571∗∗∗ | -0.0696∗∗∗ | -0.0879∗∗∗ | |||
| 0.00221) | (0.00571) | (0.00306) | (0.00392) | ||||
| Constant | 0.560∗∗∗ | 0.369∗∗∗ | 0.413∗∗∗ | 0.862∗∗∗ | 1.066∗∗∗ | 0.859∗∗∗ | 0.234 |
| (0.00370) | (0.0527) | (0.0530) | (0.0570) | (0.0884) | (0.0882) | (0.135) | |
| Field fe | |||||||
| Year fe | |||||||
| Observations | 5024732 | 5024732 | 5024732 | 4111637 | 1172896 | 1997524 | 941217 |
| Standard errors in parentheses | |||||||
| ∗ , ∗∗ , ∗∗∗ | |||||||
| (1) | (2) | (3) | (4) | (5) | (6) | (7) | |
| lnalpha | 1980–2002 | 1980–2002 | 1980–2002 | 1980–2002 | 1980–1989 | 1990–1999 | 2000-2002 |
| ls | 0.409∗∗∗ | 0.329∗∗∗ | 0.422∗∗∗ | 0.271∗∗∗ | 0.282∗∗∗ | 0.249∗∗∗ | 0.314∗∗∗ |
| (0.00192) | (0.00288) | (0.00298) | (0.00333) | (0.00641) | (0.00470) | (0.00715) | |
| ln_authornum | -0.122∗∗∗ | -0.172∗∗∗ | -0.0952∗∗∗ | -0.101∗∗∗ | |||
| (0.00114) | (0.00212) | (0.00164) | (0.00243) | ||||
| meshnum | -0.0245∗∗∗ | -0.0236∗∗∗ | -0.0250∗∗∗ | -0.0267∗∗∗ | |||
| (0.000157) | (0.000367) | (0.000220) | (0.000290) | ||||
| authorintl | -0.0614∗∗∗ | -0.0503∗∗∗ | -0.0637∗∗∗ | -0.0813∗∗∗ | |||
| (0.00216) | (0.00559) | (0.00300) | (0.00382) | ||||
| Constant | 0.603∗∗∗ | 0.404∗∗∗ | 0.465∗∗∗ | 0.913∗∗∗ | 1.101∗∗∗ | 0.846∗∗∗ | 0.377∗∗ |
| (0.00361) | (0.0503) | (0.0507) | (0.0545) | (0.0854) | (0.0837) | (0.129) | |
| Field fe | |||||||
| Year fe | |||||||
| Observations | 5024732 | 5024732 | 5024732 | 4111637 | 1172896 | 1997524 | 941217 |
| Standard errors in parentheses | |||||||
| ∗ , ∗∗ , ∗∗∗ | |||||||
| (1) | (2) | (3) | (4) | (5) | (6) | (7) | |
| h3 | 1980–2002 | 1980–2002 | 1980–2002 | 1980–2002 | 1980–1989 | 1990–1999 | 2000–2002 |
| ls | -0.415∗∗∗ | -0.963∗∗∗ | -1.010∗∗∗ | -0.754∗∗∗ | -1.250∗∗∗ | -0.695∗∗∗ | -0.272∗∗∗ |
| (0.0148) | (0.0214) | (0.0219) | (0.0239) | (0.0441) | (0.0340) | (0.0535) | |
| ln_authornum | 0.962∗∗∗ | 0.957∗∗∗ | 0.961∗∗∗ | 0.987∗∗∗ | |||
| (0.00947) | (0.0169) | (0.0136) | (0.0214) | ||||
| meshnum | 0.0826∗∗∗ | 0.124∗∗∗ | 0.0840∗∗∗ | 0.0599∗∗∗ | |||
| (0.00106) | (0.00239) | (0.00150) | (0.00205) | ||||
| authorintl=1 | 0.299∗∗∗ | 0.183∗∗∗ | 0.330∗∗∗ | 0.326∗∗∗ | |||
| (0.0130) | (0.0308) | (0.0177) | (0.0244) | ||||
| Constant | -4.527∗∗∗ | -4.240∗∗∗ | -4.252∗∗∗ | -5.956∗∗∗ | -6.319∗∗∗ | -6.320∗∗∗ | -6.722∗∗∗ |
| (0.0262) | (0.0208) | (0.0325) | (0.0403) | (0.0550) | (0.0492) | (0.0778) | |
| Field fe | |||||||
| Year fe | |||||||
| Observations | 4985384 | 4985384 | 4985384 | 4080011 | 1159520 | 1984216 | 936193 |
| Standard errors in parentheses | |||||||
| ∗ , ∗∗ , ∗∗∗ | |||||||
| (1) | (2) | (3) | (4) | (5) | (6) | (7) | |
| h10 | 1980–2002 | 1980–2002 | 1980–2002 | 1980–2002 | 1980–1989 | 1990–1999 | 2000–2002 |
| ls | -0.205∗∗∗ | -0.458∗∗∗ | -0.480∗∗∗ | -0.191∗∗∗ | -0.871∗∗∗ | -0.0625 | 0.405∗∗∗ |
| (0.0148) | (0.0216) | (0.0222) | (0.0243) | (0.0449) | (0.0344) | (0.0542) | |
| ln_authornum | 0.818∗∗∗ | 0.805∗∗∗ | 0.842∗∗∗ | 0.786∗∗∗ | |||
| (0.00940) | (0.0167) | (0.0135) | (0.0212) | ||||
| meshnum | 0.0803∗∗∗ | 0.125∗∗∗ | 0.0809∗∗∗ | 0.0570∗∗∗ | |||
| (0.00108) | (0.00242) | (0.00152) | (0.00210) | ||||
| authorintl=1 | 0.280∗∗∗ | 0.192∗∗∗ | 0.296∗∗∗ | 0.321∗∗∗ | |||
| (0.0134) | (0.0319) | (0.0183) | (0.0251) | ||||
| Constant | -4.562∗∗∗ | -4.422∗∗∗ | -4.424∗∗∗ | -5.937∗∗∗ | -6.235∗∗∗ | -6.346∗∗∗ | -6.673∗∗∗ |
| (0.0265) | (0.0210) | (0.0330) | (0.0406) | (0.0551) | (0.0495) | (0.0779) | |
| Field fe | |||||||
| Year fe | |||||||
| Observations | 4985384 | 4985384 | 4985384 | 4080011 | 1159602 | 1984216 | 936193 |
| Standard errors in parentheses | |||||||
| ∗ , ∗∗ , ∗∗∗ | |||||||
| (1) | (2) | (3) | (4) | (5) | (6) | (7) | |
| h15 | 1980–2002 | 1980–2002 | 1980–2002 | 1980–2002 | 1980–1989 | 1990–1999 | 2000–2002 |
| ls | -0.0880∗∗∗ | -0.203∗∗∗ | -0.212∗∗∗ | 0.0786∗∗ | -0.540∗∗∗ | 0.207∗∗∗ | 0.595∗∗∗ |
| (0.0147) | (0.0217) | (0.0222) | (0.0243) | (0.0450) | (0.0344) | (0.0543) | |
| ln_authornum | 0.733∗∗∗ | 0.735∗∗∗ | 0.760∗∗∗ | 0.663∗∗∗ | |||
| (0.00931) | (0.0165) | (0.0134) | (0.0209) | ||||
| meshnum | 0.0765∗∗∗ | 0.122∗∗∗ | 0.0759∗∗∗ | 0.0535∗∗∗ | |||
| (0.00109) | (0.00242) | (0.00153) | (0.00211) | ||||
| authorintl=1 | 0.297∗∗∗ | 0.209∗∗∗ | 0.323∗∗∗ | 0.322∗∗∗ | |||
| (0.0135) | (0.0321) | (0.0184) | (0.0253) | ||||
| Constant | -4.580∗∗∗ | -4.516∗∗∗ | -4.520∗∗∗ | -5.909∗∗∗ | -6.237∗∗∗ | -6.274∗∗∗ | -6.524∗∗∗ |
| (0.0267) | (0.0212) | (0.0331) | (0.0409) | (0.0552) | (0.0494) | (0.0775) | |
| Field fe | |||||||
| Year fe | |||||||
| Observations | 4985384 | 4985384 | 4985384 | 4080011 | 1159602 | 1984216 | 936193 |
| Standard errors in parentheses | |||||||
| ∗ , ∗∗ , ∗∗∗ | |||||||
References
- Bornmann and Daniel [2008] Bornmann, L., Daniel, H., 2008. What do citation counts measure? a review of studies on citing behavior. Journal of Documentation 64, 45–80. doi:10.1108/00220410810844150.
- Bornmann et al. [2012] Bornmann, L., Schier, H., Marx, W., Daniel, H.D., 2012. What factors determine citation counts of publications in chemistry besides their quality? Journal of Informetrics 6, 11–18. doi:10.1016/j.joi.2011.08.004.
- Butler [2008] Butler, D., 2008. Translational research: Crossing the valley of death. Nature 453, 840–842. doi:10.1038/453840a.
- Chai and Menon [2019] Chai, S., Menon, A., 2019. Breakthrough recognition: Bias against novelty and competition for attention. Research Policy 48, 733–747. doi:10.1016/j.respol.2018.11.006.
- Collins [2011] Collins, F.S., 2011. Reengineering translational science: The time is right. Science Translational Medicine 3, 90cm17. doi:10.1126/scitranslmed.3002747.
- Contopoulos-Ioannidis et al. [2008] Contopoulos-Ioannidis, D.G., Alexiou, G.A., Gouvias, T.C., Ioannidis, J.P.A., 2008. Life cycle of translational research for medical interventions. Science 321, 1298–1299. doi:10.1126/science.1160622.
- Didegah and Thelwall [2013] Didegah, F., Thelwall, M., 2013. Determinants of research citation impact in nanoscience and nanotechnology. Journal of the American Society for Information Science and Technology 64, 1055–1064. doi:10.1002/asi.22806.
- van Eck et al. [2013] van Eck, N.J., Waltman, L., van Raan, A.F.J., Klautz, R.J.M., Peul, W.C., 2013. Citation analysis may severely underestimate the impact of clinical research as compared to basic research. PLOS ONE 8, e62395. doi:10.1371/journal.pone.0062395.
- Fanelli [2013] Fanelli, D., 2013. Positive results receive more citations, but only in some disciplines. Scientometrics 94, 701–709. doi:10.1007/s11192-012-0757-y.
- Fire et al. [1998] Fire, A., Xu, S., Montgomery, M.K., Kostas, S.A., Driver, S.E., Mello, C.C., 1998. Potent and specific genetic interference by double-stranded rna in caenorhabditis elegans. Nature 391, 806–811. doi:10.1038/35888.
- Fischl et al. [1987] Fischl, M.A., Richman, D.D., Grieco, M.H., Gottlieb, M.S., Volberding, P.A., Laskin, O.L., Leedom, J.M., Groopman, J.E., Mildvan, D., Schooley, R.T., Jackson, G.G., Durack, D.T., King, D., 1987. The efficacy of azidothymidine (azt) in the treatment of patients with aids and aids-related complex. New England Journal of Medicine 317, 185–191. doi:10.1056/NEJM198707233170401.
- Fu and Aliferis [2010] Fu, L.D., Aliferis, C.F., 2010. Using content-based and bibliometric features for machine learning models to predict citation counts in the biomedical literature. Scientometrics 85, 257–270. doi:10.1007/s11192-010-0160-5.
- Garfield [2006] Garfield, E., 2006. The history and meaning of the journal impact factor. Journal of the American Medical Association 295, 90–93. doi:10.1001/jama.295.1.90.
- Garg et al. [2018] Garg, N., Schiebinger, L., Jurafsky, D., Zou, J., 2018. Word embeddings quantify 100 years of gender and ethnic stereotypes. Proceedings of the National Academy of Sciences 115, E3635–E3644. doi:10.1073/pnas.1720347115.
- Grant et al. [2000] Grant, J., Cottrell, R., Cluzeau, F., Fawcett, G., 2000. Evaluating “payback” on biomedical research from papers cited in clinical guidelines: applied bibliometric study. BMJ 320, 1107–1111. doi:10.1136/bmj.320.7242.1107.
- Hirsch [2005] Hirsch, J.E., 2005. An index to quantify an individual’s scientific research output. Proceedings of the National Academy of Sciences 102, 16569–16572. doi:10.1073/pnas.0507655102.
- Ke [2019] Ke, Q., 2019. Identifying translational science through embeddings of controlled vocabularies. Journal of the American Medical Informatics Association 26, 516–523. doi:10.1093/jamia/ocy177.
- Khoury et al. [2010] Khoury, M.J., Gwinn, M., Ioannidis, J.P.A., 2010. The emergence of translational epidemiology: From scientific discovery to population health impact. American Journal of Epidemiology 172, 517–524. doi:10.1093/aje/kwq211.
- Lane and Bertuzzi [2011] Lane, J., Bertuzzi, S., 2011. Measuring the results of science investments. Science 331, 678–680. doi:10.1126/science.1201865.
- Levitt and Levitt [2017] Levitt, M., Levitt, J.M., 2017. Future of fundamental discovery in US biomedical research. Proceedings of the National Academy of Sciences 114, 6498–6503. doi:10.1073/pnas.1609996114.
- Lewison and Dawson [1998] Lewison, G., Dawson, G., 1998. The effect of funding on the outputs of biomedical research. Scientometrics 41, 17–27. doi:10.1007/BF02457963.
- Lewison and Devey [1999] Lewison, G., Devey, M.E., 1999. Bibliometric methods for the evaluation of arthritis research. Rheumatology 38, 13–20. doi:10.1093/rheumatology/38.1.13.
- Li et al. [2017] Li, D., Azoulay, P., Sampat, B.N., 2017. The applied value of public investments in biomedical research. Science 356, 78–81. doi:10.1126/science.aal0010.
- MacRoberts and MacRoberts [1989] MacRoberts, M.H., MacRoberts, B.R., 1989. Problems of citation analysis: A critical review. Journal of the American Society for Information Science 40, 342–349. doi:10.1002/(SICI)1097-4571(198909)40:5<342::AID-ASI7>3.0.CO;2-U.
- McMillan et al. [2000] McMillan, G.S., Narin, F., Deeds, D.L., 2000. An analysis of the critical role of public science in innovation: the case of biotechnology. Research Policy 29, 1–8. doi:10.1016/S0048-7333(99)00030-X.
- Mikolov et al. [2013a] Mikolov, T., Chen, K., Corrado, G., Dean, J., 2013a. Efficient estimation of word representations in vector space ArXiv:1301.3781.
- Mikolov et al. [2013b] Mikolov, T., Yih, W.t., Zweig, G., 2013b. Linguistic regularities in continuous space word representations, in: Proceedings of the 2013 Conference of the North American Chapter of the Association for Computational Linguistics: Human Language Technologies, Association for Computational Linguistics, Atlanta, Georgia. pp. 746–751. URL: https://www.aclweb.org/anthology/N13-1090.
- Morris et al. [2011] Morris, Z.S., Wooding, S., Grant, J., 2011. The answer is 17 years, what is the question: understanding time lags in translational research. Journal of the Royal Society of Medicine 104, 510–520. doi:10.1258/jrsm.2011.110180.
- Moses et al. [2005] Moses, H., Dorsey, E.R., Matheson, D.H.M., Thier, S.O., 2005. Financial anatomy of biomedical research. JAMA 294, 1333–1342. doi:10.1001/jama.294.11.1333.
- Moses and Martin [2011] Moses, H., Martin, J.B., 2011. Biomedical research and health advances. New England Journal of Medicine 364, 567–571. doi:10.1056/NEJMsb1007634.
- Narin et al. [1997] Narin, F., Hamilton, K.S., Olivastro, D., 1997. The increasing linkage between U.S. technology and public science. Research Policy 26, 317–330. doi:10.1016/S0048-7333(97)00013-9.
- Narin et al. [1976] Narin, F., Pinski, G., Gee, H.H., 1976. Structure of the biomedical literature. Journal of the American Society for Information Science 27, 25–45. doi:10.1002/asi.4630270104.
- Nature Editorial [2005] Nature Editorial, 2005. Not-so-deep impact. Nature 435, 1003–1004. doi:10.1038/4351003b.
- Opthof [2011] Opthof, T., 2011. Differences in citation frequency of clinical and basic science papers in cardiovascular research. Medical & Biological Engineering & Computing 49, 613. doi:10.1007/s11517-011-0783-6.
- Pasterkamp et al. [2016] Pasterkamp, G., Hoefer, I., Prakken, B., 2016. Lost in the citation valley. Nature Biotechnology 34, 1016–1018. doi:10.1038/nbt.3691.
- Peng and Zhu [2012] Peng, T.Q., Zhu, J.J.H., 2012. Where you publish matters most: A multilevel analysis of factors affecting citations of internet studies. Journal of the American Society for Information Science and Technology 63, 1789–1803. doi:10.1002/asi.22649.
- Persson et al. [2004] Persson, O., Glänzel, W., Danell, R., 2004. Inflationary bibliometric values: The role of scientific collaboration and the need for relative indicators in evaluative studies. Scientometrics 60, 421–432. doi:10.1023/B:SCIE.0000034384.35498.7d.
- Press [2013] Press, W.H., 2013. What’s so special about science (and how much should we spend on it?). Science 342, 817–822. doi:10.1126/science.342.6160.817.
- Radicchi et al. [2008] Radicchi, F., Fortunato, S., Castellano, C., 2008. Universality of citation distributions: Toward an objective measure of scientific impact. Proceedings of the National Academy of Sciences 105, 17268–17272. doi:10.1073/pnas.0806977105.
- Rimm et al. [1993] Rimm, E.B., Stampfer, M.J., Ascherio, A., Giovannucci, E., Colditz, G.A., Willett, W.C., 1993. Vitamin e consumption and the risk of coronary heart disease in men. New England Journal of Medicine 328, 1450–1456. doi:10.1056/NEJM199305203282004.
- Seglen [1997] Seglen, P.O., 1997. Why the impact factor of journals should not be used for evaluating research. BMJ 314, 498–502. doi:10.1136/bmj.314.7079.497.
- Sin [2011] Sin, S.J., 2011. International coauthorship and citation impact: A bibliometric study of six lis journals, 1980–2008. Journal of the American Society for Information Science and Technology 62, 1770–1783. doi:10.1002/asi.21572.
- Toole [2012] Toole, A.A., 2012. The impact of public basic research on industrial innovation: Evidence from the pharmaceutical industry. Research Policy 41, 1–12. doi:10.1016/j.respol.2011.06.004.
- Wang et al. [2017] Wang, J., Veugelers, R., Stephan, P., 2017. Bias against novelty in science: A cautionary tale for users of bibliometric indicators. Research Policy 46, 1416–1436. doi:10.1016/j.respol.2017.06.006.
- Weber [2013] Weber, G.M., 2013. Identifying translational science within the triangle of biomedicine. Journal of Translational Medicine 11, 126. doi:10.1186/1479-5876-11-126.
- Williams et al. [2015] Williams, R.S., Lotia, S., Holloway, A.K., Pico, A.R., 2015. From scientific discovery to cures: Bright stars within a galaxy. Cell 163, 21–23. doi:10.1016/j.cell.2015.09.007.
- Wuchty et al. [2007] Wuchty, S., Jones, B.F., Uzzi, B., 2007. The increasing dominance of teams in production of knowledge. Science 316, 1036–1039. doi:10.1126/science.1136099.
- Zerhouni [2003] Zerhouni, E., 2003. The NIH roadmap. Science 302, 63–72. doi:10.1126/science.1091867.
- Zinner and Campbell [2009] Zinner, D.E., Campbell, E.G., 2009. Life-science research within US academic medical centers. JAMA 302, 969–976. doi:10.1001/jama.2009.1265.