Quantifying Urban Canopy Cover with Deep Convolutional Neural Networks
Abstract
Urban canopy cover is important to mitigate the impact of climate change. Yet, existing quantification of urban greenery is either manual and not scalable, or use traditional computer vision methods that are inaccurate. We train deep convolutional neural networks (DCNNs) on datasets used for self-driving cars to estimate urban greenery instead, and find that our semantic segmentation and direct end-to-end estimation method are more accurate and scalable, reducing mean absolute error of estimating the Green View Index (GVI) metric from 10.1% to 4.67%. With the revised DCNN methods, the Treepedia project was able to scale and analyze canopy cover in 22 cities internationally, sparking interest and action in public policy and research fields.
1 Introduction
Urban canopy cover is generally acknowledged as an effective way of mitigating the impact of increasing daytime summer temperatures [1, 2] that have recently reached record highs internationally [3, 4]. Physical models show that urban trees can significantly reduce the diurnal temperature range [5], while empirical studies demonstrate that urban canopy cover have reduced peak summer air temperatures by up to 2.8°C, 1.5°C, 2.0 °C, and 2.7 °C in Campinas (Brazil), Singapore, Shanghai (China), and Freiburg (Germany) respectively [6, 7, 8, 9]. Existing studies have established a direct relationship between high peak summer temperatures and critical health outcomes, such as hospital admissions [10, 11], deaths [12, 13, 14], respiratory diseases and cardiovascular health [15, 16]. High temperatures can also significantly depress the economic growth of developing [17] and developed countries [18] by decreasing labor productivity and supply [19], and increasing political instability [17, 20].
Besides decreasing air temperature in cities, benefits of trees and canopy cover in urban areas also include removal of air pollution [21], increased perceived neighborhood safety [22], and better visual and aesthetic appeal for residents [23, 24].
Challenges of quantifying canopy cover: Current methods to measure existing urban canopy cover remain inadequate. Traditional methods rely on either overhead imagery or in-person fieldwork. High resolution overhead images are often costly to obtain, hence limiting most analysis to coarse resolutions [25, 26]. Overhead imagery also cannot represent the street-level and resident perspectives of canopy cover [27]. In-person fieldwork requires significant man-hours to cover large urban areas [28].
First proposed by Yang et al. [27] and later used by Li et al. [29], the Green View Index (GVI) measures the street-level urban canopy cover by averaging percentage of canopy cover on a pixel-level in street level images. Existing methods [29, 30] that calculate GVI primarily relies on the original method of color thresholding and clustering to filter for possibly misidentified green specks. The GVI metric has proven to be applicable to other sources of street-level imagery, including Tencent Street View [31, 32] and Baidu Street View [30], and also resulted in findings of relationships between the prevalence of urban greenery to neighborhood wealth [33], property prices [34], cycling and walking behaviors [35]. These subsequently discovered relationships underline the value of accurate analysis of urban canopy cover at large scales. Conversely, insufficient quantification of urban trees will decrease the effectiveness and fairness of publicly-funded urban greenery efforts.
As demonstrated in Figure 3, existing "threshold and cluster" methods are prone to false positive detection of green objects that are not considered as vertical vegetation, or false negative detection of non-green parts of vertical vegetation such as branches and yellow leaves.00footnotetext: Calculated using "threshold and cluster" method provided for by authors of Li et al. [29] in https://github.com/mittrees/Treepedia_Public Existing methods also validate their accuracy by calculating the Pearson’s correlation coefficient between manually labeled and calculated GVIs [29, 30, 31, 32]. The Pearson’s correlation coefficient measures the strength of co-movements between manually labeled and calculated GVI values, but do not provide a direct measurement of difference between manually labeled and calculated GVI values and also do not capture the accuracy of located pixels of vertical vegetation [36].
2 Dataset and Methods
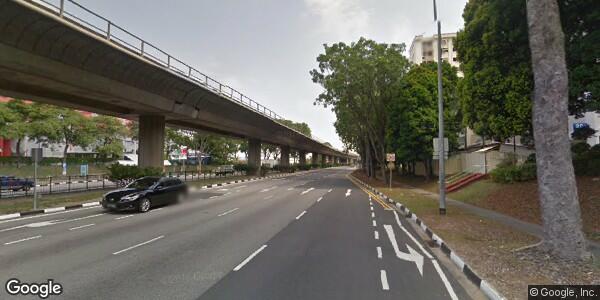
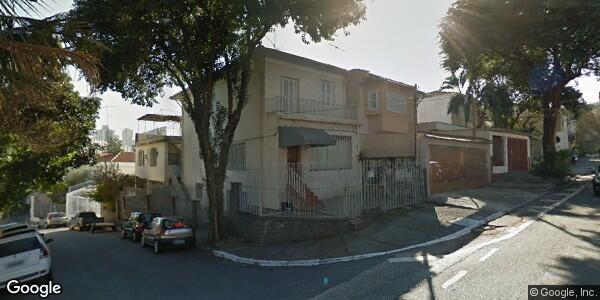
Dataset: We choose Cambridge (USA), Johannesburg (South Africa), Oslo (Norway), So Paulo (Brazil), and Singapore (Singapore) as cities included in our training and test sets. From each of the 5 cities, we randomly select 100 available Google Street View (GSV) images along street networks to form a training-validation-test set. We then divide the 500 image dataset into a 100 image test set, 320 image training set and a 80 image validation set. We produce manual labels by carefully tracing all vertical vegetation in the images for all 500 images.
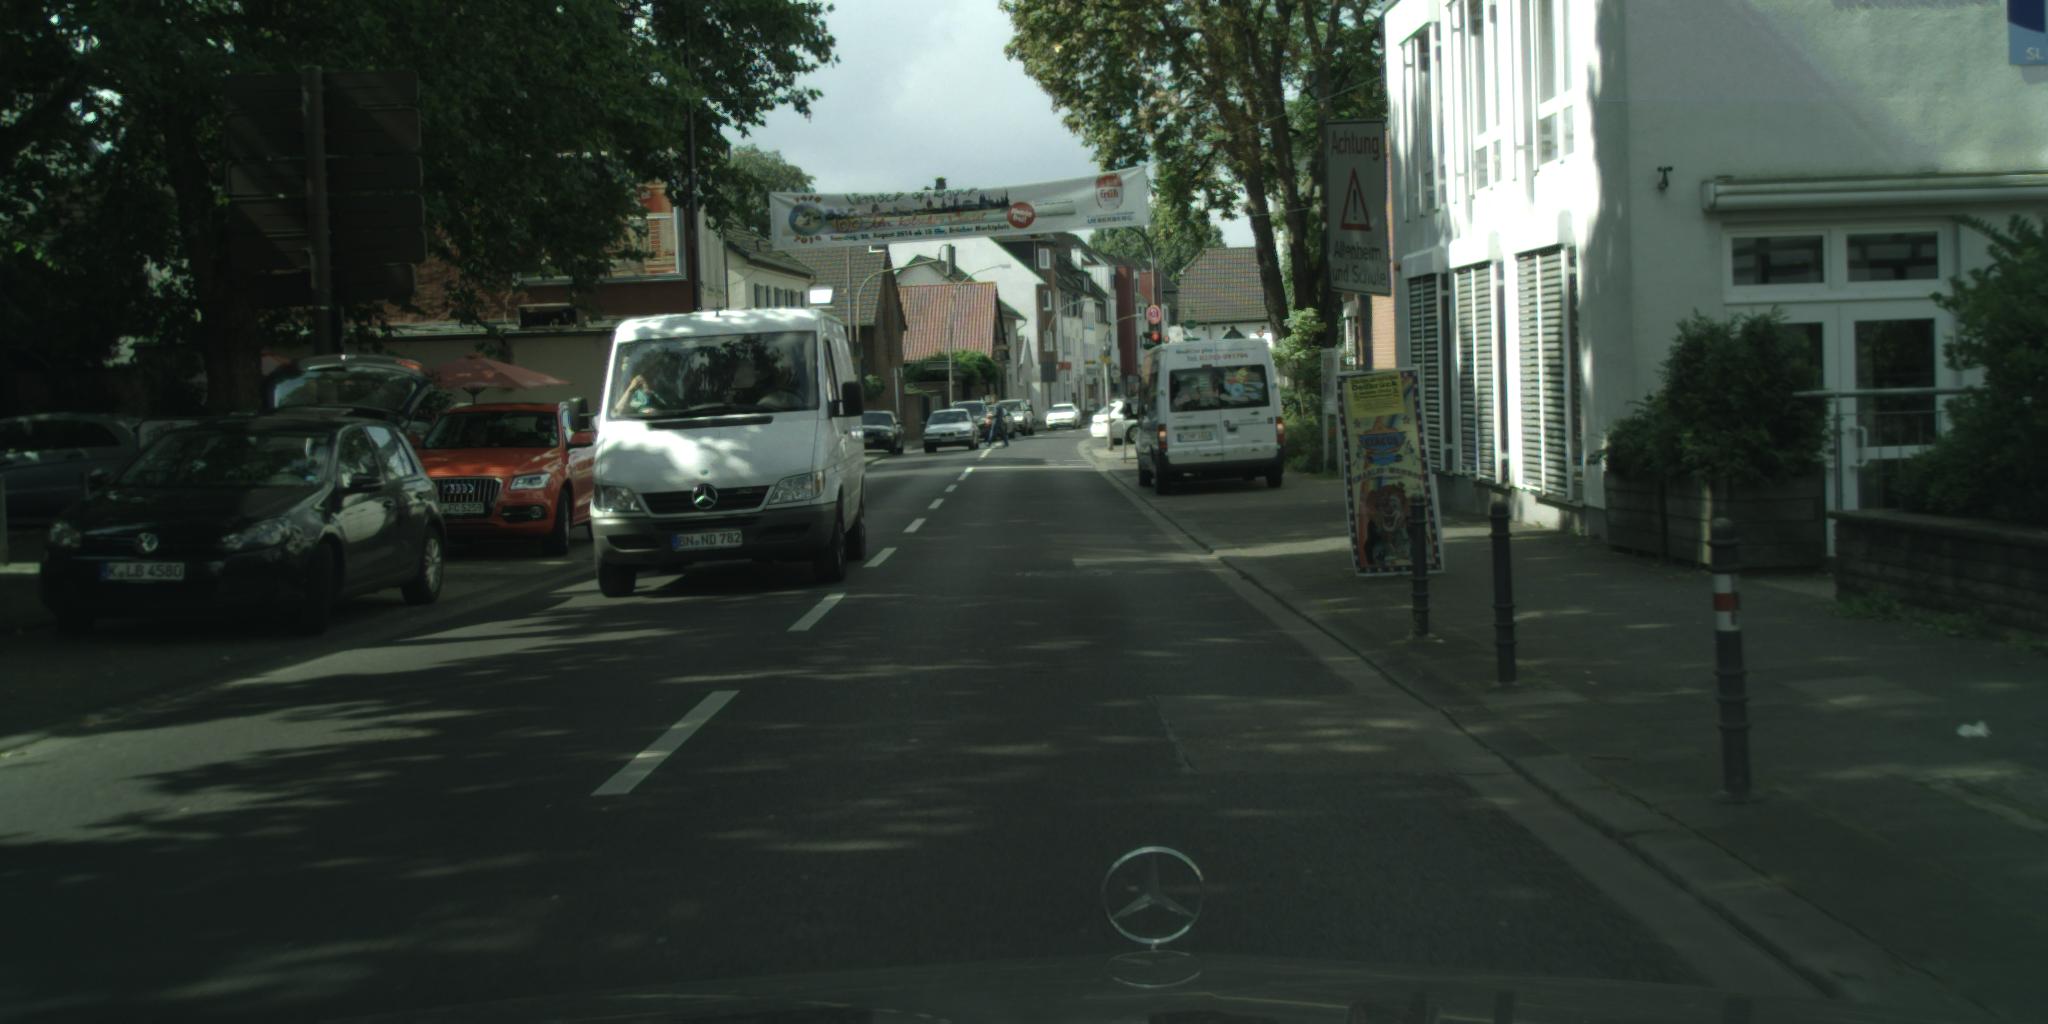
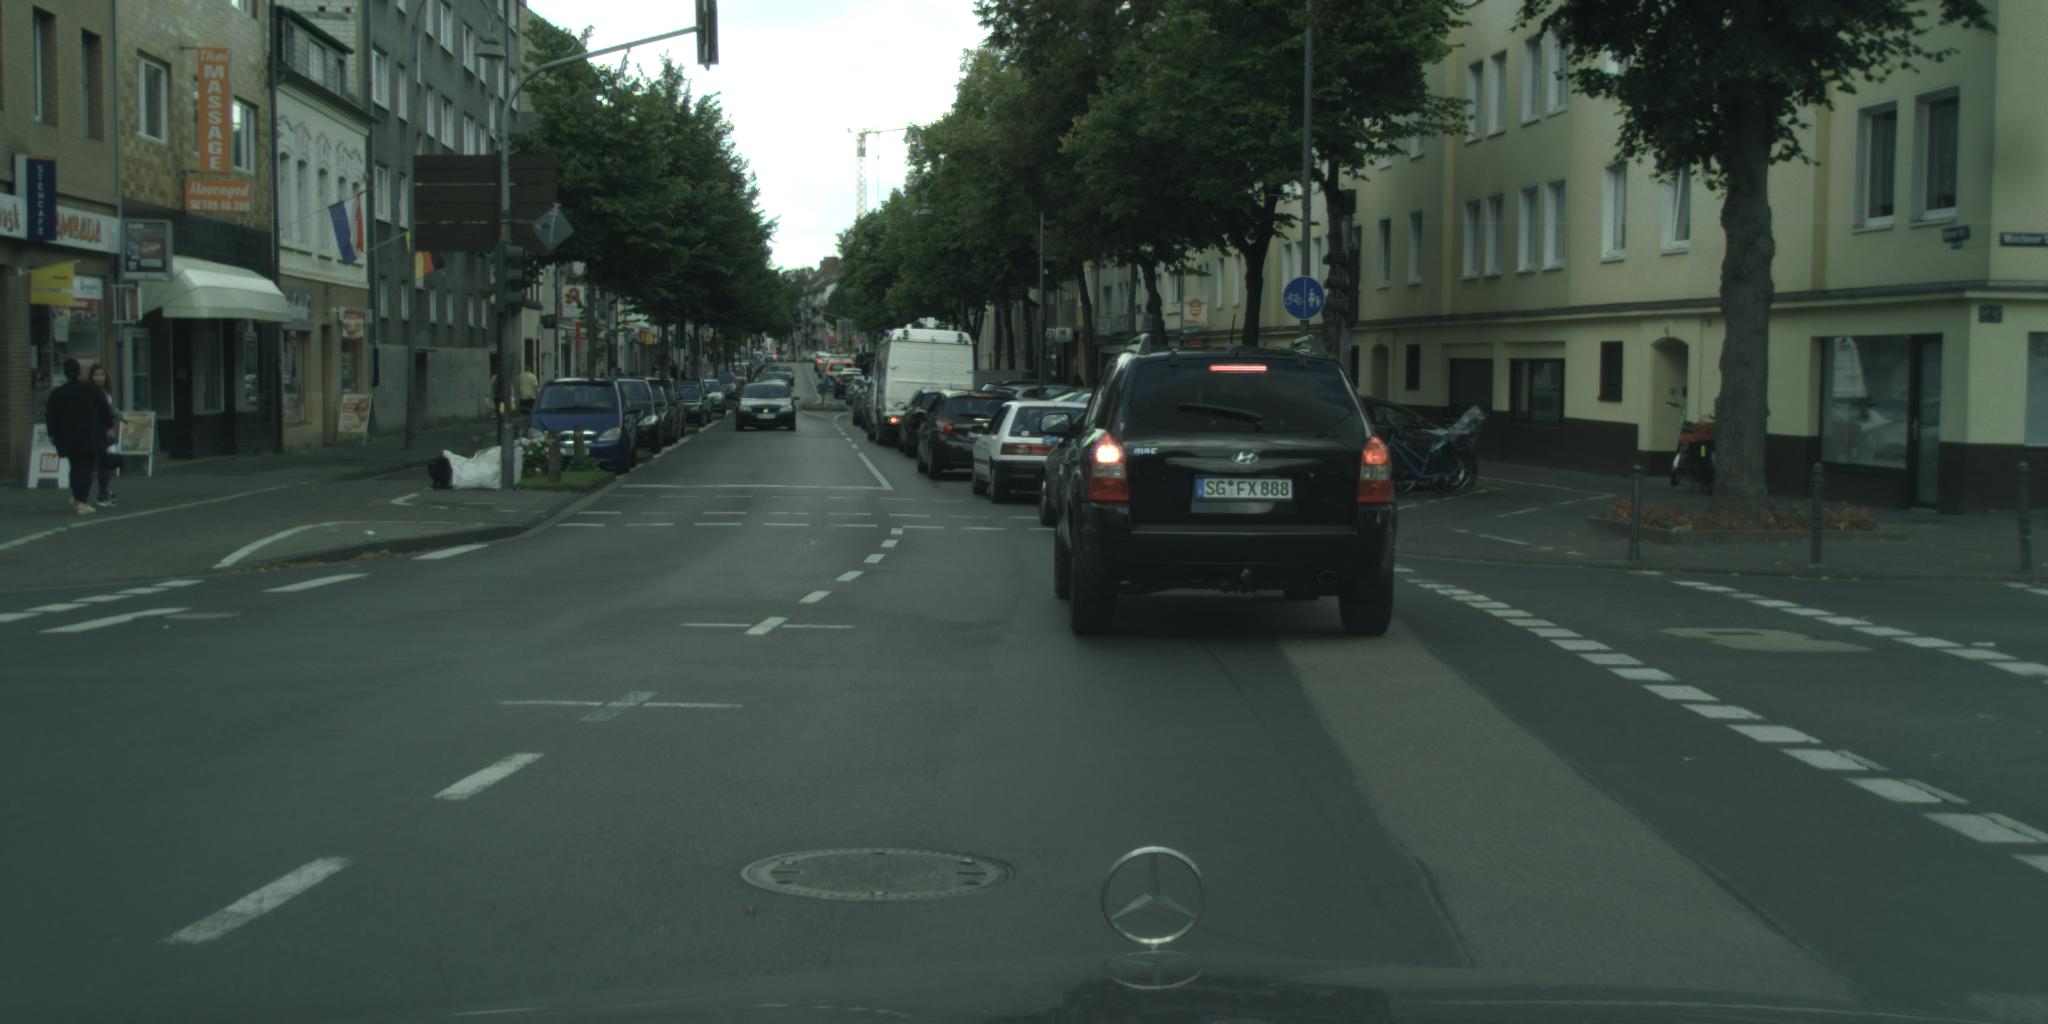
We augment our model training by first using the Cityscapes dataset to train our DCNN model. Designed with the use case of autonomous driving in mind, the finely labelled subset of the Cityscapes dataset contains over 5000 images taken from vehicle-mounted cameras placed in vehicles and sampled across numerous German cities [37]. We convert the Cityscapes dataset by collapsing the original multi-class labels into binary labels for vegetation and non-vegetation. By first training our models on the larger Cityscapes dataset, we increase our training dataset with the aim of increasing our model performance.
Metrics: In addition to Pearson’s correlation coefficient, we propose two evaluation metrics to compare tree cover estimation: mean Intersection-over-Union (mean IoU) for measuring the accuracy of the location of labelled vegetation labels, and Mean Absolute Error (MAE) for measuring the accuracy in estimating overall GVI.
DCNN semantic segmentation: We adopt Zhao. et al’s [38] Pyramid Scene Parsing Network (PSPNet)’s architecture to train a DCNN to segment vertical vegetation pixel labels. We first use pre-trained weights from the original PSPNet trained on the original Cityscapes datasets with its 19 class labels. We then pre-train the network again on the aforementioned transformed Cityscapes dataset with binary labels that classify vertical vegetation. Finally, we train the network on the small labelled GSV dataset itself. We show the qualitative results of the DCNN segmentation model in Figure 1.
DCNN end-to-end learning: We directly estimate GVI with a DCNN model. To conduct end-to-end direct learning of a single GVI value for each image, we adapt He et al’s [39] deep residual network (ResNet) architecture. We first initialize the network with weights that have been pretrained on the ImageNet dataset. We then pre-train the modified ResNet with the transformed Cityscapes dataset and associated true GVI labels, before training on the small labelled GSV dataset.
The lack of an intermediate image segmentation mask makes it difficult to confirm or communicate the features that the DCNN end-to-end model has learned in order to estimate GVI. Selvaraju et al [40] developed Gradient Class Activation Map (Grad-CAM) in order to produce visual explanations for learned features in convolutional layers. We apply Grad-CAM to our DCNN end-to-end model to understand whether our model has learned generalizable features. The qualitative results of applying Grad-CAM to our trained DCNN end-to-end model in Figure 1. We provide more examples of Grad-CAM applied to our trained DCNN end-to-end model in Figure 5.


3 Results and Discussion
| Model | Mean | Mean | Pearson’s | 5%-95% of | Running Time |
|---|---|---|---|---|---|
| IoU | Absolute | Correlation | GVI Estimation | for 10000 | |
| (%) | Error (%) | Coefficient | Error (%) | images (seconds) | |
| Li et al. [29] "threshold | 44.7 | 10.1 | 0.708 | -26.6, 18.7 | 3665 |
| and cluster" | |||||
| DCNN semantic | 61.3 | 7.83 | 0.830 | -20.0, 12,37 | 2064 |
| segmentation | |||||
| DCNN end-to-end | NA | 4.67 | 0.939 | -10.9, 7.97 | 38.9 |
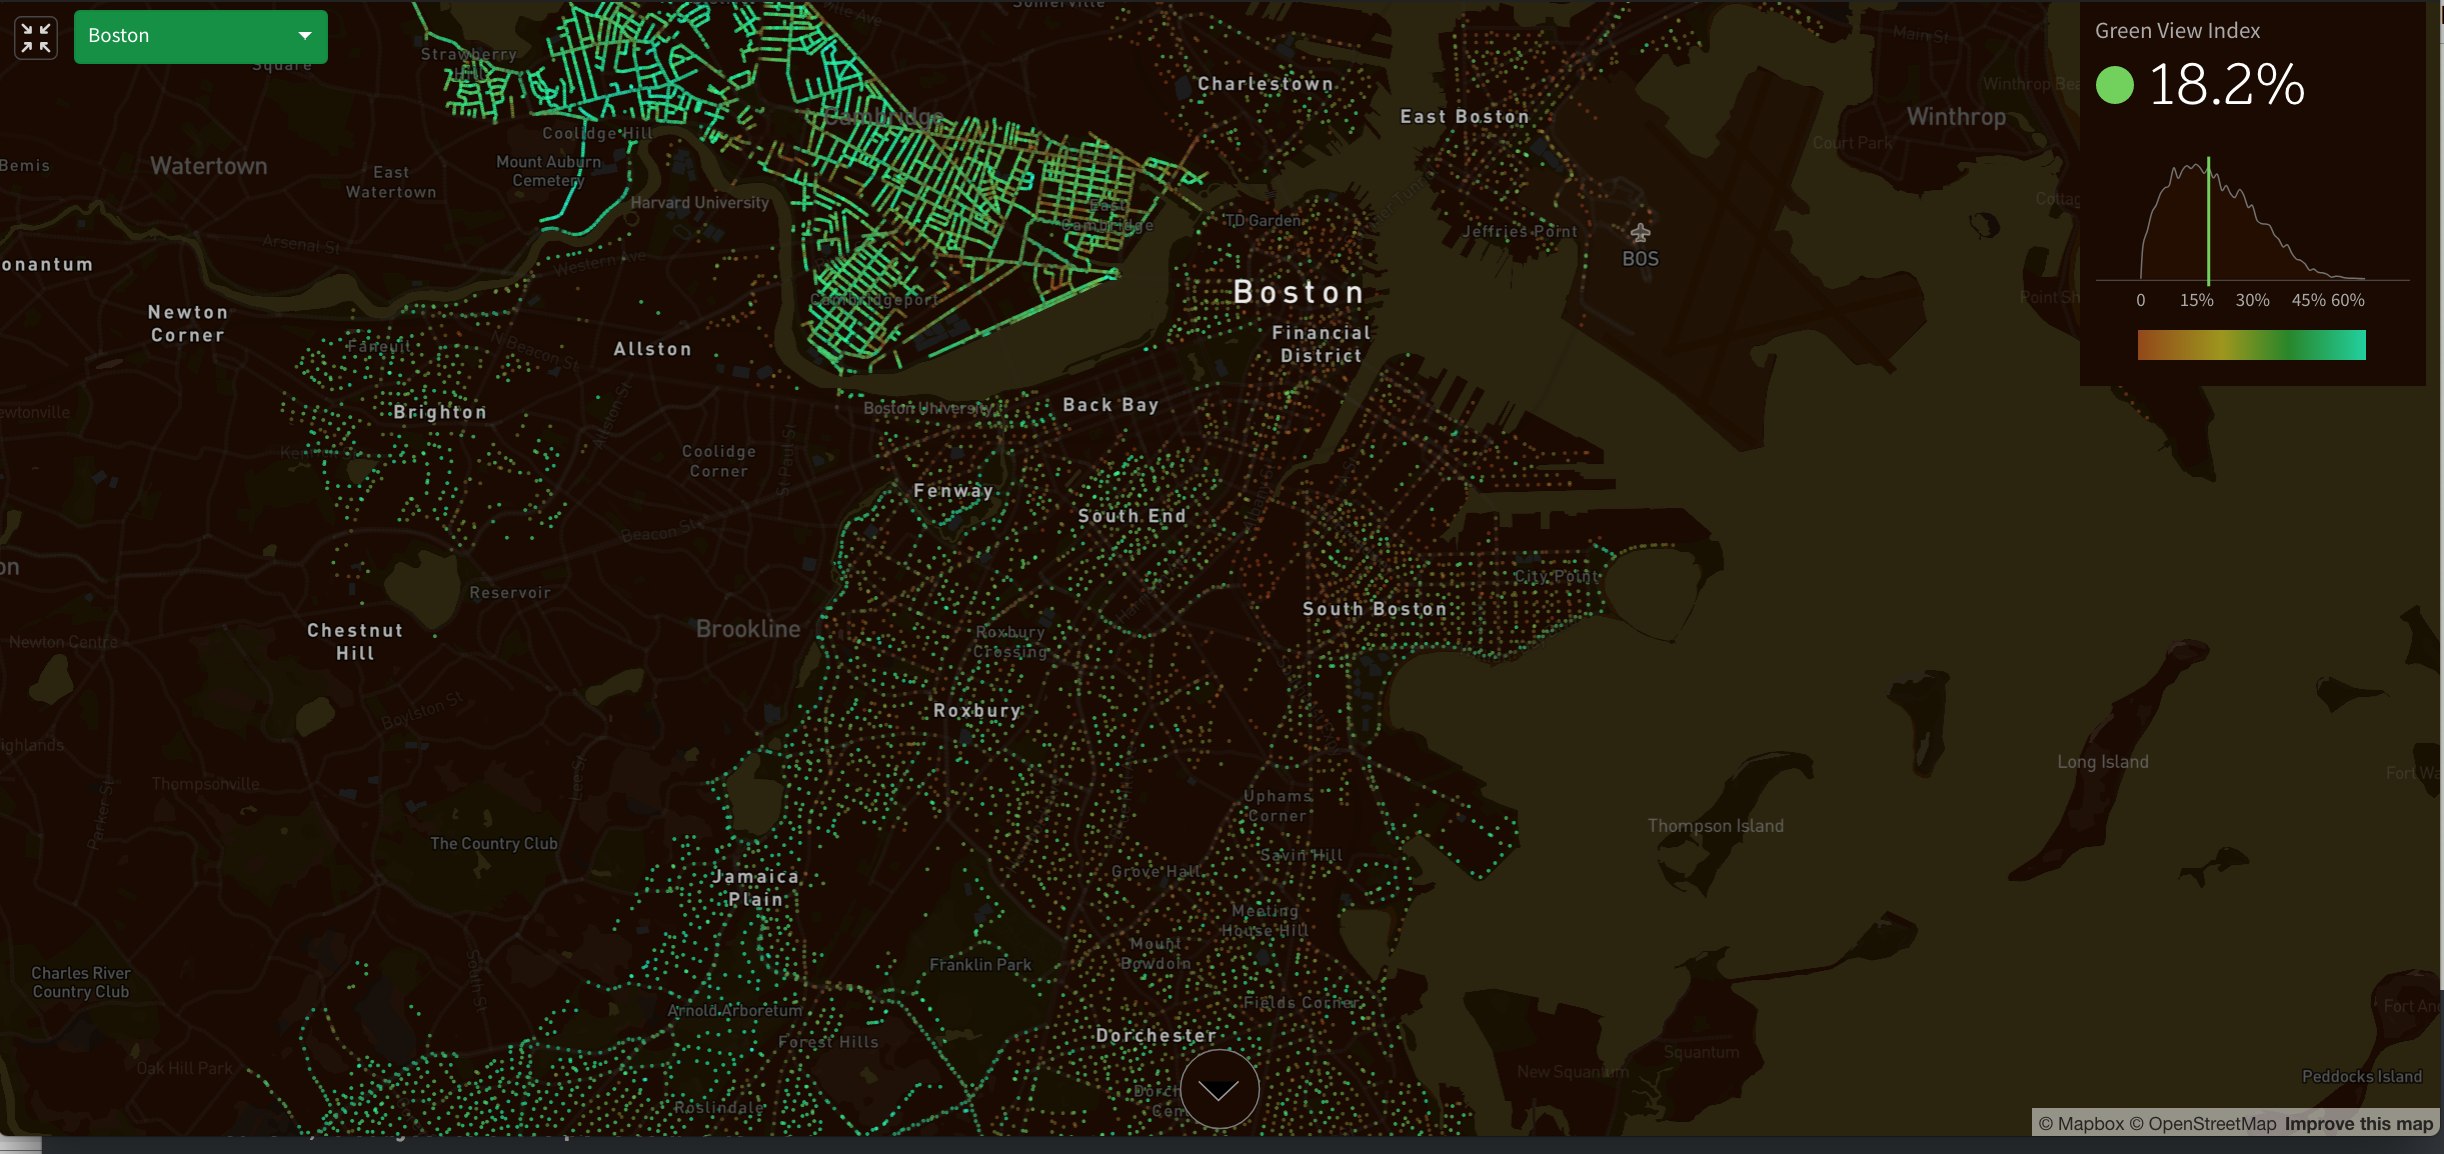
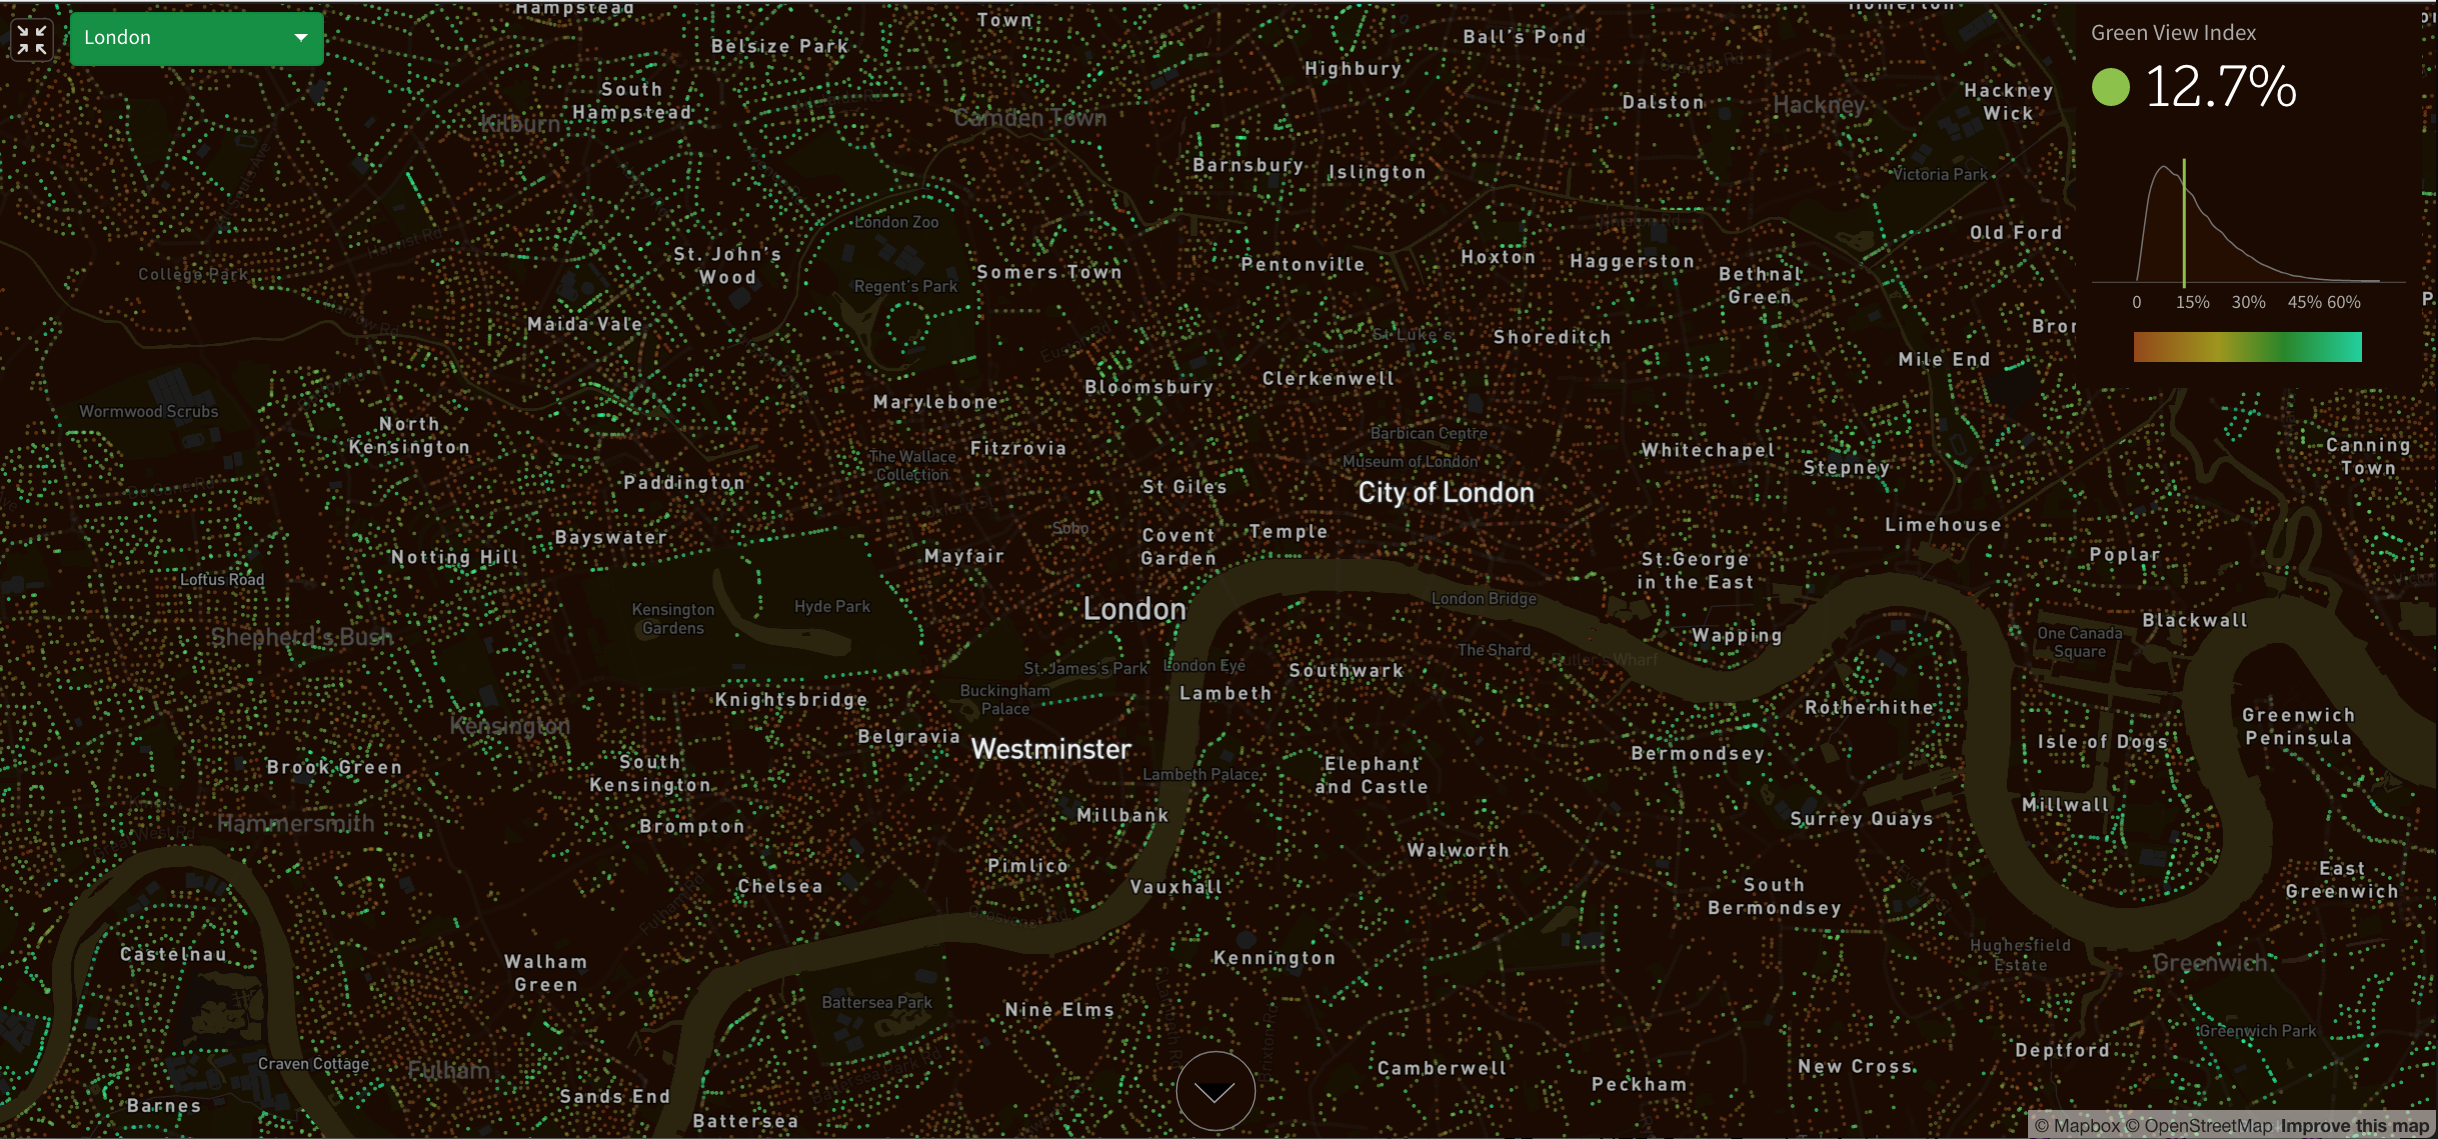
DCNN models perform better than the "threshold and cluster" method across the original Pearson’s correlation coefficient and metrics proposed by this paper. Furthermore, we show that the GVI estimation error 5%-95% bounds are substantially narrower using DCNN models. The DCNN end-to-end model also allows for efficient quantification of GVI. To put this in perspective, the DCNN end-to-end model can process 1 million Google Street View images required to analyze urban greenery in a large city like London in an hour worth’s of running time on a single benchmark machine, whereas the "threshold and cluster" evaluated will require around 4 days. The code and specialized Google Street View dataset are provided online333https://github.com/billcai/treepedia_dl_public for reproducibility and for collaborating public sector agencies to implement.
These improvements in scalability and accuracy of quantifying urban canopy cover already have began to influence public greening policies. With this revised methodology, the Treepedia project444The results of the Treepedia project can be viewed from: http://senseable.mit.edu/treepedia quantified urban canopy cover across 22 cities internationally. Besides widespread and global news coverage[41, 42, 43, 44], the impact of Treepedia project is attested to by public attention from policymakers from Singapore [45], Paris [42], the US Government’s Climate Resilience Toolkit [46] and the World Economic Forum [47].
Acknowledgments
The authors thank all members of the Senseable City Lab Consortium for sponsoring the research of the Senseable City Lab.
References
- Norton et al. [2015] Briony A Norton, Andrew M Coutts, Stephen J Livesley, Richard J Harris, Annie M Hunter, and Nicholas SG Williams. Planning for cooler cities: A framework to prioritise green infrastructure to mitigate high temperatures in urban landscapes. Landscape and urban planning, 134:127–138, 2015.
- Bowler et al. [2010] Diana E Bowler, Lisette Buyung-Ali, Teri M Knight, and Andrew S Pullin. Urban greening to cool towns and cities: A systematic review of the empirical evidence. Landscape and urban planning, 97(3):147–155, 2010.
- Henley [2019] Jon Henley. Climate crisis blamed as temperature records broken in three nations. The Guardian, 2019.
- Climate Change Service [2019] European Commission Climate Change Service. Record-breaking temperatures for june. 2019.
- Kusaka and Kimura [2004] Hiroyuki Kusaka and Fujio Kimura. Coupling a single-layer urban canopy model with a simple atmospheric model: Impact on urban heat island simulation for an idealized case. Journal of the Meteorological Society of Japan. Ser. II, 82(1):67–80, 2004.
- De Abreu-Harbich et al. [2015] Loyde Vieira De Abreu-Harbich, Lucila Chebel Labaki, and Andreas Matzarakis. Effect of tree planting design and tree species on human thermal comfort in the tropics. Landscape and Urban Planning, 138:99–109, 2015.
- Wong and Jusuf [2010] Nyuk Hien Wong and Steve Kardinal Jusuf. Study on the microclimate condition along a green pedestrian canyon in singapore. Architectural Science Review, 53(2):196–212, 2010.
- Yang et al. [2011] Feng Yang, Stephen SY Lau, and Feng Qian. Thermal comfort effects of urban design strategies in high-rise urban environments in a sub-tropical climate. Architectural Science Review, 54(4):285–304, 2011.
- Lee et al. [2016] Hyunjung Lee, Helmut Mayer, and Liang Chen. Contribution of trees and grasslands to the mitigation of human heat stress in a residential district of freiburg, southwest germany. Landscape and Urban Planning, 148:37–50, 2016.
- Chan et al. [2013] Emily YY Chan, William B Goggins, Janice SK Yue, and Poyi Lee. Hospital admissions as a function of temperature, other weather phenomena and pollution levels in an urban setting in china. Bulletin of the World Health Organization, 91:576–584, 2013.
- Michelozzi et al. [2009] Paola Michelozzi, Gabriele Accetta, Manuela De Sario, Daniela D’Ippoliti, Claudia Marino, Michela Baccini, Annibale Biggeri, H Ross Anderson, Klea Katsouyanni, Ferran Ballester, et al. High temperature and hospitalizations for cardiovascular and respiratory causes in 12 european cities. American journal of respiratory and critical care medicine, 179(5):383–389, 2009.
- Michelozzi et al. [2005] Paola Michelozzi, L Bisanti, A Russo, E Cadum, M DeMaria, M D’Ovidio, G Costa, CA Perucci, et al. The impact of the summer 2003 heat waves on mortality in four italian cities. Euro surveillance: bulletin Europeen sur les maladies transmissibles= European communicable disease bulletin, 10(7):11–12, 2005.
- Fouillet et al. [2008] Anne Fouillet, Grégoire Rey, Vérène Wagner, Karine Laaidi, Pascal Empereur-Bissonnet, Alain Le Tertre, Philippe Frayssinet, Pierre Bessemoulin, Françoise Laurent, Perrine De Crouy-Chanel, et al. Has the impact of heat waves on mortality changed in france since the european heat wave of summer 2003? a study of the 2006 heat wave. International journal of epidemiology, 37(2):309–317, 2008.
- Semenza et al. [1996] Jan C Semenza, Carol H Rubin, Kenneth H Falter, Joel D Selanikio, W Dana Flanders, Holly L Howe, and John L Wilhelm. Heat-related deaths during the july 1995 heat wave in chicago. New England journal of medicine, 335(2):84–90, 1996.
- Lin et al. [2009] Shao Lin, Ming Luo, Randi J Walker, Xiu Liu, Syni-An Hwang, and Robert Chinery. Extreme high temperatures and hospital admissions for respiratory and cardiovascular diseases. Epidemiology, pages 738–746, 2009.
- Uejio et al. [2016] CK Uejio, JD Tamerius, J Vredenburg, G Asaeda, DA Isaacs, J Braun, A Quinn, and JP Freese. Summer indoor heat exposure and respiratory and cardiovascular distress calls in new york city, ny, us. Indoor air, 26(4):594–604, 2016.
- Dell et al. [2012] Melissa Dell, Benjamin F Jones, and Benjamin A Olken. Temperature shocks and economic growth: Evidence from the last half century. American Economic Journal: Macroeconomics, 4(3):66–95, 2012.
- Colacito et al. [2016] Riccardo Colacito, Bridget Hoffmann, and Toan Phan. Temperature and growth: a panel analysis of the united states. Technical report, Inter-American Development Bank, 2016.
- Graff Zivin and Neidell [2014] Joshua Graff Zivin and Matthew Neidell. Temperature and the allocation of time: Implications for climate change. Journal of Labor Economics, 32(1):1–26, 2014.
- Burke et al. [2015] Marshall Burke, Solomon M Hsiang, and Edward Miguel. Climate and conflict. Annu. Rev. Econ., 7(1):577–617, 2015.
- Nowak et al. [2006] David J Nowak, Daniel E Crane, and Jack C Stevens. Air pollution removal by urban trees and shrubs in the united states. Urban forestry & urban greening, 4(3-4):115–123, 2006.
- Li et al. [2015a] Xiaojiang Li, Chuanrong Zhang, and Weidong Li. Does the visibility of greenery increase perceived safety in urban areas? evidence from the place pulse 1.0 dataset. ISPRS International Journal of Geo-Information, 4(3):1166–1183, 2015a.
- Jackson [2003] Laura E Jackson. The relationship of urban design to human health and condition. Landscape and urban planning, 64(4):191–200, 2003.
- Lindemann-Matthies and Brieger [2016] Petra Lindemann-Matthies and Hendrik Brieger. Does urban gardening increase aesthetic quality of urban areas? a case study from germany. Urban forestry & urban greening, 17:33–41, 2016.
- Mathieu et al. [2007] Renaud Mathieu, Claire Freeman, and Jagannath Aryal. Mapping private gardens in urban areas using object-oriented techniques and very high-resolution satellite imagery. Landscape and Urban Planning, 81(3):179–192, 2007.
- Thomas et al. [2003] Nancy Thomas, Chad Hendrix, and Russell G Congalton. A comparison of urban mapping methods using high-resolution digital imagery. Photogrammetric Engineering & Remote Sensing, 69(9):963–972, 2003.
- Yang et al. [2009] Jun Yang, Linsen Zhao, Joe Mcbride, and Peng Gong. Can you see green? assessing the visibility of urban forests in cities. Landscape and Urban Planning, 91(2):97–104, 2009.
- of Singapore [2018] Government Technology Agency of Singapore. The inside story of how nparks mapped 500,000 trees in singapore on trees.sg. 2018.
- Li et al. [2015b] Xiaojiang Li, Chuanrong Zhang, Weidong Li, Robert Ricard, Qingyan Meng, and Weixing Zhang. Assessing street-level urban greenery using google street view and a modified green view index. Urban Forestry & Urban Greening, 14(3):675–685, 2015b.
- Yu et al. [2019] Xinyang Yu, Gengxing Zhao, Chunyan Chang, Xiujie Yuan, and Fang Heng. Bgvi: A new index to estimate street-side greenery using baidu street view image. Forests, 10(1):3, 2019.
- Long and Liu [2017] Ying Long and Liu Liu. How green are the streets? an analysis for central areas of chinese cities using tencent street view. PloS one, 12(2):e0171110, 2017.
- Dong et al. [2018] Rencai Dong, Yonglin Zhang, and Jingzhu Zhao. How green are the streets within the sixth ring road of beijing? an analysis based on tencent street view pictures and the green view index. International journal of environmental research and public health, 15(7):1367, 2018.
- Li et al. [2015c] Xiaojiang Li, Chuanrong Zhang, Weidong Li, Yulia A Kuzovkina, and Daniel Weiner. Who lives in greener neighborhoods? the distribution of street greenery and its association with residents’ socioeconomic conditions in hartford, connecticut, usa. Urban Forestry & Urban Greening, 14(4):751–759, 2015c.
- Zhang and Dong [2018] Yonglin Zhang and Rencai Dong. Impacts of street-visible greenery on housing prices: evidence from a hedonic price model and a massive street view image dataset in beijing. ISPRS International Journal of Geo-Information, 7(3):104, 2018.
- Lu et al. [2018] Yi Lu, Chinmoy Sarkar, and Yang Xiao. The effect of street-level greenery on walking behavior: Evidence from hong kong. Social Science & Medicine, 208:41–49, 2018.
- Cai et al. [2018] Bill Yang Cai, Xiaojiang Li, Ian Seiferling, and Carlo Ratti. Treepedia 2.0: applying deep learning for large-scale quantification of urban tree cover. In 2018 IEEE International Congress on Big Data (BigData Congress), pages 49–56. IEEE, 2018.
- Cordts et al. [2016] Marius Cordts, Mohamed Omran, Sebastian Ramos, Timo Rehfeld, Markus Enzweiler, Rodrigo Benenson, Uwe Franke, Stefan Roth, and Bernt Schiele. The cityscapes dataset for semantic urban scene understanding. In Proceedings of the IEEE conference on computer vision and pattern recognition, pages 3213–3223, 2016.
- Zhao et al. [2017] Hengshuang Zhao, Jianping Shi, Xiaojuan Qi, Xiaogang Wang, and Jiaya Jia. Pyramid scene parsing network. In IEEE Conf. on Computer Vision and Pattern Recognition (CVPR), pages 2881–2890, 2017.
- He et al. [2016] Kaiming He, Xiangyu Zhang, Shaoqing Ren, and Jian Sun. Deep residual learning for image recognition. In Proceedings of the IEEE conference on computer vision and pattern recognition, pages 770–778, 2016.
- Selvaraju et al. [2016] Ramprasaath R Selvaraju, Michael Cogswell, Abhishek Das, Ramakrishna Vedantam, Devi Parikh, and Dhruv Batra. Grad-cam: Visual explanations from deep networks via gradient-based localization. arXiv preprint arXiv:1610.02391, 2016.
- Furfaro [2017] Hannah Furfaro. New tool lets cities see where trees are needed. Wall Street Journal, 2017.
- Adesina [2018] Precious Adesina. How green is your city? in paris, the answer is not green enough. Time, 2018.
- Lewis [2017] Dyani Lewis. Stressed street trees: mapping the urban forests to save them – and us. The Guardian, 2017.
- Reynolds [2017] Matt Reynolds. This algorithm has found the greenest city in the world. WIRED, 2017.
- Lee [2018] Hsien Loong Lee. Facebook, 2018. URL https://www.facebook.com/leehsienloong/posts/1807064156022949/.
- ust [2018] Treepedia. U.S. Climate Resilience Toolkit, 2018. URL https://toolkit.climate.gov/tool/treepedia.
- Garfield [2018] Leanna Garfield. These are the 19 cities with the most trees. World Economic Forum, 2018. URL https://www.weforum.org/agenda/2018/03/the-12-cities-with-the-most-trees-around-the-world.
Appendix: Treepedia visualization
Appendix: Common errors of "threshold and cluster" method


Appendix: Dataset visualization


Appendix: Grad-CAM visualizations


