Spontaneous Crystallization in Systems of Binary Hard Sphere Colloids
Abstract
Computer simulations of the fluid-to-solid phase transition in the hard sphere system were instrumental for our understanding of crystallization processes. But while colloid experiments and theory have been predicting the stability of several binary hard sphere crystals for many years, simulations were not successful to confirm this phenomenon. Here, we report the growth of binary hard sphere crystals isostructural to Laves phases, AlB2, and NaZn13 in simulation directly from the fluid. We analyze particle kinetics during Laves phase growth using event-driven molecular dynamics simulations with and without swap moves that speed up diffusion. The crystallization process transitions from nucleation and growth to spinodal decomposition already deep within the fluid-solid coexistence regime. Finally, we present packing fraction–size ratio state diagrams in the vicinity of the stability regions of three binary crystals.
Introduction.—Hard spheres are arguably one of the simplest particle model. Their crystallization is a classic example of a phase transition discovered by computer simulation Alder and Wainwright (1957); Wood and Jacobson (1957); Alder and Wainwright (1960). A prediction of the model is the spontaneous ordering of concentrated suspensions of nearly hard colloidal spheres Pusey and van Megen (1986). Generalizations are mixtures of spheres with different sizes such that small spheres fit between large spheres to stabilize binary crystals. Early experimental realizations are binary crystals isostructural to AlB2 and NaZn13 found in natural opal gems Sanders and Murray (1978); Sanders (1980); Murray and Sanders (1980). More recent experiments Bartlett et al. (1990, 1992); Hunt et al. (2000); Schofield et al. (2005); Schaertl et al. (2018) and theory Eldridge et al. (1993a, b, c); Cottin and Monson (1993, 1995); Trizac et al. (1997); Hynninen et al. (2009); Dijkstra (2014) predicted additional ones. By now four binary crystals have been proposed in the hard sphere phase diagram near the solidus line: NaCl (), AlB2 (), NaZn13 (), and Laves MgCu2 and MgZn2 (). This list identifies binary crystals by their atomic prototype and contains the reported ranges for size ratio , where and are the diameters of small and large spheres, respectively. Additional binary crystals, such as CsCl Schofield et al. (2005), are believed to be metastable or appear only at high packing fraction as densest packings O’Toole and Hudson (2011); Filion and Dijkstra (2009); Hopkins et al. (2012).
Equal-sized hard spheres crystallize rapidly into the face-centered-cubic (fcc) crystal or stacking variants thereof in simulation, and they have been an ideal testing ground for studying fundamental aspects of crystal nucleation and growth Auer and Frenkel (2001); Punnathanam and Monson (2006); Ni et al. (2011). It was thus expected that simulations of binary hard sphere fluids produce binary crystals in a similar manner. This has not been the case. To date, the only binary hard sphere crystal growth reported in simulation is NaCl Trizac et al. (1997). That report is more than 20 years old and the crystals grown are highly defective with many vacancies of the small spheres Vermolen et al. (2009); Filion et al. (2011). AlB2 so far required a seeding procedure to grow Bommineni and Punnathanam (2017). Laves phases and NaZn13 formed from size-disperse sphere fluids only with the assistance of Monte Carlo swap or resize moves Lindquist et al. (2018); Bommineni et al. (2019) and nearly hard spheres where particle softness enhances crystallization Dasgupta et al. (2020). The absence of binary hard sphere crystallization in simulation has been puzzling. Here, we report the spontaneous formation of AlB2, NaZn13, and Laves phases in simulation directly from the fluid. Our results demonstrate that binary hard sphere crystals grow robustly and reproducibly in standard event-driven molecular dynamics (EDMD) given only sufficient simulation time and large enough system size. Surprisingly, the Laves phase crystallizes via nucleation and growth as well as via spinodal decomposition. We find that the bottleneck for binary crystal growth is diffusion in the dense fluid.
Growth of Laves phase.—Laves phases are of relevance for materials scientists because they are the most common binary intermetallic compounds Steurer and Dshemuchadse (2016) and have interesting photonic properties when self-assembled from colloids Hynninen et al. (2007). For this reason, we focus on their growth first. We speed up crystallization in an initial test by combining EDMD simulations with swap moves Berthier et al. (2016); Wyart and Cates (2017); Lindquist et al. (2018); Coslovich et al. (2018); Brito et al. (2018); Bommineni et al. (2019); Berthier et al. (2019); Mihalkovič and Widom (2020). Particle pairs are attempted to be swapped as a Monte Carlo move at every collision Sup . Gibbs free-energy calculations Hynninen et al. (2009) guide us to the parameter set , which lies in the fluid-Laves coexistence regime slightly below the solidus line. We initialize a simulation at composition LS2 in the fluid state and run it at isochoric (constant volume) conditions with periodic boundaries. The ordering progress of our system is monitored by recording reduced pressure over reduced simulation time . Here, with volume of the large sphere is a unit of pressure and is a unit of time.
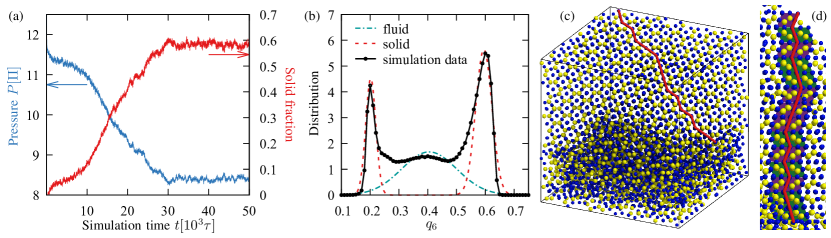
Pressure evolution is shown as blue curve in Fig. 1(a). After a rapid initial relaxation of the fluid over time , pressure decreases slowly while the system starts ordering, then gradually faster, until it reaches a constant slope. Crystalline order in the system is well characterized by the local bond-orientational order parameter Steinhardt et al. (1983); van Meel et al. (2012); Sup . The distribution of values in the system shows pronounced peaks (Fig. 1(b)), which can be assigned to the fluid (broad central peak) and the two particle species in the solid (narrow outer peaks). We fit the peaks to compute solid fraction. Evolution of solid fraction (red curve in Fig. 1(a)) essentially mirrors the evolution of pressure and increases in sync with the pressure drop. The slopes of both curves come to an abrupt halt at , indicating the end of the crystallization process. After this time, the system reached an equilibrium of about equal amounts of fluid and solid in coexistence.
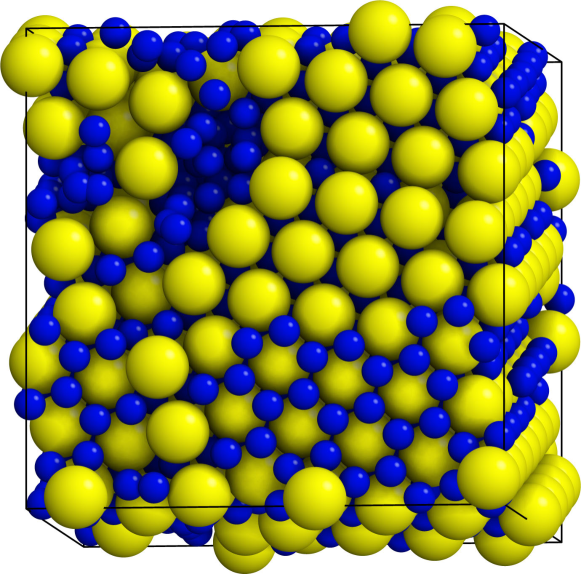
A snapshot of the equilibrated system viewed along a twofold symmetry axis (Fig. 1(c)) confirms the coexistence. In projection, particles are arranged into columns in the crystal (top part) and are disordered in the fluid (bottom part). The pattern of the crystal in this projection consists of straight rows of small spheres separated by zigzag rows of pairs of large spheres alternating with single small spheres. Such a pattern is characteristic of Laves phases. We extract the stacking sequence of the Laves phase as indicated by the red line in Fig. 1(c,d). Hexagonal Laves MgZn2 (C14) has ABA stacking, which gives a zigzag line. Cubic Laves MgCu2 (C15) on the other hand has ABC stacking, which results in a straight line. We observe both straight and zigzag segments along the red line, demonstrating that our Laves phase is a stacking of C14 slabs and C15 slabs. In this sense, Laves phase crystallization in our binary system resembles crystallization of identical spheres, which forms stacking variants of fcc.
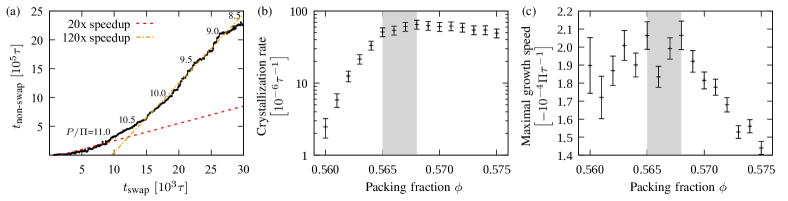
Laves phase crystallization pathway.—Our simulation in Fig. 1 established Laves phase growth from the binary hard sphere fluid using swap moves rather easily. To show reproducibility and generality, we perform ten swap simulations and ten nonswap simulations at the same parameters and with similar initial conditions. Well-ordered Laves phases form in all 20 simulations. Both simulation methods lead to similar pressure-time pathways (Fig. S1), even though the speed in which these pathways are traversed is different. As expected, swap simulations are significantly faster in crystallizing the binary fluid. The speed-up is not constant but increases from to (Fig. 2(a)), demonstrating that the efficiency of swap moves improves over time. Indeed, the acceptance probability of swap moves increases over the same time window (Fig. S2). This indicates an increase in available free volume in the fluid and explains the higher speed=up toward the end of the simulation. Swap moves primarily enhance diffusion. We conclude that particles are integrated faster into the crystal than they diffuse through the fluid. Therefore, diffusion in the fluid is the bottleneck process for Laves phase growth.
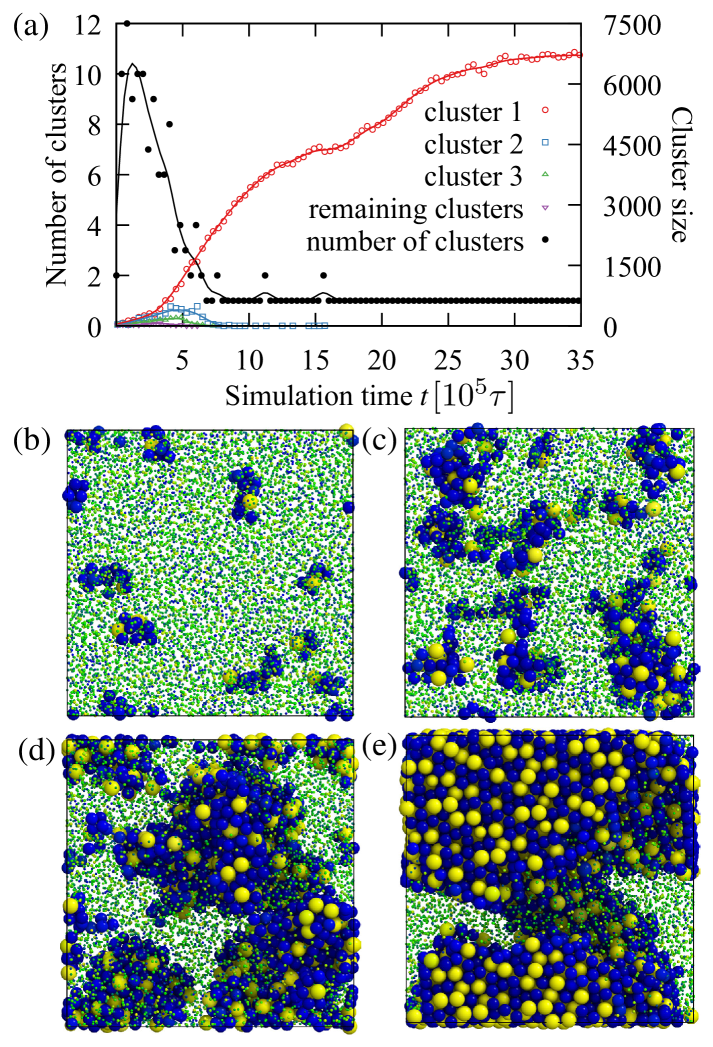
We analyze one exemplary nonswap simulation pathway in more detail by tracking crystalline clusters. Fig. 3(a) shows the evolution of the number of clusters and the size of the three largest clusters. A particle is identified as solid-like using a cut-off (Fig. S3). A solid-like particle belongs to a cluster if it has more than five solid-like particles within distance . Already right at the start of the simulation, ten clusters are detected, indicating there is a very small or negligible free-energy barrier for the Laves phase to form. The clusters grow independently, and their number decreases when they merge, which is also directly apparent in simulation snapshots at increasing times (Fig. 3(b-e)). After this time, the solid consolidates by removing grain boundaries and transforms its polycrystalline state into a Laves phase single crystal. A video of the growth process for the time window is contained as Supplemental Material. Overall, Laves phase growth in this simulation proceeds not as predicted by classical nucleation theory but as expected from spinodal decomposition. This is surprising given that our simulation parameters are chosen below the solidus line in the coexistence regime (Fig. S4).
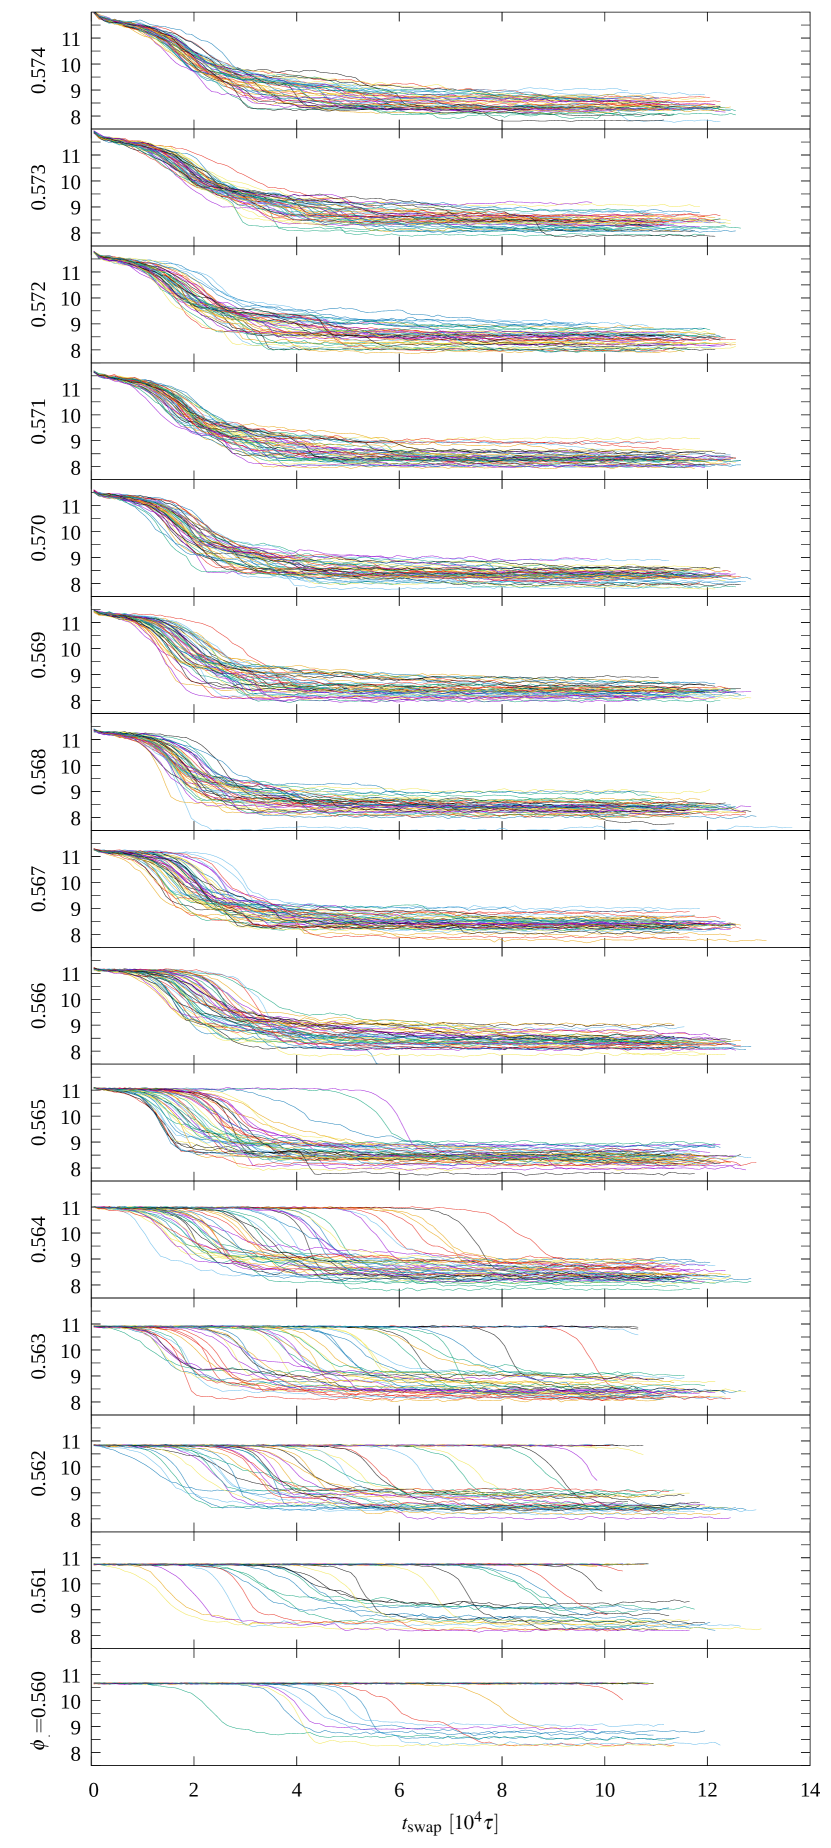
Our results so far do not exclude a nucleation and growth regime at lower packing fraction closer to the liquidus line. We analyze the type of crystallization transition by performing swap simulations across the packing fraction range . Indeed, the crystallization rate grows rapidly at as expected for nucleation and growth and then saturates (Fig. 2(b)). At the same time, the maximal crystal growth speed decays from a plateau for as expected for spinodal decomposition (Fig. 2(c)). Together, our analysis indicates a transition from nucleation-and-growth behavior with stochastic onset of crystallization to spinodal-decomposition behavior where crystallization pathways collapse. This transition is also apparent directly in the evolution of pressure curves (Fig. S5).
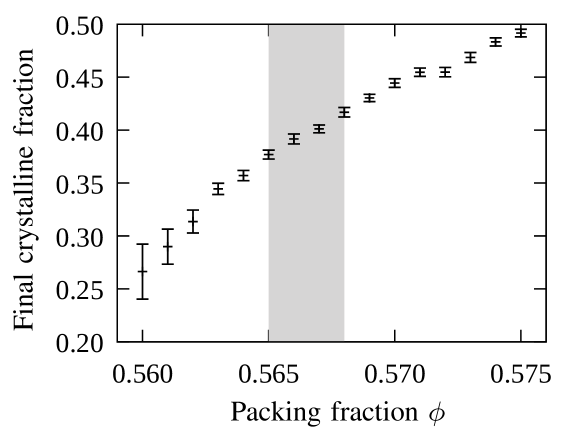
Binary crystal state diagrams.—So far, we investigated binary crystal growth for a specific set of parameters in detail. Now, we vary the packing fraction and size ratio more systematically to obtain full state diagrams. We focus on the compositions LS2 and LS13, for which binary crystals have been predicted. Simulations run for a total time of . Simulations that crystallize undergo their phase transition completely and fully grow into well-ordered crystals.
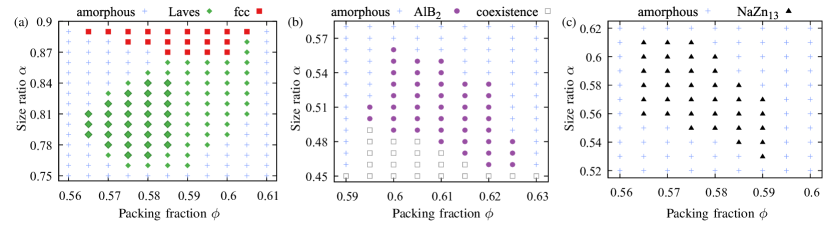
We start with composition LS2. Fig. 4(a) shows the state diagram in the vicinity of Laves phases and Fig. 4(b) the state diagram in the vicinity of AlB2. Both binary crystals form over extended parameter regions. The size ratio range for the Laves phases, , and the lower limit of size ratio for AlB2, , agree with predicted values Hynninen et al. (2009); Eldridge et al. (1993a). For , the system remains amorphous. For , the binary fluid phase separates into coexisting NaCl and AlB2 solids. For , the fluid forms the substitutionally disordered fcc solid.
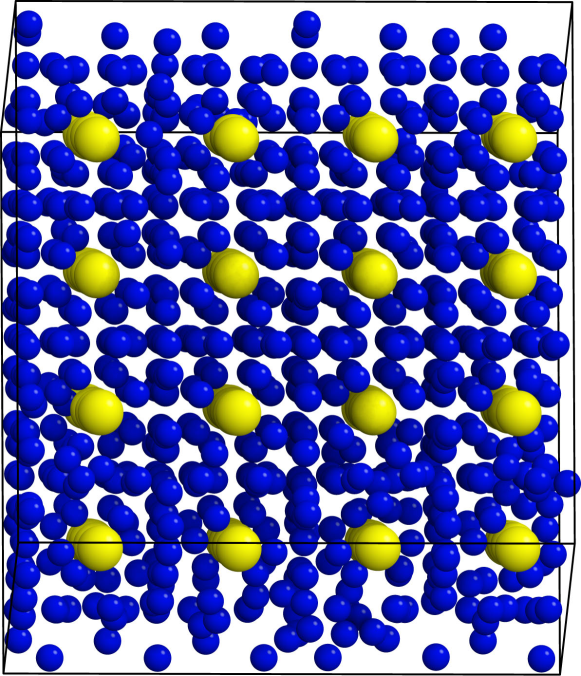
Results for composition LS13 are shown in Fig. 4(c). The binary crystal found at this composition, NaZn13, is a complex arrangement of large spheres on a simple cubic lattice and icosahedra made from 13 small spheres at body-centered positions. NaZn13 forms in the range as predicted by free-energy calculation Eldridge et al. (1993c, b). The range of packing fractions, for which crystallization is observed, is for all three binary crystals about 3%. Growth of AlB2 is more difficult and leads to more defects than growth of Laves phases and NaZn13, possibly because it occurs at higher packing fractions.
Discussion and conclusions.—Our findings demonstrate that binary crystal growth from the binary hard sphere fluid is robust and reproducible. Why then have similar binary hard sphere crystals not been seen in simulation before? We are not sure. But we can list a few arguments that indicate doing so is not necessarily trivial. In simulations, growth without swap moves requires more than two weeks of continuous simulation with today’s fastest processors at the right parameters to obtain well-defined crystals that are easy to identify. Our longest simulations ran for more than four weeks. While this is not a particularly long simulation time, it clearly exceeds typical hard sphere simulation times. EDMD simulations cannot be parallelized efficiently. Furthermore, many simulations in the past used Monte Carlo simulation instead of EDMD, which slows down the growth process further by about one order of magnitude Klement and Engel (2019).
We map our simulations on two experimental conditions: magnesium atoms and polystyrene colloids. The unit of time for magnesium atoms at a temperature slightly below the solidus line for hexagonal Laves MgZn2, , corresponds to Sup . An atom takes on average about the time to move over its diameter. We estimate that Laves phase crystallization requires an experimental time of to form nanocrystalline grains. Such times are easily reachable. This explains why Laves phases are ubiquitous in alloys. Colloidal particles on the other hand are much larger and slowed down by drag in solution. It is possible to account for most of the effects of hydrodynamic interactions by rescaling the timescale for nucleation and growth by the long-time diffusion coefficient Tateno et al. (2019). We use the Stokes-Einstein equation to estimate for colloids with diameter suspended in water Sup . Only crystallization of identical hard sphere colloids into fcc has been achieved with such large particles as it is about times faster than Laves phase crystallization, even though the softness of charged spheres seems to help obtain a variety of binary structures Hachisu and Yoshimura (1980); Bartlett and Campbell (2005); Leunissen et al. (2005); LaCour et al. (2019). Crystallization speeds up proportionally to with shrinking colloid diameter . Experiments with colloids need to rest for months at the optimal condition to form Laves phases Schaertl et al. (2018), which corresponds to an equilibration time of to to grow macroscale crystals. Even smaller nanoparticles crystallize rather easily into binary superlattices Shevchenko et al. (2005, 2006); Evers et al. (2010); Coropceanu et al. (2019).
There have been concerns that swaps alter phase transformation pathways because they preferentially accelerate specific aspects of kinetics. At least for the processes investigated here, crystallization of hard sphere Laves phases, trajectories with and without swap are indistinguishable. If these observations are confirmed in more systems, then swaps Berthier et al. (2016); Wyart and Cates (2017); Lindquist et al. (2018); Coslovich et al. (2018); Brito et al. (2018); Bommineni et al. (2019); Berthier et al. (2019); Mihalkovič and Widom (2020) can become a standard tool for simulating mixtures, in particular those with small size difference. Swap methods have the potential to speed up such simulations by orders of magnitude. Finally, our findings add to the growing list of recent observations of crystallization processes in model systems that were once believed to be good glass formers Pedersen et al. (2018); Coslovich et al. (2018); Bommineni et al. (2019); Ingebrigtsen et al. (2019); Dasgupta et al. (2020). Knowledge of crystal structures competing with the amorphous state, as we report here for the binary hard sphere fluid, is important to ensure that the analysis of local order and particle dynamics Robinson et al. (2019); Marín-Aguilar et al. (2020); Campo and Speck (2020) in such model systems intended for glasses is not affected by hidden crystallization transitions.
In conclusion, this work constitutes the first systematic simulation study of binary crystallization across composition and thermodynamic parameters. Our finding of a transition from nucleation and growth to spinodal decomposition inside the fluid-solid coexistence demonstrates a clear difference of the crystallization behavior of binary hard sphere mixtures as compared to the crystallization behavior of identical hard spheres.
Acknowledgements.
Funding by Deutsche Forschungsgemeinschaft through Project No. EN 905/2-1, support from the Central Institute for Scientific Computing, the Interdisciplinary Center for Functional Particle Systems, and computation resources provided by the Erlangen Regional Computing Center are gratefully acknowledged.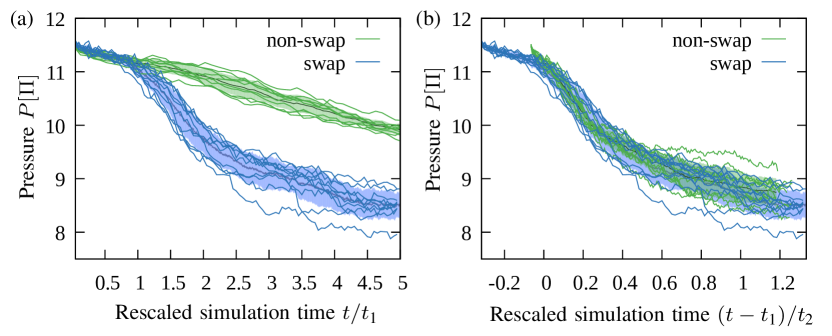

I Appendix A: Simulation method
Binary hard spheres are simulated in event-driven molecular dynamics (EDMD) with and without swap as described in recent work Bommineni et al. (2019). Setting the mass equal for all particles simplifies momentum conservation and has no effect on the phase behavior of the system. Dimensionless pressure is computed as Alder and Wainwright (1960)
| (1) |
from the number of particle collisions during a simulation time window . is the product of the Boltzmann constant and the temperature .
II Appendix B: Detection of crystalline clusters
Crystalline clusters growing from the binary hard sphere fluid are tracked with local bond-orientational order parameters Steinhardt et al. (1983). We compute the -dimensional complex vectors
| (2) |
Here, is the number of neighbors of particle , are spherical harmonics coefficients for neighboring particles , and is the separation vector. Nearest neighbor particles are identified using the parameter free solid-angle based nearest-neighbor (SANN) algorithm van Meel et al. (2012). Local order parameters are defined as
| (3) |
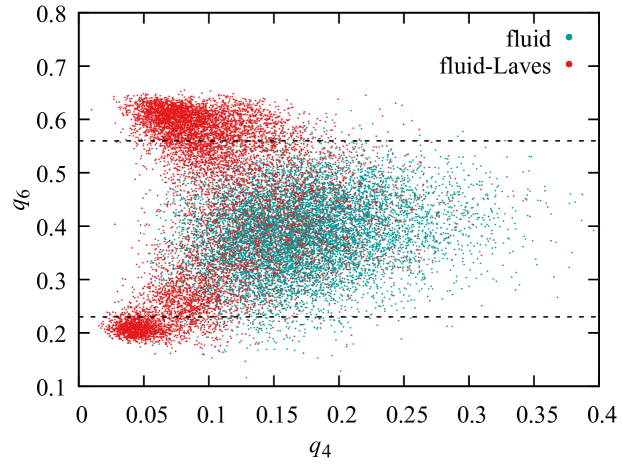
Fig. S2 shows the scatter plot of and for all particles in a fluid and in a fluid-solid coexistence of Fig. 1. alone is sufficient to detect whether a small or large particle is in a fluid-like environment or a solid-like environment. Particles are identified as solid-like if or (indicated by dashed line in Fig. S2). Finally, clusters are extracted by grouping solid-like particle with more than five solid-like neighboring particles within a cut-off distance .
III Appendix C: Mapping simulations to experiments
We perform a highly simplistic mapping of our simulation trajectories to two experimental situations, magnesium atoms and polystyrene colloids in water. For magnesium atoms, we assume ballistic motion between collisions and use the van der Waals radius and mass of a magnesium atom and a temperature slightly below the solidus line for hexagonal Laves MgZn2, , to calculate
| (4) | |||||
| (5) |
Furthermore, from the Maxwell-Boltzmann distribution we know that the average atom velocity is
| (6) |
In other words, the atom takes on average about the time to move over its diameter under the assumption of ballistic motion.
For polystyrene colloids with diameter in water, we use room temperature to calculate as before . The assumption of ballistic motion is clearly not valid for colloidal particles in solution. To compensate for diffusion in solution, we use the relation for the mean squared displacement and the Stokes-Einstein equation for the diffusion coefficient,
| (7) |
We assume that particles move diffusively between collisions and average the slowdown from diffusion over all collisions c. This means time is replaced by the average time between two successive collisions, , and mean squared displacement is replaced by the average squared distance the particle moves between two successive collisions, . We then obtain an estimate for the effective unit of time as
| (8) |
If we use the viscosity of water , then . From the analysis of collisions in the EDMD simulation shown in Fig. 3, we obtain in the fluid , and in the fluid-solid coexistence , . The unit of time is thus estimated in both cases to be
| (9) |
For comparison, the (much more incorrect) assumption of ballistic motion applied to polystyrene colloids gives a significantly smaller unit of time,
| (10) |
Here, we used the density of polystyrene . The crude estimate outlined above suggests that diffusion of the colloidal particles in solution slows down crystallization kinetics by up to three orders of magnitude.
References
- Alder and Wainwright (1957) B. J. Alder and T. E. Wainwright, “Phase Transition for a Hard Sphere System,” J. Chem. Phys. 27, 1208–1209 (1957).
- Wood and Jacobson (1957) W. W. Wood and J. D. Jacobson, “Preliminary Results from a Recalculation of the Monte Carlo Equation of State of Hard Spheres,” J. Chem. Phys. 27, 1207–1208 (1957).
- Alder and Wainwright (1960) B. J. Alder and T. E. Wainwright, “Studies in molecular dynamics. II. Behavior of a small number of elastic spheres,” J. Chem. Phys. 33, 1439–1451 (1960).
- Pusey and van Megen (1986) P. N. Pusey and W. van Megen, “Phase behaviour of concentrated suspensions of nearly hard colloidal spheres,” Nature 320, 340–342 (1986).
- Sanders and Murray (1978) J. V. Sanders and M. J. Murray, “Ordered arrangements of spheres of two different sizes in opal,” Nature 275, 201–203 (1978).
- Sanders (1980) J. V. Sanders, “Close-packed structures of spheres of two different sizes I. Observations on natural opal,” Philos. Mag. A 42, 705–720 (1980).
- Murray and Sanders (1980) M. J. Murray and J. V. Sanders, “Close-packed structures of spheres of two different sizes II. The packing densities of likely arrangements,” Philos. Mag. A 42, 721–740 (1980).
- Bartlett et al. (1990) P. Bartlett, R. H. Ottewill, and P. Pusey, “Freezing of binary mixtures of colloidal hard spheres,” J. Chem. Phys. 93, 1299–1312 (1990).
- Bartlett et al. (1992) P. Bartlett, R. H. Ottewill, and P. N. Pusey, “Superlattice formation in binary mixtures of hard-sphere colloids,” Phys. Rev. Lett. 68, 3801–3804 (1992).
- Hunt et al. (2000) N. Hunt, R. Jardine, and P. Bartlett, “Superlattice formation in binary mixtures of hard-sphere colloids,” Phys. Rev. E 62, 900–913 (2000).
- Schofield et al. (2005) A. B. Schofield, P. N. Pusey, and P. Radcliffe, “Stability of the binary colloidal crystals AB2 and AB13,” Phys. Rev. E 72, 031407 (2005).
- Schaertl et al. (2018) N. Schaertl, D. Botin, T. Palberg, and E. Bartsch, “Formation of Laves phases in buoyancy matched hard sphere suspensions,” Soft Matter 14, 5130–5139 (2018).
- Eldridge et al. (1993a) M. D. Eldridge, P. A. Madden, and D. Frenkel, “A computer simulation investigation into the stability of the AB2 superlattice in a binary hard sphere system,” Mol. Phys. 80, 987–995 (1993a).
- Eldridge et al. (1993b) M. D. Eldridge, P. A. Madden, and D. Frenkel, “Entropy-driven formation of a superlattice in a hard-sphere binary mixture,” Nature 365, 35–37 (1993b).
- Eldridge et al. (1993c) M. Eldridge, P. Madden, and D. Frenkel, “The stability of the AB13 crystal in a binary hard sphere system,” Mol. Phys. 79, 105–120 (1993c).
- Cottin and Monson (1993) X. Cottin and P. A. Monson, “A cell theory for solid solutions: Application to hard sphere mixtures,” J. Chem. Phys. 99, 8914–8921 (1993).
- Cottin and Monson (1995) X. Cottin and P. A. Monson, “Substitutionally ordered solid solutions of hard spheres,” J. Chem. Phys. 102, 3354–3360 (1995).
- Trizac et al. (1997) E. Trizac, M. D. Eldridge, and P. A. Madden, “Stability of the AB crystal for asymmetric binary hard sphere mixtures,” Mol. Phys. 90, 675–678 (1997).
- Hynninen et al. (2009) A. P. Hynninen, L. Filion, and M. Dijkstra, “Stability of LS and LS2 crystal structures in binary mixtures of hard and charged spheres,” J. Chem. Phys. 131, 064902 (2009).
- Dijkstra (2014) M. Dijkstra, “Entropy-Driven Phase Transitions in Colloids: From spheres to anisotropic particles,” in Adv. Chem. Phys. (2014) pp. 35–71.
- O’Toole and Hudson (2011) P. I. O’Toole and T. S. Hudson, “New High-Density Packings of Similarly Sized Binary Spheres,” J. Phys. Chem. C 115, 19037–19040 (2011).
- Filion and Dijkstra (2009) L. Filion and M. Dijkstra, “Prediction of binary hard-sphere crystal structures,” Phys. Rev. E 79, 046714 (2009).
- Hopkins et al. (2012) A. B. Hopkins, F. H. Stillinger, and S. Torquato, “Densest Binary Sphere Packings,” Phys. Rev. E 85, 021130 (2012).
- Auer and Frenkel (2001) S. Auer and D. Frenkel, “Prediction of absolute crystal-nucleation rate in hard-sphere colloids,” Nature 409, 1020–1023 (2001).
- Punnathanam and Monson (2006) S. Punnathanam and P. A. Monson, “Crystal nucleation in binary hard sphere mixtures: A Monte Carlo simulation study,” J. Chem. Phys. 125, 024508 (2006).
- Ni et al. (2011) R. Ni, F. Smallenburg, L. Filion, and M. Dijkstra, “Crystal nucleation in binary hard-sphere mixtures: The effect of order parameter on the cluster composition,” Mol. Phys. 109, 1213–1227 (2011).
- Vermolen et al. (2009) E. C. M. Vermolen, A. Kuijk, L. C. Filion, M. Hermes, J. H. J. Thijssen, M. Dijkstra, and A. Van Blaaderen, “Fabrication of large binary colloidal crystals with a NaCl structure,” Proc. Natl. Acad. Sci. U. S. A. 106, 16063–16067 (2009).
- Filion et al. (2011) L. Filion, M. Hermes, R. Ni, E. C. M. Vermolen, A. Kuijk, C. G. Christova, J. C. P. Stiefelhagen, T. Vissers, A. van Blaaderen, and M. Dijkstra, “Self-Assembly of a Colloidal Interstitial Solid with Tunable Sublattice Doping,” Phys. Rev. Lett. 107, 168302 (2011).
- Bommineni and Punnathanam (2017) P. K. Bommineni and S. N. Punnathanam, “Molecular simulation of homogeneous crystal nucleation of AB2 solid phase from a binary hard sphere mixture,” J. Chem. Phys. 147, 064504 (2017).
- Lindquist et al. (2018) B. A. Lindquist, R. B. Jadrich, and T. M. Truskett, “Communication: From close-packed to topologically close-packed: Formation of Laves phases in moderately polydisperse hard-sphere mixtures,” J. Chem. Phys. 148, 191101 (2018).
- Bommineni et al. (2019) P. K. Bommineni, N. R. Varela-Rosales, M. Klement, and M. Engel, “Complex Crystals from Size-Disperse Spheres,” Phys. Rev. Lett. 122, 128005 (2019).
- Dasgupta et al. (2020) T. Dasgupta, G. M. Coli, and M. Dijkstra, “Tuning the Glass Transition: Enhanced Crystallization of the Laves Phases in Nearly Hard Spheres,” ACS Nano 14, 3957–3968 (2020).
- Steurer and Dshemuchadse (2016) W. Steurer and J. Dshemuchadse, Intermetallics – Structures, Properties, and Statistics (Oxford University Press, 2016).
- Hynninen et al. (2007) A.-P. Hynninen, J. H. J. Thijssen, E. C. M. Vermolen, M. Dijkstra, and A. van Blaaderen, “Self-Assembly Route for Photonic Crystals with a Bandgap in the Visible Region,” Nat. Mater. 6, 202–205 (2007).
- Berthier et al. (2016) L. Berthier, D. Coslovich, A. Ninarello, and M. Ozawa, “Equilibrium sampling of hard spheres up to the jamming density and beyond,” Phys. Rev. Lett. 116, 238002 (2016).
- Wyart and Cates (2017) M. Wyart and M. E. Cates, “Does a Growing Static Length Scale Control the Glass Transition?” Phys. Rev. Lett. 119, 195501 (2017).
- Coslovich et al. (2018) D. Coslovich, M. Ozawa, and L. Berthier, “Local order and crystallization of dense polydisperse hard spheres,” J. Phys. Condens. Matter 30, 144004 (2018).
- Brito et al. (2018) C. Brito, E. Lerner, and M. Wyart, “Theory for swap acceleration near the glass and jamming transitions for continuously polydisperse particles,” Phys. Rev. X 8, 031050 (2018).
- Berthier et al. (2019) L. Berthier, E. Flenner, C. J. Fullerton, C. Scalliet, and M. Singh, “Efficient swap algorithms for molecular dynamics simulations of equilibrium supercooled liquids,” J. Stat. Mech. Theory Exp. 2019, 064004 (2019).
- Mihalkovič and Widom (2020) M. Mihalkovič and M. Widom, “Spontaneous formation of thermodynamically stable Al-Cu-Fe icosahedral quasicrystal from realistic atomistic simulations,” Phys. Rev. Res. 2, 013196 (2020).
- (41) “See Supplemental Material at http://link.aps.org/ supplemental/10.1103/PhysRevLett.xxx.xxxxxx for additional text on simulation methods, detection of crystalline clusters, mapping of simulations to experiments, and a movie of Laves phase growth.” .
- Steinhardt et al. (1983) P. J. Steinhardt, D. R. Nelson, and M. Ronchetti, “Bond-orientational order in liquids and glasses,” Phys. Rev. B 28, 784–805 (1983).
- van Meel et al. (2012) J. A. van Meel, L. Filion, C. Valeriani, and D. Frenkel, “A parameter-free, solid-angle based, nearest-neighbor algorithm,” J. Chem. Phys. 136, 234107 (2012).
- Engel et al. (2015) M. Engel, P. F. Damasceno, C. L. Phillips, and S. C. Glotzer, “Computational self-assembly of a one-component icosahedral quasicrystal,” Nat. Mater. 14, 109–116 (2015).
- Klement and Engel (2019) M. Klement and M. Engel, “Efficient equilibration of hard spheres with Newtonian event chains,” J. Chem. Phys. 150, 174108 (2019).
- Tateno et al. (2019) M. Tateno, T. Yanagishima, J. Russo, and H. Tanaka, “Influence of Hydrodynamic Interactions on Colloidal Crystallization,” Phys. Rev. Lett. 123, 258002 (2019).
- Hachisu and Yoshimura (1980) S. Hachisu and S. Yoshimura, “Optical demonstration of crystalline superstructures in binary mixtures of latex globules,” Nature 283, 188–189 (1980).
- Bartlett and Campbell (2005) P. Bartlett and A. I. Campbell, “Three-dimensional binary superlattices of oppositely charged colloids,” Phys. Rev. Lett. 95, 128302 (2005).
- Leunissen et al. (2005) M. E. Leunissen, C. G. Christova, A. P. Hynninen, C. P. Royall, A. I. Campbell, A. Imhof, M. Dijkstra, R. van Roij, and A. van Blaaderen, “Ionic colloidal crystals of oppositely charged particles,” Nature 437, 235–240 (2005).
- LaCour et al. (2019) R. A. LaCour, C. S. Adorf, J. Dshemuchadse, and S. C. Glotzer, “Influence of Softness on the Stability of Binary Colloidal Crystals,” ACS Nano 13, 13829–13842 (2019).
- Shevchenko et al. (2005) E. V. Shevchenko, D. V. Talapin, S. O’Brien, and C. B. Murray, “Polymorphism in AB13 nanoparticle superlattices: An example of semiconductor-metal metamaterials,” J. Am. Chem. Soc. 127, 8741–8747 (2005).
- Shevchenko et al. (2006) E. V. Shevchenko, D. V. Talapin, N. A. Kotov, S. O’Brien, and C. B. Murray, “Structural diversity in binary nanoparticle superlattices,” Nature 439, 55–59 (2006).
- Evers et al. (2010) W. H. Evers, B. D. Nijs, L. Filion, S. Castillo, M. Dijkstra, and D. Vanmaekelbergh, “Entropy-driven formation of binary semiconductor-nanocrystal superlattices,” Nano Lett. 10, 4235–4241 (2010).
- Coropceanu et al. (2019) I. Coropceanu, M. A. Boles, and D. V. Talapin, “Systematic Mapping of Binary Nanocrystal Superlattices: The Role of Topology in Phase Selection,” J. Am. Chem. Soc. 141, 5728–5740 (2019).
- Pedersen et al. (2018) U. R. Pedersen, T. B. Schrøder, and J. C. Dyre, “Phase Diagram of Kob-Andersen-Type Binary Lennard-Jones Mixtures,” Phys. Rev. Lett. 120, 165501 (2018).
- Ingebrigtsen et al. (2019) T. S. Ingebrigtsen, J. C. Dyre, T. B. Schrøder, and C. P. Royall, “Crystallization Instability in Glass-Forming Mixtures,” Phys. Rev. X 9, 031016 (2019).
- Robinson et al. (2019) J. F. Robinson, F. Turci, R. Roth, and C. P. Royall, “Morphometric Approach to Many-Body Correlations in Hard Spheres,” Phys. Rev. Lett. 122, 068004 (2019).
- Marín-Aguilar et al. (2020) S. Marín-Aguilar, H. H. Wensink, G. Foffi, and F. Smallenburg, “Tetrahedrality dictates dynamics in hard sphere mixtures,” Phys. Rev. Lett. in press (2020).
- Campo and Speck (2020) M. Campo and T. Speck, “Dynamical coexistence in moderately polydisperse hard-sphere glasses,” J. Chem. Phys. 152, 014501 (2020).