Magnetization and magneto-transport measurements on CeBi single crystals
Abstract
We report the synthesis of CeBi single crystals out of Bi self flux and a systematic study of the magnetic and transport properties with varying temperature and applied magnetic fields. From these and data we could assemble the field-temperature () phase diagram for CeBi and visualize the three dimensional surface. In the phase diagram, we identify regions with well defined magnetization values, and identify a new phase region. The magnetoresistance (MR) in the low temperature regime shows, above T a power-law, non-saturated behavior with large MR ( at K and T), along with Shubnikov-de Haas oscillations. With increasing temperatures, MR decreases, and then becomes negative for K. This crossover in MR seems to be unrelated to any specific magnetic or metamagnetic transitions, but rather is associated with changing from a low-temperature normal metal regime with little or no scattering from the Ce3+ moments and an anomalously large MR, to an increased scattering from local Ce moments and a negative MR as temperature increases.
keywords:
Metamagnetism, Rare-earth monopnictides, Magnetoresistance, Phase diagram1 Introduction
In recent years there has been a revived interest in the properties of low carrier density or semi-metallic materials with large spin-orbit-coupling (SOC). When these semi-metals are rare earth bearing, the interaction between local moments and conduction electrons can lead to remarkable magnetic field-temperature () phase diagrams as well as dramatic changes in magnetoresistance across multiple phase transitions [1, 2, 3, 4, 5]. In the Bi, Sb, Bi2, Sb2, AgBi2, AgSb2 ( = rare-earth) and related systems the sometimes large magnetoresistance, combined with recent computational predictions or models, has lead to interest in possible topological states existing in compounds that can exhibit long range magnetic order [6, 7, 8, 9].
The rare-earth monopnictides (, =rare-earth, =P, As, Sb, Bi) family, which crystallize in the simple NaCl structure, is such a set of compounds. They have been studied in the past for the rich magnetism they host, including perspective of Kondo lattices and valence fluctuation compounds [10, 11, 12, 13, 14, 15, 16]. In recent years new studies have been done on them as candidates for topological materials [17, 18, 19, 20, 21, 22, 23, 24, 6, 25]. An interesting aspect, that has been brought to the forefront by recent studies is the existence of large magnetoresistance in many of the rare-earth antimonides and bismuthides [19, 23, 26, 27].
CeBi, the heaviest member of the Ce family, is known to show multiple metamagnetic transitions in the magnetic field - temperature phase space, with a strong anisotropy arising from crystalline electric field (CEF) effects and a resultant anisotropic magnetoresistance [28, 29, 30, 31, 32, 33]. It thus provides an exemplary candidate to study the effects of magnetic ordering in magnetoresistance and electronic structure.
Here, we report the crystal growth, magnetic characterization, and detailed magneto-transport measurements on single crystals of CeBi. We identify regions that are prone to large hysteresis in field as well as temperature, correlating with the existence of many, near degenerate magnetic states. The phase diagram obtained from decreasing temperature and field sweeps reveals an additional phase line as compared to the most complete previous report, but otherwise agrees well with it [29]. We also observed a non-monotonic behavior of magnetoresistance with temperature, where a low temperature large MR behavior slowly diminishes and becomes negative MR with increasing temperatures. This was followed by a shift to positive MR again but with comparatively small magnitude.
2 Experimental details
Single crystals of CeBi were grown out of Bi self flux [34], using the current binary Bi-Ce phase diagram [35]. An initial composition of Ce26Bi74 was sealed in a welded tantalum tube under an argon atmosphere, followed by sealing under partial pressure of argon into a fused silica ampoule. The thus prepared ampoule was heated up to C over hours and held there for hours, followed by slow cooling to C over hours, at which temperature, the excess flux was decanted using a centrifuge [34, 36]. The air sensitive crystals, of typical dimensions of about mm mm mm, were handled in a nitrogen filled glove box. The crystal structure as well as phase purity were confirmed by powder x-ray diffraction using a Rigaku Miniflex diffractometer (also in nitrogen glove box), using Cu radiation.
Magnetization (), as a function of temperature () was measured on two different crystals. An initial measurement of at T was made in a Quantum Design Magnetic Property Measurement System (MPMS), upon cooling from K to K. This is shown below in Fig. 2 (a). Later more detailed and systematic measurements were carried out in an MPMS 3, in vibrating sample magnetometer (VSM) mode, from temperatures K to K, and applied magnetic fields () up to T. The magnetic field was applied along one of the directions. For data acquisition, measurements were done with both zero field cooled (ZFC) sample with increasing temperatures and on field cooled (FC) with decreasing temperatures. Similarly, for measurements, both increasing and decreasing field isotherms were measured for various temperatures between K and K.
Resistance measurements were done in the standard four-probe geometry, in a Quantum Design Physical Property Measurement System (PPMS) using a mA excitation with a frequency of Hz. Electrical contacts were made on a cleaved, rectangular bar shaped, crystal, using silver paint (DuPont 4929N). The magnetic field, up to T, was applied along one of the directions, and perpendicular to the current which was also along one of the directions. For all the measurements, crystals were oriented based on their very clear, natural, cubic morphology and square facets. measurements were done partially on warming and partially on cooling. curves at , 0.5, 1.5, 2, 3.5, 4.2, 4.5, 5.5, 7, 9, and T were obtained by measuring resistance on cooling the sample, and the rest while warming up. Similarly at 3.5, 4, 7, 10, 12, 20, 25, 35, 40, and K were measured with decreasing magnetic field, and the rest with increasing fields.
3 Results
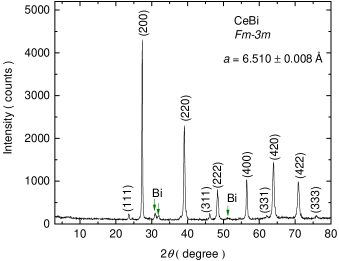
Figure 1 shows the powder x-ray diffraction data. The peaks resolved match with the reported peak positions for the cubic structure of CeBi [37]. From the () indices assigned, by comparison to the reported structure, we calculated the lattice parameter Å, which is in agreement with Ref. [37]. Weak additional peaks, corresponding to small amounts of residual Bi flux are also identified (marked by green arrows in the figure).
3.1 Magnetization
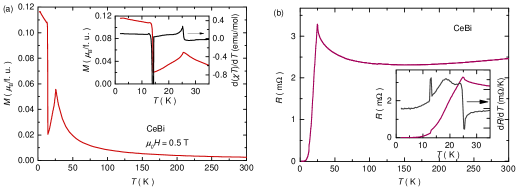
The magnetic characterization was done on cleaved and clean crystals handled in a nitrogen filled glove box. Figure 2 (a) shows data taken on cooling from K to K. The inset shows the K range of the curve, clearly showing the two transitions, a kink-like anomaly at K (indicated in Fig. 5 below by a black circle) and a step-like increase of a little below K (indicated in Fig. 5 below by a dark yellow square). The transition temperatures are determined by taking the extrema in data, which is the criterion for transition temperature in a simple antiferromagnet [38], but has been used to identify multiple transitions as well [39]. Both from the shape of the derivative curves and from the hysteretic behavior shown in Fig. 3, we can identify that the transition around K is a second order transition, and the one below K is first order. This is in agreement with the reported nature of the magnetic transitions [14]. A Curie-Weiss fit for the paramagnetic regime above the transition, as shown in the inset of Fig. 3(a), gives an effective moment, , in agreement with the expected effective moment for Ce3+ ions, and K,.
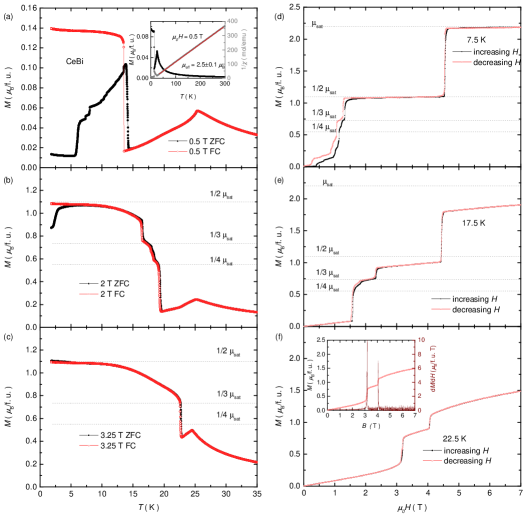
Figure 3 shows a representative set of and data. , measured on both ZFC and FC sample with warming and cooling respectively; data for a low field of T, at an intermediate field of T, and at a higher field of T are shown in Fig. 3 (a), (b) and (c). For lower field measurement shown in Fig. 3 (a), there is a stark distinction between ZFC and FC data, with a notable hysteresis for the transition below K. In addition, the ZFC data go through a cascade of features, some of which are barely resolvable, whereas the FC measurement shows two well defined features. The features in ZFC data are possibly due to a realignment of domains or may be associated with many closely spaced, near degenerate, ordered states. With increasing fields, the differences in ZFC and FC data start to disappear and eventually they fall on top of each other, as shown for at T and T in Fig. 3 (b) and (c) respectively.
Similarly, for data a comparison between a low temperature (K), an intermediate temperature (K) and a higher temperature (K) measurement is shown in Fig. 3 (d), (e) and (f). At low temperatures, there exists a series of metamagnetic transitions in the low field regime, with a clear hysteresis, as shown for at K. The two, clear, higher field metamagnetic states have locally saturated magnetizations of (as compared to for Ce3+) and approximately . It should be noted that Fig. 3 (b) also shows the plateaus in corresponds to roughly a quarter, a third, and a half of the measured saturated magnetic moment value , which are denoted by dotted lines in the figure. As we increase the temperature this lower-field hysteretic behavior starts to disappear and the increasing- and decreasing- field data fall on top of each other with well defined plateaus, as shown in Fig. 3 (e) and (f) for K and K respectively. The inset of Fig. 3 (f) shows both and plotted together. The peaks in is identified as the transition fields and are used in plotting the phase diagram shown in Fig. 5, which will be discussed later. From here on, all the magnetization data shown, both in Fig. 4 and Fig. 6, as well as used for determining the phase diagram in Fig. 5 are from FC and decreasing field measurements.
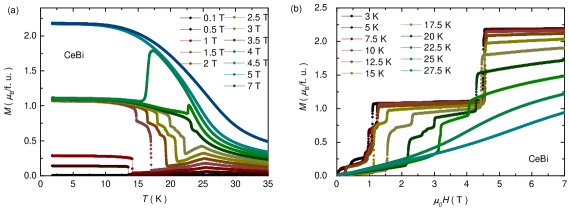
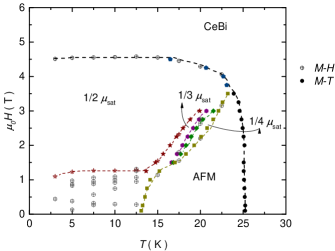
Having gained some insight into the hysteretic behavior of the magnetization data, we can now look at how various features evolve with temperature and field. Figure 4 (a) shows the temperature dependent magnetization, , at various magnetic fields up to T. As compared to the T measurement, by increasing magnetic fields up to T, the kink-like anomaly near K becomes more pronounced and is gradually suppressed to lower temperatures. Whereas, the step-like anomaly, initially a little below K, moves to higher temperature with increasing fields. At about T, these two anomalies merge together and evolve into a single, jump-like drop of for T T. At even higher fields, all anomalies are suppressed and behavior of approaches that of a field polarized (saturated paramagnetic) state. In the intermediate field range (T T), additional step-like anomalies in appear between K and K (corresponding to the series of closely placed transitions shown in Fig. 5 using star, hexagon, and diamond symbols) which can be associated with additional magnetic transitions. From these transitions, we can start to build aa phase diagram as shown in Fig. 5. These transition temperatures obtained from data are shown in Fig. 5 as filled symbols (circles, squares, diamonds, and stars).
More of the CeBi phase diagram can be inferred from data. Multiple magnetic transitions can also be observed in the field dependent magnetization data as shown in Figs. 3 (d), 3 (e), 3 (f), and 4 (b). At K, the curve shows two sharp jumps at T and T, and another smaller kink or shoulder at around T. At K, and T a saturated moment, /f. u. is obtained which is within the error bar from the expected for Ce3+ ions. With increasing temperatures, the higher field transition barely moves (e. g. At K, as shown in Fig. 3 (d), the higher field transition occurs at T), but below about T one can see a cascade of closely spaced transitions setting in, which are hysteretic in increasing and decreasing field measurements, as can be seen in Fig. 3 (d). For K and above, i.e. above the zero field value of the lower transition temperature, the low field transitions disappear and curves become simpler, with well defined plateaus (Figs. 3 (e) and (f)). Above K all the features corresponding to the various transitions disappear, and the curve resembles that of a typical local moment system in the paramagnetic state. The points for the phase diagram are obtained from data by evaluating the peaks in derivative , and are denoted as open-crossed symbols in Fig. 5.
A field-temperature phase diagram obtained from our and data is shown in Fig. 5. This is very similar to the previously reported phase diagrams [28, 29, 40]. A very early study on polycrystalline CeBi was already able to identify three distinct phase regions in the phase space, which were identified as two antiferromagnetic orderings, and a ferrimagnetic ordering with , in addition to the field polarized and paramagnetic regimes [11]. Later, more detailed measurements on single crystalline samples were reported, with as many as seven different phases in the same regime [28]. They also observed the hysteretic nature of the transitions, which decreased with increasing temperatures. Followed by this, a neutron scattering study confirmed the AFM ordering and partially assigned magnetic structures to the various phases [29]. They identified the two AFM orderings, the phase and a variety of mixed phases in between, at low temperatures. For K, they identified two phases, but were not able to assign a net magnetization value. Later, a molecular field model, with Ce moments in [001] direction and having an oscillatory exchange interaction perpendicular to the (001) plane, was shown to calculate the phase diagram agreeing very well with the experimental data [40].
With this information in hand, we can try to interpret the phase diagram we have obtained. The various features in Fig. 5 could be understood as follows: Existence of an envelope denoting paramagnetic to antiferromagnetic at higher temperatures, and a full saturation into field polarized state at lower temperatures, with phase boundaries agreeing very well with the existing reports, within which one can see multiple other regions. For above K, one can see a well defined region of antiferromagnetic order, and two narrow regimes corresponding to roughly and values. There also exist a narrow phase in between these, which was not identified in the previous reports [28, 29]. We were not able to assign a locally saturated magnetization value to this phase, given its very limited extent. In the lower temperature regime, between T and T we have an extended region which corresponds to , which agrees well with the previous reports, whereas, at lower fields, we have plethora of transitions with ill defined and hysteretic phase boundaries, once again agreeing well with reported mixed phases from the neutron study [29]. Nevertheless, we were not able to assign any specific net magnetization values to phases here either, as opposed to Ref. [29], because of the large hysteresis and irreversible nature of the increasing and decreasing field data.
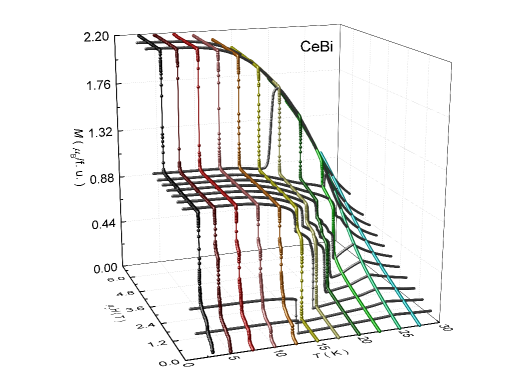
Magnetization both as a function of temperature and magnetic field are plotted in Fig. 6 by combining the data presented in Figs. 4 (a) and (b). As shown in the figure, data from two sets of measurements agree with each other very well and together they depict various magnetic transitions and plateaus. Figures 3, 4, and 6 also emphasize that whereas for low temperatures the magnetic plateaus are well saturated at well defined values, as temperature increases, the plateaus-like regions have (i) decreasing extent, (ii) develop finite slopes, and (iii) have their values decrease from their lowest temperature values.
3.2 Resistance
The temperature dependent electrical resistance in zero field on a cleaved crystal of CeBi is shown in Fig. 2 (b). The resistance remains relatively invariant at high temperatures, followed by an upturn and then a sharp decrease at K, associated with loss of spin disorder. The RRR was calculated to be . A similar behavior is observed for CeSb as well, but with a much less pronounced upturn [16]. The near 1000 RRR value attests to the high purity of the CeBi samples. This is further born out by the fact that (i) the magnetoresistance at low temperatures is huge and follows Kohler’s rule and (ii) Shubnikov-de Haas oscillation are detected. The inset of Fig. 2 (b) shows the low temperature region with the transitions clearly seen. The first one is around K, and another transition, observed as a relatively small jump in is seen around K. The transition temperatures are determined by taking the local maxima of the derivative [41, 39].
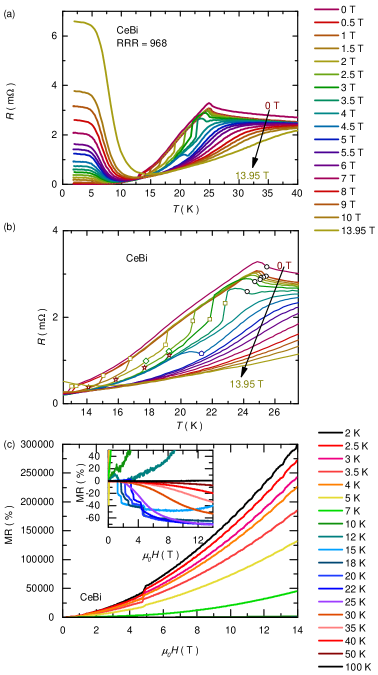
Figure 7 shows the temperature and magnetic field dependence of electrical resistance. The temperature dependence of with various applied fields is shown in Fig. 7 (a) for K. Figure 7 (b) shows the intermediate temperature regime where the various transitions are seen. Here, we have denoted the transition temperatures with open symbols (circles, squares, diamonds, and stars) with same shape and color, as those used for the corresponding transitions from magnetization data, in the phase diagram. When magnetic fields are applied, the first transition, denoted by black open circles in Fig. 7 (b), shifts to lower temperatures, and the second transition, denoted by dark yellow open squares in Fig. 7 (b), move to higher temperatures before merging into one, at around T. Between and T, two other anomalies appear, as a small jump in data, denoted by open stars and diamonds in Fig. 7 (b). Similarly, the metamagnetic transitions could be observed in data as well. The evolution of various features from and data follows the behavior in magnetization data and agree well with the phase diagram in Fig. 5. As temperature decreases both Figs. 7 (a) and 7 (c) show that once spin disorder (or magnon) scattering from the Ce3+ is suppressed by field or temperature, a growing and large positive magnetoresistance emerges.
Figure 7 (c) shows the magnetoresistance, defined as , as a function of . A sharp feature in vs. is seen around T, at K, coinciding well with the feature obtained in data. At low temperatures there is a power-law like behavior with an experimentally determined power for fitting MR at K, above T with . At K and T, MR reaches a value of . Shubnikov-de Haas (SdH) oscillations are also observed at low temperatures and high fields. With increasing the quantum oscillations die away and the magnitude of MR decreases, as expected. Above K, a negative MR regime is observed. The step-like features in vs. curves are associated with the metamagnetic transitions, as shown in the inset of Fig. 7 (c). At even higher , above K, MR becomes positive again, but with comparatively small values. For instance, MR at K and T is .
4 Discussion
We can try to gain a better understanding of the magnetic and transport properties of CeBi by looking more closely at the phase diagram and comparing it with the magnetoresistance behavior. In the phase diagram shown in Fig. 5, one can observe an envelope of transitions, paramagnetic to antiferromagnetic at higher temperatures, and going to field polarized state at lower temperatures but with higher fields. Within this there is a clear and large region between to T at lower temperatures and reducing in width at higher temperatures above K. This corresponds to a regime with . This is seen as a clear plateau in data in Fig. 6. Additionally, we have an antiferromagnetic region, existing between the transition at K and the lower one (near K in lower fields), denoted by yellow squares in the phase diagram in Fig. 5. Then there are narrow stretches of magnetic phases existing between yellow squares and red stars in Fig. 5. The larger two of these regions correspond to phases with a net magnetization of and , where is the saturated magnetization close to . There exists a third phase in between these two, and that has not been reported earlier. Once we enter the low temperature, low field regime, below K and less than T, we have multiple closely placed transitions and phases with ill defined boundaries. This likely corresponds to existence of many near degenerate states, as evidenced by the highly hysteretic behavior of both and .
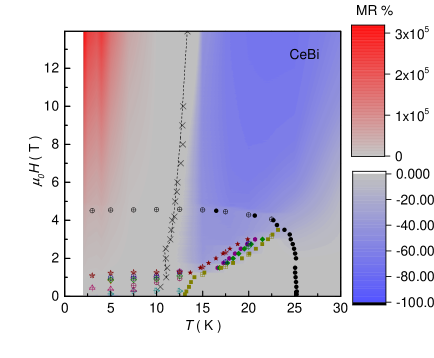
We can compare our phase diagram with the various MR regions, to better understand how magnetoresistance is being affected by the magnetic ordering. This is achieved through a false color plot of as a function of and , as shown in Fig. 8. A change from blue to red colored region shows the variation from negative to positive large MR.
The most conspicuous feature in the false color plot is the change from positive to negative MR. Although the lowest field data could suggest that this could be related to the transitions near K, the fact that this MR sign change exists to fields 2.5 times larger than the metamagnetic transition to the saturated paramagnetic state indicates that this is not the case. The sign change in MR persists from the high field to low field region, unchanged by crossing the T line. Based on the simpler, higher field curves, the sign change appears to be associated with a change from a lower temperature, positive MR associated with minimal scattering from the already saturated Ce3+ moments to a higher temperature, negative MR that is associated with the increasing applied field suppressing scattering from the Ce3+ moments. The negative MR region in the ordered part of the diagram indicates the region where magnetic scattering is most readily suppressed by increased field. One can not rule out the possible existence of a Lifshitz transition unaffected by the magnetic transitions, which could also cause such a change, but this would be coincidental. In other words, whereas electronic structural changes in zero field have been observed associated with magnetic transitions, both in optical and ARPES measurements [47, 48, 49], it is unlikely that this causes such a cross-over in MR behavior, in high fields, where we are in a saturated paramagnetic regime. This argument is further strengthened by the Kohler’s rule analysis in the following paragraph.
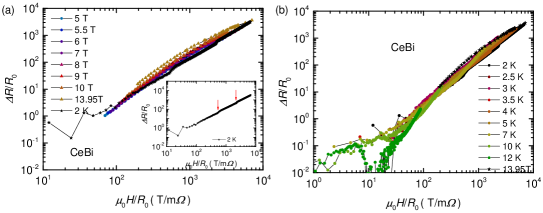
The existence of a power-law like behavior of at low temperatures calls for the Kohler’s rule analysis of this data set. Kohler’s rule provides a simplistic approach, wherein the classical electron motion in an applied magnetic field leads to a scaling behavior of the form:
| (1) |
Here, is the scaling function and where . Kohler’s rule holds as long as there is a single, dominant scattering mechanism. Given that we think scattering from the Ce3+ moment is minimal to the left of crossed line in Fig. 8, i.e. in the positive MR region, we can analyze our data in that region of the space. Figure 9 (a) shows the Kohler’s plot obtained from the resistance measured at various fields above T, in the temperature range KK. Figure 9 (b) shows the Kohler’s plot from different curves measured at various temperatures up to K. All the curves, except at K, fall approximately on top of each other signifying the scaling behavior and its breaking as we approach the magnetic transition. In Fig. 9 (a), one can see, the various data roughly fall on top of each other, indicating the MR behavior at low temperatures being governed by the same physics across a wide range of applied fields. This also shows that the various magnetic transitions in the low temperature low field regime play a less dominant role in electronic transport, as the effects of these on electronic scattering are small (on the logarithmic scale) compared to the Kohler’s rule behavior due to very high positive non-saturating magnetoresistance values observed at low temperatures. This can be emphasized more by plotting vs. using data at K. It agrees well with the curves from various data as shown in Fig. 9 (a). But additionally, if we look carefully at the K curve, shown separately in the inset of Fig. 9 (a), one can see small glitches in it (indicated by red arrows in the figure), which corresponds to the field values of T and T, which are close to the fields where we observe the magnetic transitions. This clearly shows that the effect of magnetic transitions on the MR behavior in this regime is comparatively small. The slope of data shown in inset of Fig.9 (a) is roughly . Although the manifolds shown in the main body of Figs. 9 (a) and (b) have some spread, they are consistent with this value as well.
Thus we can say, MR sign change tracks minimum in close to K and is most clearly associated with a crossover from low temperature Kohler’s rule - like behavior in with associated with a normal metal with an anomalously large MR to a higher temperature decrease in with associated with saturating the Ce spins and decreasing spin disorder/ magnon scattering.
The anisotropic MR behavior of CeBi was studied recently [33], and it suggests a magnetization governed MR in the temperature regime K - K. This is not inconsistent with our results. Whereas, they observe a magnetization dependent magnetoresistance in the temperature regime between , we focus on the Kohler’s rule behavior below that and the shift to negative MR above that temperature region.
5 Conclusion
We measured the magnetic and the transport properties of CeBi, on flux grown single crystals. From the magnetization data, we were able to construct a field-temperature phase diagram and identify regions with near degenerate states, as well as those with well defined magnetization values. We were also able to identify a new phase region in addition to the ones existing in earlier reports. In addition, we observed a non-monotonic behavior of magnetoresistance. A large MR was observed in the low temperature regime, where it has a power-law, non-saturated behavior, which obeys the Kohler’s scaling rule. This gives way to the onset of a negative magnetoresistance region with increasing temperatures, when the magnetic scattering plays the dominant role.
Acknowledgements
Work at the Ames Laboratory was supported by the U.S. Department of Energy, Office of Science, Basic Energy Sciences, Materials Sciences and Engineering Division. The Ames Laboratory is operated for the U.S. Department of Energy by Iowa State University under Contract No. DEAC0207CH11358. B. K. was supported by the Center for the Advancement of Topological Semimetals, an Energy Frontier Research Center funded by the U.S. DOE, Office of Basic Energy Sciences. N. H. J. was supported by the Gordon and Betty Moore Foundation EPiQS Initiative (Grant No. GBMF4411). L.X. was supported, in part, by the W. M. Keck Foundation and the Gordon and Betty Moore Foundations EPiQS Initiative through Grant GBMF4411.
References
- [1] S.L. Bud’ko, P.C. Canfield, C.H. Mielke, and A.H. Lacerda, Anisotropic magnetic properties of light rare-earth diantimonides, Phys. Rev. B 57 (1998), pp. 13624–13638.
- [2] K. Myers, S. Bud’ko, I. Fisher, Z. Islam, H. Kleinke, A. Lacerda, and P. Canfield, Systematic study of anisotropic transport and magnetic properties of RAgSb2 (R=Y, La–Nd, Sm, Gd–Tm), J. Magn. Magn. Mater. 205 (1999), pp. 27–52.
- [3] C. Petrovic, S. Bud’ko, and P. Canfield, Anisotropic properties of rare-earth dibismites, J. Magn. Magn. Mater. 247 (2002), pp. 270–278.
- [4] C. Petrovic, S. Bud’ko, J. Strand, and P. Canfield, Anisotropic properties of rare earth silver dibismites, J. Magn. Magn. Mater. 261 (2003), pp. 210–221.
- [5] L. Xiang, E. Gati, K. Neilson, S.L. Bud’ko, and P.C. Canfield, Physical properties of under pressure, Phys. Rev. Materials 3 (2019), p. 095006.
- [6] K. Kuroda, M. Ochi, H.S. Suzuki, M. Hirayama, M. Nakayama, R. Noguchi, C. Bareille, S. Akebi, S. Kunisada, T. Muro, M.D. Watson, H. Kitazawa, Y. Haga, T.K. Kim, M. Hoesch, S. Shin, R. Arita, and T. Kondo, Experimental Determination of the Topological Phase Diagram in Cerium Monopnictides, Phys. Rev. Lett 120 (2018), p. 086402.
- [7] K. Wang and C. Petrovic, Multiband effects and possible Dirac states in LaAgSb2, Phys. Rev. B 86 (2012), p. 155213.
- [8] K. Wang, D. Graf, and C. Petrovic, Quasi-two-dimensional Dirac fermions and quantum magnetoresistance in LaAgBi2, Phys. Rev. B 87 (2013), p. 235101.
- [9] X. Shi, P. Richard, K. Wang, M. Liu, C.E. Matt, N. Xu, R.S. Dhaka, Z. Ristic, T. Qian, Y.F. Yang, C. Petrovic, M. Shi, and H. Ding, Observation of Dirac-like band dispersion in , Phys. Rev. B 93 (2016), p. 081105.
- [10] T. Tsuchida and W.E. Wallace, Magnetic Characteristics of Lanthanide—Bismuth Compounds, J. Chem. Phys. 43 (1965), pp. 2087–2092.
- [11] T. Tsuchida and Y. Nakamura, Field Induced Magnetic Phases of Cerium-Bismuth Compound with Sodium-Chloride Structure, J. Phys. Soc. Jpn 22 (1967), pp. 942–943.
- [12] N. Nereson and G. Arnold, Magnetic Properties of CeBi, NdBi, TbBi, and DyBi, J. Appl. Phys. 42 (1971), pp. 1625–1627.
- [13] J.W. Cable and W.C. Koehler, The Magnetic Structures of CeBi, AIP Conference Proceedings 5 (1972), pp. 1381–1384.
- [14] B. Hälg, A. Furrer, W. Hälg, and O. Vogt, Critical neutron scattering in CeBi, J. Magn. Magn. Mater. 29 (1982), pp. 151 – 154.
- [15] T. Kasuya, M. Sera, Y. Okayama, and Y. Haga, Normal and Anomalous Hall Effect in CeSb and CeBi, J. Phys. Soc. Jpn 65 (1996), pp. 160–171.
- [16] T.A. Wiener and P.C. Canfield, Magnetic phase diagram of flux-grown single crystals of CeSb, Journal of Alloys and Compounds 303-304 (2000), pp. 505 – 508.
- [17] X.H. Niu, D.F. Xu, Y.H. Bai, Q. Song, X.P. Shen, B.P. Xie, Z. Sun, Y.B. Huang, D.C. Peets, and D.L. Feng, Presence of exotic electronic surface states in LaBi and LaSb, Phys. Rev. B. 94 (2016), p. 165163.
- [18] Y. Wu, T. Kong, L.L. Wang, D.D. Johnson, D. Mou, L. Huang, B. Schrunk, S.L. Bud’ko, P.C. Canfield, and A. Kaminski, Asymmetric mass acquisition in LaBi: Topological semimetal candidate, Phys. Rev. B. 94 (2016), p. 081108.
- [19] L.K. Zeng, R. Lou, D.S. Wu, Q.N. Xu, P.J. Guo, L.Y. Kong, Y.G. Zhong, J.Z. Ma, B.B. Fu, P. Richard, P. Wang, G.T. Liu, L. Lu, Y.B. Huang, C. Fang, S.S. Sun, Q. Wang, L. Wang, Y.G. Shi, H.M. Weng, H.C. Lei, K. Liu, S.C. Wang, T. Qian, J.L. Luo, and H. Ding, Compensated Semimetal LaSb with Unsaturated Magnetoresistance, Phys. Rev. Lett 117 (2016), p. 127204.
- [20] P.J. Guo, H.C. Yang, B.J. Zhang, K. Liu, and Z.Y. Lu, Charge compensation in extremely large magnetoresistance materials LaSb and LaBi revealed by first-principles calculations, Phys. Rev. B. 93 (2016), p. 235142.
- [21] R. Lou, B.B. Fu, Q.N. Xu, P.J. Guo, L.Y. Kong, L.K. Zeng, J.Z. Ma, P. Richard, C. Fang, Y.B. Huang, S.S. Sun, Q. Wang, L. Wang, Y.G. Shi, H.C. Lei, K. Liu, H.M. Weng, T. Qian, H. Ding, and S.C. Wang, Evidence of topological insulator state in the semimetal LaBi, Phys. Rev. B. 95 (2017), p. 115140.
- [22] Y. Wu, Y. Lee, T. Kong, D. Mou, R. Jiang, L. Huang, S.L. Bud’ko, P.C. Canfield, and A. Kaminski, Electronic structure of RSb (R=Y, Ce, Gd, Dy, Ho, Tm, Lu) studied by angle-resolved photoemission spectroscopy, Phys. Rev. B. 96 (2017), p. 035134.
- [23] L. Ye, T. Suzuki, C.R. Wicker, and J.G. Checkelsky, Extreme magnetoresistance in magnetic rare-earth monopnictides, Phys. Rev. B. 97 (2018), p. 081108.
- [24] P. Li, Z. Wu, F. Wu, C. Cao, C. Guo, Y. Wu, Y. Liu, Z. Sun, C.M. Cheng, D.S. Lin, F. Steglich, H. Yuan, T.C. Chiang, and Y. Liu, Tunable electronic structure and surface states in rare-earth monobismuthides with partially filled shell, Phys. Rev. B. 98 (2018), p. 085103.
- [25] D.C. Ryu, J. Kim, K. Kim, C.J. Kang, J.D. Denlinger, and B.I. Min, Distinct topological properties in Ce monopnictides having correlated electrons: CeN vs. CeBi, Phys. Rev. Research 2 (2020), p. 012069.
- [26] D.D. Liang, Y.J. Wang, C.Y. Xi, W.L. Zhen, J. Yang, L. Pi, W.K. Zhu, and C.J. Zhang, Extreme magnetoresistance and Shubnikov-de Haas oscillations in ferromagnetic DySb, APL Mater. 6 (2018), p. 086105.
- [27] A. Vashist, R.K. Gopal, D. Srivastava, M. Karppinen, and Y. Singh, Fermi surface topology and large magnetoresistance in the topological semimetal candidate PrBi, Phys. Rev. B. 99 (2019), p. 245131.
- [28] H. Bartholin, D. Florence, W. Tcheng-Si, and O. Vogt, Magnetic Properties of CeBi, physica status solidi (a) 24 (1974), pp. 631–636.
- [29] Bartholin, H., Burlet, P., Quezel, S., Rossat-Mignod, J., and Vogt, O., Hydrostatic pressure effects and neutron diffraction studies of CeBi phase diagram, J. Phys. Colloques 40 (1979), pp. C5–130–C5–131.
- [30] J. Rossat-Mignod, P. Burlet, S. Quezel, and O. Vogt, Magnetic ordering in cerium and uranium monopnictides, Physica B+C 102 (1980), pp. 237–248.
- [31] J. Rossat-Mignod, P. Burlet, S. Quezel, J. Effantin, D. Delacôte, H. Bartholin, O. Vogt, and D. Ravot, Magnetic properties of cerium monopnictides, J. Magn. Magn. Mater. 31-34 (1983), pp. 398–404.
- [32] M. Kohgi, K. Iwasa, and T. Osakabe, Physics of low-carrier system detected by neutron and X-ray scattering: Ce-monopnictides case, Phys. B: Condens. Matter 281-282 (2000), pp. 417 – 422.
- [33] Y.Y. Lyu, F. Han, Z.L. Xiao, J. Xu, Y.L. Wang, H.B. Wang, J.K. Bao, D.Y. Chung, M. Li, I. Martin, U. Welp, M.G. Kanatzidis, and W.K. Kwok, Magnetization-governed magnetoresistance anisotropy in the topological semimetal CeBi, Phys. Rev. B 100 (2019), p. 180407.
- [34] P.C. Canfield and Z. Fisk, Growth of single crystals from metallic fluxes, Philosophical Magazine B 65 (1992), pp. 1117–1123.
- [35] H. Okamoto, Phase Diagrams for Binary Alloys, Desk Handbook, ASM International, Materials Park, OH, 2000.
- [36] P.C. Canfield, New materials physics, Rep. Progr. Phys. 83 (2019), p. 016501.
- [37] K. Yoshihara, J.B. Taylor, L.D. Calvert, and J.G. Despault, Rare-earth bismuthides, Journal of the Less Common Metals 41 (1975), pp. 329 – 337.
- [38] M.E. Fisher, Relation between the specific heat and susceptibility of an antiferromagnet, The Philosophical Magazine 7 (1962), pp. 1731–1743.
- [39] R. Ribeiro, S. Bud’ko, and P. Canfield, Detailed study of the magnetic phase transitions in single crystalline HoNi2B2C and DyNi2B2C, J. Magn. Magn. Mater. 267 (2003), pp. 216 – 223.
- [40] N. Iwata, M. Nishikawa, and T. Shigeoka, Molecular field calculations of the magnetization process in CeBi, J. Magn. Magn. Mater. 99 (1991), pp. 209–214.
- [41] M.E. Fisher and J.S. Langer, Resistive Anomalies at Magnetic Critical Points, Phys. Rev. Lett. 20 (1968), pp. 665–668.
- [42] T. Kasuya, O. Sakai, J. Tanaka, H. Kitazawa, and T. Suzuki, Electronic structures in cerium monopnictides, J. Magn. Magn. Mater. 63-64 (1987), pp. 9 – 14.
- [43] T. Miura, H. Aoki, H. Kitazawa, M. Takashita, C. Terakura, S. Uji, and G. Kido, dHvA effect study of CeBi in the ferromagnetic and ferrimagnetic phases, Physica B: Condens. Matter 259-261 (1999), pp. 1089–1090.
- [44] D. Shoenberg, Magnetic Oscillations in Metals, Cambridge Monographs on Physics, Cambridge University Press, 1984.
- [45] K. Morita, T. Goto, S. Nakamura, Y. Haga, T. Suzuki, Y. Kaneta, and O. Sakai, Fermi surface of low carrier compound CeBi, Physica B: Condens. Matter 230-232 (1997), pp. 192 – 194.
- [46] S. Huan, X. Shi, L. Han, H. Su, X. Wang, Z. Zou, N. Yu, W. Zhao, L. Chen, and Y. Guo, Magnetotransport evidence for the nontrivial topological states in the fully spin-polarized Kondo semimetal CeBi, Journal of Alloys and Compounds 875 (2021), p. 159993.
- [47] S.i. Kimura, M. Okuno, H. Kitazawa, F. Ishiyama, and O. Sakai, Change of Electronic Structure Induced by Magnetic Transitions in CeBi, J. Phys. Soc. Jpn 73 (2004), pp. 2041–2044.
- [48] P. Li, Z. Wu, F. Wu, C. Guo, Y. Liu, H. Liu, Z. Sun, M. Shi, F. Rodolakis, J.L. McChesney, C. Cao, H. Yuan, F. Steglich, and Y. Liu, Large Fermi surface expansion through anisotropic mixing of conduction and electrons in the semimetallic Kondo lattice CeBi, Phys. Rev. B 100 (2019), p. 155110.
- [49] H. Oinuma, S. Souma, K. Nakayama, K. Horiba, H. Kumigashira, M. Yoshida, A. Ochiai, T. Takahashi, and T. Sato, Unusual change in the Dirac-cone energy band upon a two-step magnetic transition in CeBi, Phys. Rev. B 100 (2019), p. 125122.