The TLA+ Toolbox
Abstract
We discuss the workflows supported by the TLA+ Toolbox to write and verify specifications. We focus on features that are useful in industry because its users are primarily engineers. Two features are novel in the scope of formal IDEs: CloudTLC connects the Toolbox with cloud computing to scale up model checking. A Profiler helps to debug inefficient expressions and to pinpoint the source of state space explosion. For those who wish to contribute to the Toolbox or learn from its flaws, we present its technical architecture.
1 Introduction
The TLA+ Toolbox combines a set of (command-line) tools into an integrated development environment (IDE). Its primary goal it to make TLA+ more widely used. To encourage the use of the Toolbox, the Toolbox is made freely available. It is developed by an open-source community.111https://github.com/tlaplus/tlaplus Section 2 describes the main Toolbox workflows by showing how the spec is model-checked and mechanically verified inside the Toolbox.222https://github.com/tlaplus/Examples/tree/master/specifications/TeachingConcurrency Section 3 shifts the discussion to the architecture and test infrastructure of the Toolbox. We conclude with outlining future engineering and research-related work.
1.1 Background
TLA+ is a high-level, math-based, formal specification language used at companies such as Amazon and Microsoft to design, specify, and document systems [17]. A system is specified by formulas expressed in the Temporal Logic of Actions [7, 9], a variant of Pnueli’s original linear-time temporal logic [19]. Data structures are represented with Zermelo-Fränkel set theory with choice. TLA+ is an untyped language and thus simpler and more expressive than programming languages [14]. Generating code is not in the scope of TLA+. It is implementation language agnostic and meant to find bugs above the code level. Further material about TLA+ is available [9, 10, 11, 13], but is not needed for what follows.
The underlying tools, with which to check and reason about TLA+ specs, are the explicit state model checker TLC and the TLA+ proof system (TLAPS). While TLC is used to check a finite model of a spec, TLAPS supports deductive reasoning about a spec with infinitely many reachable states [2, 22]. Other TLA+ tools are a parser to syntactically and semantically check a spec (SANY), a translator to transpile a PlusCal algorithm into TLA+, and a pretty-printer to render TLA+ with LaTeX.
2 Toolbox Features
The main parts of the Toolbox are the Spec Explorer, spec editors, model editors, and a Trace Explorer. The goal is to keep the interface simple and intuitive. Functionality not needed by beginning users is initially hidden.
2.1 Spec Explorer
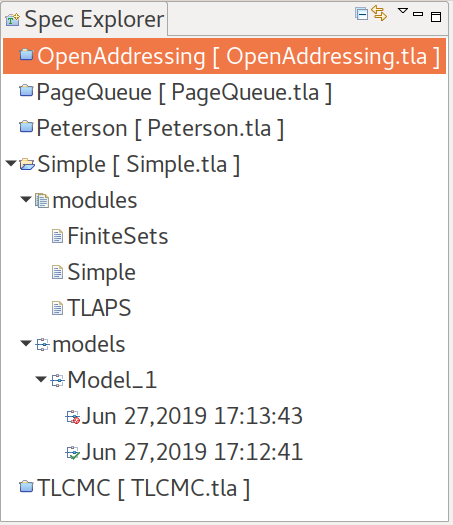
The Toolbox can host multiple TLA+ specifications. A spec has a root module, a set of additional modules and — optionally — a collection of models. All specifications are accessible from the Spec Explorer (figure 1), but users can work on only one spec at a time. Contrary to most Eclipse-based IDEs, specs can be exported from and imported into the Toolbox from the file system.
2.2 Spec Editor
A spec editor provides the usual commands that are helpful to create and edit TLA+ modules. The editor can also generate and show a pretty-printed version of the module. It shows annotations when SANY finds parsing errors.
2.2.1 PlusCal
The PlusCal algorithm language is a formally defined and verifiable pseudocode that is translated into TLA+ [10]. PlusCal resembles an imperative programming language and is especially well suited to express sequential and shared-memory multithreaded algorithms. Neither the TLA+ concept of refinement nor fine-grained fairness constraints can be expressed in PlusCal.
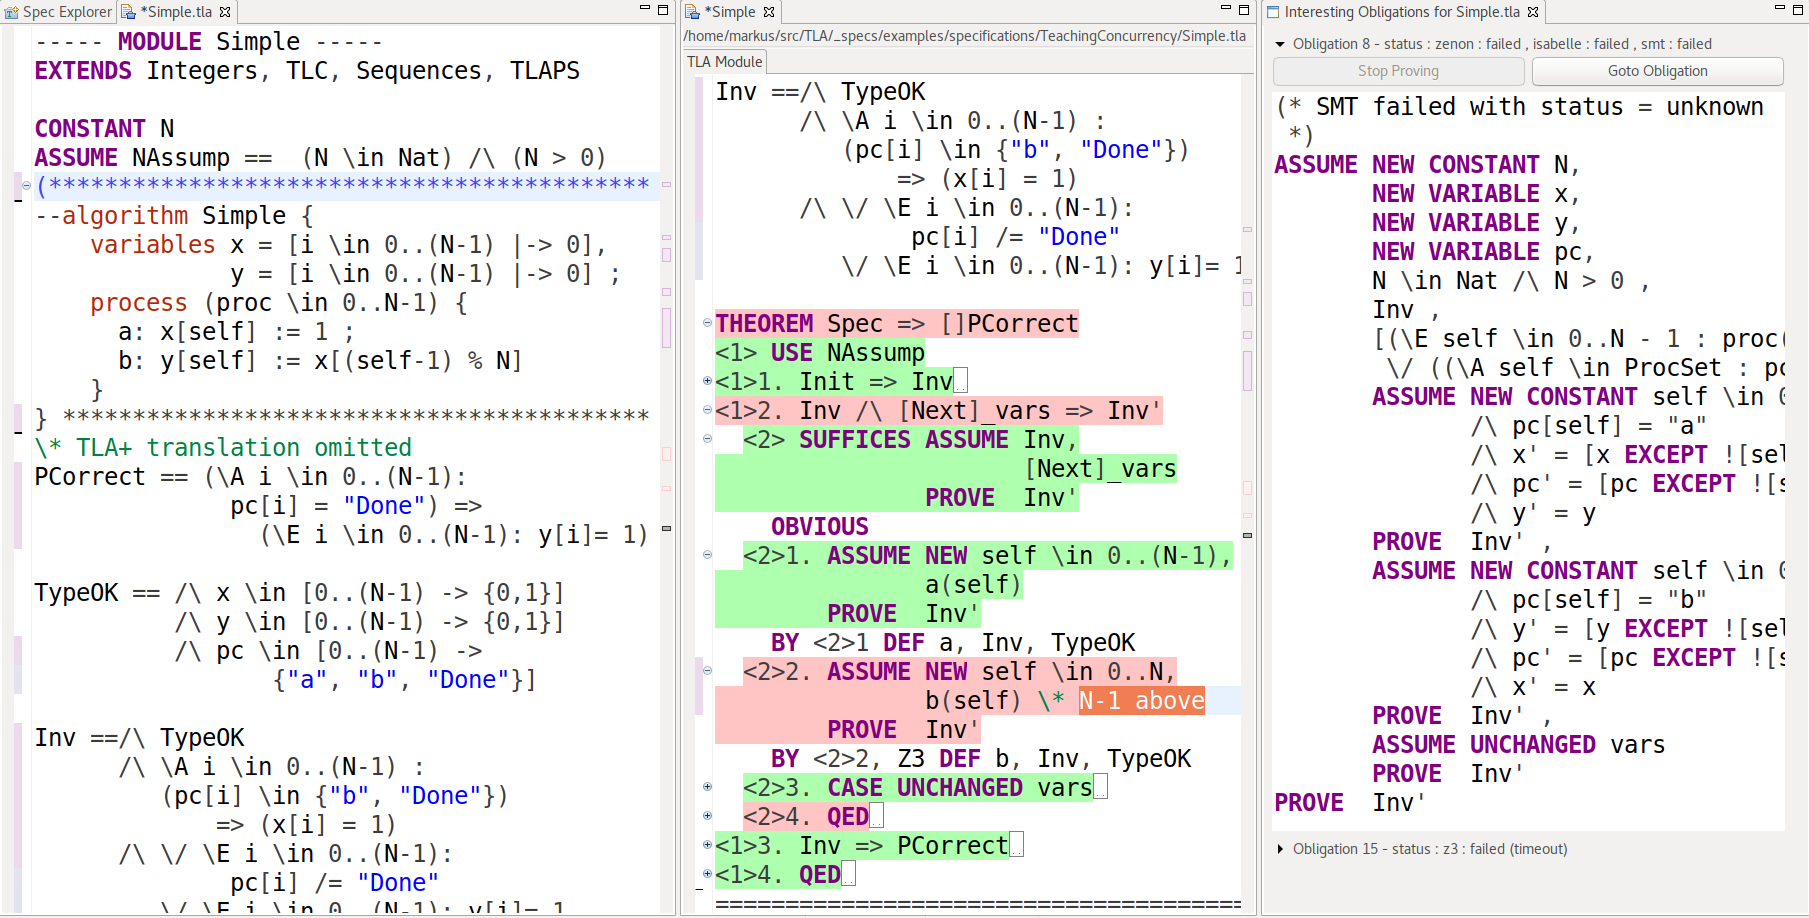
A PlusCal algorithm and its TLA+ translation go in the same TLA+ module (figure 3). The editor has a command to automatically translate a PlusCal algorithm into TLA+. Users can quickly navigate to and from its TLA+ translation, which can help them understand the PlusCal code. Note that PlusCal is designed to make the TLA+ translation easy to read. The exposure to TLA+ is intended to encourage users to learn TLA+. Also, as mentioned above, refinement and some fairness constraints can be expressed only in the TLA+ translation.
Combining a PlusCal algorithm and its TLA+ translation into a single spec poses the risk that they get out of sync unnoticed. To alleviate this problem, a TLC feature of the next Toolbox release will issue a warning if a translation has become stale.333https://github.com/tlaplus/tlaplus/issues/296
As seen in figure 2, a spec editor provides templates for PlusCal expressions.
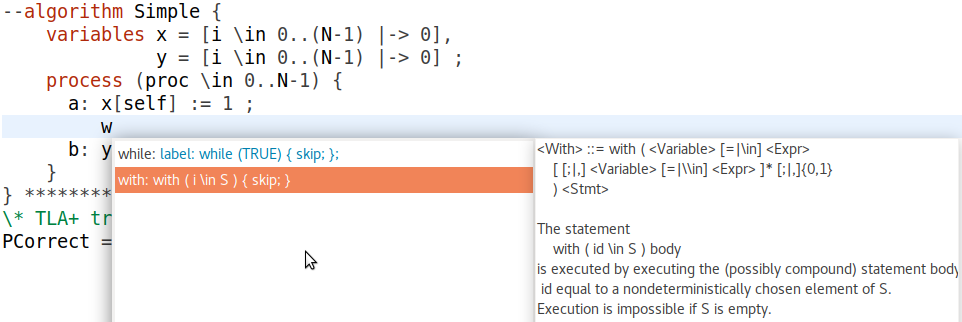
The goal of templates is not to speed up typing — specs are usually short — but to guide novice users by putting the syntactical and semantic documentation of PlusCal expressions at their fingertips. The user experience also resembles that of familiar programming IDEs, but the lack of types and type inference limits word completion to the syntax level.
2.2.2 Proofs
TLA+ proofs are not written interactively but are constructed hierarchically [8]. Hierarchical proofs enable a non-linear proof style: Individual steps of a proof can be checked independently of other steps. Also, steps can be decomposed into simpler steps should TLAPS fail to prove the higher-level steps.
In figure 3 we see a hierarchical TLA+ proof where lower-level, proven steps have been collapsed. The green color indicates steps that TLAPS proved successfully while red indicates steps that it failed to prove. A failed step is additionally displayed in the logging part, showing exactly what TLAPS was trying to prove (see the right-hand side of figure 3).
A wizard exists to decompose a step to be proved into a sequence of simpler steps, based on the logical structure of the step. For example, a step asserting the conjunction of properties can be proved by steps that each assert one of those properties. The wizard can add these steps as a lower level proof, and they can be verified separately with TLAPS. [3].
TLAPS maintains a fingerprint of every proof obligation so that it does not need to re-prove previously verified obligations. A user tells TLAPS to forget fingerprints from the Toolbox.
Unlike TLC, which is part of the Toolbox, users have to manually install TLAPS. The Toolbox will automatically find the TLAPS installation.
2.3 Model
TLAPS can verify specifications with an infinite set of possible states. The explicit-state model checker, however, would never finish if a user tries to verify a spec with an infinite state space. A primary goal of TLC is that the spec need not be modified to be checked. Instead, a TLC model restricts the spec’s state space to a finite set of possible states by assigning concrete values to parameters and by stating additional bounds. To gain higher confidence, users typically check a spec on many separate models.
The Toolbox represents a TLC model by a model part, which also contains settings for how TLC should be executed. Seasoned users will tune these settings and define additional checks that TLC should perform.
Contrary to the proof system (section 2.2), the Toolbox provides a structural representation of a model by grouping related inputs into tabs and sections. To guide users, inputs are validated when entered. Warnings and suggested fixes are placed next to the inputs. The model is kept in sync with the spec so that relevant changes, for example the addition or removal of a constant, are automatically reflected in the model.
A model is associated with its respective spec in the Spec Explorer. The Spec Explorer also maintains a history of model checker runs, each history entry storing the model checking result and snapshots of the spec’s modules (figure 1 and section 2.3.2). A user can compare modules, which for example will remind her of the differences between long model checking runs.
A model is stored as an XML file in the file system, so it can be checked into a source code management system. This way, the user can reproduce model checking runs.
2.3.1 CloudTLC
With CloudTLC users can shift from a primarily sequential model checking workflow to one where any number of models can be checked concurrently. Additionally, CloudTLC scales up explicit-state model checking to more powerful hardware. This way, design variants or competing optimizations can be quickly explored in parallel. This can be used either to reduce overall specification time or to enable a broader exploration of the design space.
CloudTLC provisions a set of cloud instances and runs TLC on them. If a user opted to run model checking on multiple instances, CloudTLC starts TLC in distributed mode [5]. Upon completion of model checking, CloudTLC instances terminate automatically after a grace period. If the user keeps the Toolbox open, it will show model checking progress and final results. Alternatively, the Toolbox may be disconnected at any time; CloudTLC sends the results to a user-provided email address in a format that can be imported into the Toolbox. In other words, CloudTLC is completely transparent: Toolbox features such as the Profiler or Trace Explorer (sections 2.3.3 and 2.3.4 below) work as if model checking runs locally.
CloudTLC’s startup time is dominated by the time it takes an IaaS provider to spin-up instances. To reduce startup time, subsequent model checker runs re-use previously provisioned instances unless they have already terminated. CloudTLC can also be started by running the Toolbox in command-line mode. This is useful for automation such as running the TLC performance test suite (section 3.2).
2.3.2 Results
The status and progress of TLC checking a model is shown on the results part. The results include the start and end wall-clock time, the probability of an incomplete state space exploration due to distinct states falsely being considered equivalent, as well as global state-graph and action-level statistics. State-graph statistics are:
-
•
: The depth that TLC has reached in its exploration of the state-graph
-
•
: The cardinality of the set of reachable vertices of the state-graph
-
•
: The number of states examined by TLC as part of model checking
The ratio of distinct to examined states approximates the degree of the state-graph. Action statistics — further discussed in section 2.3.3 — are similar to global state-graph statistics, except that they are reported at the level of individual TLA+ actions and the diameter is undefined.
Plots of some statistics can be shown that indicate the remaining model checking time.444The cardinality of the set of unexplored states plotted over time looks like a parabola. Furthermore, a state-graph may be visualized graphically. However, this is possible only for small graphs due to the inherent complexity of laying out directed graphs. The description of a graph can be exported to specialized tools such as Cytoscape [21].
2.3.3 Profiler
Engineers primarily rely on model checking, not theorem proving, and they want to verify large models. This makes them not only users of CloudTLC (section 2.3.1), but also of the Toolbox’s Profiler. Profiling a TLA+ model and its spec produces four different types of data:
-
•
: The number of times a TLA+ expression is evaluated
-
•
: The number of operations performed to enumerate the elements of a set or sets, should enumeration be required to evaluate an expression
-
•
: The number of states a particular TLA+ action caused to be examined
-
•
: The number of distinct states an action produced
We call the first two data types evaluation statistics and collect them at the global as well as at the call-chain level. To explain their differences, we assume an identical, constant cost for all expressions. This way, a user can identify the biggest contributor to overall model checking time simply by looking at the number of invocations. However, some expressions require the model checker to explicitly enumerate data structures for which costs are the quantitative measure: For example, let be the set of natural numbers from to such that in the TLA+ expression . The cost of evaluating the expression is determined by the number of operations required by TLC to enumerate all the subsets in (the powerset of ). This expression will be a major contributor to model checking time even if its number of invocations is low.
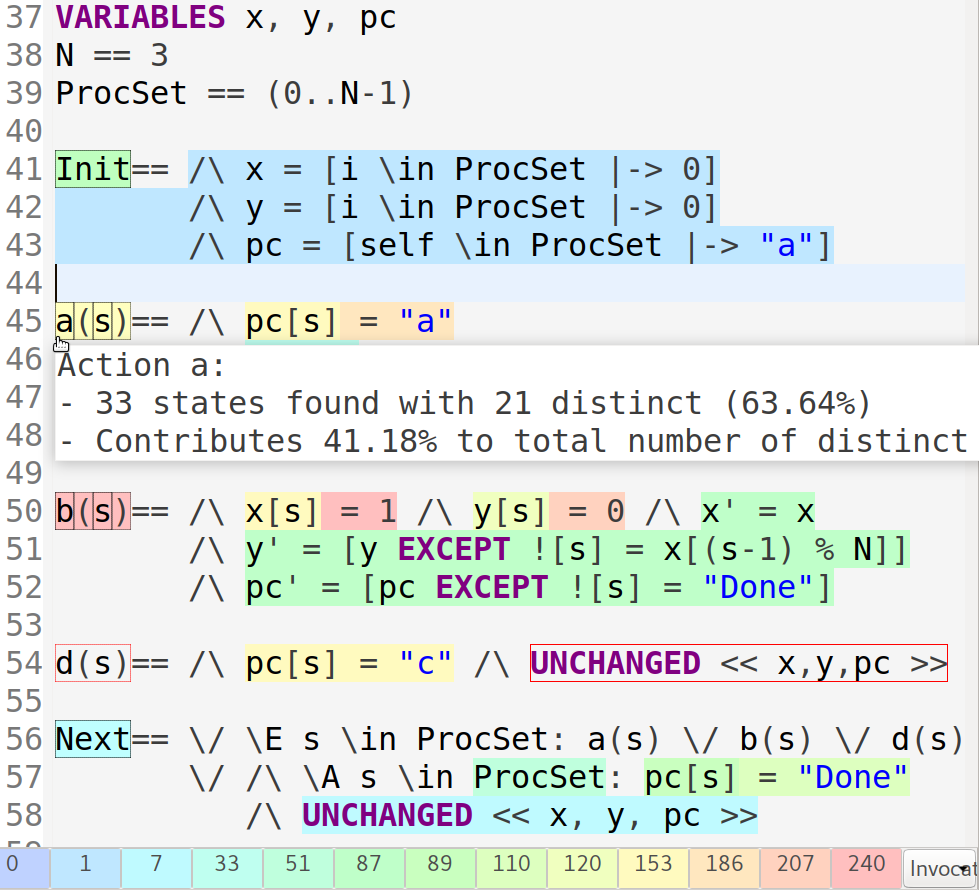
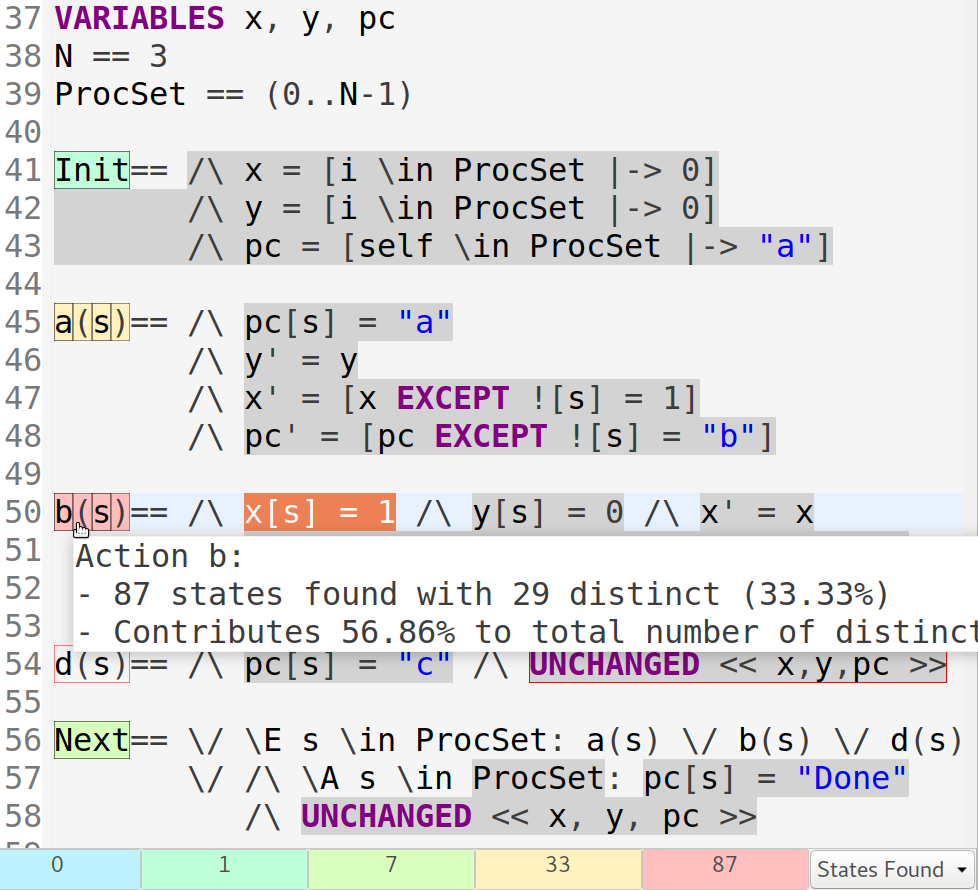
With action statistics, a user can pinpoint the source of state space explosion at the action level. To explain their application, consider figure 4a, which is a deliberately inefficient TLA+ translation of the algorithm shown in figure 3. The enablement predicate on line 50 of action , consisting of the two expressions and , has been globally invoked the most. Related, action has been found to produce 87 states of which only 29 are distinct (see hover help in figure 4b). In contrast, action is much more efficient in terms of its total states to distinct states ratio. This draws the user’s attention to the enablement predicate of action , which is weaker compared to the predicate of action . The enablement predicate of is true of states for any value of . While this does not violate the specification’s safety properties, changing the enablement predicate of to puts the ratio of total to distinct states in the region of the same ratio of action . It also corresponds to the regular translation of the algorithm. Additionally, the enablement of action on line 54 is evaluated 153 times. Yet, the numbers of total and distinct states are zero as indicated by the red boxes. This suggests that there is either an error in the spec, or else that the user can delete action .
As shown in figure 4a and 4b, the Toolbox highlights expressions with colors chosen from a one-dimensional heatmap based on an expressions’ corresponding evaluation statistic. Expressions with the highest number of invocations will be highlighted with a red color whereas those with no invocations will be dark blue. The heatmap appears as a legend at the bottom of the editor and reveals the corresponding editor location when clicked. Users can switch what the highlighting is based on between invocation counts, costs, and the number of examined or distinct states. Additionally, users focus on a single call-chain when they select an expression in the editor.
In summary, the Profiler makes different kinds of inefficiencies explicit. For those inefficiencies related to the evaluation of expressions, the model provides a way for users to override TLA+ operators with more efficient variants. An even more extreme optimization is to override TLA+ operators with equivalent Java functions. Action statistics expose weaknesses in enablement predicates or spec errors.
The Profiler requires neither the specification nor the model to be modified to collect statistics. However, profiling has a non-negligible performance overhead and should be disabled when checking large models. Profiling is unavailable when TLC runs in distributed mode.
2.3.4 Trace Explorer
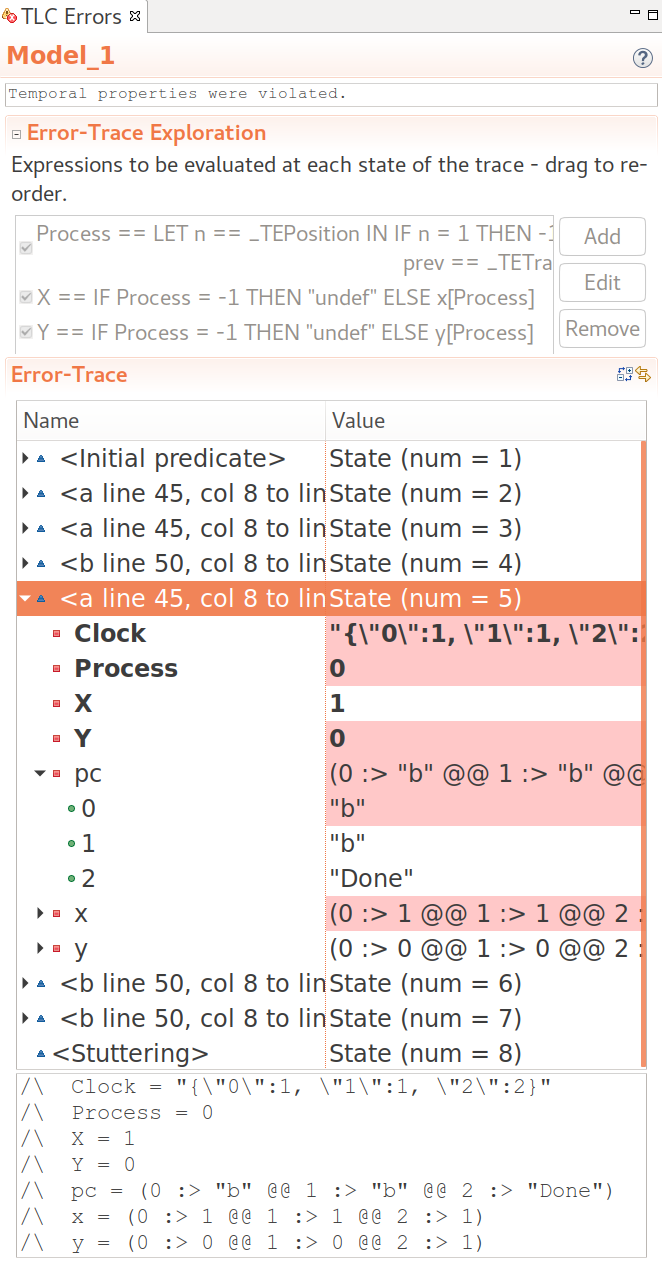
Should model checking find a violation of any of the stated safety or liveness properties, the corresponding error trace will be displayed in the Trace Explorer as shown in figure 5. An error trace is a sequence of states, and a state is an assignment of values to variables.
The Trace Explorer colors the variables of a state that have changed from the predecessor state. Navigating from a state in the trace to the location in the editor of the corresponding TLA+ action (and if applicable, the corresponing PlusCal expression) is also supported. The Trace Explorer can handle traces with thousands of states.
To study traces, the Trace Explorer supports the evaluation of trace expressions. A trace expression can be a function of a state or a pair of successive states [7, p. 4-5]. A trace expression may optionally be named to facilitate expression composition. A trace expression may be built from all operators in the scope of the root module. In addition, two built-in operators are available:
- TEPosition
-
Equal to the position of the corresponding state in the error trace
- TETrace
-
A TLA+ sequence of states such that TETrace[ TEPosition] equals the state at position TEPosition in the error trace
Note that these operators increase the expressiveness of trace expressions such that they can be formed from the collection of variables of all states of the trace. For example, trace expressions can compare the values of variables of two or more arbitrary states (see trace variables Clock, Process, X, and Y in figure 5 and listing 1). Users can write such expressions to format traces that can be directly copied to third-party tools [6]. Internally, the Toolbox evaluates trace expressions by generating a special TLA+ module that is checked by using the functionality discussed in section 3.1.
3 Toolbox Architecture
We are trying to make the Toolbox an industrial strength integrated development environment with support for all aspects of writing TLA+ specs. If possible, features are implemented at the back-end layer to satisfy command-line aficionados, to support re-use, and to integrate with automation. Features not core to TLA+, such as visualizations of the state-graph and error traces, are left to specialized third-party tools to which relevant information is exported in compatible data formats.
To attract a wide range of users, the Toolbox is compatible with the three most common operating systems: macOS, Windows, and Linux. The Toolbox requires no external dependencies except to generate PDFs. Primarily, this is because the Toolbox is written in Java and built on the Eclipse Rich Client Platform (RCP) [16]. RCP provides a number of IDE features such as a help system, a desktop notification system, and an update manager. RCP also defines usability guidelines and best practices that, while not always applicable to a formal integrated development environment, help enforce a consistent user experience. Others can add functionality by contributing extensions and OSGi services [15].
Building the Toolbox on top of RCP is not without drawbacks. RCP follows a quarterly release schedule. Upgrading the Toolbox to a new RCP release frequently leads to subtle bugs that are not detected by our tests. The rate at which macOS, Windows, and Linux innovate forces us to upgrade. This causes significant manual work.
The Spec Explorer (section 2.1) is the primary interface to work with specs. However, users can also create, move, or modify files at the OS level. This feature causes many incompatibilities and bugs, since RCP wants files to be modified through its file system abstraction. As a result, the Spec Explorer and editors get out of sync with the actual files. In hindsight, file operations should have been restricted to the Toolbox or proper support should have been added to RPC; the workarounds at the Toolbox layer continue to cause bugs.
Throughout the development of the Toolbox, it has become clear that RCP has to be considered a whitebox component. In other words, projects built on top of RCP have to accept the burden of co-ownership and contribute to its development.
3.1 Back-end integration
For latency reasons, the short-lived lightweight TLA+ tools such as the SANY parser, the PlusCal translator, and the pretty-printer are executed as part of the Toolbox process. Extending this functionality is possible only via extensions and OSGi services, as discussed in section 3. However, the heavyweight model checker and proof system spawn as separate processes. There are three reasons to spawn separate, per-invocation processes:
-
•
A back-end cannot be executed in-process because it is implemented in a language that cannot execute on the Java VM. This is true for TLAPS, which is written in OCaml.
-
•
Process separation acts as a circuit breaker; a crash of either a back-end or the Toolbox does not interfere with the other process. For example, we do not want a Toolbox crash to also crash a long-running model checker run. This safeguard is especially important while a back-end matures.
-
•
The Java VM’s runtime parameters are fixed after Toolbox startup. Running a back-end as part of the Toolbox causes the back-end to inherit the Toolbox’s parameters. The resource requirements of back-ends are usually different from those of the Toolbox — for example, model checkers have very high resource requirements (section 2.3.1).
3.1.1 Toolbox to Back-end
The Toolbox relies on an RCP framework to provide user-visible progress reports and cancellation support for the back-ends that it spawns.555https://www.eclipse.org/articles/Article-Concurrency/jobs-api.html For that, back-ends have to implement an adapter that sets command-line parameters. The primary parameters include the path to the TLA+ spec. In addition, parameters may include performance-specific settings such as the number of cores a back-end may use.
The Toolbox serializes a subset of the model into a plain-text configuration file (section 2.3). This file contains the TLA+ behavior spec as well as the invariants and properties to be checked. It also includes definitions for all declared constants. Optionally, it may contain definition and operator overrides as well as state and action constraints. The configuration is not specific to TLC and is therefore reusable by other back-ends.
3.1.2 Back-end to Toolbox
The Toolbox parses back-end progress and results with a framework that is connected to the Toolbox UI via the Model-View-Presenter (MVP) design pattern.666https://en.wikipedia.org/wiki/Model-view-presenter
A back-end specific parser has to read a stream of back-end output that can consist of variably sized chunks of incomplete print statements. For efficiency reasons — error traces occasionally contain thousands of states — and to simplify the implementation, parsing is based on special tokens and constants that wrap the output. Parsing is performed in three stages:
-
1.
It buffers chunks of characters into lines separated by a newline character
-
2.
It identifies the lines that belong to a multi-line statement with the help of special tokens
-
3.
It de-serializes a multi-line statement into Java objects via MVP
Listing 1 shows an example of a multi-line statement. In some cases, such as when error traces are serialized, the multi-line statement is partially formatted to be valid TLA+.
In summary, the back-end integration is at a low enough level to free back-ends from providing high-level interfaces such as a REST API. Instead, a back-end’s existing text-based IO can be reused. The flexibility of this low-level integration comes at a price: the lack of compile-time validation makes the evolution of back-ends more difficult. For the model checker, this problem is alleviated by following a synchronized release schedule. However, the evolution is still error-prone and requires significant testing of the back-end and the Toolbox (section 3.2). Performance problems, related to parsing large outputs, require low-level implementation optimizations. The maturity of the TLAPS back-end means that its inputs and outputs seldom change. The Toolbox does not support graceful back-end termination because the integration makes this impossible. Instead, the Toolbox could control TLC via its existing Java Management Extension [18].
3.1.3 CloudTLC Back-end
tbToolbox \newinst[.5]tkToolkit
[1.5]iaasIaaS \newinst[.5]instInstance
[.7]mailInbox
tbDeploytk \messtkStart instancehttpsiaas \mess[1]iaasIPhttpstk
tbProvisiontk \messtkScript, Config, Authsshinst \mess[1]instacksshtk
tbLaunchtk \messtk, , sshinst {messcall}instModel-Checkinst \mess[1]instProgresssshtk \messtkChunkstb \mess[1]instResultsshtk \messtkChunkstb \messinstResultsmtpmail
instTerminateinst \messinstAuthhttpsiaas
mailImportmail \messmailResulttb
CloudTLC has been implemented directly as part of the Toolbox (section 2.3.1 above). CloudTLC is built on top of the frameworks discussed in section 3.1 and a multi-cloud toolkit that provides an abstraction from individual IaaS providers.777https://jclouds.apache.org/ The sequence diagram in figure 6 shows the interaction between the building blocks of CloudTLC:
- Deploy
-
The Toolbox queries the chosen IaaS provider via https for specifically tagged CloudTLC instances. If the query result is empty, the Toolkit requests the IaaS provider to launch the given number of instances. If it is non-empty, the Toolbox starts the returned instances and skips the next provisioning phase.
- Provision
-
The Toolbox configures the stock OS and installs dependencies of the model checker. Authentication credentials, needed by later phases of CloudTLC, are copied from the Toolbox’s environment variables. The provisioning phase directly communicates with each instance via ssh.
- Launch
-
The Toolbox copies the spec and the model to the instance and starts the model checker. The model checker continuously streams its output to the local Toolbox. TLC also sends the result to a user-provided email address.
- Terminate
-
The instance will wait for a grace period for subsequent connection attempts. Afterwards, it terminates itself if and only if email delivery has succeeded in the previous phase. Some IaaS providers require the termination request to be authenticated, in which case the previously mentioned credentials are used.
Because the hardware specifications of cloud instances are known during development, the model checker can be optimally deployed and configured. For example, the OS and TLC runtime parameters are hard-coded. CloudTLC has been implemented for TLC, but it can be easily extended to new back-ends. Likewise, it currently supports only Microsoft Azure, Amazon AWS, and Packet Net. Support for other IaaS providers is possible because of the multi-cloud toolkit.
3.2 Testing
The Toolbox development follows a combination of the test-driven and the test-last methodologies. UI tests are written by Toolbox developers and dedicated test engineers. A test suite of 178 unit, functional, and end-to-end tests validates the main workflows of the Toolbox. However, the tests do not cover TLAPS. Dedicated test suites exist for the model checker and the proof system.
The Toolbox’s test execution is fully automated and runs on macOS, Linux, and Windows as part of the automated build. Builds are executed by a continuous integration system. While test results do not get published, the build output of the continuous integration system is publicly available.888https://nightly.tlapl.us/ A test suite of user-provided, real-world specifications continuously checks the performance of TLC executed with CloudTLC. Overall, the test suites provide a useful safety measure to catch functional and performance-related regressions early in the development life-cycle.
4 Conclusion
Toolbox users write, model check, and deductively reason about TLA+ specs. The Toolbox has two features, which formal IDEs usually do not provide:
-
•
CloudTLC connects the TLA+ Toolbox with cloud computing to enable users to check larger models and to explore the design space faster
-
•
The Profiler assists users in identifying computationally expensive TLA+ expressions and to diagnose state space explosion
The discussion of its architecture and test infrastructure should enable others to add new Toolbox features and will hopefully inspire the development of more formal IDEs.
Whether or not the Toolbox can be considered successful in making the TLA+ specification language more widely used is difficult to answer.999The Toolbox asks users to share TLC executions statistics and to identify Toolbox installations. Its previous release has been downloaded approximately 20k times whereas the standalone model checker has seen one-tenth of this number. The Toolbox has users at companies such as Amazon and Microsoft and it has an active community of contributors.
5 Future Work
Proofs
The main challenge in writing an invariance proof is finding the inductive invariant. Trying to prove an invalid inductive invariant wastes a lot of time. Model checking is useful to validate inductive invariant candidates despite the enormous state space attached to it [12]. The trick is to randomly select and check a subset of all type-correct initial states. With this approach, repeated model checking finds violations with high probability after only a few runs. However, the Toolbox does not aggregate the results of repeated model checking.
Taming state space explosion by randomly selecting subsets of all reachable states is also useful to validate for model checking lower-level proof steps [13]. The Toolbox should provide help for doing this.
Profiler
Engineers have expressed interest in overriding inefficient expressions with Java functions. This is not easy to set up, especially for users unfamiliar with Java. Besides the setup of overrides, it is an open question how users can assert the equivalence of Java functions with the TLA+ expression it is overriding.
Trace Exploration
The Trace Explorer is good for finding the source of an error, but its textural representation is not very good for understanding the dynamics of a system. Schultz pioneered a graphical trace animator that visualizes traces at the level of the problem domain [20]. The layout is specified in TLA+, so users need not learn a new visualization language. The next Toolbox release will incorporate this graphical trace animator.
Back-ends
Konnov et al. built a symbolic model checker for TLA+, the results of which are encouraging [4]. We wish to integrate this model checker into the Toolbox as a new back-end. However, the symbolic model checker requires users to provide type information when its type inference fails. How the Toolbox can help users to work with types is unclear. Note that the type inference of the symbolic checker could also be used to provide a more powerful completion support in the spec editor.
Acknowledgement
The development of the TLA+ Toolbox is a joint effort of INRIA and Microsoft Research. Simon Zambrovski wrote and maintained the initial version of the Toolbox. The reviewers provided useful comments and suggestions.
References
- [1]
- [2] Kaustuv C. Chaudhuri, Damien Doligez, Leslie Lamport & Stephan Merz (2008): A TLA+ Proof System. arXiv:0811.1914 [cs]. Available at http://arxiv.org/abs/0811.1914.
- [3] Denis Cousineau, Damien Doligez, Leslie Lamport, Stephan Merz, Daniel Ricketts & Hernán Vanzetto (2012): TLA+ Proofs. arXiv:1208.5933 [cs], 10/dgpd. Available at http://arxiv.org/abs/1208.5933.
- [4] Igor Konnov, Jure Kukovec & Thanh-Hai Tran (2019): TLA+ Model Checking Made Symbolic. Proceedings of the ACM on Programming Languages 3(OOPSLA), pp. 1–30, 10.1145/3360549. Available at http://dl.acm.org/citation.cfm?doid=3366395.3360549.
- [5] Markus Alexander Kuppe (2014): Distributed TLC. Available at http://tla2014.loria.fr/slides/kuppe.pdf. (Accessed 2016-09-06).
- [6] Markus Alexander Kuppe (2019): Visualizing TLA+ Toolbox Error Traces with ShiViz. Available at https://github.com/tlaplus/tlaplus/issues/267#issuecomment-481951259.
- [7] Leslie Lamport (1994): The Temporal Logic of Actions. ACM Transactions on Programming Languages and Systems 16(3), pp. 872–923, 10.1145/177492.177726. Available at http://portal.acm.org/citation.cfm?doid=177492.177726.
- [8] Leslie Lamport (1995): How to Write a Proof. The American mathematical monthly 102(7), pp. 600–608, 10.2307/2974556. Available at http://www.jstor.org/stable/2974556.
- [9] Leslie Lamport (2003): Specifying Systems: The TLA+ Language and Tools for Hardware and Software Engineers. Addison-Wesley, Boston.
- [10] Leslie Lamport (2009): The PlusCal Algorithm Language. In Martin Leucker & Carroll Morgan, editors: Theoretical Aspects of Computing - ICTAC 2009, 5684, Springer Berlin Heidelberg, Berlin, Heidelberg, pp. 36–60, 10/dcd6gv. Available at http://link.springer.com/10.1007/978-3-642-03466-4_2.
- [11] Leslie Lamport (2012): How to Write a 21st Century Proof. Journal of Fixed Point Theory and Applications 11(1), pp. 43–63, 10.1007/s11784-012-0071-6. Available at http://link.springer.com/10.1007/s11784-012-0071-6.
- [12] Leslie Lamport (2018): Using TLC to Check Inductive Invariance. Available at http://lamport.azurewebsites.net/tla/inductive-invariant.pdf. (Accessed 2018-08-16).
- [13] Leslie Lamport (2019): Proving Safety Properties. Available at https://lamport.azurewebsites.net/tla/proving-safety.pdf.
- [14] Leslie Lamport & Lawrence C. Paulson (1999): Should Your Specification Language Be Typed. ACM Transactions on Programming Languages and Systems 21(3), pp. 502–526, 10.1145/319301.319317. Available at http://portal.acm.org/citation.cfm?doid=319301.319317.
- [15] D. Marples & P. Kriens (Dec./2001): The Open Services Gateway Initiative: An Introductory Overview. IEEE Communications Magazine 39(12), pp. 110–114, 10.1109/35.968820. Available at http://ieeexplore.ieee.org/document/968820/.
- [16] Jeff McAffer, Jean-Michel Lemieux & Chris Aniszczyk (2010): Eclipse Rich Client Platform, 2nd ed edition. The Eclipse Series, Addison-Wesley, Upper Saddle River, NJ. OCLC: ocn262433527.
- [17] Chris Newcombe, Tim Rath, Fan Zhang, Bogdan Munteanu, Marc Brooker & Michael Deardeuff (2015): How Amazon Web Services Uses Formal Methods. Communications of the ACM 58(4), pp. 66–73, 10.1145/2699417. Available at http://dl.acm.org/citation.cfm?doid=2749359.2699417.
- [18] J. Steven Perry (2002): Java Management Extensions, 1st ed edition. O’Reilly, Beijing ; Cambridge [Mass.].
- [19] Amir Pnueli (1977): The Temporal Logic of Programs. IEEE, pp. 46–57, 10.1109/SFCS.1977.32. Available at http://ieeexplore.ieee.org/lpdocs/epic03/wrapper.htm?arnumber=4567924.
- [20] William Schultz (2018): An Animation Module for TLA+. Available at https://easychair.org/smart-slide/slide/8V76#.
- [21] P. Shannon (2003): Cytoscape: A Software Environment for Integrated Models of Biomolecular Interaction Networks. Genome Research 13(11), pp. 2498–2504, 10.1101/gr.1239303. Available at http://www.genome.org/cgi/doi/10.1101/gr.1239303.
- [22] Yuan Yu, Panagiotis Manolios & Leslie Lamport (1999): Model Checking TLA+ Specifications. In Gerhard Goos, Juris Hartmanis, Jan van Leeuwen, Laurence Pierre & Thomas Kropf, editors: Correct Hardware Design and Verification Methods, 1703, Springer Berlin Heidelberg, Berlin, Heidelberg, pp. 54–66, 10/fr3fsd. Available at http://link.springer.com/10.1007/3-540-48153-2_6.