A geomagnetic filter for the Fermi-LAT background
Abstract
One of the unsolved questions in gamma-ray astronomy is whether the extragalactic gamma-ray background is of the discrete-source origin. To respond to this question, one first needs to reduce the data by differentiating charged particles from gamma rays. This procedure is usually performed on the basis of the detector responses. In this paper, we showed that the geomagnetic shielding effect at GeV energies can, to some extent, be used for this purpose for gamma-ray telescopes in a low Earth orbit. We illustrated this method by applying it to the Fermi-LAT data. To partially decompose the charge-filtered background, we examined the contribution from star-forming galaxies by implying a radio/gamma connection in consideration of next generation radio surveys.
keywords:
gamma-rays: diffuse background, gamma-rays: galaxies1 Introduction
It is recognised that numerous non-thermal sources emit in the broad frequency range from the radio band to the -ray band. Next-generation, wide field, radio surveys will greatly increase the number of known non-thermal sources allowing us to make a significant step towards resolving the extragalactic radio source background (e.g., Prandoni & Seymour, 2015). High sensitivity and fine angular resolution of radio surveys allow studies of sources too faint for detection in the -ray band. Sources with fluxes below 1 millijansky (mJy) at 1.4 GHz contributing to the faint radio source population include, amongst others, distant star-forming galaxies (SFGs) which split into populations of starburst galaxies (SBGs) and normal late-type galaxies (hereafter normal galaxies) (for a review, see Padovani, 2016). The synchrotron mechanism involving cosmic-ray (CR) electrons spiralling in magnetic fields is responsible for radio emission from SFGs in the GHz frequency range, while the decay of neutral pions generated by the interactions of CR hadrons with the interstellar medium (ISM) in SFGs is responsible for most of their -ray emission.
Both the -ray background and sub-mJy radio source population can to a large extent be produced in SFGs. It is probable that SFGs in the local universe () can be significant contributors to the -ray background (e.g., Linden, 2017) at energies above 1 GeV and below 10 GeV (see, Fig. 9 from Linden, 2017). Moreover, a significant contribution to the -ray background at GeV can come from SBGs (Thompson et al., 2007) and normal galaxies (Fields et al., 2010) at the redshift of peak star formation . On the other hand normal SFGs are most likely the dominant component of the population of sub-mJy radio sources (e.g. Seymour et al., 2008; Bonzini et al., 2013).
Photons with energy below 10 GeV can travel over cosmological distances from their sources to the Earth’s orbit allowing us to study physical processes that occur in distant sources (e.g., Abdo et al., 2010a). Unprecedentedly accurate measurements of the isotropic -ray background are available with the Fermi Large Area Telescope (Fermi-LAT) Abdo et al. (2010c); Ackermann et al. (2015) onboard the Fermi satellite. To determine cumulative -ray emission coming from sources that are too faint to be individually probed, one needs to separate rays from other species of particles that pass through the Fermi-LAT detectors and contribute to the isotropic particle background. At present, responses of the Fermi-LAT detectors to registered events are used to identify -ray-like ones.
We developed an algorithm to further remove charged particles from the Fermi-LAT GeV -ray-like background. The algorithm takes into account that the rate of charged particles depends on the geomagnetic position of the Fermi spacecraft owing to the fact that the geomagnetic field deflects the low-energy charged particles back into space. Given Fermi’s orbit, the geomagnetic cut-off for electrons spans from 6 to 15 GeV. We binned events detected by Fermi-LAT into bands in the McIlwain L parameter which describes magnetically equivalent positions with respect to an incoming charged particle. We compared the particle fluxes measured in these bins and argued that the ones with the lowest measured particle flux are filtered by the Earth’s magnetic field. Gamma rays corresponding to this McIlwain L bin constitute the charge-filtered Fermi-LAT background. In the Fermi-LAT Pass 8 photon data, in particular, for events from the SOURCE and CLEAN classes, we found evidence for both
(i) the geomagnetic shielding and
(ii) the east-west effect
which are expected only for charged particles.
We used the values of the WP8CTAllProb and WP8CTCalTkrProb parameters recorded in the extended Fermi-LAT files each corresponding to a probability that the given particle is a ray (versus a cosmic ray) as estimated on the basis of the LAT tracker (TKR) and calorimeter (CAL) variables both with or without accounting for the anti-coincidence detector (ACD), respectively. We computed their mean probability in every McIlwain L bin and in every energy band and established that the low mean probabilities of WP8CTCalTkrProb correspond to those bins and bands in which the fluxes reveal evidence for the effects (i) and (ii). It shows that the geomagnetic field serves as a natural filter of charged particles.
We compared the measured charge-filtered background flux with the -ray fluxes derived on the basis of the radio source counts to check if various populations of SFGs can provide an explanation for the extragalactic -ray background. We calculated the fluxes with -ray energies of 3 GeV to 8 GeV from the SFGs in the framework of scenarios in which (1) their radio source counts are described by the model based on semi-empirical simulations by Wilman et al. (2008) and (2) both the SFGs in the local universe () and distant SFGs (including those at the redshift of peak star formation) are similar in their observational radio and -ray properties to the nearby, paradigmatic SFGs. Under these assumptions the total contribution produced in SFGs is between 10% and 25% of the total unresolved background flux in this energy band. Thus, if distant SFGs are dominant contributors then the physical properties of galaxies significantly evolved between the redshift of peak star formation and today, or the Jy radio population of SFGs is larger than simulated, an assumption that may be confirmed through deep radio surveys.
2 Fermi-LAT observations and analysis
2.1 Filters of astroparticles
The Fermi-LAT is a wide-field-of-view, pair-conversion, -ray telescope with a TKR which consists of tungsten converter layers and silicon tracker planes and with a CAL which contains an array of scintillating crystals. A segmented ACD made of plastic scintillator tiles is the outermost detector layer in the telescope and sensitive to incident CR charged particles, but not to rays. Being a pair-conversion -ray telescope, the Fermi-LAT is also an electron-positron detector. The Fermi-LAT has been scanning the sky continuously since August 2008 providing all-sky coverage every 3 hours (2 spacecraft orbits).
The rate of CR background events passing through the Fermi-LAT is 2-4 kHz and is dominated by CR protons with smaller helium, electron, and positron components (Atwood et al., 2009). With a primary goal of detecting rays, a set of particle discriminators are applied to events collected by Fermi-LAT in order to reduce the residual background of misclassified charged particles to the rate of 1 Hz, which is similar to that of the extragalactic -ray background. These discriminators are based on the response of the Fermi-LAT instrument to detected events including a signal from the ACD in conjunction with the tracks found in the TKR and a match of the shower profile in three dimensions in both the TKR and CAL.
The Fermi-LAT instrument is on board the Fermi spacecraft which is in a nearly circular orbit of 565 km altitude with an orbital inclination of 25.6∘. The orbital parameters of the Fermi satellite define the geomagnetic latitude range over which the data are accumulated and also the range of geomagnetic cut-off values (e.g. Ackermann et al., 2010, 2012b). At energies above a few GeV, the LAT has a point-spread function (PSF) narrower than 1.0∘ (Ackermann et al., 2013; Prokhorov & Moraghan, 2016) allowing us to remove the contribution of known -ray point sources from the total observed signal and therefore to use a significant fraction of the sky to evaluate the unresolved -ray background.
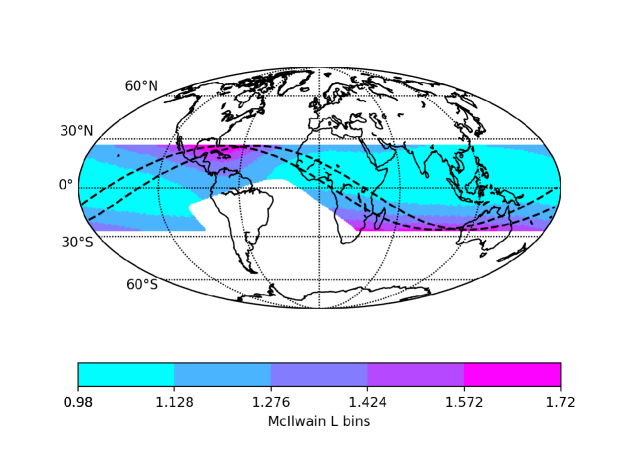
Magnetically equivalent positions with respect to an incoming charged particle correspond to a set of the geomagnetic field lines crossing the Earth’s magnetic equator at a number of Earth-radii equal to the McIlwain L-parameter value. The inclination of the Fermi satellite’s orbit fixes the range of McIlwain L values to 0.98-1.72. Taking into account that the geomagnetic energy cut-off shifts towards lower energies with increasing McIlwain L parameter, the contribution of charged particles above a given energy increases with the McIlwain L-parameter (for the sake of illustration, see Figure 13 from Ackermann et al., 2010). The shielding effect of the geomagnetic field is therefore stronger (weaker) for smaller (larger) values of McIlwain L-parameter. We show that the motion of the Fermi satellite orbiting the Earth provides us with a tool for filtering charged particles hitting the Fermi-LAT’s detectors during the time intervals with a high charged-particle rate. Two arbitrary Fermi’s orbits shown in Figure 1 illustrate the fact that the Fermi spacecraft passes the regions corresponding to the highest McIlwain L bin 1.572L1.720.
Moreover, the Earth’s magnetic field, by means of the east-west effect, allows us to distinguish if these charged particles are CR electrons or positrons. This is possible owing to the fact that CR electrons arrive from the eastward direction while CR positrons arrive from the westward direction resulting in an asymmetry in the azimuthal distribution.
2.2 Data reduction
We downloaded the Fermi-LAT Pass 8 (P8R2) photon data from the Fermi Science Support Center FTP Server111http://heasarc.gsfc.nasa.gov/FTP/fermi/data/lat/weekly/. The data accumulated during each week of the Fermi’s science mission are contained in weekly data files (called photon files), while the Fermi spacecraft location/orientation information for each mission week is contained in the spacecraft files. For the data analysis, we used the FERMI SCIENCE TOOLS package222https://fermi.gsfc.nasa.gov/ssc/data/analysis/software/. We selected the data spanning 9.4 yr (August 7, 2008333For the sake of convenience we ignore the short observing week between August 4, 2008 and August 6, 2008. - January 4, 2018) with energies between 3 GeV and 8 GeV at which the contribution from SFGs to the -ray background is expected to be dominant. To avoid contamination from the -ray-bright Earth’s limb, we removed all events with zenith angle larger than 90∘. To exclude time intervals when some spacecraft event has negatively affected the quality of the Fermi-LAT data, we applied the recommended quality cuts, DATA_QUAL>0 && LAT_CONFIG==1. We also applied the cut on McIlwain L-parameter values which are given in the spacecraft location information. To make the statistics larger we selected events converted anywhere in the TKR. We binned the data using the HEALPix package (Górski et al., 2005) into a map of resolution in Galactic coordinates with “RING” pixel ordering. With these settings, the total number of pixels is equal to 786432 (that is ) and the area of each pixel is sr. The resolution of the map is chosen according to the size of the Fermi-LAT PSF in the 3 GeV to 8 GeV energy range.
To analyse the variations of a background flux with the geomagnetic position, we binned Fermi-LAT events in five equidistant McIlwain L bins between 0.98 and 1.72. For each McIlwain L bin, we further binned the Fermi-LAT events in three energy bands, namely, 3-4 GeV, 4-6 GeV, and 6-8 GeV. The choice of energy bands is based on the fact that CR electron rates measured with Fermi-LAT in the lowest and highest McIlwain L bins are affected by non-shielded electrons above 7 GeV and 4 GeV, respectively (see Fig. 13 from Ackermann et al., 2010). Since the Fermi spacecraft spends a fraction of time during every orbit within each of these McIlwain L bins, to compute the fluxes corresponding to each McIlwain L bin we recorded the start and end times at which the spacecraft enters and leaves positions within McIlwain L bins. For each HEALPix pixel and each time interval, we recorded the number of photons and computed the exposure using the gtbin and gtexpcube2 routines. After that we added the values corresponding to the same McIlwain L bin together and obtained the combined count and exposure maps for the five McIlwain L bins.
In the Pass 8 data release, -ray-like event classes with a low residual charged-particle background rate include P8R2_SOURCE, P8R2_CLEAN, P8R2_ULTRACLEAN, and P8R2_ULTRACLEANVETO. The P8R2_SOURCE class is recommended for most of the Fermi-LAT analyses. Above 3 GeV the P8R2_CLEAN class has a lower background rate than P8R2_SOURCE, but is identical to P8R2_SOURCE below 3 GeV. The P8R2_ULTRACLEANVETO class is the cleanest and is recommended for the studying of CR-induced systematics, while P8R2_ULTRACLEAN has a background rate between the rates for the P8R2_CLEAN and P8R2_ULTRACLEANVETO classes. With the goal of identifying the geomagnetic shielding effect of charged particles in the satellite’s low Earth orbit, we compared the results obtained for the P8R2_SOURCE and P8R2_ULTRACLEANVETO classes. To quantify the improvement on the separation efficiency of rays from charged particles, we also show the results for the P8R2_CLEAN class.
In order to evaluate the unresolved -ray background, one needs to mask the known sources of -ray emission. We masked the region between the Galactic latitudes of, , to reduce the contribution of bright diffuse -ray emission from the Galactic plane. We also repeated the analysis applying a broader mask, , to test the uncertainties caused by an intermediate-latitude Galactic foreground emission. We used the Fermi LAT 4-year point source catalogue (Acero et al., 2015), gll_psc_v16.fit, to list coordinates of the known -ray point sources and to mask regions of 2∘ radius centred on the positions of these sources by applying the healpy.query_disc tool. We also masked extended -ray sources, the northern and southern Fermi bubbles and the Large and Small Magellanic Clouds, by excluding HEALPix pixels within the disks of 32∘, 32∘, 7∘, and 5.5∘ radius placed at the centres of these extended sources at Galactic coordinates (Longitude, Latitude) of (358.90∘, 25.0∘), (355.4∘, -29.0∘), (278.75∘, -32.8∘), and (302.20∘, -44.38∘) respectively.
In order to compute the unresolved background fluxes in Section 3.1, we subtracted a pedestal level of high-latitude Galactic foreground emission from the total flux derived after masking the aforementioned point and extended -ray sources. We calculated a pedestal level of the high-latitude Galactic flux by applying the gtmodel routine to the Galactic emission template, gll_iem_v06.fits, provided by the Fermi-LAT collaboration and selecting the north and south Galactic caps with a 45∘ (or 30∘) radius as our regions of interest. The obtained -ray fluxes of high-latitude Galactic emission () are , and (, and ) ph cm-2 s-1 sr-1 for the energy bands of 3-4 GeV, 4-6 GeV and 6-8 GeV, respectively.
3 Fermi-LAT background
3.1 Geomagnetic shielding
We computed the background fluxes in the McIlwain L bins and in the energy bands to check if charged particles are present amongst the detected Fermi-LAT events of the three event classes. The computed fluxes are shown in Table 1. If all particles were -ray photons, one would expect that the fluxes within a given event class and a given energy band are the same for all McIlwain L bins. However, we found that the fluxes for the SOURCE event class and also for the CLEAN event class in the energy bands of 4-6 GeV and 6-8 GeV for large values of McIlwain L-parameter are by a factor of about 2.5-4.0 and 2.3-3.0 higher (see the values shown in bold in Table 1) than the fluxes in the 0.980-1.128 McIlwain L bin for these event classes, respectively, in these two energy bands. The statistical errors on the fluxes in the bins with excesses calculated by the square root of the count number divided by the exposure are and for the regions of and , respectively. The observed excesses in flux are statistically significant. The behaviour of the fluxes with McIlwain L parameter is similar to that which is expected if the shielding effect due to the geomagnetic field plays a significant role in the formation of the observed fluxes.
| Fluxes, cm-2 s-1 sr-1 | ||||
|---|---|---|---|---|
| Event class | McIlwain L bin | 3-4 GeV | 4-6 GeV | 6-8 GeV |
| SOURCE | 0.980-1.128 | |||
| SOURCE | 1.128-1.276 | |||
| SOURCE | 1.276-1.424 | |||
| SOURCE | 1.424-1.572 | 4.58 (4.32) | ||
| SOURCE | 1.572-1.720 | 8.22 (7.75) | 5.98 (5.87) | |
| SOURCE | Combined flux | |||
| CLEAN | 0.980-1.128 | |||
| CLEAN | 1.128-1.276 | |||
| CLEAN | 1.276-1.424 | |||
| CLEAN | 1.424-1.572 | 3.50 (3.45) | ||
| CLEAN | 1.572-1.720 | 7.38 (6.95) | 4.18 (3.99) | |
| CLEAN | Combined flux | |||
| ULTRACLEANVETO | 0.980-1.128 | |||
| ULTRACLEANVETO | 1.128-1.276 | |||
| ULTRACLEANVETO | 1.276-1.424 | |||
| ULTRACLEANVETO | 1.424-1.572 | 1.75 (1.60) | ||
| ULTRACLEANVETO | 1.572-1.720 | 4.27 (4.10) | 1.60 (1.46) | |
| ULTRACLEANVETO | Combined flux | |||
In the presence of a shielding effect, one expects that
(i) if charged particles are present in these data then there are no significant flux variations in the energy band of 3-4 GeV (see Fig. 13 from Ackermann et al., 2010);
(ii) if charged particles are present in these data then flux variations with McIlwain L parameter should occur in the energy bands of 4-6 GeV and to a great degree in the 6-8 GeV band (see Fig. 13 from Ackermann et al., 2010).
Both the expectations (i) and (ii) are in agreement with the results shown in Table 1.
We found that variations in the measured fluxes with McIlwain parameter for the ULTRACLEANVETO class is less pronounced. The fields in Table 1 shown in italics correspond to those contaminated by charged particles for the SOURCE and CLEAN event classes.
We computed the exposure-weighted background fluxes for the SOURCE and CLEAN event classes in the three energy bands by means of a combined analysis of McIlwain L bins. We checked and found that the numbers of detected events in the bins with smaller values of McIlwain L-parameter are higher and their contribution to the combined flux is dominant. However, we also found that the relative differences between the combined fluxes and the fluxes in the lowest McIlwain L bin (that is with the lowest charged particle rate) are as high as % and % for the 6-8 GeV energy band for the SOURCE and CLEAN event classes (and as high as % and % for the 4-6 GeV energy band for these two classes). The statistical errors on these differences are significantly smaller than the systematic ones owing to the fact that the number of events, , in the lowest McIlwain L bin is the largest and the value of for these bins is between 0.011 and 0.017, while the systematic uncertainty of the effective area for the SOURCE class events is estimated to be . The events recorded during the time intervals while the Fermi spacecraft’s geomagnetic position corresponded to the lowest McIlwain L-parameter bin constitute the charge-filtered Fermi-LAT background for the SOURCE and CLEAN classes. The fluxes corresponding to these charge-filtered Fermi-LAT backgrounds are close to (though somewhat higher than) those obtained for the ULTRACLEANVETO class.
We also checked that if one adds events from the CLEAN class in the McIlwain L bin of 0.980-1.128 to events from the ULTRACLEANVETO class in the McIlwain L bins with the L parameter above 1.128 then the event sample will increase by 12-14 per cent compared to the ULTRACLEANVETO sample in the energy bands of 4-6 GeV and 6-8 GeV. The joint sample will be filtered by both the LAT detectors and Earth’s magnetic field.
3.2 Two tests on the origin of excesses
To confirm the charged-particle origin of excesses in the unresolved background flux for the SOURCE and CLEAN event classes, we performed two tests based on (1) a search for the east-west effect in the data and (2) estimators which give a probability of particle events to be rays. For these tests we masked the regions between the Galactic latitudes of () while leaving the 3FGL sources with higher Galactic latitudes unmasked because of computational time requirements for sorting events individually.
3.2.1 East-west effect
The Earth’s magnetic field introduces an asymmetry between the flux
of the incoming CRs from the east and from the west. The positively
charged particles, including positrons (and protons), come from the
west owing to the fact that they are deflected towards the east
by the Earth’s magnetic field, while the negatively charged
particles, electrons, come from the east. Thus, if the telescope
measures the flux ratio of CR particles coming from the east to CR
particles coming from the west above unity in the dataset, then it
will indicate the presence of primary CR electrons. To select the
events coming from the east or from the west it is necessary to
include a selection criterion based on the reconstructed arrival
direction of the event in the detector.
The angle, EARTH_AZIMUTH_ANGLE, of the reconstructed event
direction with respect to North (line from spacecraft origin to
north celestial pole) as projected onto a plane normal to the zenith
is recorded in the photon file. This angle is measured in degrees
east of north, such that 90 degrees indicates that the event
originated from the
west444https://fermi.gsfc.nasa.gov/ssc/data/analysis/documentation/
Cicerone/Cicerone_Data/LAT_Data_Columns.html. The azimuthal flux
ratio of Fermi-LAT events coming from the east to those
coming from the west in intervals normalised to that in
the McIlwain L bin, 0.980-1.128, is shown in Table 3. We
found that the computed ratio significantly exceeds the expectation
(that is 1) for the McIlwain L bins with background
excesses and for the SOURCE and CLEAN classes
and is ,
, ,
, ,
and in the corresponding bins.
If the variation in the normalised azimuthal ratio with McIlwain L parameter is due to the presence of charged particles, then it is possible to estimate their contribution to the total flux in each McIlwain L bin assuming that the reconstructed direction of the photon-like event corresponds to that of the misclassified CR. Under this assumption we found using Table 3 that 30-45% of the fluxes for the SOURCE and CLEAN event classes in the McIlwain L bins of 1.424-1.572 and 1.572-1.720 and the 6-8 GeV energy band and in the McIlwain L bin of 1.572-1.720 and the 4-6 GeV energy band (shown in bold in Table 1) can be attributed to charged particles. We checked and found that the presence of these particles in the data can, to a large extent, explain the flux excesses shown in Table 1. Thus, the relative difference between the 4-6 GeV -ray fluxes in the McIlwain L bins, 1.424-1.572 and 1.572-1.720, decreases from 58% to 12% (if the presence of charged particles in the latter bin is assumed) and the relative difference between the 6-8 GeV -ray fluxes in the McIlwain L bins, 1.276-1.424 and 1.424-1.572, decreases from 66% to 13%.
3.2.2 WP8CTCalTkrProb parameter
While both the geomagnetic shielding and east-west effect are natural tools to check if charged particles are present in the data, the Fermi-LAT instrument has possibilities for tracking and calorimetry allowing us to distinguish rays from other particles even without accounting for the ACD. The Fermi-LAT extended file selection is a superset of the photon file selection. These files also contain additional event-level quantities that are not available in the photon files. Amongst these quantities there are probabilities that the particle is a cosmic ray versus a ray (0=CR-like, 1= ray-like). Thus, we used two quantities, WP8CTCalTkrProb and WP8CTAllProb, to check the reliability that the background excesses are of charged-particle origin. There are four possible cases including
(i) if both the quantities show low mean probabilities of particle events to be rays in the McIlwain L bins with background excesses then it will indicate the charged particle origin of excesses;
(ii) if only the WP8CTCalTkrProb quantity shows low mean probabilities of particle events to be rays in the McIlwain L bins with background excesses then it will imply that some of these particles are charged ones, but do not hit ACD filter tiles;
(iii) if only the WP8CTAllProb quantity shows low mean probabilities of particle events to be rays in the McIlwain L bins with background excesses then it will imply that tracking and calorimetry have insufficient power for identifying some of these events;
(iv) if both the quantities do not show low mean probabilities of particle events to be rays in the McIlwain L bins with background excesses then it will imply that an alternative scenario for background excesses is needed.
We chose the mean probability within each of the McIlwain L bins and each of the energy bands to characterise the distribution of probabilities. We did not find any variation of the WP8CTAllProb mean probability with the McIlwain L parameter within each of the three energy bands for the SOURCE, CLEAN and ULTRACLEANVETO event classes. We found that the WP8CTCalTkrProb mean probability is the lowest in the McIlwain L bins with excesses in background fluxes (see Table 4). Thus, the case (ii) gained considerable support. Possible interpretations of this result include leakage of CR electrons through the ACD ribbons and pileup effects in the ACD.
4 Radio/-ray connection in SFGs
| Model | Galaxies | Prototype | Flux at 3.5 GeV | Flux at 5 GeV | Flux at 7 GeV |
|---|---|---|---|---|---|
| Shell | SBG | NGC 253 | |||
| SBG | Arp 220 | ||||
| normal | Andromeda | ||||
| normal | Milky Way | ||||
| Uniform | SBG | NGC 253 | |||
| SBG | Arp 220 | ||||
| normal | Andromeda | ||||
| normal | Milky Way | ||||
| Observed | – | – |
Although our algorithm shows that charged particles contribute to the Fermi-LAT backgrounds of photon-like SOURCE and CLEAN class events, we clarified that these backgrounds can be filtered by selecting events only from the lowest McIlwain L bin. The performed analysis also shows that the ULTRACLEANVETO class is significantly less affected by these charged particles. Taking this result into account, we examined the radio/-ray connection in SFGs with the goal of searching for signs of evolutionary effects.
4.1 CR propagation regimes
A discrete-source origin of the isotropic -ray background was proposed by Strong et al. (1976). In their paper, the authors considered this possibility for estimating the contribution of normal galaxies to the unresolved -ray background and found that about 4 per cent of the background can be produced by these sources. One of their methods is based on the assumption of the same -ray-to-radio flux ratio for all normal galaxies. Thompson et al. (2007) showed that a similar assumption is valid for SBGs if these galaxies are CR particle calorimeters555A CR calorimeter is a galaxy in which CR losses dominate over the other losses, including escape. and radio-emitting electrons and positrons are created in the collisions. The argument of CR (electron and proton) calorimetry by Thompson et al. (2007) is particularly compelling for SBGs, where the energy loss times of CRs are significantly shorter than those in normal star-forming galaxies. The modelled -ray background coming from SBGs depends sensitively on the fraction of star formation that occurs in the CR proton calorimeter limit at every redshift. Since at high redshift a much larger fraction of star formation occurs in high surface density systems which are most likely proton calorimeters, the significant contribution from high redshift SBGs to the -ray background was proposed. Contrary to long-standing expectations, Fields et al. (2010) found that the contribution of numerous but individually faint normal galaxies to the -ray background is significant (a) if the redshift history of cosmic star formation is taken into account and (b) if the ratio of a galaxy’s volume-averaged CR proton flux to the cosmic star formation rate is constant for all normal galaxies. The source of rays and radio-emitting secondary CR electrons in the SBGs is collisions of CR protons with the ISM. On the other hand, most of the radio-emitting CR electrons in normal galaxies are primary and originated along with the CR protons in supernova remnants. In both cases, the source function of CR electrons is linearly proportional to that of CR protons resulting in the radio/-ray connection for SFGs, but the coefficients of proportionality are different and depend on a CR propagation regime.
The effect due to a transition from the regime of CR proton escape to the calorimetry regime for SFGs due to the increase in gas density with redshift is likely to occur. Relating the -ray background to the radio background (in particular to the radio source counts) gives us a suitable method (e.g., Strong et al., 1976) to examine the significance of this effect in the evolution of the observational properties of galaxies.
4.2 Prototype SFGs in the radio and -ray bands
We considered -ray detected SFGs, including nearby SBGs NGC 253 and M82 (for measured fluxes see Abdo et al., 2010b; Kapińska et al., 2017; Williams & Bower, 2010), a luminous infrared galaxy NGC 1068 (Lenain et al., 2010), an ultraluminous infrared galaxy Arp 220 (e.g. Griffin et al., 2016; Varenius et al., 2016) and normal galaxies, the Milky Way (e.g., Ackermann et al., 2012c) and the Andromeda galaxy (e.g., Dennison et al., 1975; Ackermann et al., 2017) to explore the connection between their radio and -ray emission. Starburst galaxies undergo an exceptionally high rate of star formation as compared to the rate of star formation in the Milky Way. For these prototype galaxies the star-formation rate varies from 0.4 in the Andromeda galaxy (Rahmani et al., 2016) to 220 in Arp 220 (Varenius et al., 2016), which is the most active star-forming galaxy in the local universe. The other galaxies are included in order to fill the broad range of star-formation rates. Given that the star-formation rate increases as the insterstellar gas becomes denser (Schmidt, 1959), these galaxies are expected to behave in various CR propagation regimes. For this investigation we also took -ray fluxes from Acero et al. (2015) and radio fluxes compiled in Thompson et al. (2007). Using the measured radio and -ray band fluxes, we computed the coefficient of proportionality between the 1.4 GHz radio continuum flux of 1 Jy and the -ray flux, , at energies of 3.5 GeV, 5 GeV and 7 GeV in GeV cm-2s-1GeV-1 for each of these galaxies (see Table 5). We found that the -ray-to-radio flux ratios are the lowest for normal galaxies, the Milky Way and the Andromeda galaxy, and are the highest for Arp 220 and NGC 253. Table 5 also shows that the variation in -ray-to-radio flux ratios for these SFGs is about a factor of 40 (or 10 if Arp 220 is excluded). This variation is likely to be related to the fact that the CR proton losses are dominated by escape in normal galaxies and by pion production in SBGs. Given that the radio emission from Arp 220 is dominated by two bright nuclei in the GHz band while its diffuse optically thin synchrotron flux is 3.3 times less than the total flux at 1 GHz (see Fig. 3 from Varenius et al., 2016), the existence of SBGs with the -ray-to-radio flux ratio higher than that for Arp 220 is plausible. Although the -ray detection of nearby SFGs became possible only with Fermi-LAT, their radio fluxes are of the order of 1 Jy (see Table 5) and exceed the current limit of sensitivity in the radio band by several orders of magnitude.
Given that SFGs with far infrared (FIR) luminosities between and in the local universe () can possibly be significant contributors to the isotropic extragalactic -ray background at energies above 1 GeV and below 10 GeV (Linden, 2017), it is worth noting that this luminosity range includes the SBGs such as NGC 253 at the low FIR luminosity limit and Arp 220 at the high FIR luminosity limit. At the luminosity distance is 1566 Mpc, and if galaxies identical to NGC 253 and Arp 220 are at this redshift, their radio fluxes at 1.4 GHz will be 50 Jy and 0.6 mJy, respectively. To perform these calculations we took the spectral index for NGC 253 from Kapińska et al. (2017) and assumed that the radio spectrum of Arp 220 is roughly flat in the GHz frequency band (Varenius et al., 2016). Source counts for SFGs generated from the simulation catalogue by Wilman et al. (2008) are given for radio fluxes at 1.4 GHz between 10 nanoJy and 10 mJy. The former value is of the order of the expected sensitivity for a 100 hour observation with the nominal sensitivity () of the full Square Kilometre Array ( m2 K-1, 350 MHz bandwidth). If NGC 253 is a prototype SBG then the galaxy’s radio flux of 50 nanoJy (that is equivalent to ) will correspond to the flux from the redshift of while the galaxy’s radio flux of 10 mJy will correspond to the flux from the distance of 100 Mpc (that is ). We also checked that if the Milky Way is a prototype normal galaxy then the galaxy’s radio flux of 50 nanoJy will correspond to the flux from the redshift of , while the galaxy’s radio flux of 10 mJy will correspond to the flux from the distance of 40 Mpc. We examined both the SBGs and normal galaxies located at distances above 100 Mpc or 40 Mpc from the Earth, respectively, including SFGs that are at the redshift of peak star formation by means of the simulation catalogue.
4.3 Models
We used the simulated distribution of radio source counts for normal galaxies and SBGs at 1.4 GHz taken from Figure 4 of Wilman et al. (2008) and normalised to the Euclidean distribution . To compute the radio brightness (Jy sr-1) we expressed the simulated distributions in terms of and integrated these functions over flux density. We found that the computed radio brightnesses at 1.4 GHz for SBGs and normal galaxies are 206 Jy sr-1 and 951 Jy sr-1, respectively. 68 per cent of the radio brightness generated by SBGs are from the sources with radio flux of 0.01-1.0 mJy, while 74 per cent of the radio brightness generated by normal galaxies are from the sources with radio flux of 1-100 Jy. These large portions are consequences of the fact that the distribution has different slopes in the convergence region at the faint end, and in the Euclidean region at the bright end, (Kellermann & Wall, 1987), and the main contribution to the radio brightnesses comes from the upper and lower bounds, respectively. In the shell model (Condon, 1989) that places all radio sources in a hollow, thin, spherical shell at , we calculated the -ray fluxes (shown in Table 2) expected from SFGs by using these radio brightnesses, taking into account the coefficients of proportionality from Table 5, and performing the K corrections (e.g., Peacock, 1999) for sources at this redshift. We found that for various prototype starburst and normal galaxies the total contribution of SFGs to the -ray background is between 10 per cent and 25 per cent. The contribution from the SBGs is about two times higher than that from the normal galaxies. If the normal galaxies are in the calorimetry regime at high redshifts (and have the -ray-to-radio flux ratio equal to that of NGC 253) then the total contribution of SFGs to the -ray background will be between 30 per cent and 40 per cent.
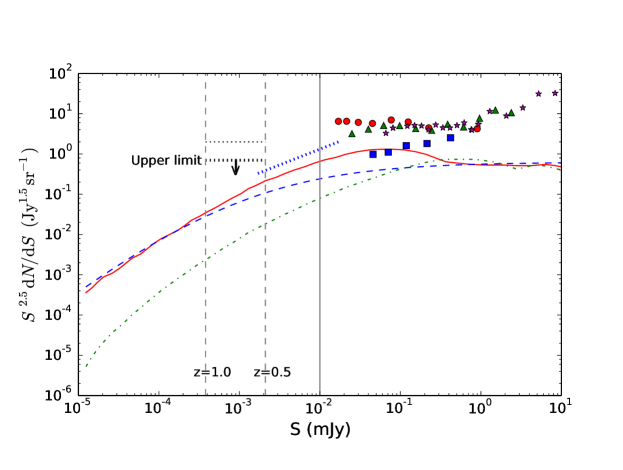
The uniform model is an alternative to the shell model and made on the reasonable assumption that the fainter sources are the most distant ones. It assumes equal luminosities and that sources are uniformly distributed in space with a number density, , that decreases with the expansion of the Universe. Taking the coefficients of proportionality from Table 5 and binning the radio brightnesses at 1.4 GHz in redshift we estimated the contribution of SBGs and normal galaxies to the -ray background. Given that SFGs are located at various redshifts, we took the K corrections into account. Assuming that NGC 253 is a prototype SBG666We selected NGC 253 as a prototype calorimeter, since its emission is less contaminated by an active galactic nucleus than those from NGC 4945 (Wojaczyński & Niedźwiecki, 2017), NGC 3424, and UGC 11041 (Peng et al., 2019). we found the -ray background produced by SBGs is about fourteen times smaller than the observed one for the ULTRACLEANVETO class in this energy range (Table 2). If we consider the ultraluminous infrared galaxy, Arp 220, as a SBG prototype then the -ray background produced by such sources will be about six times smaller than the observed one. If we assume that the Andromeda galaxy (or the Milky Way) is a prototype normal galaxy then the -ray signal produced by such sources will be about 10 (3) per cent of the observed -ray background flux. Thus, if NGC 253 and the Milky galaxy are prototype starburst and normal galaxies, then we can expect that the total contribution of SFGs to the -ray background is about 7+3=10 per cent, while if we consider Arp 220 and the Andromeda galaxy prototype starburst and normal galaxies then the contribution of SFGs will be about 17+7=23 per cent. Assuming the Universe and that the radio luminosity of galaxies is of the order of the Milky Way’s radio luminosity, in the framework of the uniform model we can reproduce two regions of the simulated distribution for normal galaxies including the Euclidean region at the highest flux densities and the convergence region in which the counts drop relative to the Euclidean value. The observed differential source counts taken from literature (Owen & Morrison, 2008; Ibar et al., 2009; Bondi et al., 2008; Seymour et al., 2008, and shown by circles, triangles, stars, and squares, respectively), the source counts simulated by Wilman et al. (2008) for normal galaxies (solid line) and SBGs (dash-dotted line), and those obtained from the uniform model for normal galaxies in the cosmology (dashed line) are shown in Figure 2. The results based on fluctuations due to weak confusing sources (P(D) analysis by Condon et al. (2012)) are shown by a dotted line between 2 Jy and 20 Jy. The contribution of active galactic nuclei is dominant above mJy, while star-forming galaxies take over at fainter flux densities. It is worth noting that the faint radio sky populations of low luminosity active galactic nuclei cannot always be disentangled from normal galaxy populations. If one assumes that the observed source counts (Condon et al., 2012; Ibar et al., 2009) between 1-100 Jy are totally attributed to normal SFGs in the regime of CR proton escape and that the Milky Way (Andromeda galaxy) is a prototype galaxy, then the flux produced by these sources is 6% (14%) and 9% (21%) of the total -ray background flux, respectively.
We found that the -ray background fluxes produced by SFGs are similar in the two considered models, despite the facts that in the shell model all the SFGs have different luminosities and are located at and that in the alternative model all the SFGs have equal luminosities and are distributed throughout space.
4.4 Discussion
The fact that the calculated flux from SFGs is smaller than the unresolved -ray background flux suggests that
(i) other sources including blazars (less than of the background, Ackermann et al., 2012a) and radio galaxies (Hooper et al., 2016) can contribute to the background at a significant level;
(ii) more sophisticated models of galaxy evolution assuming that the -ray-to-radio flux ratio is a function of luminosity and that the luminosity distribution is in turn evolved with redshift can be possible (e.g., Fields et al., 2010; Linden, 2017);
(iii) the observational properties of low flux (distant) SFGs can be significantly different from those of the nearby galaxies detected in both the radio and -ray bands or a population of low flux SFGs can be underestimated. In the latter case these low flux SFGs are numerous and faint enough to dominate source counts below the 10 Jy limit of current radio surveys and extend to the 0.1 Jy level.
Given that the possibilities (i) and (ii) are previously considered in literature, below we discuss the low flux SFGs as possible sources of the -ray background.
In the uniform model we checked and found that (a) if NGC 253 is a prototype SBG then the SBGs with radio flux of 0.01-1 mJy, which produce a significant fraction of the SBG contribution to the -ray background, are located at redshifts and that (b) if the Andromeda galaxy or the Milky Way are prototype sources then the normal galaxies with radio flux of 1-100 Jy which produce a significant fraction of the normal galaxy contribution to the -ray background are located at redshifts or , respectively. We found that the contributions of SBG and normal galaxies at redshifts to the total -ray flux produced by these types of sources, respectively, are 5 per cent (SBGs such as NGC 253), 3 per cent (normal galaxies such as the Andromeda galaxy) and 4 per cent (normal galaxies such as the Milky Way). We considered the scenario with a sharp change in the -ray-to-radio flux ratio above a given redshift for normal galaxies. We estimated the flux ratio at required to explain the unresolved -ray background and found that the ratio should be by a factor of about 500-800 (depending on the energy bin), 300-500, and 100-200 for 1.0, 0.75, and 0.5, respectively, higher than that for the Milky Way. Taking into account that the first two values exceed the -ray-to-radio flux ratio for all the -ray detected SFGs by at least one order of magnitude, this result suggests that the physical properties of galaxies significantly evolved between the redshift of peak star formation and today.
To increase the background -ray flux from normal galaxies located at high redshifts one can alternatively propose that the numbers of such galaxies significantly exceeds that simulated by Wilman et al. (2008). The 1.4-GHz flux densities of Milky Way-like galaxies at are between Jy and Jy and are below the sensitivity limit of previously performed radio surveys. It is worth noting that the radio source counts are based on interferometric images which are insensitive to a smooth background, while the extragalactic radio background brightness can have a significant contribution from a sufficiently smooth distribution of faint radio sources (e.g., Condon et al., 2012). Assuming the measured faint end index, , of a power-law source count distribution, , from Owen & Morrison (2008) (see Figure 2) and Milky Way-type galaxies located between (with flux density between 0.35 Jy and 2.1 Jy), we computed the normalisation of the source counts at 1.4 GHz so that these source counts, (e.g., Sect. 2.2 of Singal et al., 2010) can account for the observed cosmic radio background as reported by the ARCADE 2 collaboration (Fixsen et al., 2011). We found that the required number of faint sources significantly exceeds that simulated by Wilman et al. (2008), see the (upper) thin dotted line between two dashed vertical lines in Figure 2. We computed the background -ray flux expected from this population of faint radio sources. The -ray fluxes obtained assuming the -ray-to-radio flux ratio for the Milky Way are , , and GeV cm-2s-1 GeV-1 sr-1 at energies of 3.5, 5.0, and 7.0 GeV, respectively. If the normal galaxies at these high redshifts are CR calorimeters, one needs to multiply these fluxes by a factor of 10 (adopting the -ray-to-radio flux ratio for NGC 253) making the fluxes two-three times higher than the total background -ray flux. We obtained the upper limit on source counts shown in Figure 2 corresponding to the level of source counts required to explain the unresolved -ray background by the presence of low-flux SFG calorimeters located at . Next-generation, wide field, radio surveys will allow us to study such populations of faint sources in the radio band and put tighter limits on their number.
5 Summary and outlook
Astrophysical sources unresolved in rays including SBGs and normal galaxies can contribute to the extragalactic -ray background. To evaluate the extragalactic background for testing its possible discrete-source origin, one needs to subtract the contribution of charged particles misclassified as photons and contaminating the background. Faint unresolved sources are numerous and present around the whole sky complicating the separation of their -ray signal from the charged particle background. Therefore, the filtration of charged particles is a prerequisite procedure for classifying registered events on the bases of the responses of detectors. The angular resolution of Fermi-LAT is significantly lower than those of radio and infrared instruments and is limited at energies below 10 GeV by multiple scattering and ultimately by the ratio of the silicon-strip pitch to silicon-layer spacing. The advent of Fermi-LAT allowed the detection of rays from nearby SBGs and the Andromeda galaxy broadening our knowledge on the high energy emission from SFGs, while the studies of SFGs with radio fluxes 1000 times lower than those of these nearby SBGs or that of the Andromeda galaxy are routinely performed with radio telescopes. This fact shows that a multi-frequency approach for estimating the contribution of astrophysical source populations to the -ray background is accessible.
We found evidence for both the geomagnetic shielding and the east-west effect for -ray-like events of the SOURCE and CLEAN classes in the Fermi-LAT Pass 8 photon data. To establish this evidence we binned -ray-like events detected by Fermi-LAT into bands both in the McIlwain L parameter and energy. We found that the excesses in background fluxes are present in the bands for which the geomagnetic shielding is inefficient and checked that the mean probabilities of events in these bands to be rays are lower than those in the other bands. We found that the fluxes for the SOURCE (CLEAN) event class and also for the CLEAN event class in the energy bands of 4-6 GeV and 6-8 GeV for large values of McIlwain L-parameter are by a factor of about 2.5-4.0 (2.3-3.0) higher than the corresponding fluxes for the lowest McIlwain L bin. This finding shows that the filtration of charged particles is possible by means of discarding the events in the 4-6 GeV and 6-8 GeV energy bands recorded during the time intervals when the Fermi spacecraft’s geomagnetic position corresponded to the high McIlwain L-parameter values. We also considered the possibility to introduce a new event class in which events are selected not only on the basis of the detector responses, but also regarding the geomagnetic shielding effect. While our manuscript was in preparation, the Fermi-LAT collaboration uploaded a new release Pass 8 data (P8R3) and showed that the P8R2 data are contaminated by charged particles (Bruel et al., 2018). Thus, both the analyses conclude on the tendency that charged particles are present in the P8R2 SOURCE class though obtained by different methods given that their analysis includes the signals from the ACD ribbons as observables.
We analysed the contribution of SFGs to the unresolved -ray background at energies of 3 GeV to 8 GeV. At these energies of rays, the Universe is transparent and SFGs are expected to significantly contribute to the -ray background. For this analysis we used the simulation catalogue of radio sources (Wilman et al., 2008) and calculated the -ray-to-radio flux ratio on the basis of -ray and radio observations of the nearby SFGs. We found that the total contribution of SFGs to the -ray background is about 10-23 per cent depending on the choice of prototype galaxies. It supports the conclusion by Linden (2017) that multiple source classes provide non-negligible contributions to the unresolved -ray background. Under the assumption that the remaining flux can be produced by normal Milky Way-type galaxies at high redshift emitting in the calorimeter regime, we evaluated the required astrophysical conditions and found that the normal galaxies at with radio fluxes below 1 Jy can produce a non-negligible contribution only if evolutionary effects are present or alternatively the Jy radio population of SFGs is larger than simulated. The latter possibility is of interest in consideration of next generation radio surveys. We derived the upper limit on the number of low-flux SFG calorimeters at , Jy1.5 sr-1, (shown in Figure 2) corresponding to the level of source counts required to explain the unresolved -ray background by their presence. The full Square Kilometre Array with a 100-hour observation is expected to be sensitive to detect such Milky Way-type galaxies to a redshift of .
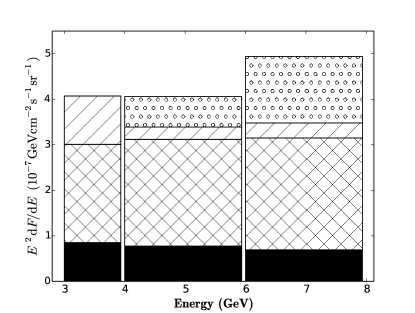
Figure 3 illustrates the key results reported in the paper including the filtered and unfiltered background flux levels for the SOURCE class, the background flux level for the ULTRACLEANVETO class, and the flux level resulting from the populations of SFGs if Arp 220 and the Andromeda galaxy are considered as prototypes.
6 Acknowledgements
We are grateful to the referee for the constructive suggestions that helped us to improve the manuscript. DAP acknowledges support from the DST/NRF SKA post-graduate bursary initiative.
Appendix A
Table 3 shows the azimuthal flux ratio of Fermi-LAT events coming from the east to those coming from the west in the the intervals normalised to that in the McIlwain L bin, 0.980-1.128. Table 4 shows the WP8CTCalTkrProb mean probability which is the lowest in the McIlwain L bins with the excesses in background fluxes. Table 5 shows the coefficient of proportionality between the radio flux of 1 Jy and the -ray flux, , at energies of 3.5 GeV, 5 GeV and 7 GeV in GeV cm-2s-1GeV-1 for each of the galaxies considered in this paper. Entries in bold and italic font are explained in Section 3 of the main text.
| Normalised azimuthal flux ratio | ||||
|---|---|---|---|---|
| Event class | McIlwain L bin | 3-4 GeV | 4-6 GeV | 6-8 GeV |
| SOURCE | 1.128-1.276 | |||
| SOURCE | 1.276-1.424 | |||
| SOURCE | 1.424-1.572 | 2.00 (2.17) | ||
| SOURCE | 1.572-1.720 | 1.75 (1.92) | 1.61 (1.61) | |
| CLEAN | 1.128-1.276 | |||
| CLEAN | 1.276-1.424 | |||
| CLEAN | 1.424-1.572 | 1.69 (1.85) | ||
| CLEAN | 1.572-1.720 | 1.64 (1.82) | 1.47 (1.47) | |
| ULTRACLEANVETO | 1.128-1.276 | |||
| ULTRACLEANVETO | 1.276-1.424 | |||
| ULTRACLEANVETO | 1.424-1.572 | 1.05 (1.05) | ||
| ULTRACLEANVETO | 1.572-1.720 | 1.05 (1.20) | 0.99 (0.87) | |
| WP8CTCalTkrProb probabilities | ||||
|---|---|---|---|---|
| Event class | McIlwain L bin | 3-4 GeV | 4-6 GeV | 6-8 GeV |
| SOURCE | 0.980-1.128 | |||
| SOURCE | 1.128-1.276 | |||
| SOURCE | 1.276-1.424 | |||
| SOURCE | 1.424-1.572 | 91.16 (90.84) | ||
| SOURCE | 1.572-1.720 | 93.36 (92.73) | 89.78 (89.59) | |
| CLEAN | 0.980-1.128 | |||
| CLEAN | 1.128-1.276 | |||
| CLEAN | 1.276-1.424 | |||
| CLEAN | 1.424-1.572 | 94.61 (94.30) | ||
| CLEAN | 1.572-1.720 | 94.76 (94.28) | 93.22 (92.87) | |
| ULTRACLEANVETO | 0.980-1.128 | |||
| ULTRACLEANVETO | 1.128-1.276 | |||
| ULTRACLEANVETO | 1.276-1.424 | |||
| ULTRACLEANVETO | 1.424-1.572 | 99.82 (99.84) | ||
| ULTRACLEANVETO | 1.572-1.720 | 99.81 (99.78) | 99.78 (99.85) | |
| SFG | Distance | Radio flux | Coeff. at 3.5 GeV | Coeff. at 5 GeV | Coeff. at 7 GeV |
|---|---|---|---|---|---|
| (Mpc) | at 1.4 GHz (Jy) | GeV cm-2s-1GeV-1Jy-1 | GeV cm-2s-1GeV-1Jy-1 | GeV cm-2s-1GeV-1Jy-1 | |
| NGC 253 | 3.3 | 5.9 | |||
| M82 | 3.9 | 7.2 | |||
| NGC 1068 | 15 | 7.5 | |||
| Arp 220 | 72 | 0.3 | |||
| Andromeda | 0.78 | 8.6 | |||
| Milky Way | – | 16.8† |
References
- Abdo et al. (2010a) Abdo A. A. et al., 2010a, ApJ, 723, 1082
- Abdo et al. (2010b) Abdo A. A. et al., 2010b, ApJ, 709, L152
- Abdo et al. (2010c) Abdo A. A. et al., 2010c, Physical Review Letters, 104, 101101
- Acero et al. (2015) Acero F. et al., 2015, ApJS, 218, 23
- Ackermann et al. (2015) Ackermann M. et al., 2015, ApJ, 799, 86
- Ackermann et al. (2012a) Ackermann M. et al., 2012a, Phys. Rev. D., 85, 083007
- Ackermann et al. (2017) Ackermann M. et al., 2017, ApJ, 836, 208
- Ackermann et al. (2013) Ackermann M. et al., 2013, ApJ, 765, 54
- Ackermann et al. (2012b) Ackermann M. et al., 2012b, Astroparticle Physics, 35, 346
- Ackermann et al. (2012c) Ackermann M. et al., 2012c, ApJ, 755, 164
- Ackermann et al. (2010) Ackermann M. et al., 2010, Phys. Rev. D., 82, 092004
- Atwood et al. (2009) Atwood W. B. et al., 2009, ApJ, 697, 1071
- Bondi et al. (2008) Bondi M., Ciliegi P., Schinnerer E., Smolčić V., Jahnke K., Carilli C., Zamorani G., 2008, ApJ, 681, 1129
- Bonzini et al. (2013) Bonzini M., Padovani P., Mainieri V., Kellermann K. I., Miller N., Rosati P., Tozzi P., Vattakunnel S., 2013, MNRAS, 436, 3759
- Bruel et al. (2018) Bruel P., Burnett T. H., Digel S. W., Johannesson G., Omodei N., Wood M., 2018, preprint, (arXiv: 1810.11394)
- Condon (1989) Condon J. J., 1989, ApJ, 338, 13
- Condon et al. (2012) Condon J. J. et al., 2012, ApJ, 758, 23
- Dennison et al. (1975) Dennison B., Balonek T. J., Terzian Y., Balick B., 1975, PASP, 87, 83
- Fields et al. (2010) Fields B. D., Pavlidou V., Prodanović T., 2010, ApJ, 722, L199
- Fixsen et al. (2011) Fixsen D. J. et al., 2011, ApJ, 734, 5
- Górski et al. (2005) Górski K. M., Hivon E., Banday A. J., Wandelt B. D., Hansen F. K., Reinecke M., Bartelmann M., 2005, ApJ, 622, 759
- Griffin et al. (2016) Griffin R. D., Dai X., Thompson T. A., 2016, ApJ, 823, L17
- Hooper et al. (2016) Hooper D., Linden T., Lopez A., 2016, JCAP, 2016, 019
- Ibar et al. (2009) Ibar E., Ivison R. J., Biggs A. D., Lal D. V., Best P. N., Green D. A., 2009, MNRAS, 397, 281
- Kapińska et al. (2017) Kapińska A. D. et al., 2017, ApJ, 838, 68
- Kellermann & Wall (1987) Kellermann K. I., Wall J. V., 1987, in IAU Symposium, Vol. 124, Observational Cosmology, Hewitt A., Burbidge G., Fang L. Z., eds., p. 545
- Lenain et al. (2010) Lenain J.-P., Ricci C., Türler M., Dorner D., Walter R., 2010, A&A, 524, A72
- Linden (2017) Linden T., 2017, Phys. Rev. D., 96, 083001
- Owen & Morrison (2008) Owen F. N., Morrison G. E., 2008, AJ, 136, 1889
- Padovani (2016) Padovani P., 2016, A&A Rev., 24, 13
- Peacock (1999) Peacock J. A., 1999, Cosmological Physics, Cambridge University Press. p. 704
- Peng et al. (2019) Peng F.-K., Zhang H.-M., Wang X.-Y., Wang J.-F., Zhi Q.-J., 2019, preprint, (arXiv: 1906.06720), arXiv:1906.06720
- Prandoni & Seymour (2015) Prandoni I., Seymour N., 2015, Advancing Astrophysics with the Square Kilometre Array (AASKA14), 67
- Prokhorov & Moraghan (2016) Prokhorov D. A., Moraghan A., 2016, MNRAS, 457, 2433
- Rahmani et al. (2016) Rahmani S., Lianou S., Barmby P., 2016, MNRAS, 456, 4128
- Schmidt (1959) Schmidt M., 1959, ApJ, 129, 243
- Seymour et al. (2008) Seymour N. et al., 2008, MNRAS, 386, 1695
- Singal et al. (2010) Singal J., Stawarz Ł., Lawrence A., Petrosian V., 2010, MNRAS, 409, 1172
- Strong et al. (1976) Strong A. W., Wolfendale A. W., Worrall D. M., 1976, MNRAS, 175, 23P
- Thompson et al. (2007) Thompson T. A., Quataert E., Waxman E., 2007, ApJ, 654, 219
- Varenius et al. (2016) Varenius E. et al., 2016, A&A, 593, A86
- Williams & Bower (2010) Williams P. K. G., Bower G. C., 2010, ApJ, 710, 1462
- Wilman et al. (2008) Wilman R. J. et al., 2008, MNRAS, 388, 1335
- Wojaczyński & Niedźwiecki (2017) Wojaczyński R., Niedźwiecki A., 2017, ApJ, 849, 97