The BUFFALO HST Survey
Abstract
The Beyond Ultra-deep Frontier Fields and Legacy Observations (BUFFALO) is a 101 orbit + 101 parallel Cycle 25 Hubble Space Telescope Treasury program taking data from 2018-2020. BUFFALO will expand existing coverage of the Hubble Frontier Fields (HFF) in WFC3/IR F105W, F125W, and F160W and ACS/WFC F606W and F814W around each of the six HFF clusters and flanking fields. This additional area has not been observed by HST but is already covered by deep multi-wavelength datasets, including Spitzer and Chandra. As with the original HFF program, BUFFALO is designed to take advantage of gravitational lensing from massive clusters to simultaneously find high-redshift galaxies which would otherwise lie below HST detection limits and model foreground clusters to study properties of dark matter and galaxy assembly. The expanded area will provide a first opportunity to study both cosmic variance at high redshift and galaxy assembly in the outskirts of the large HFF clusters. Five additional orbits are reserved for transient followup. BUFFALO data including mosaics, value-added catalogs and cluster mass distribution models will be released via MAST on a regular basis, as the observations and analysis are completed for the six individual clusters.
1 Introduction
The Beyond Ultra-deep Frontier Fields and Legacy Observations (BUFFALO) program is a Hubble Treasury program expanding the Hubble Frontier Fields galaxy cluster to adjacent areas that already benefit from ultra-deep Spitzer and multi-wavelength coverage. The program consists of 96 orbits + 96 parallel orbits in the Frontier Fields and also includes five orbits of planned supernova followup, based upon expected rates.
The Frontier Fields program (Lotz et al., 2017) arose out of the realization that the same dataset could be used to attack two of the most important questions in astronomy, even though they were seemingly different topics. Gravitational lensing from massive, foreground clusters allows the Hubble Space Telescope (HST) to detect galaxies which would otherwise be too faint. At the same time, these observations allow us to model the dark matter distribution in the foreground clusters, which provides some of the leading constraints on the properties of dark matter.
BUFFALO will build upon the existing Frontier Fields programs by significantly broadening the area observed by Hubble around each of the six Frontier Fields clusters. BUFFALO will observe four times the area of the existing Frontier Fields in a tiling centered around the central region of each cluster field (and, in parallel, flanking field). BUFFALO will observe these new regions in five HST filters, including most of the filters used for the original Frontier Fields program. Observations over this broader region will provide significant improvements in both our understanding of dark matter and of high-redshift galaxies.
Both of these studies benefit strongly from the presence of multi-wavelength data that has been added to HST by the Spitzer Space Telescope (Werner et al., 2004), the Chandra X-ray Observatory (Weisskopf et al., 2000), the XMM-Newton X-ray Observatory (Jansen et al., 2001), and other ground-based observatories. BUFFALO is designed to take advantage of this by expanding Frontier Fields coverage to fields in which these other data already exist.
The design benefits additionally from previous HST studies of high-redshift galaxies (Oesch et al., 2010; McLure et al., 2010; Finkelstein et al., 2015; Bouwens et al., 2015, 2016). Their measurements of the high-redshift luminosity function enable BUFFALO to choose a depth in five optical and near-infrared pass-bands with the Advanced Camera for Survey (ACS) and the Wide Field Camera 3 (WFC3), that is optimized to select the most luminous galaxies at and to study their physical properties such as stellar masses by fully exploiting the pre-existing, deep Spitzer/IRAC data around the Frontier Fields. BUFFALO is thus the logical extension of the Hubble Frontier Fields program, HFF (Lotz et al., 2017) as well as previous HST+Spitzer extragalactic legacy surveys such as GOODS (Giavalisco et al., 2004), HUDF (Beckwith et al., 2006; Ellis et al., 2013; Illingworth et al., 2013; Labbé et al., 2015), CANDELS (Grogin et al., 2011; Koekemoer et al., 2011), S-CANDELS (Ashby et al., 2015), COSMOS (Scoville et al., 2007), SMUVS (Ashby et al., 2018), BORG/HIPPIES (Trenti et al., 2011; Yan et al., 2011), CLASH (Postman et al., 2012), SURFS UP (Bradač et al., 2014), or RELICS (Coe et al., 2019).
The BUFFALO observations and filter choices are summarized in § 2. The BUFFALO collaboration includes groups which use a variety of techniques for mass modeling for individual clusters, as discussed in § 3. In § 4, the key science goals for high-redshift galaxy evolution are described. The improvements in our understanding of structure evolution and dark matter physics from expanding the Hubble footprint to a wider area around these clusters are discussed in § 5. As discussed in § 6, BUFFALO is also expected to observe a variety of transient objects, possibly including lensed supernovae. Planned data products are described in § 7. The survey program and key results are briefly summarized in § 8.
2 Observations
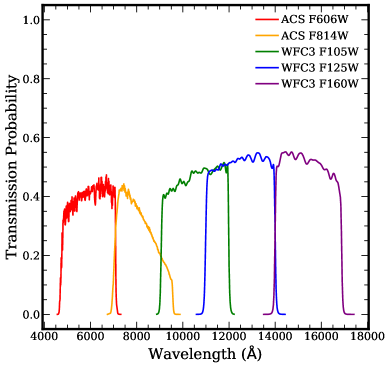
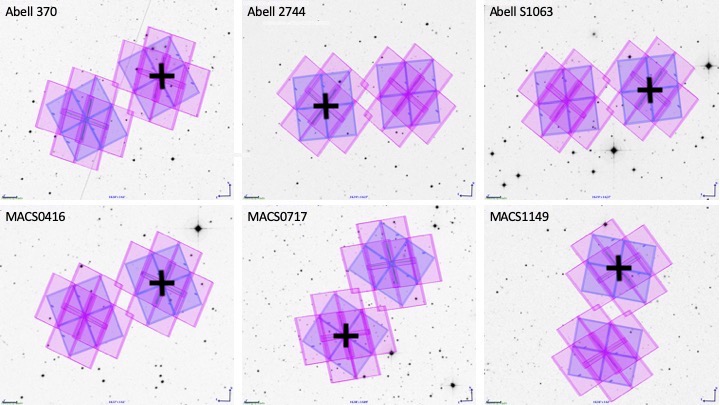
The observing strategy for BUFFALO is designed to increase the area observed by HST around each of the six Frontier Fields (HFF) clusters (Table 1), with both ACS/WFC and WFC3/IR cameras, and in many of the same filter sets used for the HFF program (Fig. 1). Specifically, each of the six HFF clusters is observed for a total of 16 orbits, divided into two orients (8 orbits each) differing by 180 degrees (approximately six months apart), thereby providing ACS/WFC and WFC3/IR coverage of both the main cluster field and the parallel field. In addition, each of the 8-orbit orients is divided into two epochs (at 4 orbits per epoch), separated by about 30 days to enable searches for Type Ia supernovae in both the main cluster and the parallel field. Each 4-orbit epoch consists of a 22 mosaic across the field, with a spacing designed to maximize the area covered by the WFC3/IR detector, thereby covering four times the area of the original WFC3/IR imaging, for both the main cluster and the parallel field, in all cases. The corresponding ACS observations overlap each other by about half the field of view of ACS, with the resulting mosaic covering three times the area of the original ACS imaging, again for both the main cluster and the parallel field (Fig. 2).
| Field | Center (J2000) | Flanking Field Center (J2000) |
|---|---|---|
| Abell 370 | 02:39:52.9 -01:34:36.5 | 02:40:13.4 −01:37:32.8 |
| MACS J0717.5+3745 | 07:17:34.0 +37:44:49.0 | 07:17:17.0 +37:49:47.3 |
| MACS J0416.1-2403 | 04:16:08.9 -24:04:28.7 | 04:16:33.1 -24:06:48.7 |
| Abell S1063 | 22:48:44.4 -44:31:48.5 | 22:49:17.7 -44:32:43.8 |
| Abell 2744 | 00:14:21.2 -30:23:50.1 | 00:13:53.6 -30:22:54.3 |
| MACS J1149.5+2223 | 11:49:36.3 +22:23:58.1 | 11:49:40.5 +22:18:02.3 |
Note. — Please see Lotz et al. (2017) for additional information about the original Hubble Frontier Fields pointings and cluster properties.
Once all 16 orbits are obtained for each cluster, the resulting observations comprise a 22 mosaic of WFC3/IR data in F105W, F125W and F160W, each at approximately 2/3 orbit depth, utilizing a 4-point dither to mitigate detector defects and also provide sub-pixel sampling. The corresponding ACS/WFC observations consist of F606W at 2/3 orbit depth, and F814W at 4/3 orbit depth, again utilizing a 4-point dither to mitigate detector defects, provide sub-pixel sampling and step across the gap between the two chips in ACS. For each of the six clusters, the final dataset therefore consists of 160 exposures in total, at 4 exposures per pointing, over 8 different pointings (4 on the main cluster and 4 on the parallel field), for each of the five ACS/WFC3 filters used in the program.
As each new set of observations were obtained, they were downloaded and processed with a series of steps that go beyond the standard STScI pipeline processing. In particular, these additional steps included refining the astrometry for all exposures to accuracies better than milliarcsecond-level, as well as improved background level estimates and refined cosmic ray rejection, and improved treatment of time-variable sky and persistence removal for the WFC3/IR detectors. These improvements all followed similar procedures to those described in Koekemoer et al. (2011), where more details on these steps are presented. Exposures in the F105W band are affected by time-varying background signal due to variable atmospheric emission during the exposure. As a result, the background of an exposure is higher and the final depth of the images can be impacted. For its characteristics, diffuse and extended, this effect can impact the detection of intracluster light (see § 5.4) in this band. The BUFFALO image processing corrects for the time variable background by either subtracting a constant background for each readout or excluding the affected frames (see Koekemoer et al. 2013 for more details on the processing). A preliminary inspection of the data shows no difference between the intracluster light maps for the F105W and the other IR bands.
The final products prepared from these procedures included full-depth combined mosaics for each filter, as well as individual exposures necessary for lensing models, all astrometrically aligned and distortion-rectified onto a common astrometric pixel grid, which was tied directly to the GAIA-DR2 absolute astrometric frame using catalogs provided by M. Nonino (priv. comm). The final mosaics produced from this process also included all other previous HST data obtained on these fields in these filters, and therefore are the deepest HST mosaics available for these fields.
| Field | Visit Numbers | Main Cluster | Parallel Field | Epoch 1 | Epoch 2 |
|---|---|---|---|---|---|
| Abell 370 | 6A-6H | WFC3 | ACS | 2018 Jul 21-22 | 2018 Aug 21 |
| 6I-6P | ACS | WFC3 | 2018 Dec 19 | 2019 Jan 7 | |
| MACS J0717.5+3745 | 3I-3P | ACS | WFC3 | 2018 Oct 2-3 | 2018 Nov 22 |
| 3A-3H | WFC3 | ACS | 2019 Feb 18 | 2019 Apr 1 | |
| MACS J0416.1-2403 | 2I-2P | ACS | WFC3 | 2019 Jan 7 | 2019 Feb 7 |
| 2A-2H | WFC3 | ACS | 2019 Aug 3 | 2019 Sep 6 | |
| Abell S1063 | 5A-5H | WFC3 | ACS | 2019 Apr 20 | 2019 May 29 |
| 5I-5P | ACS | WFC3 | 2019 Oct | 2019 Nov | |
| Abell 2744 | 1I-1P | ACS | WFC3 | 2019 May 15 | 2019 Jul 3 |
| 1A-1H | WFC3 | ACS | 2019 Oct - Nov | 2019 Nov - Dec | |
| MACS J1149.5+2223 | 4A-4H | WFC3 | ACS | 2019 Dec | 2020 Jan |
| 4I-4P | ACS | WFC3 | 2019 Apr | 2020 May |
2.1 Analysis Tools and Methods
In order to allow analysis of the intrinsic properties of background lensed galaxies, the BUFFALO survey follows the HFF philosophy of releasing high-level data products through the MAST archive for the scientific community. The BUFFALO team will produce several strong, weak, and joint strongweak lensing models from independent teams using different techniques described further in § 3. BUFFALO will then deliver mass, magnification, deflection, and associated error maps for different redshifts provided by each independent modeling team of the collaboration, as well as weak-lensing catalogues. An online magnification calculator will also be available for fast magnification estimates and errors within the modeled field-of-views for each modeling pipeline.
3 Lensing Mass Modeling
The BUFFALO survey extends the Hubble Space Telescope coverage of the 6 Hubble Frontier Fields (HFF, Lotz et al., 2017) clusters by a factor of about 4, which will expand the measurements of the overall mass profile and substructure characteristics of both the dark and luminous components of galaxy clusters up to . Recent studies have shown that the shear induced by distant and massive substructures can extend to the cluster core (Acebron et al., 2017; Mahler et al., 2018; Lagattuta et al., 2019), and therefore including them in the overall mass modeling can affect the central component of the model and remove some potential biases. Mahler et al. (2018) showed that structures in the outskirts of Abell 2744 found with a weak lensing analysis (Jauzac et al., 2016a) impact the mass measurements in the cluster core, which in turn affects magnification estimates of high redshift sources. Lagattuta et al. (2019) studied Abell 370 by extending the Multi-Unit Spectroscopic Explorer (MUSE) mosaic around Abell 370 together with deeper imaging data from the HFF program. Their best-fit strong lensing model needed a significantly large external shear term that is thought to come from structures along the line-of-sight and at larger projected radii in the lens plane.
Moreover, Acebron et al. (2017) analyzed the impact of distant and massive substructures on the overall mass and density profiles reconstruction with HFF-like simulated clusters (Meneghetti et al., 2017). They found that the density profile in the outskirts of the cluster () was underestimated by up to . Including the substructures in the modeling helps to better constrain the mass distribution, with an improvement between to in the most distant regions of the cluster. Further, the bias introduced by these unmodeled structures also affected the retrieval of cosmological parameters with the strong lensing cosmography technique.
Mapping these structures is essential not only for improving the accuracy of the mass models, but also to gain a better understanding of the physical properties governing galaxy clusters. Indeed, as the densest regions of the Universe and the sites of constant growth due to their location at the nodes of the cosmic web, galaxy clusters represent a privileged laboratory for testing the properties of dark matter and for improving our global picture of structure evolution. These recent studies have thus further proven the need for extended data coverage around galaxy clusters.
With its extended spatial coverage of the HFF clusters, BUFFALO will provide unprecedented weak-lensing measurements thanks to HST high-resolution imagery, allowing for precise measurement of the shapes of weakly-lensed galaxies. The combination of BUFFALO weak-lensing and HFF strong-lensing analyses will provide the most precise mass measurements ever obtained for those clusters. BUFFALO will detect structures that can only be significantly detected with HST weak-lensing. While residing in the cluster outskirts, they still introduce a significant bias in the mass measurements as explained earlier, and thus on the magnification estimates that are crucial for high redshift studies.
Following the success of a similar program with the original HFF observations, the lensing profile in BUFFALO will be modeled by several independent teams, with each result released for public use (§ 4). The aim of the BUFFALO mass modeling challenge is to bring a better understanding of the behaviour of these clusters as well as on the different systematic errors arising from the different techniques or assumptions used (Meneghetti et al., 2017).
The algorithms participating in the modeling challenge are briefly described below:
-
•
glafic (Oguri, 2010) performs mass modeling adopting a parametric approach. Halo components are remodeled by an Navarro-Frenk-White (NFW) profile, and cluster member galaxies are modeled by a pseudo-Jaffe profile. External perturbations are added for better modeling. A detailed description of the mass modeling of the HFF clusters with glafic is given in Kawamata et al. (2016) and Kawamata et al. (2018), indicating that positions of multiple images are reproduced with a typical accuracy of .
-
•
Grale (Liesenborgs et al., 2006, 2009) is a flexible, free-form method, based on a genetic algorithm that uses an adaptive grid to iteratively refine the mass model. As input it uses only the information about the lensed images, and nothing about the cluster’s visible mass. This last feature sets Grale apart from most other lens mass reconstruction techniques, and gives it the ability to test how well mass follows light on both large and small scales within galaxy clusters. Grale’s description, software and installation instructions are available online at http://research.edm.uhasselt.be/~jori/grale.
-
•
Lenstool (Jullo et al., 2007; Jullo & Kneib, 2009) utilizes a Bayesian Markov Chain Monte-Carlo sampler to optimize the model parameters using the positions and spectroscopic redshifts (as well as magnitudes, shapes and multiplicity if specified) of the multiply imaged systems. The overall matter distribution of clusters is decomposed into smooth large scale components and the small-scale halos associated with the locations of cluster galaxies.
A new version of Lenstool (Niemiec et al., in prep.) allows the combination a parametric strong lensing modeling of the cluster’s core, where the multiple images appear, with a more flexible non-parametric weak lensing modeling at larger radii, the latter leading to the detection and characterization of substructures in the outskirts of galaxy clusters (Jauzac et al., 2016a, 2018a).
-
•
The Light-Traces-Mass (Broadhurst et al., 2005; Zitrin et al., 2009) methodology is based on the assumption that the underlying dark matter distribution in the cluster is traced by the distribution of the luminous component, i.e., the cluster galaxies and their luminosities. Only a small number of free parameters is needed to generate a mass model where the position and source redshift of multiple images are used as constraints. LTM has proven to be a powerful method for identifying new multiple images as well as for constraining the cluster mass distribution (Merten et al., 2011; Zitrin et al., 2015; Frye et al., 2019). This pipeline also allows the incorporation of other constraints including weak-lensing shear measurements, time delays, or relative magnifications.
-
•
The WSLAP+ (Diego et al., 2007, 2016b) method falls in the category of hybrid methods. The mass distribution is decomposed into two components: (1) a grid component (free-form method) which accounts for the diffuse mass distribution, and (2) a compact component (parametric method) which accounts for the mass associated with the member galaxies. The method combines strong-lensing arc positions with weak-lensing measurements when available. The solution is found by minimizing the quadratic form of a system of linear equations. The role of the regularization is adopted by the number of iterations in the minimization code, although if resolved lensed systems are present (i.e, arcs with multiple identifiable knots) the solutions derived are very robust and weakly dependent on the number of iterations. Details can be found in Diego et al. (2007, 2016b) and references therein.
-
•
The CLUMI (CLUster lensing Mass Inversion) code (Umetsu, 2013) combines wide-field weak-lensing (shear and magnification) constraints for reconstructing binned surface mass density profiles, . This code has been used for the CLASH weak-lensing studies (e.g., Umetsu et al., 2014a). It can also include central strong-lensing constraints in the form of the enclosed projected total mass, as done in Umetsu et al. (2016).
The CLUMI-2D code (Umetsu et al., 2018a) is a generalization of CLUMI into a 2D description of the pixelized mass distribution. It combines the spatial 2D shear pattern (g1, g2) with azimuthally-averaged magnification-bias measurements, which impose a set of azimuthally integrated constraints on the field, thus effectively breaking the mass-sheet degeneracy. It is designed for an unbiased reconstruction of both mass morphology (e.g., halo ellipticity) and the radial mass profile of the projected cluster matter distribution.
4 Impact on Studies of the High-redshift Universe
Massive galaxies at are in the midst of a critical transition between initial collapse and subsequent evolution (Steinhardt et al., 2014; Bouwens et al., 2015; Steinhardt et al., 2016; Mashian et al., 2016). Galaxies are thought to form via hierarchical merging, building from primordial dark matter fluctuations into massive proto-galaxies (Springel et al., 2005; Vogelsberger et al., 2014). Indeed, at , the stellar mass function (SMF) is well approximated by a Schechter function with a clear exponential cutoff above a characteristic mass.
However, if early galactic assembly is dominated by simple baryonic cooling onto dark matter halos, at very high redshifts the SMF should be a Press-Schechter-like power law with no exponential cutoff. Similarly, studies of star forming galaxies at (Noeske et al., 2007; Daddi et al., 2007; Lee et al., 2013; Speagle et al., 2014) find a relatively tight relationship between the stellar mass and star formation rate (SFR) of star-forming galaxies (the so-called star forming “main sequence”), but according to the hierarchical growth paradigm, increased merger rates should result in a much weaker correlation of these two quantities at high redshift. Observing this transition would pinpoint the end of the initial growth phase, providing strong constraints for models of early structure formation and the nature and causes of reionization.
This transition is currently not well constrained at due to the small number of galaxies with the necessary SFR and stellar mass estimates required, which at present only the combination of HST/WFC3 and Spitzer-IRAC can provide. However, recent results using HST photometry (Bouwens et al., 2015, 2016; Davidzon et al., 2017) indicate that the galaxy luminosity function flattens between (where there is likely an exponential cutoff) and (where no cutoff is observed), consistent with the epoch around is the critical transition window.
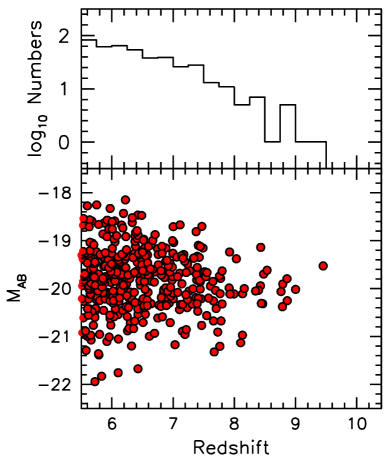
Uncertainties at this epoch are currently dominated by a combination of cosmic variance, insufficient area in current sightlines, and lack of ultra-deep Spitzer data needed to confirm luminous systems. To illustrate the point, all published CANDELS galaxies are in just two of the five possible fields where they could be discovered (Oesch et al., 2014; Roberts-Borsani et al., 2016). The BUFFALO survey is optimized to efficiently search for these early, high-mass galaxies over the remaining areas where mass estimation will be possible (Fig. 3).
In addition to the expected change in the shape of the galaxy mass function, recent studies using HST and Spitzer observations (Lee et al., 2013; Stark et al., 2013; Steinhardt et al., 2014; Bouwens et al., 2015, 2016; Oesch et al., 2016) find a substantial population of galaxies that are seemingly too massive, too early to have formed through standard hierarchical merging (Steinhardt et al., 2016; Behroozi et al., 2018). However, these massive galaxies are also expected to be the most strongly biased and thus measurements are most affected by cosmic variance, and the factor of 2 improvement in their measured number density provided by BUFFALO will either relieve or significantly increase this tension.
BUFFALO is designed to optimally reduce the current uncertainty by imaging sightlines with existing, sufficient ultra-deep Spitzer data. Joint HST and Spitzer observations have proven to be essential for the discovery and characterization of the highest-redshift galaxies and have recently resulted in the first rest-frame optical detection and stellar mass measurements of individual galaxies at z8 and even z10 (Labbé et al., 2013; Oesch et al., 2013).
Because early, massive galaxies are very highly biased (Moster et al., 2011), the limiting factor in our understanding of this transition period is a combination of cosmic variance and area coverage. Of the three galaxy candidates in 800 arcmin2 of deep HST imaging over the five CANDELS sightlines, two lie in a single 4 arcmin2 region (Oesch et al., 2014), and the candidates in the HFF fields are highly clustered. The addition of BUFFALO data will improve the measurement of the space density of LL∗ galaxies by doubling the number of sightlines with sufficient area, filter coverage, and Spitzer data to reliably detect galaxies at z8-10.
Spitzer data are essential for galaxy studies (cf. Bradač et al. (2014), Fig. 3) because they constrain the age and mass of high-redshift galaxies and can be used to effectively remove contaminants. Spitzer has already invested 1500h (2 months) imaging the HFF areas to 50-75h depth, but HST WFC3-IR data exists over only 10% of this deep Spitzer coverage. The BUFFALO pointings were chosen to overlap with the existing Spitzer HFF coverage as efficiently as possible in regions central enough that there is still likely to be non-negligible magnification from weak lensing. The BUFFALO coverage areas also expands WFC3 coverage to an area which is well matched with the JWST NIRSPEC field of view.
BUFFALO will complete the WFC3-IR and ACS coverage of areas with Spitzer-IRAC deep enough to study the high- universe over a large area, resulting in the best study of this key period currently possible. Critically, the large area and additional sightlines will both mitigate the effect of cosmic variance due to the strong clustering of objects (Trenti et al., 2012; Oesch et al., 2013; Zheng et al., 2014; Laporte et al., 2014) and directly constrain the galaxy bias with respect to the dark matter (Adelberger et al., 1998; Robertson et al., 2010).
Presently, Spitzer-IRAC data at depths greater than 50h per pixel in both 3.6m and 4.5m bands are the only way to measure the stellar masses of galaxies at and firmly establish that they are indeed high-redshift (e.g. Fig. 5), while HST data are crucial to identifying candidate galaxies through their photometric dropout. This powerful combination of data currently exists over of sky, yielding 20 joint detections of galaxies and 4 at . The strong clustering of high-redshift galaxies has been definitively observed, with the majority of galaxies found in one of five CANDELS fields (Bouwens et al., 2015) and one of the Frontier Fields known to contain an over-density of galaxies in the region mapped by BUFFALO (Zheng et al., 2014; Ishigaki et al., 2015).
4.1 Clustering as a test of hierarchical merging
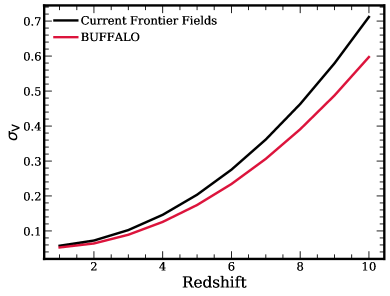
The small volume probed by previous Frontier Field observations at results in a very large expected field-to-field variance of %, currently dominated by Poisson error in each field at the bright end. This significantly limits the ability of the HFFs to measure accurate cosmic average quantities and true cosmic variance (Robertson et al., 2014). The additional coverage from BUFFALO will reduce this field-to-field variance by , allowing an improved measurement of the true cosmic variance.
The true variance in number counts per field provides a direct and simple measure of the galaxy bias at these redshifts, allowing us to estimate the dark matter halo masses hosting these galaxies (e.g., Adelberger et al. 1998; Robertson et al. 2010). The availability of combined HST+Spitzer imaging will further allow us to determine the galaxy bias as a function of stellar mass - a crucial test of theoretical models (Behroozi & Silk, 2015; O’Shea et al., 2015). Similar tests are not possible in the significantly more numerous BoRG (Brightest of Reionizing Galaxies, Trenti et al. 2012) fields because they lack ancillary Spitzer data required to measure stellar masses of high-redshift galaxies, although followup Spitzer observations have been conducted in some fields with high-redshift candidates (Morishita et al., 2018; Bridge et al., 2019).
4.2 Improvement in Magnification Estimates
As discussed in § 3, a lack of knowledge of the presence of substructures in the outskirts of clusters can lead to underestimation of the mass and thus the density profile of the cluster by up to 20% (Acebron et al., 2017). Magnification at a given location in the cluster is a direct product of the mass estimate (and the redshift of a background source). Therefore, the expanded BUFFALO observing area provides a unique dataset which can overcome the lack of accuracy of core-only mass models by being able to detect precisely where substructures are located and estimate precisely their mass (down to a few percent precision thanks to HST resolution, Jauzac et al., 2015a). The exact improvement in magnification estimates with BUFFALO is difficult to predict as it strongly depends on the dynamical state of each clusters, i.e., how many substructures exist and how massive those substructures are. However, once all BUFFALO clusters are analyzed, we will have for the first time a ’statistical’ sample allowing us to precisely estimate the bias induced by substructures on the magnification, which can then be related to the mass of those substructures.
5 Structure evolution & Dark Matter physics
The BUFFALO survey offers an unprecedented look at the large-scale structure of our universe by providing high-resolution observations from space with HST over an unusually wide area around the six massive Frontier Fields clusters. Flanking the core of those clusters with several pointings has extended the field of view out to 3/4 of the virial radius. This significant improvement is designed to allow improved investigations into the origin and evolution of large-scale structure. The current consensus model, CDM, assumes the hierarchical evolution of structures. They grow at a robustly-predicted rate, fed by the cosmic web’s filaments which carry dark matter and baryons towards the centers of what will become large clusters (Bond et al., 1996).
However, so far, very few observations have been able to detect those large-scale filaments (Dietrich et al., 2012; Jauzac et al., 2012; Eckert et al., 2015a; Connor et al., 2018). BUFFALO now allows an unprecedented resolution for mapping of the dark matter and will deliver data to detect material (both baryons and dark matter) falling on the clusters by the direct detection of galaxies and enhanced star-forming regions as tracers of the filaments and indirect detection of dark matter densities using weak lensing. Clearly identifying and locating individual filaments and the local cosmic web could be useful in constraining their effect on star formation and quenching (Aragon Calvo et al., 2019), galaxy angular momentum (Goh et al., 2019) and even, through a ”spiderweb test” (Neyrinck et al., 2018), a redshift-to-distance mapping.
In addition, reaching further away from the cluster center at the HST resolution will sharpen our understanding of merging events. Indeed, all the 6 HFF clusters show various states of merging (see Lotz et al. (2017) and references therein.) The extended view of the clusters can now be used to map the underlying dark matter distribution using both strong and weak lensing. At the depth and width of existing Frontier Fields observations, strong lensing already revealed a detailed view of the dark matter distribution in the cluster cores, but it is known that the mass in cluster outskirts can influence the inner core profile (Mahler et al., 2018; Acebron et al., 2017). BUFFALO now provides a unique view of the global mass distribution of clusters up to .
A few percent accuracy on weak-lensing measurements will be reachable due to highly constrained photometric redshift selection, primarly because of the unique HST and Spitzer/IRAC coverage of the BUFFALO fields. Extensive spectroscopic follow-up of these clusters is planned as well. The broader lensing mapping of the substructures will break the degeneracy coming from the outskirt mass contribution to the lensing potential.
CDM and hierarchical merging also predict the evolution of galaxies while falling in clusters. Extending HST observations to 3/4 also provide stringent observational constraints for the study of galaxy evolution within dense environments.
Niemiec et al. (2018) studied and quantified dark matter stripping of galaxy halos during their infall into clusters, as well as the evolution of their stellar mass and star formation using the Illustris-1 simulation. Such studies are often made in aggregate on a large number of clusters, but BUFFALO will do it on a cluster by cluster basis, avoiding smoothing out smaller scale influences on individual clusters. This also allows insight into the stripping of dark matter halos, environmental quenching mechanisms, including galaxy-galaxy interactions and harassment (Moore et al., 1996), strangulation (Balogh et al., 2000; Peng et al., 2015), the evolution of the stellar population, and the galaxy gas reservoir, providing critical insight into the cluster assembly history. The infall regions and intermediate-density environments traced by BUFFALO provide ideal observations to study these interactions (Moss, 2006; Perez et al., 2009; Tonnesen & Cen, 2012).
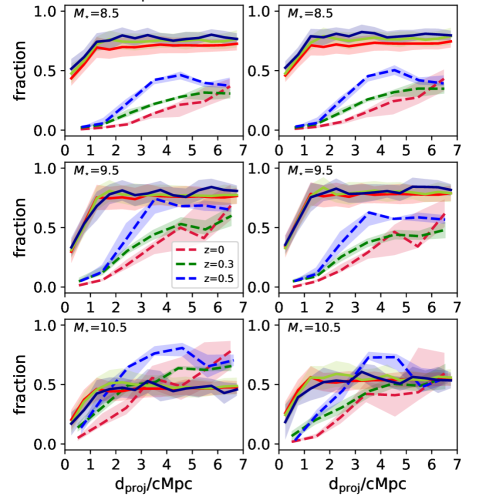
Cen et al. (2014) report a steep increase in the fraction of star-forming galaxies from the cluster centre up to . There is little consensus on this as it is shown in Fig. 5 for two galaxy formation simulations, the semi-analytic model Shark (Lagos et al., 2018) and the cosmological hydrodynamical simulations cluster suite C-EAGLE (Bahé et al., 2017; Barnes et al., 2017). There are many differences worth highlighting - the simulations predict different star-forming/gas-rich galaxies overall fractions, particularly at low stellar masses (); C-EAGLE predicts fractions that continue to rise even out to , while Shark predicts a steep increase out to followed by a flattening; C-EAGLE predicts much stronger evolution over the last billion years than Shark. This shows that the observations of BUFFALO combined with local Universe cluster observations will offer strong constraints on the models, hopefully allowing to rule out some of the wildly different behavior seen in Fig. 5. Note that these differences arise even though both simulations account for quenching mechanisms typical of galaxy clusters, such as ram pressure stripping, lack of cosmological accretion, among others (Gunn & Gott, 1972; Bahé et al., 2013). Fig. 5 also shows the fraction of gas-rich galaxies, computed from their atomic plus molecular gas fraction, as a proxy for good candidates of “jellyfish” galaxies. Poggianti et al. (2018) show that the “jellyfish” galaxy population can be used to investigate the density of the cluster gas halos by probing the material in star-forming regions coming out of the galaxies as they fall into the cluster. In BUFFALO we expect to probe these galaxies at intermediate redshifts, building on previous studies in HFF clusters (Schmidt et al., 2014; Treu et al., 2015; Vulcani et al., 2016).
In recent decades, the theoretical framework that describes the formation of cosmic structures has been tested by increasingly precise observations (Planck Collaboration et al., 2016a), which show good agreement with several key aspects of current models. BUFFALO offers an orthogonal probe by providing a detailed view of the clustering as well as its synergy with simulations of the universe and massive clusters such as the HFF ones. The Frontier Fields clusters remain rare massive clusters in simulations (Jauzac et al., 2016a, 2018a) and a better understanding of their environment, only possible with BUFFALO, will shed light on how they form and evolve. By finding simulated analogs of those six clusters, it is also possible to test various related cosmological effects on the growth rate, mass ratio among substructures, and merging events.
5.1 Cluster Science and Dark Matter Physics
High-resolution space-based observations of galaxy clusters have revolutionized the study of dark matter (Natarajan et al., 2002; Limousin et al., 2007; Richard et al., 2010). Early observations of merging galaxy clusters presented some of the most conclusive and unequivocal evidence for the existence of dark matter, while placing stringent limits on modified theories of gravity. For example the Bullet Cluster, a post-merger collision of two galaxy clusters in the plane of the sky, clearly shows the separation of intra-cluster gas and its associated cluster members (Clowe et al., 2004; Bradač et al., 2006). Thanks to weak-lensing, it was found that the majority of the mass lies in the galaxies, and not the gas, as suggested by modified gravity theories (Clowe et al., 2006). Following this study, multiple other merging clusters were found to exhibit similar properties, and detections of such offsets soon became ubiquitous (Bradač et al., 2008; Merten et al., 2011; Harvey et al., 2015; Jauzac et al., 2016a).
As a result of these studies it soon became clear that merging clusters could provide further insights into dark matter and not just evidence for its existence. For example, it is possible to constrain the self-interaction cross-section of dark matter using these clusters (Harvey et al., 2013; Kahlhoefer et al., 2014; Robertson et al., 2019). Self-interacting dark matter (SIDM) is an extension to the cold and collisionless dark matter paradigm that has received a lot of interest in the last decade. With its discriminative signals, tests of SIDM models provide a unique window in to the physics of the dark sector.
With the discovery of multiple colliding systems it soon became possible to collate these events and statistically average them in order to provide further constraints on SIDM. Methods that estimated the relative positions of dark matter, galaxies and gas were developed to statistically average over many merging events (Massey et al., 2011; Harvey et al., 2014). The first study of 30 merging galaxy clusters was carried out by Harvey et al. (2015), and constrained the cross-section of dark matter to cm2/g. However, a subsequent study found potential systematic and revised this estimate to cm2/g (Wittman et al., 2018). Either way, it was clear that there was statistical potential in these merging systems.
The BUFFALO survey will extend the already successful HFF program, providing a unique insight into the dynamics of dark matter during halo in-fall. Probing the regions out to , BUFFALO will examine a regime where the unknowns of core-passage will be circumvented, and positional estimates of the substructures will be cleaner.
Indeed, HST high-resolution will allow us to precisely locate and weigh dark matter substructures in the clusters (down to the percent level precision on mass measurement and down to 6% on the location of dark matter peaks, Jauzac et al., 2014, 2015a). It will then be possible to trace their dynamical history by combining the lensing analysis with the plethora of multi-wavelength data available on these six clusters, e.g., X-rays will help trace the gas, while optical, near-infrared, UV imaging and spectroscopy will help understand the dynamics and kinematics of the galaxies in the detected substructures. Moreover, with sample-specific simulations of multiple dark matter models, it will be possible to monitor, test and mitigate all known and unknown systematic errors. As a result, BUFFALO will provide the cleanest measure of SIDM from in-falling substructures to-date.
In addition to monitoring the trajectories of infalling halos to constrain SIDM, understanding the mass function within the clusters will provide important insights into the dynamics of dark matter. For example it has been suggested that A2744 exhibits too much substructure (Schwinn et al., 2017; Jauzac et al., 2016a), when compared to the predictions of standard CDM. This finding could possibly be an indication of exotic dark matter physics, however in such current small fields of view and on one sample, it is difficult to establish statistical significance. The extended imaging of BUFFALO with novel methods to compare observations to simulations such as the cluster power-spectrum (Mohammed et al., 2016) and peak analysis (Fan et al., 2010) will provide important insights in the substructure mass function of clusters and the dark matter that drives these statistics.
5.2 3D halo structure and non-thermal pressure support
How the dark and baryonic masses distribute in the halo’s gravitational potential is a fundamental prediction of models of large scale structure formation, allowing to use galaxy clusters as astrophysical laboratories, cosmological probes, and tests for fundamental physics. Probes at different wavelengths (optical, SZ, X-ray) can be used and combined to reconstruct three-dimensional triaxial ellipses describing the geometrical shape of the gas and total mass distribution, as obtained from the CLUster Multi-Probes in Three Dimensions (CLUMP-3D) project on 16 X-ray regular CLASH clusters (Sereno et al., 2018; Umetsu et al., 2018b; Chiu et al., 2018). In this analysis, weak lensing signal constrains the 2D mass and concentration which are deprojected thanks to the information on shape and orientation from X-ray (surface brightness and temperature) and SZ. The mass and concentration can be then determined together with the intrinsic shape and equilibrium status of the cluster as required by precision astronomy through a Bayesian inference method and not relying on the assumptions of spherical symmetry or hydrostatic equilibrium, which could bias results. The joint exploitation of different data-sets improves the statistical accuracy and enables us to measure the 3D shape of the cluster’s halo and any hydrostatic bias, evaluating the role of the non-thermal pressure support. In general, they obtained that the shapes are in good agreement with the predictions from the standard CDM cosmological model. However, compared to simulations, the data show a slight preference for more extreme minor-to-major axial ratios. We need a combination of more sensitive observational data to probe, also as function of halo mass and dynamical state, the 3D structure of the gas and dark matter distribution, assessing their consistency with CDM predictions and their equilibrium once geometrical biases (like projection) are corrected for.
5.3 Galaxy evolution
As the largest observable gravitationally bound structures in the Universe, galaxy clusters provide a unique tool for exploring the coeval evolution of galaxies and cosmic structures. Very effective star formation quenching is observed in clusters at all redshifts, where the fraction of star forming galaxies is lower than in the field (Hashimoto et al., 1998), and the fraction of early type morphologies (lenticulars, ellipticals) is the highest (Dressler, 1980). A major thrust of ongoing research is to understand these transitions, particularly using deep HST imaging of clusters (Martinet et al., 2017; Wagner et al., 2017; Marian et al., 2018; Olave-Rojas et al., 2018; Connor et al., 2019; Rodríguez-Muñoz et al., 2019).
There are strong hints that star formation suppression already occurs at large distances from the cluster cores (Haines et al., 2015; Bahé & McCarthy, 2015), and that red galaxies are located preferentially close to filament axes (e.g., Malavasi et al., 2017; Laigle et al., 2018). Therefore, understanding pre-processing of galaxies requires studies that move to regions well beyond the cluster core. Color gradients are required to unveil the location of recent star-formation (Villalobos et al., 2012; Liu et al., 2018) as well as evidence for stripping and quenching, e.g. so-called “jellyfish” galaxies in the process of being ram-pressure stripped (e.g., in Abell 2744, see Owers et al., 2012).
The BUFFALO survey is perfectly suited for these studies as it traces the intermediate-density environments where the quenching processes occur. The multi-wavelength data provides high-resolution measurements of the colors, star-formation rates, morphologies and local environments of galaxies extending out to the edges of the massive HFF clusters, enhancing the legacy value of the Frontier Fields observations.
5.4 Intracluster light
One of the most intriguing signatures of the assembly of galaxy clusters is a diffuse light known as intracluster light (ICL). This light is composed of a substantial fraction of stars not gravitationally bound to any particular galaxy but to the cluster potential. Observations have shown that the ICL is the product of interactions among the galaxies in the cluster. In this sense, the ICL is a unique tracer of how the assembly of the cluster proceeds through cosmic time (see Montes, 2019, for a review).
The integrated stellar population properties revealed by the ICL tell us about the dominant process responsible of the formation of this diffuse light and therefore of the mechanisms at play in the assembly of the cluster. Different scenarios for the origin of the ICL result in different stellar population properties, ranging from the shredding of dwarf galaxies (Purcell et al., 2007; Contini et al., 2014), to violent mergers with the central galaxies of the cluster (Murante et al., 2007; Conroy et al., 2007), in situ formation (Puchwein et al., 2010), or the pre-processing of diffuse light of groups infalling into the cluster (Mihos, 2004; De Lucia et al., 2012). These different mechanisms might vary within the cluster and during the history of the cluster (Cañas et al., 2019b).
Several works have already studied the ICL in the HFF clusters (Montes & Trujillo, 2014, 2018; Jiménez-Teja & Dupke, 2016; Morishita et al., 2017) but one of the difficulties encountered in these studies is the limited field of view of the HFF observations that prevent an accurate sky subtraction and therefore, accurate properties of this light at large radius from the central parts of the clusters. These studies have found that the main mechanism to produce ICL is the tidal stripping of massive satellites ( M⊙). However, these results only describe the more central parts of the clusters ( kpc).
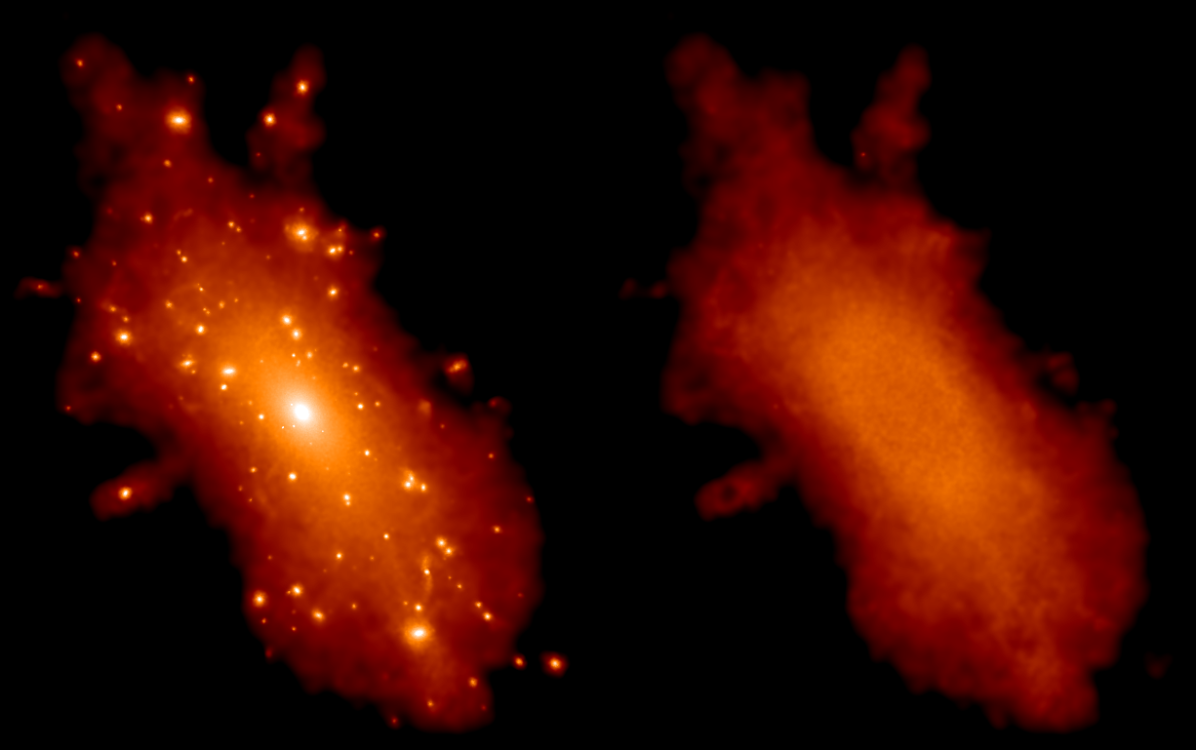
Using BUFFALO, we will be able to explore the ICL in detail up to . That will allow us to explore the formation mechanisms at play at large cluster radius and expand our knowledge of the formation of this diffuse light. The amount of light in the ICL provides information on the efficiency of the interactions that form this component (see Fig. 6). To date, simulations have provided contradictory predictions as to how the amount of ICL depends on halo mass as well as the expected evolution with time, with some works finding no dependence on halo mass (e.g. Contini et al. 2014; Rudick et al. 2011) while some others report a clear dependence (e.g. Murante et al. 2007; Cui et al. 2014). Evolution wise, some authors report strong evolution of the ICL fraction (e.g. Contini et al. 2014) or rather weak (e.g. Rudick et al. 2011). Some of these discrepancies are due to the variety of numerical definitions of ICL (see discussion in Cañas et al. 2019b), which generally use the 3D position of particles in simulations. Cañas et al. (2019a) introduced a full 6D method to define ICL and applied it to the Horizon-AGN simulations (Cañas et al., 2019b) (see Fig. 6) and C-EAGLE (Cañas et al. in preparation) to show that the ICL fraction is remarkably flat at the galaxy cluster regime, and that different simulations agree once the same ICL definition is applied. BUFFALO will place unique constraints on the ICL fraction, which together with local Universe measurements, will provide a large cosmic time baseline to compare with simulation predictions. The multiwavelength coverage of BUFFALO is crucial to derive the properties of the stellar populations of the ICL within the cluster to study how its different formation mechanisms vary with clustercentric distance. We will also be able to measure diffuse light in substructures and quantify for the first time the amount of light that will end up as ICL through pre-processing.
Finally, recent work has demonstrated that the ICL accurately follows the shape of the underlying dark matter halo in clusters of galaxies (Montes & Trujillo, 2019). This results was only possible thanks to the superb mass modelling available for the HFF clusters. The next step will be to extend this analysis to larger scales to assess whether the similarity between the distributions of ICL and mass holds at larger cluster radius. Simulations show that this similarity should hold out to 1.1 Mpc (Alonso-Asensio et al., in prep.), and with BUFFALO we will be able to finally assess it.
One limiting factor for deriving ICL brightness profiles is establishing a sky background. The outskirts of the HFF primary field still contain contributions from ICL, but observations in the same filters in the parallel fields were taken at different times. Due to the temporal variations of the sky background, the parallel fields therefore cannot be used by themselves to calibrate a sky background for use in the cluster center (DeMaio et al., 2015).
Thus, in addition to the previously-described observations, BUFFALO data of MACSJ1149 also include six additional orbits of imaging taken by GO-15308 (PI:A. Gonzalez). These six orbits were divided into three pointings of two orbits each; each pointing was observed with the F105W filter and the F160W filter on WFC3/IR for one orbit each. The three pointings linearly bridge the primary and parallel HFF fields such that each pointing has a 20% spatial overlap with its neighbors. Due to this overlap, temporal variations can be accounted for, and the dominant uncertainty in sky background becomes that of the flat-fielding process. Based on work by DeMaio et al. (2018), it is expected that the flat-fielding should reduce the residual systematic uncertainty to , enabling a measurement of the ICL radial brightness profile down to . In addition, GO-15308 includes parallel ACS observations in F606W and F814W, which extend the coverage of MACSJ1149 in three pointings per filter to the side of the cluster opposite the HFF parallel field.
6 Supernovae and Other Transients
The observations of this program have been purposely spaced into two visits (or epochs) per pointing, to allow for the discovery of supernovae (SNe) and other transients. By design, revisits to the same field in the same filter sets are separated by approximately 30 days, approximately matching the rise time of most SN types, including type Ia SNe, around . We expect this to yield a discovery rate per visit that is comparable to that in the Cluster Lensing And Supernovae with Hubble (CLASH; Postman et al. 2012), which will amount to about 10 to 25 events over the full duration of the BUFFALO survey.
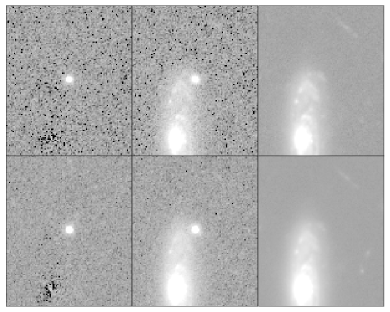
An example of one such discovery is given in Figure 7, a transient discovered in the AbellS1063 difference imaging at 22:49:13.70, -44:32:38.74. The cutouts show a 6 arcsecond box around the region, showing the reference HFF image, first epoch BUFFALO observation, and the difference frame in which the search for supernovae was conducted. This event is visible in both the ACS observations of the parallel field, taken April and May 2019, but also the first epoch of the WFC3 parallel pointing, taken October 2019, highlighting the power of the various time delays between BUFFALO images in the search for transient events.
A summary of the preliminary searches of each field, conducted after each epoch was processed, for supernovae and transients is shown in Table 3. As of the 22nd of October 21 of the 28 camera-pointing combinations have been conducted, and thus the preliminary findings of 6 SNe suggests a total of 8 over the entire BUFFALO program, slightly lower than predicted by CLASH. However, more thorough follow up searches will be conducted which may yield fainter or more obscure detections, increasing the detection rate.
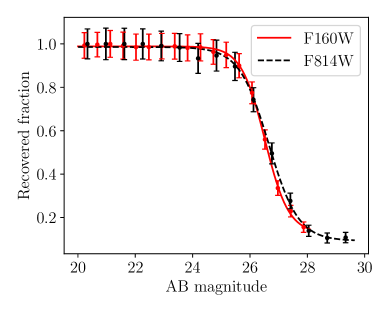
To probe the expected sensitivity of the BUFFALO difference images, we conducted a simple test. Fake sources were injected randomly into the drizzled difference images, with AB magnitudes in the range 20 to 30, with appropriate Poisson noise. These were then recovered using a simple peak finding algorithm, looking for sources with peak count rates above 0.03 count/s – roughly the lowest pixel count rate that is qualitatively visible above the BUFFALO difference images background by eye. The recovery fraction as a function of magnitude is shown in Figure 8. Given the similar zero points of the two filters, the 50% recovery rate is 26.5 mag and the 95% recovery rate is 25th magnitude for both. The very faintest recoverable SNe are 27-28th magnitude in the F160W filter, and 29-30th magnitude in F814W, due in part to the differing detector pixel scales, drizzled onto a common 0.06 arcsecond scale. However, it should be noted that this efficiency rate is quite optimistic, as it requires a fairly quiescient background in both frames contributing to the difference image. High background count rates, or supernovae lying near the center of galaxies, will suffer higher backgrounds or poor dither pattern noise (see left panels, Figure 7), raising the minimum count rate at which transients are detectable. Therefore a more conservative estimate might put the minimum count rate at 0.3 count/s, and thus reduce the 50% completeness limit of detections to 24th magnitude, and the 95% recovery rate to 22.5 mag. As all currently detected sources are of order 21-22nd magnitude (see Table 3), it is likely that we are complete at this brighter detection threshold, but will require follow up studies to recover the very faintest objects.
| Field | RA (H:M:S) | Dec (D:M:S) | Detected Filters | AB Mag | Date | Pointing | Epoch | Redshift |
|---|---|---|---|---|---|---|---|---|
| MACS0416 | 04:16:14.25 | -24:03:41.16 | F606W | 22-23 | Feb 2019 | Main | Epoch 2 | z 0.3 |
| 04:16:33.05 | -24:06:44.66 | F606W | Sep 2019 | Parallel | Epoch 2 | |||
| AbellS1063 | 22:48:53.56 | -44:31:19.59 | F105W | Jun 2019 | Main | Epoch 2 | ||
| F125W | ||||||||
| F160W | ||||||||
| 22:49:13.70 | -44:32:38.74 | F606W | 22.400.20 | Jun 2019 | Parallel | Epoch 2 | ||
| F814W | 21.800.20 | |||||||
| F105W | 22.690.03 | Oct 2019 | Parallel | Epoch 1 | ||||
| F125W | 22.690.03 | |||||||
| F160W | 22.610.04 | |||||||
| Abell 2744 | 00:14:28.55 | -30:23:33.98 | F606W | Jul 2019 | Main | Epoch 2 | z 0.2-0.3 | |
| F814W | ||||||||
| 0:14:26.56 | -30:23:44.17 | F606W | Jul 2019 | Main | Epoch 2 | |||
| F814W |
The BUFFALO observations may contribute SN detections at a uniquely high redshift range. Infrared imaging programs with HST like this one have been the most efficient approach for discovery of SNe at , the highest redshift regime where SNe Ia and normal luminosity core collapse SNe (CCSNe) have been detected (Graur et al., 2014; Rodney et al., 2014, 2015a; Strolger et al., 2015). Gravitational lensing from the clusters that dominate the center of each BUFFALO field will magnify background SNe, making it possible to detect SNe at redshifts that would normally be undetectable (cf. Rubin et al. 2018), though lensing does reduce the high-z survey volume behind the cluster (Barbary et al., 2012).
The BUFFALO program also could potentially locate SNe behind the clusters that are significantly magnified by gravitational lensing (Patel et al., 2014; Nordin et al., 2014; Rodney et al., 2015b). These lens-magnified events can provide a valuable test of the gravitational lensing models, and have been informative in the refinement of lens models for Frontier Fields clusters. There is also a small, but non-zero, chance of locating another strongly-lensed SN with multiple images, similar to “SN Refsdal” (Kelly et al., 2015). A SN that is multiply-imaged by a cluster lens is likely to have measurable time delays (Kelly et al., 2016; Rodney et al., 2016), and could potentially be used to measure the Hubble constant (Grillo et al., 2018). Deep imaging surveys of the Frontier Fields clusters have revealed other exotic transient events, with extreme magnifications (Rodney et al., 2018) or even (Kelly et al., 2018; Chen et al., 2019) The BUFFALO imaging could discover such events at redshifts , but the rates of such extreme microlensing events are highly uncertain, and the BUFFALO cadence is not optimized for their discovery (see, however, Kaurov et al. (2019) in which they predict the interval between caustic transient events of 1 yr).
7 Data Products
A major goal of BUFFALO is to produce data products which can be used by the entire astronomical community, both as standalone catalogs and in preparation for additional observations with the James Webb Space Telescope (JWST). Release of these products will be via the Mikulski Archive for Space Telescopes111http://archive.stsci.edu/. In an effort to release initial data as quickly as possible, these catalogs will be released individually for each of the six Frontier Fields clusters and parallel fields rather than waiting for the entire program to be complete.
7.1 High-level Mosaics
BUFFALO will release a mosaic in each of the five HST bands, combining the new data with previous Frontier Fields observations in the same bands where it is available. The first of these mosaics, Abell 370 (Fig. 9, is now available on MAST concurrent with the publication of this paper. Mosaics for the other clusters will be released as available, with a strong effort to release as many as possible prior to relevant proposal deadlines. Although these first data will be quickly presented, it is anticipated that more significant scientific value will come from value-added, multi-wavelength catalogs and associated models.
7.2 Catalogs
BUFFALO will produce several value-added catalogs, with an initial release for Abell 370 and updated planned as additional clusters are completed. These catalogs will exploit BUFFALO photometric data along with all available multi-wavelength observations from the HST archive. A list of existing datasets can be found in Table 5.
It will also include ancillary data from near-IR surveys (Brammer et al. 2016; Nonino et al., in prep.222http://archive.eso.org/cms/eso-archive-news/first-data-release-from-the-galaxy-clusters-at-vircam-gcav-eso-vista-public-survey.html) and the Spitzer images that are a cornerstone of the BUFFALO program (see § 2). Photometric redshifts will be derived from such a large photometric baseline by means of state-of-the-art software as EAZY (Brammer et al., 2008) and LePhare (Arnouts et al., 1999; Ilbert et al., 2006), fitting galaxy (and stellar) templates to the spectral energy distribution (SED) of each object. Galaxy physical properties (stellar mass, star formation rate, etc.) will be inferred by means of an additional SED fitting phase based on stellar population synthesis models (Conroy, 2013). Recent studies have found the inclusion of nebular emission to be crucial to estimating physical parameters of galaxies from SED-fitting, in particular at high redshift (see e.g. Schaerer & de Barros, 2012). An additional method combining stellar population models (Bruzual & Charlot, 2003) with nebular emission line models (Gutkin et al., 2016) in an SED-fit with the Bayesian code BEAGLE (Chevallard & Charlot, 2016), which is optimized to yield both photometric redshifts and galaxy physical parameters simultaneously, will therefore also be applied to the catalogs. Alternate “data-driven” methods not relying on synthetic templates (cf. van der Maaten & Hinton 2008; Van Der Maaten 2014; Steinhardt et al., in prep.) will be also applied to show the potential of novel machine learning methods in this field of research. The BUFFALO team includes authors of reference SED fitting studies and techniques as well as HFF luminosity and mass functions (Brammer et al., 2008; Coe et al., 2015; Ishigaki et al., 2015; Connor et al., 2017; Davidzon et al., 2017; Ishigaki et al., 2017; Kawamata et al., 2018) and will use this knowledge to produce a comprehensive “consensus catalog” designed to be used for a wide range of analyses. Moreover, structural parameters for foreground galaxies will be provided via morphological analysis through GALFIT (Peng et al., 2010) and GALAPAGOS (Barden et al., 2012). These codes will be applied with a strategy similar to that used in Morishita et al. (2017).
The Abell 370 catalogs will be released in Pagul et al. and Niemiec et al. (both in preparation), including:.
-
•
Photometry
-
•
Photometric redshift (plus spectroscopic redshifts when available) and physical properties
-
•
Cluster membership
-
•
ICL map and structural parameters of foreground galaxies
-
•
Mass models as described in § 7.3
We refer the reader to those papers for further details about the catalog-making process. Catalogs for the other clusters are expected to be released approximately six months after their observations are completed (Table 2) and will include the same products as the Abell 370 catalog.
7.3 Mass Models
The BUFFALO team includes groups which have been responsible for producing a variety of independent mass models for the HFF clusters from earlier datasets (Jauzac et al., 2014; Johnson et al., 2014; Lam et al., 2014; Richard et al., 2014; Diego et al., 2015a, b; Jauzac et al., 2015a, b; Oguri, 2015; Sharon & Johnson, 2015; Wang et al., 2015; Williams et al., 2015; Diego et al., 2016a, b; Harvey et al., 2016; Jauzac et al., 2016b; Johnson & Sharon, 2016; Kawamata et al., 2016; Sebesta et al., 2016; Treu et al., 2016; Priewe et al., 2017; Diego et al., 2018; Finney et al., 2018; Jauzac et al., 2018a; Mahler et al., 2018; Strait et al., 2018; Williams et al., 2018; Sebesta et al., 2019; Williams & Liesenborgs, 2019). Each of these groups will generate an independent mass model (e.g., Niemiec et al. in prep. for Abell 370), based upon a variety of fitting methods (cf. § 3). In order to analyse the intrinsic properties of background lensed galaxies, the BUFFALO collaboration will follow the HFF philosophy and release high-level data products through the MAST archive for the scientific community. An effort is being made to release all of the models for each specific cluster simultaneously in order to encourage a comparison between them.
For strong, weak or joint strong and weak lensing modelings, each independent team from the BUFFALO collaboration will deliver mass, magnification at several redshift, deflection, convergence and shear maps together with their associated error maps, as well as weak-lensing catalogues. Finally, an online magnification calculator will also be available for fast magnification and errors estimates.
7.4 Planned Releases
Data products for each cluster will be released individually, in order to provide the initial data as rapidly as possible. The first release will contain a mosaic, followed later by the value-added catalogs and mass models. If HST observations follow the current schedule (§ 2), this would result in approximately the release schedule shown in Table 4.
| Field | Observations Complete | Mosaic | Catalogs and Mass Models |
|---|---|---|---|
| Abell 370 | 2019 Jan | 2019 Dec | 2020 Jan |
| MACS J0717.5+3745 | 2019 Apr | 2019 Dec | 2020 Apr |
| MACS J0416.1-2403 | 2019 Sep | 2020 Mar | 2020 Sep |
| Abell S1063 | 2019 Nov | 2020 May | 2020 Nov |
| Abell 2744 | 2019 Dec | 2020 Jun | 2020 Dec |
| MACS J1149.5+2223 | 2020 May | 2020 Nov | 2021 May |
8 Summary
The BUFFALO survey will expand the area of HST coverage by approximately a factor of four around the six Hubble Frontier Fields (HFF), a region which already has multi-wavelength coverage including ultradeep Spitzer imaging. BUFFALO covers this region in five filters, WFC3/IR F105W, F125W, and F160W along with ACS/WFC F606W and F814W, with depths chosen based upon what has been learned from existing surveys both in HFF and other ultradeep fields. As with the original HFF program, this expanded coverage will simultaneously provide new insights into a wide range of problems at both high and low redshift.
The expanded coverage will not only discover many new sources at , with the highest-redshift BUFFALO source most likely to lie at , but also provide a significant improvement in measurements of cosmic variance. Both will be important for designing observational programs with JWST. The former is necessary because the NIRSPEC field of view is larger than previous HFF coverage, but fits within BUFFALO. The latter will be important both for designing JWST surveys and as a test of theoretical models of early galaxy assembly.
The same observations will allow an improvement in the mass models of these clusters, both in their central regions and in cluster outskirts. BUFFALO is to be the first large HST program with an emphasis on studying the dynamics of infalling cluster substructures. Filamentary structures may contain even a majority of the mass and provide critical insights into the dynamics of galaxy assembly and the cosmic web, and these studies will likely be a significant part of the legacy value of BUFFALO. At the same time, the improvement in mass models of the clusters themselves will not only improve our understanding of structure evolution and dark matter physics, but also improve magnification maps and therefore our existing measurements of the highest-redshift galaxy population accessible prior to JWST.
Finally, BUFFALO holds the possibility for serendipitous discoveries. The most probable would be the discovery of a lensed supernova or other lensed high-redshift transient. If one is found, it would allow a major improvement in mass models and related studies for the cluster in which it is found. Because of increased cosmic variance towards high redshift and towards high mass, it is also possible that BUFFALO will discover a very early galaxy or assembling galaxy protocluster.
The BUFFALO survey is currently scheduled to have observations completed in May 2020. Data will be released individually as cluster analysis is completed, with the first data from Abell 370 available on MAST concurrent with the publication of this paper. Mosaics will be available on MAST first, with value-added catalogs and a variety of mass and lensing models made available later.
References
- Acebron et al. (2017) Acebron, A., Jullo, E., Limousin, M., et al. 2017, MNRAS, 470, 1809
- Adelberger et al. (1998) Adelberger, K. L., Steidel, C. C., Giavalisco, M., et al. 1998, ApJ, 505, 18
- Aragon Calvo et al. (2019) Aragon Calvo, M. A., Neyrinck, M. C., & Silk, J. 2019, The Open Journal of Astrophysics, 2, 7
- Arnouts et al. (1999) Arnouts, S., Cristiani, S., Moscardini, L., et al. 1999, MNRAS, 310, 540
- Ashby et al. (2015) Ashby, M. L. N., Willner, S. P., Fazio, G. G., et al. 2015, ApJS, 218, 33
- Ashby et al. (2018) Ashby, M. L. N., Caputi, K. I., Cowley, W., et al. 2018, ApJS, 237, 39
- Bahé & McCarthy (2015) Bahé, Y. M., & McCarthy, I. G. 2015, MNRAS, 447, 969
- Bahé et al. (2013) Bahé, Y. M., McCarthy, I. G., Balogh, M. L., & Font, A. S. 2013, MNRAS, 430, 3017
- Bahé et al. (2017) Bahé, Y. M., Barnes, D. J., Dalla Vecchia, C., et al. 2017, MNRAS, 470, 4186
- Balestra et al. (2016) Balestra, I., Mercurio, A., Sartoris, B., et al. 2016, ApJS, 224, 33
- Balogh et al. (2000) Balogh, M. L., Navarro, J. F., & Morris, S. L. 2000, ApJ, 540, 113
- Barbary et al. (2012) Barbary, K., Aldering, G., Amanullah, R., et al. 2012, ApJ, 745, 31
- Barden et al. (2012) Barden, M., Häußler, B., Peng, C. Y., McIntosh, D. H., & Guo, Y. 2012, MNRAS, 422, 449
- Barnes et al. (2017) Barnes, D. J., Kay, S. T., Bahé, Y. M., et al. 2017, MNRAS, 471, 1088
- Beckwith et al. (2006) Beckwith, S. V. W., Stiavelli, M., Koekemoer, A. M., et al. 2006, AJ, 132, 1729
- Behroozi et al. (2018) Behroozi, P., Wechsler, R., Hearin, A., & Conroy, C. 2018, ArXiv e-prints, arXiv:1806.07893
- Behroozi & Silk (2015) Behroozi, P. S., & Silk, J. 2015, ApJ, 799, 32
- Bonamigo et al. (2018) Bonamigo, M., Grillo, C., Ettori, S., et al. 2018, ApJ, 864, 98
- Bond et al. (1996) Bond, J. R., Kofman, L., & Pogosyan, D. 1996, Nature, 380, 603
- Bouwens et al. (2015) Bouwens, R. J., Illingworth, G. D., Oesch, P. A., et al. 2015, ApJ, 803, 34
- Bouwens et al. (2016) Bouwens, R. J., Oesch, P. A., Labbé, I., et al. 2016, ApJ, 830, 67
- Bradač et al. (2008) Bradač, M., Allen, S. W., Treu, T., et al. 2008, ApJ, 687, 959
- Bradač et al. (2006) Bradač, M., Clowe, D., Gonzalez, A. H., et al. 2006, ApJ, 652, 937
- Bradač et al. (2014) Bradač, M., Ryan, R., Casertano, S., et al. 2014, ApJ, 785, 108
- Brammer et al. (2008) Brammer, G. B., van Dokkum, P. G., & Coppi, P. 2008, ApJ, 686, 1503
- Brammer et al. (2016) Brammer, G. B., Marchesini, D., Labbé, I., et al. 2016, ApJS, 226, 6
- Bridge et al. (2019) Bridge, J. S., Holwerda, B. W., Stefanon, M., et al. 2019, ApJ, 882, 42
- Broadhurst et al. (2005) Broadhurst, T., Takada, M., Umetsu, K., et al. 2005, ApJ, 619, L143
- Bruzual & Charlot (2003) Bruzual, G., & Charlot, S. 2003, MNRAS, 344, 1000
- Cañas et al. (2019a) Cañas, R., Elahi, P. J., Welker, C., et al. 2019a, MNRAS, 482, 2039
- Cañas et al. (2019b) Cañas, R., Lagos, C. d. P., Elahi, P. J., et al. 2019b, arXiv e-prints, arXiv:1908.02945
- Cen et al. (2014) Cen, R., Roxana Pop, A., & Bahcall, N. A. 2014, Proceedings of the National Academy of Science, 111, 7914
- Chen et al. (2019) Chen, W., Kelly, P. L., Diego, J. M., et al. 2019, arXiv e-prints, arXiv:1902.05510
- Chevallard & Charlot (2016) Chevallard, J., & Charlot, S. 2016, MNRAS, 462, 1415
- Chiu et al. (2018) Chiu, I. N., Umetsu, K., Sereno, M., et al. 2018, ApJ, 860, 126
- Clowe et al. (2006) Clowe, D., Bradač, M., Gonzalez, A. H., et al. 2006, ApJ, 648, L109
- Clowe et al. (2004) Clowe, D., Gonzalez, A., & Markevitch, M. 2004, ApJ, 604, 596
- Coe et al. (2015) Coe, D., Bradley, L., & Zitrin, A. 2015, ApJ, 800, 84
- Coe et al. (2019) Coe, D., Salmon, B., Bradac, M., et al. 2019, arXiv e-prints, arXiv:1903.02002
- Connor et al. (2019) Connor, T., Kelson, D. D., Donahue, M., & Moustakas, J. 2019, ApJ, 875, 16
- Connor et al. (2017) Connor, T., Donahue, M., Kelson, D. D., et al. 2017, ApJ, 848, 37
- Connor et al. (2018) Connor, T., Kelson, D. D., Mulchaey, J., et al. 2018, ApJ, 867, 25
- Conroy (2013) Conroy, C. 2013, ARA&A, 51, 393
- Conroy et al. (2007) Conroy, C., Wechsler, R. H., & Kravtsov, A. V. 2007, ApJ, 668, 826
- Contini et al. (2014) Contini, E., De Lucia, G., Villalobos, Á., & Borgani, S. 2014, MNRAS, 437, 3787
- Cui et al. (2014) Cui, W., Murante, G., Monaco, P., et al. 2014, MNRAS, 437, 816
- Daddi et al. (2007) Daddi, E., Dickinson, M., Morrison, G., et al. 2007, ApJ, 670, 156
- Davidzon et al. (2017) Davidzon, I., Ilbert, O., Laigle, C., et al. 2017, A&A, 605, A70
- De Lucia et al. (2012) De Lucia, G., Weinmann, S., Poggianti, B. M., Aragón-Salamanca, A., & Zaritsky, D. 2012, MNRAS, 423, 1277
- DeMaio et al. (2015) DeMaio, T., Gonzalez, A. H., Zabludoff, A., Zaritsky, D., & Bradač, M. 2015, MNRAS, 448, 1162
- DeMaio et al. (2018) DeMaio, T., Gonzalez, A. H., Zabludoff, A., et al. 2018, MNRAS, 474, 3009
- Diego et al. (2015a) Diego, J. M., Broadhurst, T., Molnar, S. M., Lam, D., & Lim, J. 2015a, MNRAS, 447, 3130
- Diego et al. (2016a) Diego, J. M., Broadhurst, T., Wong, J., et al. 2016a, MNRAS, 459, 3447
- Diego et al. (2015b) Diego, J. M., Broadhurst, T., Zitrin, A., et al. 2015b, MNRAS, 451, 3920
- Diego et al. (2007) Diego, J. M., Tegmark, M., Protopapas, P., & Sandvik, H. B. 2007, MNRAS, 375, 958
- Diego et al. (2016b) Diego, J. M., Broadhurst, T., Chen, C., et al. 2016b, MNRAS, 456, 356
- Diego et al. (2018) Diego, J. M., Schmidt, K. B., Broadhurst, T., et al. 2018, MNRAS, 473, 4279
- Dietrich et al. (2012) Dietrich, J. P., Werner, N., Clowe, D., et al. 2012, Nature, 487, 202
- Donahue et al. (2014) Donahue, M., Voit, G. M., Mahdavi, A., et al. 2014, ApJ, 794, 136
- Dressler (1980) Dressler, A. 1980, ApJ, 236, 351
- Eckert et al. (2015a) Eckert, D., Jauzac, M., Shan, H., et al. 2015a, Nature, 528, 105
- Eckert et al. (2015b) —. 2015b, Nature, 528, 105
- Ellis et al. (2013) Ellis, R. S., McLure, R. J., Dunlop, J. S., et al. 2013, ApJ, 763, L7
- Fan et al. (2010) Fan, Z., Shan, H., & Liu, J. 2010, ApJ, 719, 1408
- Finkelstein et al. (2015) Finkelstein, S. L., Song, M., Behroozi, P., et al. 2015, ArXiv e-prints, arXiv:1504.00005
- Finney et al. (2018) Finney, E. Q., Bradač, M., Huang, K.-H., et al. 2018, ApJ, 859, 58
- Frye et al. (2019) Frye, B. L., Pascale, M., Qin, Y., et al. 2019, ApJ, 871, 51
- Giavalisco et al. (2004) Giavalisco, M., Ferguson, H. C., Koekemoer, A. M., et al. 2004, ApJ, 600, L93
- Goh et al. (2019) Goh, T., Primack, J., Lee, C. T., et al. 2019, MNRAS, 483, 2101
- Graur et al. (2014) Graur, O., Rodney, S. A., Maoz, D., et al. 2014, ApJ, 783, 28
- Grillo et al. (2018) Grillo, C., Rosati, P., Suyu, S. H., et al. 2018, ApJ, 860, 94
- Grogin et al. (2011) Grogin, N. A., Kocevski, D. D., Faber, S. M., et al. 2011, ApJS, 197, 35
- Gunn & Gott (1972) Gunn, J. E., & Gott, J. Richard, I. 1972, ApJ, 176, 1
- Gunn & Stryker (1983) Gunn, J. E., & Stryker, L. L. 1983, ApJS, 52, 121
- Gutkin et al. (2016) Gutkin, J., Charlot, S., & Bruzual, G. 2016, MNRAS, 462, 1757
- Haines et al. (2015) Haines, C. P., Pereira, M. J., Smith, G. P., et al. 2015, ApJ, 806, 101
- Harvey et al. (2016) Harvey, D., Kneib, J. P., & Jauzac, M. 2016, MNRAS, 458, 660
- Harvey et al. (2013) Harvey, D., Massey, R., Kitching, T., et al. 2013, MNRAS, 433, 1517
- Harvey et al. (2015) Harvey, D., Massey, R., Kitching, T., Taylor, A., & Tittley, E. 2015, Science, 347, 1462
- Harvey et al. (2014) Harvey, D., Tittley, E., Massey, R., et al. 2014, MNRAS, 441, 404
- Hashimoto et al. (1998) Hashimoto, Y., Oemler, Jr., A., Lin, H., & Tucker, D. L. 1998, ApJ, 499, 589
- Ilbert et al. (2006) Ilbert, O., Arnouts, S., McCracken, H. J., et al. 2006, A&A, 457, 841
- Illingworth et al. (2013) Illingworth, G. D., Magee, D., Oesch, P. A., et al. 2013, ApJS, 209, 6
- Ishigaki et al. (2017) Ishigaki, M., Kawamata, R., Ouchi, M., Oguri, M., & Shimasaku, K. 2017, ArXiv e-prints, arXiv:1702.04867
- Ishigaki et al. (2015) Ishigaki, M., Kawamata, R., Ouchi, M., et al. 2015, ApJ, 799, 12
- Jansen et al. (2001) Jansen, F., Lumb, D., Altieri, B., et al. 2001, A&A, 365, L1
- Jauzac et al. (2012) Jauzac, M., Jullo, E., Kneib, J.-P., et al. 2012, MNRAS, 426, 3369
- Jauzac et al. (2014) Jauzac, M., Clément, B., Limousin, M., et al. 2014, MNRAS, 443, 1549
- Jauzac et al. (2015a) Jauzac, M., Richard, J., Jullo, E., et al. 2015a, MNRAS, 452, 1437
- Jauzac et al. (2015b) Jauzac, M., Jullo, E., Eckert, D., et al. 2015b, MNRAS, 446, 4132
- Jauzac et al. (2016a) Jauzac, M., Eckert, D., Schwinn, J., et al. 2016a, MNRAS, 463, 3876
- Jauzac et al. (2016b) Jauzac, M., Richard, J., Limousin, M., et al. 2016b, MNRAS, 457, 2029
- Jauzac et al. (2018a) Jauzac, M., Eckert, D., Schaller, M., et al. 2018a, MNRAS, 481, 2901
- Jauzac et al. (2018b) —. 2018b, MNRAS, 481, 2901
- Jiménez-Teja & Dupke (2016) Jiménez-Teja, Y., & Dupke, R. 2016, ApJ, 820, 49
- Johnson & Sharon (2016) Johnson, T. L., & Sharon, K. 2016, ApJ, 832, 82
- Johnson et al. (2014) Johnson, T. L., Sharon, K., Bayliss, M. B., et al. 2014, ApJ, 797, 48
- Jullo & Kneib (2009) Jullo, E., & Kneib, J.-P. 2009, MNRAS, 395, 1319
- Jullo et al. (2007) Jullo, E., Kneib, J.-P., Limousin, M., et al. 2007, New Journal of Physics, 9, 447
- Kahlhoefer et al. (2014) Kahlhoefer, F., Schmidt-Hoberg, K., Frandsen, M. T., & Sarkar, S. 2014, MNRAS, 437, 2865
- Kaurov et al. (2019) Kaurov, A. A., Dai, L., Venumadhav, T., Miralda-Escudé, J., & Frye, B. 2019, ApJ, 880, 58
- Kawamata et al. (2018) Kawamata, R., Ishigaki, M., Shimasaku, K., et al. 2018, ApJ, 855, 4
- Kawamata et al. (2016) Kawamata, R., Oguri, M., Ishigaki, M., Shimasaku, K., & Ouchi, M. 2016, ApJ, 819, 114
- Kelly et al. (2015) Kelly, P. L., Rodney, S. A., Treu, T., et al. 2015, Science, 347, 1123
- Kelly et al. (2016) —. 2016, ApJ, 819, L8
- Kelly et al. (2018) Kelly, P. L., Diego, J. M., Rodney, S., et al. 2018, Nature Astronomy, 2, 334
- Koekemoer et al. (2011) Koekemoer, A. M., Faber, S. M., Ferguson, H. C., et al. 2011, ApJS, 197, 36
- Koekemoer et al. (2013) Koekemoer, A. M., Ellis, R. S., McLure, R. J., et al. 2013, ApJS, 209, 3
- Labbé et al. (2013) Labbé, I., Oesch, P. A., Bouwens, R. J., et al. 2013, ApJ, 777, L19
- Labbé et al. (2015) Labbé, I., Oesch, P. A., Illingworth, G. D., et al. 2015, ApJS, 221, 23
- Lagattuta et al. (2019) Lagattuta, D. J., Richard, J., Bauer, F. E., et al. 2019, MNRAS, 485, 3738
- Lagos et al. (2018) Lagos, C. d. P., Tobar, R. J., Robotham, A. S. G., et al. 2018, MNRAS, 481, 3573
- Laigle et al. (2018) Laigle, C., Pichon, C., Arnouts, S., et al. 2018, MNRAS, 474, 5437
- Lam et al. (2014) Lam, D., Broadhurst, T., Diego, J. M., et al. 2014, ApJ, 797, 98
- Laporte et al. (2014) Laporte, N., Streblyanska, A., Clement, B., et al. 2014, A&A, 562, L8
- Lee et al. (2013) Lee, N., Sanders, D. B., Casey, C. M., et al. 2013, ApJ, 778, 131
- Liesenborgs et al. (2006) Liesenborgs, J., De Rijcke, S., & Dejonghe, H. 2006, MNRAS, 367, 1209
- Liesenborgs et al. (2009) Liesenborgs, J., de Rijcke, S., Dejonghe, H., & Bekaert, P. 2009, MNRAS, 397, 341
- Limousin et al. (2007) Limousin, M., Richard, J., Jullo, E., et al. 2007, ApJ, 668, 643
- Liu et al. (2018) Liu, F. S., Jia, M., Yesuf, H. M., et al. 2018, ApJ, 860, 60
- Lotz et al. (2017) Lotz, J. M., Koekemoer, A., Coe, D., et al. 2017, ApJ, 837, 97
- Lovisari et al. (2017) Lovisari, L., Forman, W. R., Jones, C., et al. 2017, ApJ, 846, 51
- Mahler et al. (2018) Mahler, G., Richard, J., Clément, B., et al. 2018, MNRAS, 473, 663
- Malavasi et al. (2017) Malavasi, N., Arnouts, S., Vibert, D., et al. 2017, MNRAS, 465, 3817
- Marian et al. (2018) Marian, V., Ziegler, B., Kuchner, U., & Verdugo, M. 2018, A&A, 617, A34
- Martinet et al. (2017) Martinet, N., Durret, F., Adami, C., & Rudnick, G. 2017, A&A, 604, A80
- Mashian et al. (2016) Mashian, N., Oesch, P. A., & Loeb, A. 2016, MNRAS, 455, 2101
- Massey et al. (2011) Massey, R., Kitching, T., & Nagai, D. 2011, MNRAS, 413, 1709
- McLure et al. (2010) McLure, R. J., Dunlop, J. S., Cirasuolo, M., et al. 2010, MNRAS, 403, 960
- Medezinski et al. (2016) Medezinski, E., Umetsu, K., Okabe, N., et al. 2016, ApJ, 817, 24
- Meneghetti et al. (2017) Meneghetti, M., Natarajan, P., Coe, D., et al. 2017, MNRAS, 472, 3177
- Merten et al. (2011) Merten, J., Coe, D., Dupke, R., et al. 2011, MNRAS, 417, 333
- Mihos (2004) Mihos, J. C. 2004, in Clusters of Galaxies: Probes of Cosmological Structure and Galaxy Evolution, ed. J. S. Mulchaey, A. Dressler, & A. Oemler, 277
- Mohammed et al. (2016) Mohammed, I., Saha, P., Williams, L. L. R., Liesenborgs, J., & Sebesta, K. 2016, MNRAS, 459, 1698
- Montes (2019) Montes, M. 2019, arXiv e-prints, arXiv:1912.01616
- Montes & Trujillo (2014) Montes, M., & Trujillo, I. 2014, ApJ, 794, 137
- Montes & Trujillo (2018) —. 2018, MNRAS, 474, 917
- Montes & Trujillo (2019) —. 2019, MNRAS, 482, 2838
- Moore et al. (1996) Moore, B., Katz, N., Lake, G., Dressler, A., & Oemler, A. 1996, Nature, 379, 613
- Morishita et al. (2017) Morishita, T., Abramson, L. E., Treu, T., et al. 2017, ApJ, 846, 139
- Morishita et al. (2018) Morishita, T., Trenti, M., Stiavelli, M., et al. 2018, ApJ, 867, 150
- Moss (2006) Moss, C. 2006, MNRAS, 373, 167
- Moster et al. (2011) Moster, B. P., Somerville, R. S., Newman, J. A., & Rix, H.-W. 2011, ApJ, 731, 113
- Murante et al. (2007) Murante, G., Giovalli, M., Gerhard, O., et al. 2007, MNRAS, 377, 2
- Natarajan et al. (2002) Natarajan, P., Loeb, A., Kneib, J.-P., & Smail, I. 2002, ApJ, 580, L17
- Neyrinck et al. (2018) Neyrinck, M. C., Hidding, J., Konstantatou, M., & van de Weygaert, R. 2018, Royal Society Open Science, 5, 171582
- Niemiec et al. (2018) Niemiec, A., Jullo, E., Giocoli, C., Limousin, M., & Jauzac, M. 2018, ArXiv e-prints, arXiv:1811.04996
- Noeske et al. (2007) Noeske, K. G., Weiner, B. J., Faber, S. M., et al. 2007, ApJ, 660, L43
- Nordin et al. (2014) Nordin, J., Rubin, D., Richard, J., et al. 2014, MNRAS, 440, 2742
- Oesch et al. (2010) Oesch, P. A., Bouwens, R. J., Carollo, C. M., et al. 2010, ApJ, 725, L150
- Oesch et al. (2013) Oesch, P. A., Labbé, I., Bouwens, R. J., et al. 2013, ApJ, 772, 136
- Oesch et al. (2014) Oesch, P. A., Bouwens, R. J., Illingworth, G. D., et al. 2014, ApJ, 786, 108
- Oesch et al. (2016) Oesch, P. A., Brammer, G., van Dokkum, P. G., et al. 2016, ApJ, 819, 129
- Oguri (2010) Oguri, M. 2010, PASJ, 62, 1017
- Oguri (2015) —. 2015, MNRAS, 449, L86
- Oke (1974) Oke, J. B. 1974, ApJS, 27, 21
- Olave-Rojas et al. (2018) Olave-Rojas, D., Cerulo, P., Demarco, R., et al. 2018, MNRAS, 479, 2328
- O’Shea et al. (2015) O’Shea, B. W., Wise, J. H., Xu, H., & Norman, M. L. 2015, ApJ, 807, L12
- Owers et al. (2012) Owers, M. S., Couch, W. J., Nulsen, P. E. J., & Rand all, S. W. 2012, ApJ, 750, L23
- Patel et al. (2014) Patel, B., McCully, C., Jha, S. W., et al. 2014, ApJ, 786, 9
- Peng et al. (2010) Peng, C. Y., Ho, L. C., Impey, C. D., & Rix, H.-W. 2010, AJ, 139, 2097
- Peng et al. (2015) Peng, Y., Maiolino, R., & Cochrane, R. 2015, Nature, 521, 192
- Perez et al. (2009) Perez, J., Tissera, P., Padilla, N., Alonso, M. S., & Lambas, D. G. 2009, MNRAS, 399, 1157
- Planck Collaboration et al. (2016a) Planck Collaboration, Adam, R., Ade, P. A. R., et al. 2016a, A&A, 594, A1
- Planck Collaboration et al. (2016b) Planck Collaboration, Ade, P. A. R., Aghanim, N., et al. 2016b, A&A, 594, A27
- Planck Collaboration et al. (2018) Planck Collaboration, Aghanim, N., Akrami, Y., et al. 2018, arXiv e-prints, arXiv:1807.06209
- Poggianti et al. (2018) Poggianti, B. M., Gullieuszik, M., Tonnesen, S., et al. 2018, MNRAS, 2855
- Postman et al. (2012) Postman, M., Coe, D., Benítez, N., et al. 2012, ApJS, 199, 25
- Priewe et al. (2017) Priewe, J., Williams, L. L. R., Liesenborgs, J., Coe, D., & Rodney, S. A. 2017, MNRAS, 465, 1030
- Puchwein et al. (2010) Puchwein, E., Springel, V., Sijacki, D., & Dolag, K. 2010, MNRAS, 406, 936
- Purcell et al. (2007) Purcell, C. W., Bullock, J. S., & Zentner, A. R. 2007, ApJ, 666, 20
- Richard et al. (2010) Richard, J., Smith, G. P., Kneib, J.-P., et al. 2010, MNRAS, 404, 325
- Richard et al. (2014) Richard, J., Jauzac, M., Limousin, M., et al. 2014, MNRAS, 444, 268
- Roberts-Borsani et al. (2016) Roberts-Borsani, G. W., Bouwens, R. J., Oesch, P. A., et al. 2016, ApJ, 823, 143
- Robertson et al. (2019) Robertson, A., Harvey, D., Massey, R., et al. 2019, MNRAS, 488, 3646
- Robertson et al. (2010) Robertson, B. E., Ellis, R. S., Dunlop, J. S., McLure, R. J., & Stark, D. P. 2010, Nature, 468, 49
- Robertson et al. (2014) Robertson, B. E., Ellis, R. S., Dunlop, J. S., et al. 2014, ApJ, 796, L27
- Rodney et al. (2014) Rodney, S. A., Riess, A. G., Strolger, L.-G., et al. 2014, AJ, 148, 13
- Rodney et al. (2015a) Rodney, S. A., Riess, A. G., Scolnic, D. M., et al. 2015a, AJ, 150, 156
- Rodney et al. (2015b) Rodney, S. A., Patel, B., Scolnic, D., et al. 2015b, ApJ, 811, 70
- Rodney et al. (2016) Rodney, S. A., Strolger, L. G., Kelly, P. L., et al. 2016, ApJ, 820, 50
- Rodney et al. (2018) Rodney, S. A., Balestra, I., Bradac, M., et al. 2018, Nature Astronomy, 2, 324
- Rodríguez-Muñoz et al. (2019) Rodríguez-Muñoz, L., Rodighiero, G., Mancini, C., et al. 2019, MNRAS, 485, 586
- Rubin et al. (2018) Rubin, D., Hayden, B., Huang, X., et al. 2018, ApJ, 866, 65
- Rudick et al. (2011) Rudick, C. S., Mihos, J. C., & McBride, C. K. 2011, ApJ, 732, 48
- Sayers et al. (2013) Sayers, J., Mroczkowski, T., Zemcov, M., et al. 2013, ApJ, 778, 52
- Sayers et al. (2016) Sayers, J., Golwala, S. R., Mantz, A. B., et al. 2016, ApJ, 832, 26
- Schaerer & de Barros (2012) Schaerer, D., & de Barros, S. 2012, in IAU Symposium, Vol. 284, The Spectral Energy Distribution of Galaxies - SED 2011, ed. R. J. Tuffs & C. C. Popescu, 20–25
- Schmidt et al. (2014) Schmidt, K. B., Treu, T., Trenti, M., et al. 2014, ApJ, 786, 57
- Schwinn et al. (2017) Schwinn, J., Jauzac, M., Baugh, C. M., et al. 2017, MNRAS, 467, 2913
- Scoville et al. (2007) Scoville, N., Abraham, R. G., Aussel, H., et al. 2007, ApJS, 172, 38
- Sebesta et al. (2019) Sebesta, K., Williams, L. L. R., Liesenborgs, J., Medezinski, E., & Okabe, N. 2019, MNRAS, 488, 3251
- Sebesta et al. (2016) Sebesta, K., Williams, L. L. R., Mohammed, I., Saha, P., & Liesenborgs, J. 2016, MNRAS, 461, 2126
- Sereno (2015) Sereno, M. 2015, MNRAS, 450, 3665, (CoMaLit-III)
- Sereno et al. (2018) Sereno, M., Umetsu, K., Ettori, S., et al. 2018, ApJ, 860, L4
- Sharon & Johnson (2015) Sharon, K., & Johnson, T. L. 2015, ApJ, 800, L26
- Speagle et al. (2014) Speagle, J. S., Steinhardt, C. L., Capak, P. L., & Silverman, J. D. 2014, ApJS, 214, 15
- Springel et al. (2005) Springel, V., White, S. D. M., Jenkins, A., et al. 2005, Nature, 435, 629
- Stark et al. (2013) Stark, D. P., Schenker, M. A., Ellis, R., et al. 2013, ApJ, 763, 129
- Steinhardt et al. (2016) Steinhardt, C. L., Capak, P., Masters, D., & Speagle, J. S. 2016, ApJ, 824, 21
- Steinhardt et al. (2014) Steinhardt, C. L., Speagle, J. S., Capak, P., et al. 2014, ApJ, 791, L25
- Strait et al. (2018) Strait, V., Bradač, M., Hoag, A., et al. 2018, ApJ, 868, 129
- Strolger et al. (2015) Strolger, L.-G., Dahlen, T., Rodney, S. A., et al. 2015, ApJ, 813, 93
- Tonnesen & Cen (2012) Tonnesen, S., & Cen, R. 2012, MNRAS, 425, 2313
- Trenti et al. (2011) Trenti, M., Bradley, L. D., Stiavelli, M., et al. 2011, ApJ, 727, L39
- Trenti et al. (2012) —. 2012, ApJ, 746, 55
- Treu et al. (2015) Treu, T., Schmidt, K. B., Brammer, G. B., et al. 2015, ApJ, 812, 114
- Treu et al. (2016) Treu, T., Brammer, G., Diego, J. M., et al. 2016, ApJ, 817, 60
- Umetsu (2013) Umetsu, K. 2013, ApJ, 769, 13
- Umetsu et al. (2016) Umetsu, K., Zitrin, A., Gruen, D., et al. 2016, ApJ, 821, 116
- Umetsu et al. (2014a) Umetsu, K., Medezinski, E., Nonino, M., et al. 2014a, ApJ, 795, 163
- Umetsu et al. (2014b) —. 2014b, ApJ, 795, 163
- Umetsu et al. (2018a) Umetsu, K., Sereno, M., Tam, S.-I., et al. 2018a, ApJ, 860, 104
- Umetsu et al. (2018b) —. 2018b, ApJ, 860, 104
- Van Der Maaten (2014) Van Der Maaten, L. 2014, J. Mach. Learn. Res., 15, 3221. http://dl.acm.org/citation.cfm?id=2627435.2697068
- van der Maaten & Hinton (2008) van der Maaten, L., & Hinton, G. 2008, Journal of Machine Learning Research, 9, 2579. http://www.jmlr.org/papers/v9/vandermaaten08a.html
- Villalobos et al. (2012) Villalobos, Á., De Lucia, G., Borgani, S., & Murante, G. 2012, MNRAS, 424, 2401
- Vogelsberger et al. (2014) Vogelsberger, M., Genel, S., Springel, V., et al. 2014, Nature, 509, 177
- von der Linden et al. (2014) von der Linden, A., Allen, M. T., Applegate, D. E., et al. 2014, MNRAS, 439, 2
- Vulcani et al. (2016) Vulcani, B., Treu, T., Schmidt, K. B., et al. 2016, ApJ, 833, 178
- Wagner et al. (2017) Wagner, C. R., Courteau, S., Brodwin, M., et al. 2017, ApJ, 834, 53
- Wang et al. (2015) Wang, X., Hoag, A., Huang, K. H., et al. 2015, ApJ, 811, 29
- Weisskopf et al. (2000) Weisskopf, M. C., Tananbaum, H. D., Van Speybroeck, L. P., & O’Dell, S. L. 2000, in Society of Photo-Optical Instrumentation Engineers (SPIE) Conference Series, Vol. 4012, Proc. SPIE, ed. J. E. Truemper & B. Aschenbach, 2–16
- Werner et al. (2004) Werner, M. W., Roellig, T. L., Low, F. J., et al. 2004, ApJS, 154, 1
- Williams & Liesenborgs (2019) Williams, L. L. R., & Liesenborgs, J. 2019, MNRAS, 482, 5666
- Williams et al. (2018) Williams, L. L. R., Sebesta, K., & Liesenborgs, J. 2018, MNRAS, 480, 3140
- Williams et al. (2015) Williams, L. L. R., Sebesta, K., Saha, P., Mohammed, I., & Liesenborgs, J. 2015, in IAU General Assembly, Vol. 29, 2255413
- Wittman et al. (2018) Wittman, D., Golovich, N., & Dawson, W. A. 2018, ApJ, 869, 104
- Yan et al. (2011) Yan, H., Yan, L., Zamojski, M. A., et al. 2011, ApJ, 728, L22
- Zheng et al. (2014) Zheng, W., Shu, X., Moustakas, J., et al. 2014, ApJ, 795, 93
- Zitrin et al. (2009) Zitrin, A., Broadhurst, T., Umetsu, K., et al. 2009, MNRAS, 396, 1985
- Zitrin et al. (2015) Zitrin, A., Fabris, A., Merten, J., et al. 2015, ApJ, 801, 44
| Field | Observatory | Wavelengths | Depth | Reference | |
|---|---|---|---|---|---|
| Abell 370 | VLT/HAWK-I | 2.2 | 26.18 | Brammer et al. (2016) | |
| Spitzer IRAC 1,2 | 3.6, 4.5 | 25.19, 25.09 | (PI: T. Soifer and P. Capak) | ||
| Spitzer IRAC 3,4 (cluster-only) | 5.8, 8.0 | 23.94, 23.39 | |||
| Spitzer MIPS (cluster-only) | 24 | 17.88 | |||
| Chandra (X-ray) | 515 | 88.0 | |||
| XMM-Newton (X-ray) | 0782150101 | 133.0 | |||
| Bolocam | 140 GHz | 11.8h | Sayers et al. (2013) | ||
| Planck | 100, 143, 217, 353, 545, 857 GHz | – | Planck Collaboration et al. (2016b) | ||
| Subaru/Suprime-Cam | ,,,, | 3.24ks ()) | von der Linden et al. (2014); Sereno (2015) | ||
| MACS J0717.5+3745 | Keck/MOSFIRE | 2.2 | 25.31 | Brammer et al. (2016) | |
| Spitzer IRAC 1,2,3,4 | 3.5, 4.5 | 25.04, 25.17 | (PI: T. Soifer and P. Capak) | ||
| Spitzer IRAC 3,4 | 5.8, 8.0 | 23.94, 23.39 | |||
| Spitzer MIPS | 24 | 17.35 | |||
| Chandra (X-ray) | 4200 | 58.5 | Donahue et al. (2014) | ||
| Chandra (X-ray) | 1655, 16235, 16305 | 19.9, 70.1, 94.3 | Jauzac et al. (2018b) | ||
| XMM-Newton (X-ray) | 0672420101, 0672420201, 0672420301 | 61.2, 69.3, 64.1 | Jauzac et al. (2018b) | ||
| MACS J0416.1-2403 | VLT/HAWK-I | 2.2 | 26.25 | Brammer et al. (2016) | |
| Spitzer | 3.5, 4.5 | 25.31, 25.44 | (PI: T. Soifer and P. Capak) | ||
| Chandra (X-ray) | 10446 | 15.8 | Donahue et al. (2014) | ||
| Chandra (X-ray) | 16236, 16237, 16523 | 39.9, 36.6, 71.1 | Balestra et al. (2016); Bonamigo et al. (2018) | ||
| Chandra (X-ray) | 16304, 17313 | 97.8, 62.8 | Balestra et al. (2016); Bonamigo et al. (2018) | ||
| Bolocam | 140 GHz | 7.8h | Sayers et al. (2013) | ||
| Planck | 100, 143, 217, 353, 545, 857 GHz | – | Planck Collaboration et al. (2016b) | ||
| Subaru/Suprime-Cam | ,, | – | Umetsu et al. (2014b); Sereno (2015) | ||
| Abell S1063 | VLT/HAWK-I | 2.2 | 26.31 | Brammer et al. (2016) | |
| Spitzer IRAC 1,2 | 3.6, 4.5 | 25.04, 25.04 | (PI: T. Soifer and P. Capak) | ||
| Spitzer IRAC 3,4 (cluster-only) | 5.8, 8.0 | 22.96, 22.64 | |||
| Spitzer MIPS (cluster-only) | 24 | 18.33 | |||
| Chandra (X-ray) | 4966, 3595 | 26.7, 19.9 | Donahue et al. (2014) | ||
| Chandra (X-ray) | 18611, 18818 | 49.5, 47.5 | Bonamigo et al. (2018) | ||
| XMM-Newton (X-ray) | 0504630101 | 52.7 | Lovisari et al. (2017) | ||
| Planck | 100, 143, 217, 353, 545, 857 GHz | – | Planck Collaboration et al. (2016b) | ||
| ESO/WFI | ,,,,, | – | Umetsu et al. (2014b); Sereno (2015) | ||
| Abell 2744 | VLT/HAWK-I | 2.2 | 26.28 | Brammer et al. (2016) | |
| Spitzer IRAC 1,2 | 3.6, 4.5 | 25.32, 25.08 | (PI: T. Soifer and P. Capak) | ||
| Spitzer IRAC 3,4 (cluster-only) | 5.8, 8.0 | 22.78, 22.45 | |||
| Spitzer MIPS (cluster-only) | 24 | 18.23 | |||
| XMM-Newton (X-ray) | 0743850101 | 111.9 | Eckert et al. (2015b) | ||
| Bolocam | 140 GHz | – | Sayers et al. (2016) | ||
| Planck | 100, 143, 217, 353, 545, 857 GHz | – | Planck Collaboration et al. (2016b) | ||
| Subaru/Suprime-Cam | ,,, | 3.12ks () | Medezinski et al. (2016); Sereno (2015) | ||
| MACS J1149.5+2223 | Keck/MOSFIRE | 2.2 | 25.41 | Brammer et al. (2016) | |
| Spitzer | 3.5, 4.5 | 25.24, 25.01 | (PI: T. Soifer and P. Capak) | ||
| Chandra (X-ray) | 3589 | 20.0 | Donahue et al. (2014) | ||
| Chandra (X-ray) | 1656, 16238, 16239, 16306 | 18.5, 35.6, 51.4, 79.7 | |||
| Chandra (X-ray) | 16582, 17595, 17596 | 18.8, 69.2, 72.1 | |||
| XMM-Newton (X-ray) | 0693661701 | 28.9 | Lovisari et al. (2017) | ||
| Bolocam | 140 GHz | 17.7h | Sayers et al. (2013) | ||
| Planck | 100, 143, 217, 353, 545, 857 GHz | – | Planck Collaboration et al. (2016b) | ||
| Subaru/Suprime-Cam | ,,,,, | 1.94ks ()) | Umetsu et al. (2014b); | ||
| von der Linden et al. (2014); Sereno (2015) |