Distal Explanations for Model-free Explainable Reinforcement Learning
Abstract
In this paper we introduce and evaluate a distal explanation model for model-free reinforcement learning agents that can generate explanations for ‘why’ and ‘why not’ questions. Our starting point is the observation that causal models can generate opportunity chains that take the form of ‘A enables B and B causes C’. Using insights from an analysis of 240 explanations generated in a human-agent experiment, we define a distal explanation model that can analyse counterfactuals and opportunity chains using decision trees and causal models. A recurrent neural network is employed to learn opportunity chains, and decision trees are used to improve the accuracy of task prediction and the generated counterfactuals. We computationally evaluate the model in 6 reinforcement learning benchmarks using different reinforcement learning algorithms. From a study with 90 human participants, we show that our distal explanation model results in improved outcomes over three scenarios compared with two baseline explanation models.
color=green!80, ,inline]Tim: I know I said to extend the abstract and intro, but the abstract is perhaps a bit too long now. I suggest restructuring a few ways: (1) start out with a sentence that is “In this paper, we…" to drive home the topic immediately; (2) then get straight into the first user study, but give a bit less details; (3) then mention the finding of opportunity chains and explain these; and (4) we show how to generate these, calling them ‘distal explanations’, and a brief overview of the study/results; but cut back on some of these details. color=yellow!80, ,inline]Prashan: have cut back some and summarised color=magenta!80, , inline]Liz: have further tightened the abstract
Keywords: Explainable AI; Explainable Reinforcement Learning; Human-Agent Interaction; Human-Agent Collaboration
1 Introduction
Understanding how artificially intelligent systems behave and make decisions has long since been a topic of interest, and in recent years has resurfaced as ‘Explainable AI’ (XAI). The ability to provide explanations of the behaviour of these systems is particularly important in scenarios where humans need to collaborate with intelligent agents. Often, the success of these collaborative tasks depends on how well the human understands both the long-term goals and immediate actions of the agent.
Explanation models that emulate human models of explanations have the potential to provide intuitive and natural explanations, allowing the human a deeper understanding of the agent (De Graaf and Malle, 2017; Abdul et al., 2018; Miller, 2018b; Wang et al., 2019). There exists a large body of literature in cognitive psychology that studies the nature of explanations. One prevalent theory is that explanations are innately causal (Halpern and Pearl, 2005). Causal explanations resonate with humans as we make use of causal models of the world to encode cause-effect relationships in our mind (Sloman, 2005), and leverage these models to explain why events happen. Causal models also enable the generation of counterfactual explanations—explanations about events that did not happen but could have under different circumstances (Halpern and Pearl, 2005). So causal explanations have the potential to provide ‘better’ explanations to humans.
Recent work in the XAI research community has demonstrated the effectiveness of causality and causal explanations for interpretability and explainability (Byrne, 2019; Klein, 2018; Gunning and Aha, 2019; Schwab and Karlen, 2019; Madumal et al., 2020). In the context of model-free reinforcement learning (RL) agents, causal models have been encoded using action influence graphs to generate explanations using causal chains (Madumal et al., 2020) and have been shown to support subjectively ‘better’ explanations and yield improved performance in task prediction (Hoffman et al., 2018) as compared with state-action based explanations (Khan et al., 2009). While action influence models provide a skeleton to generate causal explanations for RL agents, finer details of the composition of causal explanations can be absent. We argue that, through investigating interactions of RL agents and humans, some shortcomings of action influence models can potentially be alleviated.
color=green!80, ,inline]Tim: A recent review that Abeer got made a good point about this type of approach not really be ’grounded theory’ because it is not iterative. It is more ’thematic analysis’; see ‘Using thematic analysis in psychology’ Braun and Clarke. It doesn’t invalide the results, but it does mean those researchers in psych/design etc., wouldn’t go nuts over it :) color=yellow!80, ,inline]Prashan: changed the wording to themtic analysis
To ground the effect that explanation models have on human explanation, we conduct human-agent experiments on how humans formulate explanations of agent behaviour. Participants of this study received explanations from three different models: visual agent behaviour explanations; state-action based explanations (Khan et al., 2009); and causal explanations (Madumal et al., 2020). Then participants were asked to formulate their own explanations of the agents’ behaviour as a textual input. The study was carried out with 30 participants and we obtained 240 explanations in total. We used thematic analysis (Braun and Clarke, 2006) to identify recurring concepts present in the explanations.
Results of our analysis show that while causality was indeed present, these self-provided explanations predominantly referred to a future action that was dependent on the current action. Participants’ tendency to include a future action in their explanations indicates an understanding of the causal chain of actions and events. This phenomenon is well explored in cognitive psychology and is defined as opportunity chains (Hilton et al., 2005). We use insights gained from the human-agent study to inform our design of an explanation model that can explain opportunity chains and the future action termed the distal action. color=magenta!80, , inline]Liz: "Further support our hypothesis" - isn’t clear as it isn’t explicit what the hypothesis is here, also hard to interpret what a 2010 paper you haven’t discussed yet might be saying that is relevant; especially when here you say it’s similar, later you explain differences; maybe the solution is to put the claim about ’support’ in the discussion rather than the intro? color=yellow!80, ,inline]Prashan: removed this from intro
Hilton et al. (Hilton et al., 2005; McClure et al., 2007; Hilton et al., 2010) note that humans make use of opportunity chains to describe events through causal explanation. An opportunity chain takes the form of enables and causes (depicted in Figure 1), in which we call the ‘distal’ event or action. For example, an accident can be caused by slipping on ice which was enabled by water from a storm the day before. Opportunity chains are causal chains that can be extracted from action influence models. Thus action influence models can be used as a platform to augment causal explanations with opportunity chains.
To that end, we propose a distal explanation model that can generate opportunity chains as explanations for model-free RL agents. We provide definitions for distal explanations and learn the opportunity chains of extracted causal chains using a recurrent neural network (Schuster and Paliwal, 1997). A distal explanations by itself would not make a complete explanation. For this reason, we use action influence models (Madumal et al., 2020) to get the agent’s ‘goals’. We further improve upon action influence models by using decision trees to represent the agent’s policy.
color=green!80, ,inline]Tim: Both here and in the experiments, I think we should use a language different to ‘three starcraft II scenarios. Both in AAAI and in IJCAI, at least one reviewer thought there were major limitations with the study because they just saw it as a game. But for the 2nd and 3rd scenarios, the participants weren’t playing starcraft at all – they were doing very different scenarios that just used starcraft as a simulator. Here, I would just say "three scenarios". Later in experiment design, we should make it clear that we used the simulation platform but created things that are not starcraft games color=yellow!80, ,inline]Prashan: done
We computationally evaluate the accuracy of task prediction (Hoffman et al., 2018, p.12) and counterfactuals in 6 RL benchmark domains using 6 different RL algorithms, and show that our distal explanation model is robust and accurate across different environments and algorithms. Then we conduct human experiments using RL agents trained to solve 3 different scenarios, where agents solve 1) an adversarial task; 2) a search and rescue task; and 3) a human-AI collaborative build task. The human study was run with 90 participants, where we evaluate task prediction (Hoffman et al., 2018) and explanation satisfaction. Results indicate that our model performs better than the two tested baselines.
Our main contribution in this paper is twofold: 1) we introduce a distal action explanation model that is grounded on human data; 2) we extend action influence models by using decision trees to represent the agent’s policy and formalise explanation generation from decision nodes and causal chains. As secondary contributions, we also provide the coded corpus of human-agent experiment with 240 explanations and two custom maps that are suited for explainability in the StarCraft II environment.
2 Related Work
In this section we discuss the body of literature that explores explainability in reinforcement learning agents. We also note work that have influenced explanation and interpretability of reinforcement learning, some of which are central to our own method. Further, we briefly overview human-centred literature on explanation which has greatly influenced this work.
2.1 Explanations of MDP based Agents
Literature that sought to generate explanations for MDP based agents fall into the scope of preceding work on explainable RL. Often, these earlier work provided local explanations in that the explanation is for a question about an action of the agent.
The concept of ‘relevant variables’ in a factored state of an MDP was exploited by Elizalde et al. (2007) to generate explanations. Explanations were primarily targeted at human trainees of a system and explanations were built-in and were presented when an the operator (trainee) selected an incorrect action. An explanation constitutes a relevant variable that is selected by an expert for each action. Elizalde et al. later extended this work to generate explanations automatically based on the utility that a state variable had on the policy selecting the action (Elizalde et al., 2008; Elizalde and Sucar, 2009). Khan et al. (2009) was influenced from the relevant variable explanations and proposed minimally sufficient explanations for MDPs. Here, the long term effects of an optimal action is considered when generating the explanation. Three domain independent templates were used as the basis of explanations. We later use one of these templates as a benchmark method in the evaluation section. Relevant variable explanations present a straightforward method of generating explanations from an MDP, though their inability provide contrastive explanations of counterfactuals remains a weakness. Khan et al. (2009) attempted to remedy this by generating contrastive explanations through value-function comparisons. The effect MDP based agents’ explanations have on ‘trust’ was examined by Wang et al. (2016). Experiments were carried out to measure trust in human-robot teams influenced by Partially Observable MDP based explanations. As the measurement of trust was self-report, it is unclear whether the trust gain was from actually understanding the system.
2.2 Policy Explanations
Policy explanations make use of the agent’s policy to extract explanations. Explanations can be at the local level or the global level. Global level explanations generally provide an explanation for the whole policy. Some studies suggest that humans are more receptive to global explanations of agents in certain situations (van der Waa et al., 2018). We discuss literature on both global and local explanation methods in this section.
color=green!80, ,inline]Tim: I’m not sure about the paragraph below: "the underlying model (i.e. an MDP model)". Is it the MDP model that is a black box, or the policy function? I understood that it is the policy function that is a black box color=yellow!80, ,inline]Prashan: yes that is right, my mistake, fixed
Struckmeier et al. (2019) introduced a model-agnostic explanation generation method using agent policies. In cases where the underlying model (i.e. the policy function) is blackbox, Struckmeier et al. sample the policy of the agent to extract relevant state dimensions. Understanding of the agents’ policies were measured in a human-experiment and the perceived understanding of the human participant was used as a proxy to show the transparency of the agent.
Policy explanations of an agent generally aims to provide a ‘global’ interpretation of the agent’s behaviour. Hayes and Shah (2017) sought to improve the transparency by providing policy level explanations for agent based robot controllers. These behavioural explanations of the agent are considered as ‘summaries’ of the agent’s policy. Discreet, continuous and multi-agent domains were used to evaluate the generated policy descriptions against expert descriptions and were shown to improve the transparency of the robot. Amir and Amir (2018) also aims to summarise the agent’s behaviour and introduced the HIGHLIGHTS algorithm. Important states are extracted from the agent’s execution trace based on the Q-values. Human-subject experiments showed that participants preferred HIGHLIGHTS summary explanations compared to full policy explanations though in some situations participants’ assessments did not always correlate with their confidence. Policy summarisation was also explored in the context of inverse reinforcement learning to investigate if these explanations are viable if there is a discrepancy between the agent’s model and the human’s mental model.
color=green!80, ,inline]Tim: above: " participants preferred HIGHLIGHTS summary explanations" – compared to what? Should make this clear here color=yellow!80, ,inline]Prashan: done
2.3 Reinforcement Learning Agent Explanations
Here we discuss work in recent years that specifically use characteristics of reinforcement learning (e.g. rewards) to explain behaviour. These characteristics can be used to create an approximate model of the agents policy or model and then generate explanations through using the approximate model.
Tabrez et al. (2019) proposed a framework (RARE) that repair the agent’s understanding of the domain reward function through explanation. RARE is especially useful in human-agent collaborative scenarios when the human’s reward function of the collaborative task is erroneous. Explanations are given to the collaborators to update their own reward function. Human experiments were conducted to demonstrate the effectiveness of the RARE framework in collaborative tasks. Explanation in the context of interactive reinforcement learning (IRL) has been studied (Fukuchi et al., 2017). This approach uses the instructions given in the IRL process to the agent as representations to generate explanations about the future behaviour of the agent. Evaluated through a human study, this method affirms that when explanations are given in a familiar medium to the human (e.g. using instruction representations) can yield a deeper understanding of the agent. van der Waa et al. (2018) developed a method that can translate an MDP of a RL agent to an interpretable MDP. This translation model can then be used to generate a contrastive policy that can be queried using contrastive questions. A pilot study was carried out to evaluate the method, where the reported findings show that participants preferred the interpretable policy level explanations. Though these explanations were contrastive they were not based on an underlying causal model. Reward decomposition was used by Juozapaitis et al. (2019) to generate minimally sufficient explanations, where reward differences were used to provide explanations which answer what action does have an ‘advantage’ over another. Juozapaitis et al. utilise the nature of the reward structure often present in domains to explain action preferences of the agent.
2.4 Decision Tree Policy Explanations
Central to our own work, we discuss how interpretability and explainability was achieved through representing agents’ policies as decision trees or graphs.
From early work that represented the agent policy as a decision tree using the ‘G’ algorithm (Chapman and Kaelbling, 1991), past literature has explored how decision trees can be used to represent and abstract policies of MDPs. Roth et al. (2019) proposed a Q-improvment algorithm that builds an abstract decision tree policy for factored MDP based RL agents. Although decision tree policies are claimed to be more interpretable to humans than blackbox policies, the extent to which this is true is unclear as this work lacks human experiments. Abstract policy graphs have also been used as the basis to generate policy level explanations (Topin and Veloso, 2019). A feature importance measure was used to abstract multiple states into an abstract state which is then used to build the policy graph. The interpetability of the graph was evaluated computationally that shows a linear growth of the explanation size against an exponential growth of state-space. Although this implicitly demonstrates the interpretabilty of the approach, human experiments are needed to understand the effectiveness of the method.
Though above methods address interpretability to an extent, to the best of our knowledge previous literature has not studied how decision nodes from a decision tree can be incorporated with causal chains to provide explanations that are human-centred.
2.5 Human-Centred Explanation
Some researchers have recently emphasised how humans models of explanations can benefit XAI systems (Miller, 2018b) and how humans expect familiar models of explanations from XAI systems (De Graaf and Malle, 2017). Though some recent progress has been made (Madumal et al., 2020), human-centred computational models is still in its infancy.
Hilton et al. (Hilton et al., 2005; McClure et al., 2007; Hilton et al., 2010) has explored how causal chains of events inform and influence the explanations of humans. Opportunity chains can inform the explainee about long term dependencies that events have on each other, where certain events enable others. Human experiments have also been carried out that investigate he effects of opportunity chains on human-to-human explanation (Hilton et al., 2005). However, this work has not yet been extended to the case of model-free MDPs.
Our proposed distal explanation model take insights from social psychology literature to combine opportunity chains with causal explanations. To the best of our knowledge this is the first of such model in the context of explainable reinforcement learning agents.
3 Human-Agent Study: Insights from Human Explanations
color=green!80, ,inline]Tim: I would suggest making this section read a bit more like a study: outline the goals, then the setup, etc., all in their own section, rather than in a sub section. This gives the study a bit more of a proper feel. With the section being short and the study just being in Section 3.2, it feels a bit like a ‘throw-away’ study, when in fact, it was a very good study that gave us some useful insight color=yellow!80, ,inline]Prashan: done
color=cyan!80, , inline]Liz: I suggest it also needs more explicit discussion as to the insight gained, that separates it from the Hilton et al (2010) study color=yellow!80, ,inline]Prashan: added some more discussion contrasting to Hilton 2010 color=magenta!80, , inline]Liz: I think the commentary re your use of distal (looking forward) versus that in the psych literature (looking backward) needs to be more visible; also, there seems to be a thread of work using the ‘distal’ terminology that may warrant some visibility? eg see 2016 Cog Sci Society paper by Simon Stephan https://scholar.google.de/citations?user=_GsFvvAAAAAJ ; and maybe also you need a bit more on contemporary work on human models given the subsection title (which probably should be narrowed anyway to use the term "causal" somewhere? eg http://cicl.stanford.edu/publication/gerstenberg2020csm/ on counterfactual simulation and maybe a reference to Tania Lambrozo’s work on causal explanation? color=yellow!80, ,inline]Prashan: I have added description of looking backward and forward, also thanks for pointing ut Stephans work, I was not aware of it. have also cited Lambrozo’s work. I think Gerstenberg’s paper doesnt really fit well in this section as it’s about counterfactual simulation and judgment. But I have changed the section name for causal explanations
In this section, we discuss insights we can gain from human models of explanation in literature. We then ground these models in data by conducting a human-agent experiment.
3.1 Human Models of Causal Explanation
Causality is a recurring concept in explanation models of social psychology and cognitive science literature (Hilton, 1990; Hornsby, 1993; Lombrozo and Vasilyeva, 2017). Using causal models as the basis for explanation seems natural and intuitive to humans (Sloman, 2005), since we build causal models to represent the world and to reason about it. Thus, it is plausible that, when used in intelligent agents, causal models have the ability to provide ‘good’ explanations to humans.
color=green!80, ,inline]Tim: I suggest outlining the five different types of explanations that Hilton defines color=yellow!80, ,inline]Prashan: done
Importantly, causal models consist of causal chains. A causal chain is a path that connects a set of events, where a path from event to event indicates that has to occur before (Miller, 2018b) (we use event and action interchangeably in the paper). Hilton et al. ( 2005) define five types of causal chains that lead to five different types of explanations. Hilton et al. categorise these as, temporal, coincidental, unfolding, opportunity chains and pre-emptive. Through human experiments, Nagel and Stephan (2016) demonstrated that distal causes forms significant portion of an explainee’s understanding of a terminal cause. Böhm and Pfister (2015) also affirms that, humans give both proximal and distal causes as explanations. Its important to note that, while in cognitive psychology literature a distal cause is a remote cause of an event in the past (essentially looking ‘backward’ from an event), in our agent simulations we use the distal terminology to denote an ‘action’ that is remote in the future (according to the agent’s viewpoint this is looking ‘forward’ from a present event/action). Hilton et al. (2010) also explored how humans select different causal chains to provide explanations through human experiments. We conduct a similar study to gain insights from human models of explanation in a human-agent setting, and report results below.
3.2 Study Objectives
We seek to investigate how humans provide explanations of intelligent agents’ behaviour and what concepts are present in such explanations. In contrast to similar studies done in social psychology (Hilton et al., 2010), our experiments present explanations of the agent’s behaviour first to the participant and then gives the freedom to form their own explanations of the agent. The main objective of the study is to discover the frequency of different concepts in these human generated explanations given the agent behaviour explanations using different explanation methods.
| Code | Description | Example |
|---|---|---|
| Action | An action of the agent | P10: “It will keep attacking while it has the advantage” |
| Feature | A feature of the agent | P4: “The optimal number of supply depots is 2. and they should build those before a barracks” |
| Temporal | Refer some temporal quality | P12: “I think the artificial player will want to train marines right away so that it has an army quickly and be able to attack the enemy.” |
| Objective | Refer to a short term objective | P12: “I think the artificial player will want to train marines right away so that it has an army quickly and be able to attack the enemy.” |
| Causality | Implies a causal relationship | P3: “you need an army to attack[action] and by training marines you can do that” |
| Quantitative | Refers to a numerical value of a feature | P4: “The optimal number of supply depots is 2. and they should build those before a barracks” |
| Qualitative | A qualitative reference to a feature | P4: “As long as they have enough healthy marines. they should keep attacking” |
| Uncertainty | Mentions uncertainty | P5: “The army is in good health. it will most likely continue to attack.” |
| Contrastive | Contrasting a feature with another | P15 “There are 2 supply depots but only 1 barrack.” |
| Goal | Refer to the goal(s) of the agent | P10: “The point of the game is to kill the enemy and destroy their base. so (incorrectly) the AI thinks the next step is to attack.” |
3.3 Experiment Design
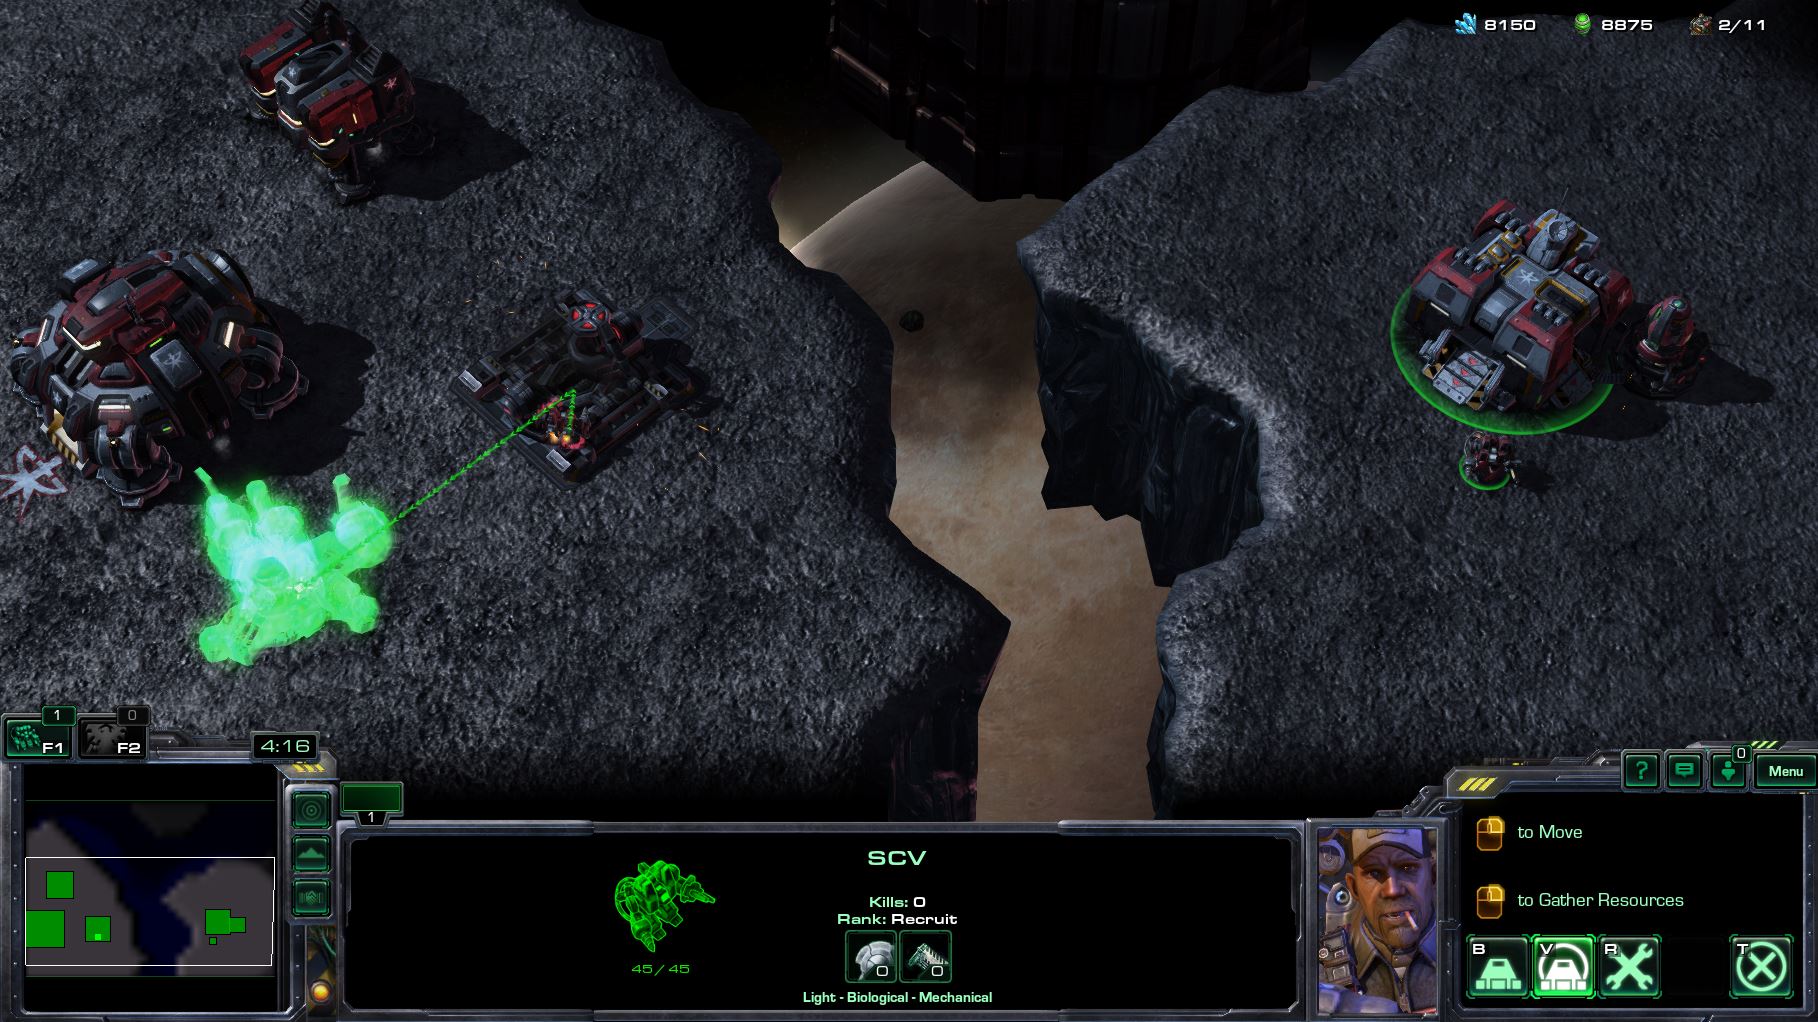
We conducted a human-agent study with 30 participants. In the first phase, participants were shown reinforcement learning agents playing the game StarCraft II. The agent behaviour (policy) was explained by providing ‘local’ explanations of agents’ actions using one of 3 different explanations models: 1) No explanations, just visual description of the agent’s behaviour; 2) State-action based explanations (Khan et al., 2009); and 3) Causal explanations (Madumal et al., 2020). Participants were divided evenly for each of these explanation models. Experiment was run on a web based interactive interface in through the Amazon Mechanical Turk (Buhrmester et al., 2011).
In the second phase, participants were shown new agent behaviour and were asked to ‘predict’ the agent’s next action. Participants are expected to predict the next action based on the learned model of the agent in the first phase through explanations. This prediction task is not important to the objectives of this study, but is used as a way to get the participants to reasong about behaviour. In the same page, participants were then asked formulate their own explanations about the agent. Participants were given a text-box to input the formulated explanations with no restrictions to word limit. This process is repeated for 8 rounds.
color=green!80, ,inline]Tim: How many participants were filtered? What was the threshold color=yellow!80, ,inline]Prashan: mentioned
To filter out devious participants, we used the following approaches. Explanations containing less than three words or gibberish text were omitted. We also considered the time it took to input the explanation as a threshold. We omitted six participants according to the above criteria. In total we obtained a total of 240 explanations.
color=green!80, ,inline]Tim: I would say that we could have a bit more detail here. For example, note that the ‘prediction’ part is not important to this study, etc. Discuss a bit more what they participants were asked to do and how explanations were filtered etc color=yellow!80, ,inline]Prashan: done
color=green!80, ,inline]Tim: I’d suggest adding a table with the codes and their descriptions. Perhaps even just add a new column with the frequencies and remove the graph? Or you can keep the graph if you think it is useful, but I think a description of the codes is important color=yellow!80, ,inline]Prashan: done
3.4 Method
color=green!80, ,inline]Tim: As noted earlier, I think we should just say ’Thematic analysis’, which is effectively one iteration of grounded theory color=yellow!80, ,inline]Prashan: changed
We use thematic analysis (Braun and Clarke, 2006) to code the data and to identify concepts. By using thematic analysis, meaningful insights can be gained on how explanations of agents behaviour relates to existing literature on human explanations. As the first step in the thematic analysis, each explanation will be be divided into small chunks to identify categories and then these will be divided further into codes. Intuitively, a ‘code’ represents an atomic concept that exist in the explanation corpus. For an example, when a reference to an ‘action’ of the agent is present in the explanation, the sub-string of that reference can be coded (tagged) as an Action. This process is done manually until all the data chunks and explanations are coded. To ensure correctness, further passes through the explanation corpus is done as an attempt to identify new concepts that might have been missed in the first pass. Coded concepts and their descriptions are given in Table 1, along with example explanations extracted from participants.
3.5 Results
color=green!80, ,inline]Tim: It is not clear to me that discussing the three different explanation models is adding anything. What no just say that we conducted a study with 30 participants where they saw behavour etc. ,etc., and then had to do predictions and explain the predictions. The graph in FIgure 2 can then just add the total number across all three. While the conditions played an important part in the previous study, it is not so relevant for this particular purpose, and I think it just distracts the reader now, who may ask for more details on the three conditions, etc. There is not a major different between conditions to the point where it should influence our results
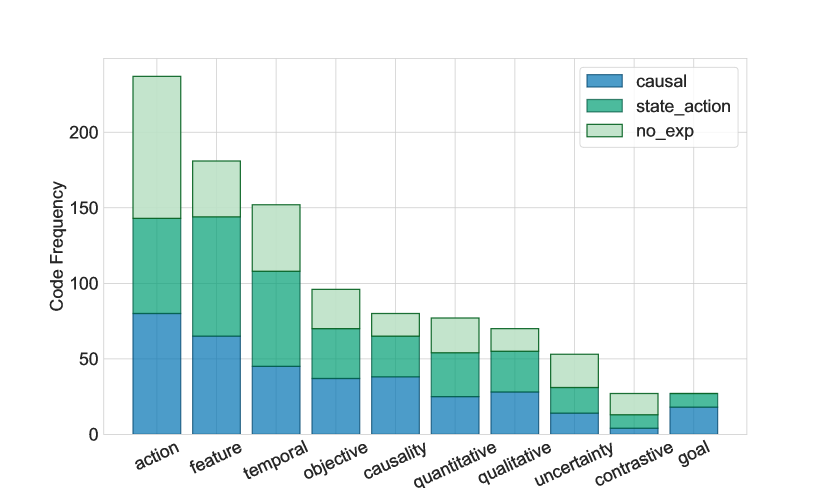
color=cyan!80, , inline]Liz: I think it’s risky to completely ignore that there were three explanation types – but agree they should show on a single (stacked) bar chart - and suggest you order by decreasing height to make the description clearer color=yellow!80, ,inline]Prashan: I have represented the bar chart as a stacked chart and added some more description in teh results section
Figure 2 shows the frequencies of 9 codes across the 3 explanation models of the RL agents. Participants referred to ‘actions’ and ‘features’ of the agent the most, and often included the ‘objective’ or the ‘goal’ of the agent, which is present in action influence models (Madumal et al., 2020). Most importantly, the third most frequent code is ‘temporal’, in which participants refer to future actions the agent will take (i.e. distal actions). For example, consider an explanation from the data corpus, “The AI will want to have barracks so that it can then train soldiers to engage in attacks. It will want to progress”. Here, the participant’s explanation contains the distal action ‘train soldiers’ which is enabled by ‘have barracks’. ‘Causality’ is also present in the explanations, interestingly even in ‘No explanation’ and State-action based explanation models. This suggests that humans frequently associate causal relationships when generating explanations. Our human-agent experimental data reaffirm the presence of opportunity chains in causal chains (Hilton et al., 2005), and show that these are frequently used to express how future actions are dependent on current actions of agents.
color=green!80, ,inline]Tim: I would suggest that here or perhaps in the discussion, look at your previous work on action influence models and also other XRL work, and identify which methods refer to which things. Perhaps a table that lists the codes as columns and other XRL methods as rows, with a tick in the cell if such the concept in the code is used. I imagine we would see a column of causality mostly empty and a column of temporal entirely empty. color=yellow!80, ,inline]Prashan: excellent suggestion about the table, I have added that
3.6 Discussion
| XRL Method | Action | Feature | Temporal | Causal | Contrast | Objec | Goal | Quan | Qual | Uncer |
|---|---|---|---|---|---|---|---|---|---|---|
| Elizalde et al. (2007) | ✓ | ✓ | ✓ | |||||||
| Khan et al. (2009) | ✓ | ✓ | ✓ | ✓ | ✓ | |||||
| Wang et al. (2016) | ✓ | ✓ | ✓ | ✓ | ✓ | |||||
| van der Waa et al. (2018) | ✓ | ✓ | ✓ | ✓ | ||||||
| Struckmeier et al. (2019) | ✓ | ✓ | ✓ | |||||||
| Hayes and Shah (2017) | ✓ | ✓ | ✓ | ✓ | ✓ | |||||
| Amir and Amir (2018) | ✓ | ✓ | ✓ | ✓ | ||||||
| Tabrez et al. (2019) | ✓ | ✓ | ✓ | ✓ | ||||||
| Fukuchi et al. (2017) | ✓ | ✓ | ||||||||
| Juozapaitis et al. (2019) | ✓ | ✓ | ✓ | ✓ | ||||||
| Madumal et al. (2020) | ✓ | ✓ | ✓ | ✓ | ✓ | ✓ | ✓ | ✓ | ||
| Proposed method | ✓ | ✓ | ✓ | ✓ | ✓ | ✓ | ✓ | ✓ | ✓ |
The concepts that were derived from the codes are present in previous explainable reinforcement learning methods to varying degrees. Table 2 shows how these concepts are distributed. As most of these methods were not developed in a ground-up manner, some important concepts present in human explanations were not implemented in their explanation generation. When developing novel explanation models, insights gained from human-agent studies can help ground the model in the characteristics of human explanation. Human grounded explainable models can be more effective and accepted when deployed (Miller, 2018b; Langley et al., 2017). To this end, we conducted human-agent experiments to discover how a human would explain the reasoning and behaviour of an agent, when the agent has given prior explanations of it’s own actions. When these human explanations were abstracted into ‘codes’, notable concepts like ‘causality’ and ‘temporality’ emerged. Previous work done in social psychology support our findings and coincide well with notions like opportunity chains (Hilton et al., 2005).
Though previous studies have explored the structure of causal chains in human explanations (Hilton et al., 2010), these are largely done in the absence of an intelligent agent. Further, in (Hilton et al., 2010), an explanation structure is investigated for events that have already occurred. In our study, as human explanations are for the behaviour of the agent, they can refer to how the past and present actions of the agent can influence the future. Ultimately, we use the resultant concepts of causality and distal opportunity chains to propose the distal explanation model for reinforcement learning agents.
4 Preliminaries
In this section, we present the necessary background that is required to follow the remainder of the paper.
4.1 Markov Decision Processes
We concern ourselves with providing an explanations for Markov Decision Process (MDP) based model-free RL agents. An MDP is a tuple , where and give state and action spaces respectively (here we assume the state and action space is finite and state features are described by a set of variables ); gives a set of state transition functions where denotes state transition distribution of taking action in state ; is a reward function and gives a discount factor. The objective of a reinforcement learning agent is to find a policy that maps states to actions maximizing the expected discounted sum of rewards. In model-free reinforcement learning, and is not known and the agent does not explicitly learn them.
color=green!80, ,inline]Tim: I suggest defining mdoel-free RL here, as this is what we are tackling color=yellow!80, ,inline]Prashan: done
4.2 Structural Causal Models
Structural causal models (SCMs) (Halpern and Pearl, 2005) provide a formalism for representing variables and causal relationships between those variables. SCMs represent the world using random variables, divided into exogenous (external) and endogenous (internal), some of which might have causal relationships which each other. These relationships can be described with a set of structural equations.
Definition 4.1.
A signature is a tuple , where is the set of exogenous variables, the set of endogenous variables, and is a function that denotes the range of values for every variable .
Definition 4.2.
A structural causal model is a tuple , where is as in Definition 4.1 and denotes a set of structural equations, one for each , such that give the value of based on other variables in . That is, the equation defines the value of based on some other variables in the model.
color=green!80, ,inline]Tim: I think adding a short example here would help illustrate both the concept of models, instantiations, and actual causes color=yellow!80, ,inline]Prashan: added an example
A context is a vector of unique values of each exogenous variable . A situation is defined as a model/context pair . Given a situation an instantiation of given is defined by assigning all endogenous variables the values corresponding to those defined by their structural equations.
An actual cause of an event is a vector of endogenous variables and their values such that there is some counterfactual context in which the variables in the cause are different and the event does not occur. An explanation is those causes that an explainee does not already know. Following example gives perspective to the notions discussed above.
Example 4.1.
Consider the coffee task (Boutilier et al., 1995) where a robot has to deliver coffee to a user. The state consists of six binary variables, robot location (), robot is wet (), robot has umbrella (), raining (), robot has coffee () and user has coffee (). Actions of the robot are go, buy coffee, get umbrella and deliver coffee. Then we can identify the set of endogenous variables as , , , and because the values of these variables can be influenced by the actions of the robot. In contrast, variable the variable (raining) is an exogenous () variable, because it is not defined by a function. A signature for this is generated by combining , and the value range the variables can take (in this case either 0 or 1). Having the signature at hand, we can formulate a structural causal model by identifying the set of functions that describe causal relationships of state variables. Assuming there is only one such function, we can define it . This implies that the variable ‘user has coffee’ is causally influenced by variables ‘robot has coffee’ and ‘robot location’. Model can be instantiated by getting the current values of the state variables and applying them to the set of . The actual cause of the event being true is the vector (, ) as both of these variables needs to be true for the user to have the coffee.
For a more complete review of SCM’s we direct the reader to (Halpern and Pearl, 2005).
color=green!80, ,inline]Tim: We will also need to add interventions and in particular the syntax , which is used later color=yellow!80, ,inline]Prashan: not exactly sure what is missing from the definitions
4.3 Action Influence Models
Action influence models (Madumal et al., 2020) provide explanations of the agent’s behaviour based on the knowledge of how actions influence the environment. Informally, action influence models are an extension of SCMs that are augmented with agent actions. These models capture the causal relationships that exist in agent’s knowledge about the world (i.e. state variables). Action influence models are formally defined for RL agents as follows,
Definition 4.3.
Formally, a signature for an action influence model is a tuple , in which , , and are as in SCMs from Defintion 4.1, and is the set of actions from an MDP.
Definition 4.4.
An action influence model is a tuple , where is as above, and is the set of structural equations, in which we have multiple for each — one for each unique action set that influences . A function , for , defines the causal effect on from applying action . The set of reward variables are defined by the set of nodes with an out-degree of 0; that is, the set of sink nodes.
Definition 4.5.
The actual instantiation Madumal et al. (2020) of an action influence graph is defined as , in which is the vector of state variable values from an MDP and as in Definition 4.3. A counterfactual instantiation for a counterfactual action is a model , where gives the instantiation of a counterfactual state .
color=green!80, ,inline]Tim: I don’t think the counterfactual has been defined? This could be either defined here or in the SCM background color=yellow!80, ,inline]Prashan: I think I defined it in the above defintion color=green!80, ,inline]Tim: True, but I’m not sure I would understand what it means without already knowing it from SCMs?
In an actual instantiation, we set the values of all state variables in the model, effectively making the exogenous variables irrelevant. Similarly, a counterfactual instantiation assign values to the model that could have realised under the action .
Figure 3 shows the graphical representation of Definition 4.4 as an action influence graph of the StarCraft II agent described in the previous section, with exogenous variables hidden. These action influence models are SCMs except that each edge is associated with an action. In the action influence model, each state variable has a set of structural equations: one for each unique incoming action. As an example, from Figure 3, variable is causally influenced by and only when action is executed, thus the structural equation captures that relationship.
color=green!80, ,inline]Tim: Each time I read this, I find the use of to indicate actions to be a bit confusing because it also represents “Ally”. Perhaps use or something instead of to distinguish actions from state variables? color=yellow!80, ,inline]Prashan: done
4.4 Explanations
An explanation is generally defined as a pair that contains; 1) an explanandum, the event to be explained and 2) an explanan, the subset of causes that explain that event (Miller, 2018b). In its simplest form, the explanation for the question ‘Why ?’ would be in the form of ‘Because ’. In the above example, is the explanandum and is the explanan. As Lim et al. (2009) notes, why and why not questions are the most demanded explanatory questions. In the context of RL agents, we are interested in answering ‘Why ?’ and ‘Why not ?’ questions. Here, is an action of the agent and the explanation will be local.
Action influence models can be used to generate minimally complete explanations. An explanation that constitutes all the causes as an explanan risk overwhelming the explainee, thus it is important to balance the completeness and the minimality of the explanations (Miller, 2018b).
color=green!80, ,inline]Tim: ON the presentation of explanations, I wonder if we should ’break rank’ a bit from the previous paper, as it is always a cause for confusion. I can think of two things: (1) instead of , we could use , which just makes the text a bit clearer; and (2) There definitely needs to be some explanation of that these three sets of variables are, especially to focus on why the immediate predecessors of the reward nodes so important (it’s not clear unless you understand the reward nodes are not variables). We also need to point back to the earlier figure. It is perhaps even worth pulling out the figure again and focusing on the chain specifically to make this definition very clear, but you may also be able to do this be just pointing back to it. color=yellow!80, ,inline]Prashan: added an explanation and referred back to figure and changed the symbols
Definition 4.6.
A minimally complete explanation for an action under the actual instantiation is a tuple , in which is the vector of reward variables reached by following the causal chain of the graph to sink nodes; the vector of variables of the head node of action , is the vector of variables that are immediate predecessors of any variable in within the causal chain, with , , giving the values of these variables under from Definition 4.5.
McClure and Hilton (1997) argue that ‘goals’ should be referred to in some form when explaining actions. In reinforcement learning, rewards of the agent can be thought of as a proxy for the goals. Though in most cases the ‘rewards’ ( from Definition 4.6) on itself would not form a complete explanation, because they are not attached to variables. Immediate predecessor nodes () of the reward nodes refer to the state variables that ‘trigger’ rewards.. Though this combination now can explain the long term motivation of the agent, the head node () attached to the action is used to explain the immediate (short-term) cause. From Figure 3, the explanation for Why action would constitute, and in as reward variables , in and in . Madumal et al. (2020) present a method for generating such explanations, and evaluate this on a large-scale user study.
5 Distal Explanation Model
From the insights gained from human explanations discussed in Section 3 we propose a distal explanation model that can generate explanations for opportunity chains. In the following sections we use the adversarial scenario (discussed at length in Section 6.1) of the StarCraft II environment as a running example to aid the definitions.
color=green!80, ,inline]Tim: I suggest breaking this into its own ’overview’ section (Section 5.1), and spending a bit of time explaining the architecture: what each component does and how it fits together. Perhaps introduce a short illustrative example from the starcraft domain. At this point, the reader wouldn’t really know why we are using a many-to-one sequence predictor. I would draw this in (using ’opportunity chains’ terminiology too) color=yellow!80, ,inline]Prashan: added the overview and expanded teh section explaining in more detail
5.1 Overview
Figure 4 shows an overview of the distal explanation model. The model consists of four distinct components. First, state-action pairs are extracted as a replay dataset from the episodes during reinforcement learning. Dataset generation happens at the agent training time. This dataset is used to train the decision-tree policy (indicated as the blue sub-component in Figure 4). The decision-tree policy is used as a surrogate policy for the agent, where it is used to extract reasons (in the form of decision nodes) for a given action (we discuss this process at length in Section 5.2). The dataset is also used to train the distal action predictor (shown as the green sub-component), which predicts dependent actions. Because we want to predict distal actions (contained in a opportunity chain) using a sequence of prior actions from the agent action trace, a many-to-one recurrent neural network (Schuster and Paliwal, 1997) is used as the predictor, though other sequence predictors can also be used. An action influence graph is used to extract causal chains (shown in red) that is used in conjunction with the decision tree policy to produce the final explanation. The explanation is given as a three-tuple: reward nodes of the causal chain; matched decision nodes; and the predicted distal action.
Before formalising the distal explanation model we first discuss how explanations can be generated using decision tree policies.
5.2 Causal Explanations from Decision Trees
Although causal explanations from action influence models have been shown to perform better than state-action based (Khan et al., 2009) explanation models, the use of structural equations (Madumal et al., 2020) models the environment rather than the policy of the agent. Thus, the explanations from these model why an action would be a good idea, rather than why the agent chose it. In this work, we instead propose to extract reasons for action selection from a surrogate policy. We learn an interpretable surrogate policy in the form of a decision tree using batched replay data. If the agent’s underlying policy is also a decision tree, this step can be omitted.
color=green!80, ,inline]Tim: THe ref to Minh for experience replay is a bit strange as experience replay is much older than 2015 color=yellow!80, ,inline]Prashan: added Lin et al 1992 reference
Training The Surrogate Policy:
The distal explanation model we introduce uses decision nodes of a decision tree that represent a surrogate policy to generate explanations with the aid of causal chains from an action influence model. Let be a decision tree model. In each episode at the training of the RL agent, we perform experience replay (Lin, 1992) by saving at each time step in a data set . Drawing uniformly from as mini-batches, we train using input and output . Clearly, explanations generated from an unconstrained decision tree can overwhelm the explainee, as these produce a large number of decision nodes for a question. Thus we limit the growth of by setting the max number of leaves to the number of actions in the domain (i.e. the leaves of the trained will be the set of actions of the agent). We later show that this hardly affects the task prediction accuracy compared to a depth unconstrained decision tree for our experiments. To get the decision nodes of in state , we simply traverse the tree from the root node until we reach a leaf node and get the nodes of the path. The decision tree of the StarCraft II adversarial task is given in Figure 5 a), with the decision nodes and for the action . Each decision node maps to a feature variable of the agent’s state. Figure 5 shows how the decision nodes are mapped to the action influence graph, in the StarCraft II adversarial scenario.
Generating Explanations Using the Surrogate Policy:
In the context of an RL agent, we introduce a new definition of minimally complete explanations using decision nodes for ‘why’ questions below.
color=green!80, ,inline]Tim: I think we are jumping forward a bit here. Perhaps first give the example of the ’explanation’ from the decision tree only. Then explain that we filter out variables that are not relevant to the decision color=yellow!80, ,inline]Prashan: added a description below
A primitive explanation can be generated by using the decision-tree policy alone, by extracting the decision nodes of an action. E.g. for the question Why , we can obtain the decision nodes simply by traversing to the leaf node from the root node ( and are the decision nodes in this case, as highlighted in Figure 5 a)). However, an explanation like this can contain variables that are not causally relevant to the action performed. This primitive explanation can be enhanced by taking the causal chain for the action being explained from an action influence model and filtering out causally irrelevant variables. We define this as a minimally complete explanation below.
Definition 5.1.
Given the set of decision nodes for the action from a decision tree , we define a minimally complete explanation for a why question as a pair , in which is the vector of reward variables reached by following the causal chain of the graph to sink nodes; is such that is the maximal set of variables in which , where is the set of intermediate nodes of the causal chain of action , with , and giving the values under the actual instantiation from Definition 4.5.
color=green!80, ,inline]Tim: As with the earlier one, give a brief summary of what this definition means and why we do it; in particular, what the intersection is doing color=yellow!80, ,inline]Prashan: explained a bit below
Above definition only select the decision nodes (from the total set of decision nodes given from the decision-tree policy) that exist as intermediate nodes of the causal chain of the given action.
In the StarCraft II scenario, for the question ‘Why action ?’, we can generate the minimally complete explanation by first finding the decision nodes for action , shown as medium grey nodes in Figure 5(a). Then finding the causal chain of action (given by the bold path in Figure 5). And finally getting the common set of nodes from the causal chain and the decision nodes ( in Figure 5) and appending the reward nodes ( and ). Example 5.1 below compare and contrast an explanation with and without the use of action influence models.
color=green!80, ,inline]Tim: Give an example explanation? Perhaps even give a comparison to the explanation with and without the action influence graph? color=yellow!80, ,inline]Prashan: given below
Example 5.1.
Question: Why ?
| Just decision-tree policy: | Because Ally unit number () is 4 and Barracks number () is 1. |
|---|---|
| With action influence models: | Because ally unit number () is 4 and the goal is to have more Destroyed Units () and Destroyed buildings (). |
5.3 Contrastive Explanations from Counterfactuals
Counterfactuals explain events that did not happen—but could have under different circumstances. Counterfactuals are used to describe events from a ‘possible world’ and to contrast them with what happened in actuality. Embedding these counterfactuals in explanations can make the explanation more meaningful (Byrne, 2019). Naturally, an explanation given to a ‘why not’ question should compare the counterfactuals with the actual facts to form a contrastive explanation (Miller, 2018b, a). For this reason, we concern ourselves with generating contrastive explanations from decision nodes and causal models.
We generate the counterfactual decision nodes using Algorithm 1, in which we find the decision nodes of the counterfactual action by changing the decision boundary of the actual action in the decision tree. We can now define minimally complete contrastive explanations for ‘why not’ questions using these counterfactual decision nodes.
color=green!80, ,inline]Tim: First, I’m not entirely convinced we need this algorithm. Couldn’t we just take the counterfactual action and get the path(s) to the root of the decision tree from that action, then select e.g. the one with the smallest number of changes nodes? Second, the algorithm does not seem to find the counterfactual unless the delta is large enough. Perhaps ‘moveBoundary’ does this, but it does not consider that we may need to move more than one variable to get the counterfactual. In short, it’s not clear what moveBOundary does, and if it just moves by a Delta, what if the delta change is not enough to get the counterfactual? It doesn’t seem to do it again? Third, if you DO use this counterfactual approach, is there a reason the surrogate needs to be a decision tree? Couldn’t we just use any counterfactual generation algorithm for a black-box model? color=yellow!80, ,inline]Prashan: For the first question: when we have the counterfactual action, yes we can get the counterfactual decision nodes, but we cant get the counterfactual state, so we can’t get the values for those decision nodes(values would be based on the current state), so we need to change the decision boundary to see the counterfactual values for the counterfactual decision nodes. Second question: delta should be adjusted accordingly to the domain I think, you can set it to a very small value, it just means the algorithm will be very slow, moveboundary change the state value by a delta value until the decision boundary changes and assign that final value as , essentially there is a loop inside with a condition. For the third question: we can use other counterfactual generation algorithms yes to get the set counterfactual features that matters, doesnt have to be a decision tree, or decision nodes as we are simply comparing that together with nodes in the causal chain of action influence models
Input: causal model , current state , trained decision tree , actual action ,
Output: contrastive explanation t
Definition 5.2.
Given the set of decision nodes for the action from a decision tree , a minimally complete contrastive explanation for a why not question is a pair , in which is same as in Definition 5.1; is such that is the maximal set of variables in which , where gives the set of intermediate nodes of the causal chain of the counterfactual action , and is generated using the Algorithm 1. Values , are contrasted using the actual instantiation and counterfactual instantiation from Definition 4.5.
color=green!80, ,inline]Tim: As with earlier definitions, a bit of explanation would make this part clearer color=yellow!80, ,inline]Prashan: added below
Instead of just having the intermediate nodes of the causal chain of the actual action (as in Definition 5.1), we now get the set of intermediate nodes for for the counterfactual action from its causal chain. Then the intermediate nodes of the counterfactual chain is compared with the set of nodes we get from the Algorithm 1, to get the common set of nodes, of which the variable values will finally be contrasted.
As before, we explain Definition 5.2 using the adversarial StarCraft II task. Consider the question ‘Why not action ’, when the actual action is , for which the explanation is generated as follows. We first get the decision nodes and having and as the decision boundaries respectively. Then each decision boundary value starting with the node closest to the leaf node, is moved by a small amount and applied as the new feature value in the current state of the agent ( feature value will change to ). We use this new state to predict the counterfactual action as from the decision tree, and to get the counterfactual decision nodes (which remains the same). Next, we get the intersection of nodes in the causal chain of the counterfactual action () with , which gives as with the actual value and counterfactual value . Finally, these values are contrasted and appended with the reward nodes of the causal chain of to generate the explanation. A graphical interpretation of this explanation is shown in Figure 6.
color=green!80, ,inline]Tim: This above example is a nice example, but perhaps needs a bit of graphical representation, or at least, a cleaner representation; e.g. show the nodes and variables for ’why’, show them for ’why not’, show show to integrate the action influence graph, and then show the final explanation
color=yellow!80, ,inline]Prashan: showed in a graphical way below
5.4 Learning Opportunity Chains
color=green!80, ,inline]Tim: Briefly motivate this (again) by outlining the weakness of just explaining the policy alone: it doesn’t consider that actions are chosen to enable other actions
color=yellow!80, ,inline]Prashan: added some sentences below.
Explaining the behaviour of the agent using only the policy (or a surrogate policy) alone, even if the explanation is causal, has shortcomings as this does not consider that some actions might be chosen because they enable other actions. In this section we discuss how information on enabling actions can be used to form a more complete explanation.
In the context of reinforcement learning, we define a ‘distal action’ as the action that depends the most on the execution of the current action of the agent. The agent might not be able to execute the distal action unless some other action was executed first (i.e. some actions ‘enable’ the execution of other actions). For example, in the StarCraft II domain, the action ‘train marines’ cannot be executed until ‘build barracks’ action is executed. While it is possible to extract distal actions from environment dynamics and pre-conditions in a model-based system, for model-free RL agents, this remains a challenge. However, for the purpose of explanation, it is possible to provide an approximation and predict the distal action.
color=green!80, ,inline]Tim: I think we need a problem formulation here: what are the inputs and outputs of the prediction? During training, what is the action that is used as the ground truth; just the next action? etc. Define the learning problem a bit more formally. As it stands, I would struggle to re-produce this color=yellow!80, ,inline]Prashan: I have explained this informally in below but added a formal defintion as well to be clear and the ground truth
We use a many-to-one recurrent neural network (RNN) (Schuster and Paliwal, 1997) as our prediction model to approximate the distal action given a sequence of previous states and actions of the agent. We implement with a fully connected hidden layer of 10 units, and a batch size of 100. For training data, we use the batch replay dataset discussed in Section 4.2. We define a sequence as a state-action trace that ends in an action that is one of the last actions in a causal chain (e.g. in Figure 2, the last action of all causal chains in the ‘attack’ action). The output of the model will be the distal action and its expected cumulative reward. Formally, this action prediction model can be written as: , where is the state-action pair (including state features) of the last action of a causal chain, gives the distal action and the reward. Here, we use the immediate next action that lies in a particular causal chain as the ground truth. Note that even though we used an RNN to implement the prediction model, it is entirely possible to use other models to approximate the distal action. With the distal action prediction model in hand, we now define minimally complete distal explanations for ‘why’ and ‘why not’ questions that incorporate causal nature to the explanations.
Definition 5.3.
Given a minimally complete contrastive explanation, current action and a prediction model , a minimally complete distal explanation is a tuple , in which and do not change from Definition 5.2; and gives the distal action predicted through such that , where is the action set of the agent and gives the action set of the causal chain of current action .
color=green!80, ,inline]Tim: In the paragraph below (and in fact where we use the variable names from the graph), I suggest expanding the action/variable names – it is easy to forget what means color=yellow!80, ,inline]Prashan: done Informally, this simply prepends the predicted distal action to a minimally complete contrastive explanation generated through Definition 5.2 if the distal action exists in the causal chain of the current action. Consider the example ‘Why not action build_barracks () , when the actual action is train_marine (). This would yield the counterfactual decision node (ally unit number) with the actual value and the counterfactual value . When the predicted distal action is attack (), we can generate the below explanation text using a simple natural language template. The causal explanation is generated with Definition 4.6 while the distal explanation is generated through Definition 5.3.
color=cyan!80, , inline]Liz: I confess to this example confusing me by the terminology - here seems like a ‘proximal’ (or even ‘immediate’) rather than a ‘distal’ action - using my understanding of the terminology from Hilton et al. (2005) color=yellow!80, ,inline]Prashan: Its true that for Hilton 2005, the distal cause would far out cause in the causal chain because in that case the explanation is about past events only. In our case explanation is about the behaviour of the agent in the future as it involves rewards so the distal cause/action becomes an action far out in the future but still influenced by present actions/events. i added a small description of this for the discussion in the first study
| Causal Explanation: | Because it is more desirable to do the action train marine () to have more ally units () as the goal is to have more Destroyed Units () and Destroyed buildings (). |
|---|---|
| Distal Explanation: | Because ally unit number () is less than the optimal number 18, it is more desirable do the action train marine () to enable the action attack () as the goal is to have more Destroyed Units () and Destroyed buildings (). |
color=green!80, ,inline]Tim: In the above example, where did the ‘more desirable to do the action training marine’ go? Why isn’t this included in the distal explanation? Similarly, why does the causal explanation have the ‘optimal number 18’? This comes from the action influence graph right? color=yellow!80, ,inline]Prashan: more desirable is a filler text, which is also present in the distal explanation in second sentence. value is coming from the decision boundary
5.5 Computational Evaluation
| Env - RL | SE - Accuracy (%) | DP - Accuracy (%) | ||||
|---|---|---|---|---|---|---|
| Size | LR | DT | MLP | |||
| Cartpole-PG | 4/2 | 83.8 | 81.6 | 86.0 | 96.83 | 97.10 |
| MountainCar-DQN | 3/3 | 69.7 | 57.8 | 69.6 | 88.66 | 86.75 |
| Taxi-SARSA | 4/6 | 68.2 | 74.2 | 67.9 | 82.44 | 86.19 |
| LunarLander-DDQN | 8/4 | 68.4 | 63.7 | 72.1 | 72.82 | 72.91 |
| BipedalWalker-PPO | 14/4 | 56.9 | 56.4 | 56.7 | 67.99 | 69.28 |
| StarCraft-A3C | 9/4 | 94.7 | 91.8 | 91.4 | 97.36 | 86.04 |
color=green!80, ,inline]Tim: The bold numbers in Table 3 could be a bit misleading. Bold usually means “best”, but the model is better in four out of six cases color=yellow!80, ,inline]Prashan: removed
color=green!80, ,inline]Tim: We use task prediction as a measure of faithfulness, but I wonder if we shouldn’t also measure ’effectiveness’. That is, use the predicted action as the next action to see how ‘good’ our predictions other in the problem. For example, the surrogate model may be 80% faithful, but if we use it to ‘play’ the benchmarks 100 episodes each, what is the average reward over those 100 episodes. If it is similar to the underlying black-box policy, you could argue to replace the black-box policy all together and just use the surrogate policy, then the surrogate policy is 100% faithful to itself
We use five OpenAI benchmarks (Brockman et al., 2016) and the adversarial StarCraft II scenario (discussed in Section 5.1) to evaluate the task prediction (Hoffman et al., 2018) accuracy of our distal explanation model and compare against action influence models (Madumal et al., 2020) as a baseline. Task prediction can be used to predict what the agent will do in the next instance, and measures how faithful the surrogate policy is against the underlying policy.
We choose the benchmarks to have a mix of complexity levels and causal graph sizes (given by the number of actions and state variables). We train the RL agents using different types of model-free RL algorithms (see Table 3), using a high performance computer cluster node with 2 Nvidia V100 GPUs, 56GB of memory and 20 core CPU with 2.2GHz speed. All agents were trained until the reward threshold (to consider as ‘solved’) of the environment specification is reached.
We evaluate two versions of the distal explanation model, where one is a based on a depth limited decision tree with the number of actions ( in table 3), other trained until all leaves are pure nodes (). Results summarised in Table 3 show our model outperforms task prediction of action influence models (with their structural equations trained by either linear regression (LR), decision trees (DT) or multi layer perceptrons (MLP)) in every benchmark, some by a substantial margin.
The benefit gained through unconstrained decision trees () does not translate well into an increase in task prediction accuracy. We conclude that for the purpose of using distal models for explanation, a depth limited tree () provide an adequate level of accuracy. Moreover, as a depth limited tree is likely to be more interpretable to a human, it is more suited for explainability and explanation.
6 Evaluation: Human Study
We consider human subject experiments to be an integral part of XAI model evaluation and as such conduct a human study with 90 participants. We consider two hypotheses for our empirical evaluation; 1) Distal explanation models leads to a improved understanding of the agent; and 2) Distal explanation models provide subjectively ‘better’ explanations. Our experiment involves RL agents that complete objectives in three distinct scenarios, which are based on the StarCraft II (Vinyals et al., 2017) learning environment. We first discuss these scenarios below.
6.1 Scenarios
color=cyan!80, , inline]Liz: consider presenting the scenarios early in the paper to provide motivation; can then use as ‘running’ example color=yellow!80, ,inline]Prashan: not sure if this should be added to the introduction or somewhere else as it is a bit wordy
color=green!80, ,inline]Tim: As noted earlier, I would suggest making is clear that the other scenarios are part of the general starcraft game – we just use the simulation frameowkr to generate additional scenarios color=yellow!80, ,inline]Prashan: done
In addition to the default scenario of the StarCraft II, we developed two additional scenarios as custom maps using the StarCraft II platform as a framework, that are better suited for explainability. Custom maps were made to add a more strategic nature to scenarios and in some cases to elicit cooperation from the interacting human. Note that these scenarios are completely different from the StarCraft II game. We only use StarCraft II assets as a simulation framework, similar to how e.g. a grid-world framework can be used to make many different scenarios. We also release these maps with state and action specifications as test-beds for explainability research.
color=cyan!80, , inline]Liz: justify ‘better suited’ color=yellow!80, ,inline]Prashan: added s small justification
Adversarial
In this scenario, the agent’s objective is to build its base by gathering resources and destroy the enemy’s base. The agent can build offensive units (marines) to attack the enemy’s base and to defend its own base. This is the default objective in a normal StarCraft II game, but here we only use 4 actions for the purpose of the experiment rewards are given for the number of enemies and buildings destroyed (shown in Figure 5 b) as an action influence graph). During the experiment, the trained RL agent will provide explanations to the participant and the strength of the explanations are evaluated through task prediction.
Rescue
This scenario is a custom map, where the agent’s objective is to find a missing unit and bring it back to the base using an aerial vehicle. The agent also has to avoid or destroy enemy units during the rescue and aid the aerial vehicle using an armed unit. The agent has access to 5 actions, the reward is given for the number of missing units saved. The evaluation is done through task prediction as before.
Collaborative Task
The collaborative task is fundamentally different from the previous scenarios, in that the participant has to help the agent to complete the objective. We made this task as a custom map (depicted in Figure 7) where the map is partitioned as the agent and human ‘area’. The agent can perform 5 actions in this task, while the human can choose 4 actions to execute. The objective of the task is to build a series of structures that finally leads to the creation of an ‘elite’ unit, which the human has to transport to a base. The success of the task depends on the participant choosing to execute the action that best support the agent.
6.2 Experiment Design and Methodology
color=green!80, ,inline]Tim: Isn’t the experiment designed mixed? We use within subject across explanation types, and between subject to compare across scenarios? color=yellow!80, ,inline]Prashan: changed
To investigate the two main hypotheses, we use a mixed design (Keren, 2014) (within subject and between subject) for our experiment. Every participant will be evaluated on the 3 independent variables which are 1) ‘no explanations’, where only a visual description of the agent behaviour is provided; 2) causal explanations generated with action influence models (Madumal et al., 2020) and 3) our distal explanation model. At a glance, the experiment has 3 phases where participants receive explanations from RL agents, subjectively evaluate the explanation and are then evaluated through task prediction (Hoffman et al., 2018) to gauge their understanding of the agent.
Task prediction is an effective measure that can peek into the mental model of an explainee to evaluate how successful the given explanation was in transferring the knowledge from the explainer (Hoffman et al., 2018; Miller, 2018b). In task prediction, the participant is asked the question ‘What will the agent do next?’. We use task prediction to evaluate the hypothesis 1) for the Adversarial and Rescue scenarios, and invert the question as to ask ‘What would you do next?’ in the Collaborative task. We investigate hypothesis 1) by employing the 5-point Likert explanation satisfaction scale of Hoffman et al. (2018, p.39). Explanation satisfaction is evaluated after each explanation and also at the end of the experiment which compares explanations of causal and distal models.
Experiment Design: We use Amazon Mechanical Turk (Mturk)—a crowd sourcing platform well known for obtaining human-subject data (Buhrmester et al., 2011)—to conduct the experiments. A web-based interactive interface is used as the medium of interaction.
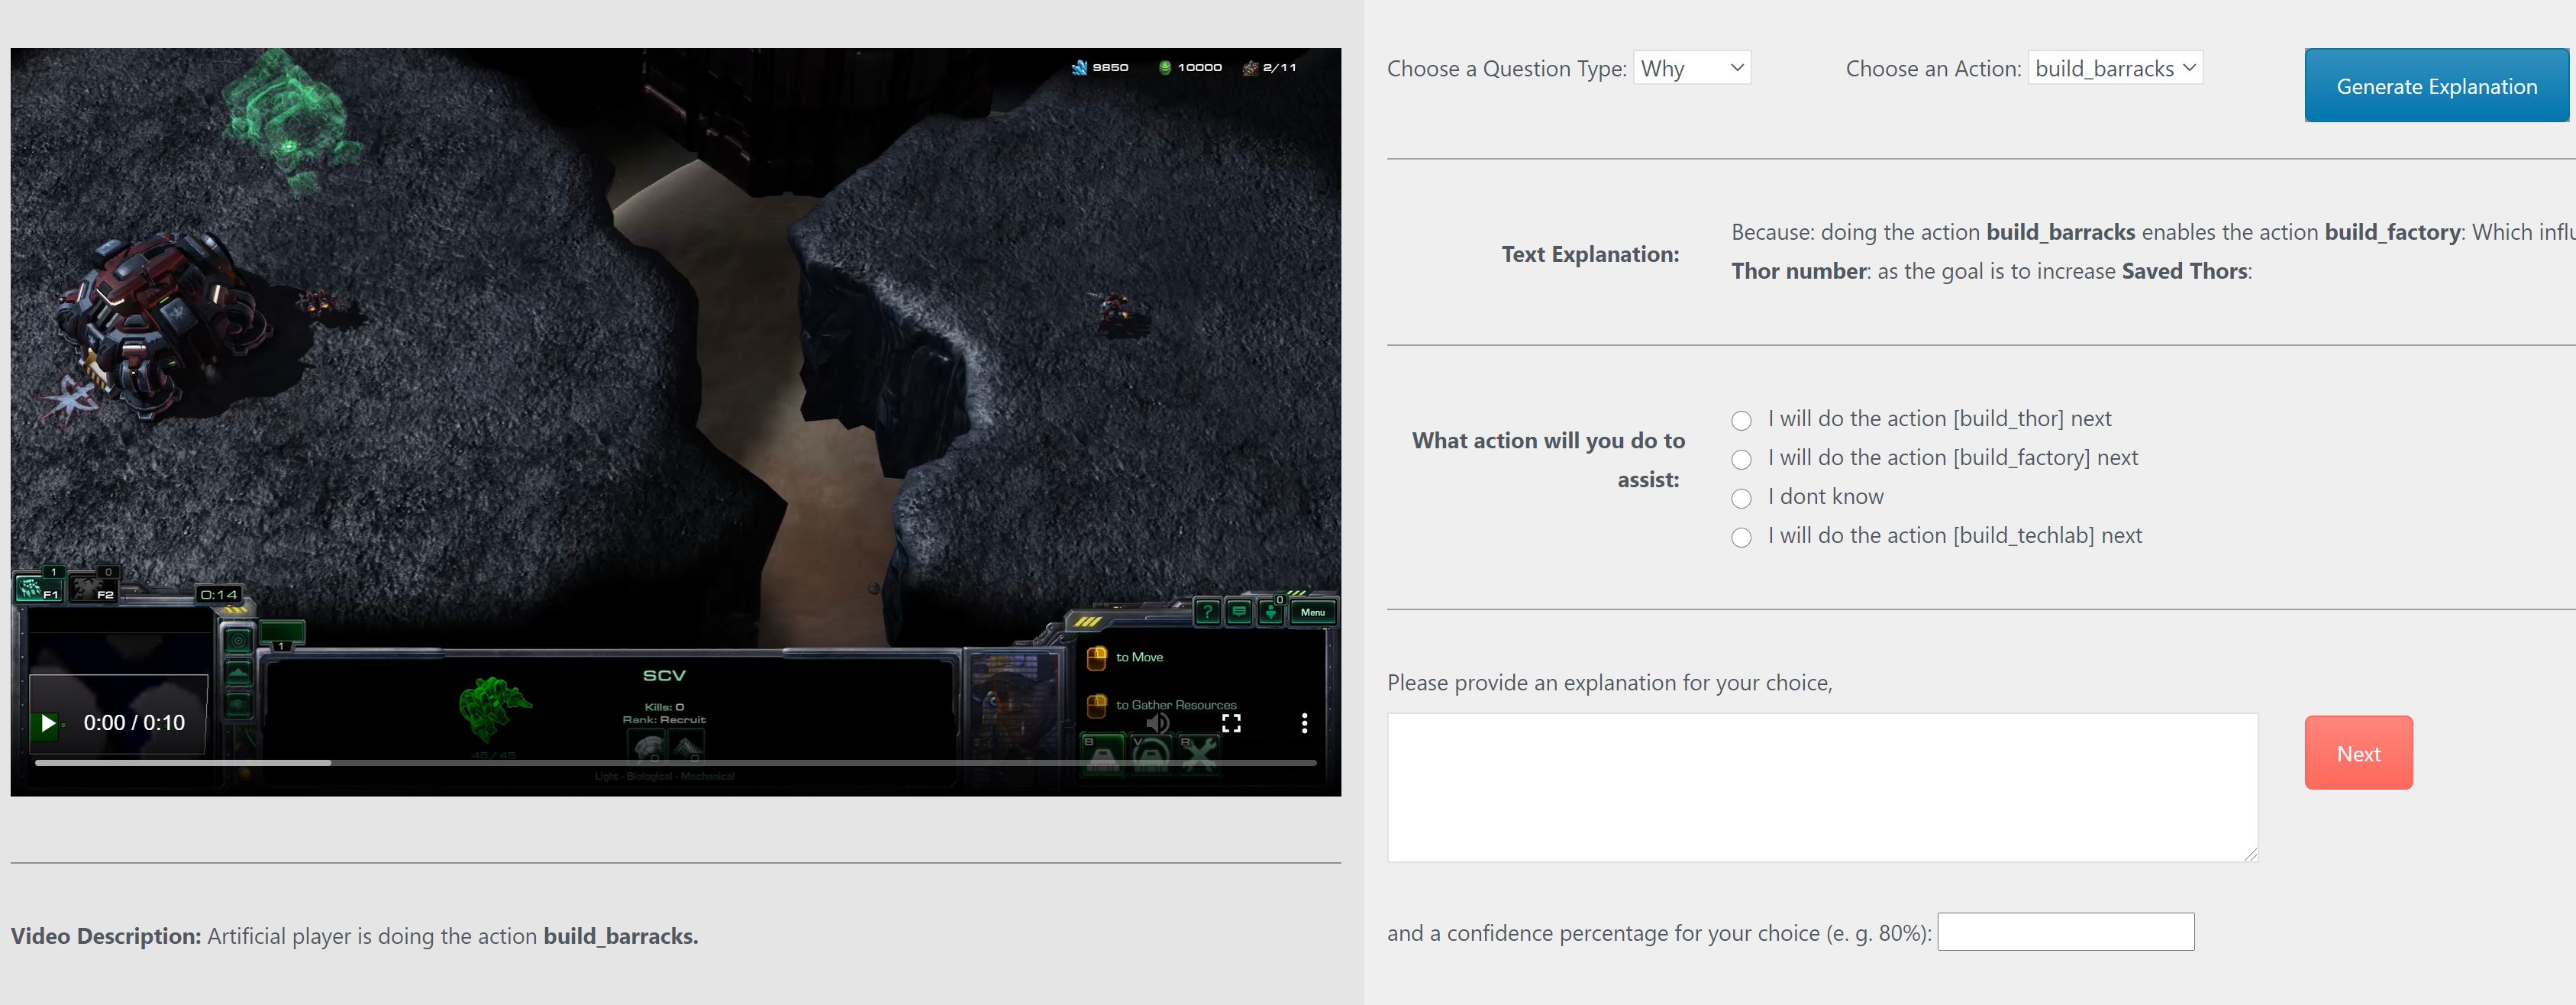
We first display the ethics approval obtained through a university, and after the participants’ consent gather demographic information. We then show video clips of the agents solving the 3 StarCraft II scenarios that capture the behaviour of the agents. Each scenario has 4 distinct behaviours of the respective agent (around 10 seconds per clip). Every participant sees all three scenarios, and all three explanation types, but between participants, the combination of scenario and explanation type are mixed. For example, a participant may experience: Adversarial with no explanations, Rescue with casual explanations and Collaborative with distal explanations. The order of these is randomised to control for ordering effects.
The first stage of the experiment involves training the participants to identify agents’ actions using video clips of the agents performing those actions before the start of each scenario. In the Collaborative scenario, participants are trained to identify the actions they can use instead. After validating that participants can distinguish different actions through a question, the scenario will be presented.
The second stage lets the participants ask explanatory questions (in the form of why/why not action), after watching the agent’s behaviour through the video clip. Participants can ask any number of questions and we did not control for a minimum number of questions; however, we incentivised participants to ask questions because they knew they would receive bonus payments for getting predictions correct later in the experimence. After each explanation video, participants are presented with the explanation satisfaction survey. For each explanation/scenario pair, each participant engages in 4 tasks.
color=green!80, ,inline]Tim: Below: “This process is also repeated 4 times.” Not clear whether this is 5 in total? Once then 4 repeats. Or whether just 4. I think it is the latter (if I recall correctly), so re-word to something like: “Each participants makes predictions for 4 tasks” color=yellow!80, ,inline]Prashan: changed
The third stage involves evaluating the participants’ ‘understanding’ of the agent through task prediction. Participants are presented with 4 new videos with different situations, and are asked what action the agent will do next, and can select one of the 4 options (which are 3 actions of the agent plus the option of ‘I don’t know’). Each participants makes predictions for 4 tasks. After this stage participant will move to the next scenario with a different explanation model and repeat from Stage 1 to 3. This is done until all the scenarios are encountered by the participant.
In the final stage, the participant is presented with 3 additional explanation videos (of the scenario they did for the no explanation condition), and is presented with causal explanations from action influence models (Madumal et al., 2020) and our distal explanation model side by side. We use Hoffman et al. (Hoffman et al., 2018, p.39)’s explanation satisfaction scale but this time as a movable slider that subjectively compares the two explanation.
Experimental Conditions: We ran the experiment with the above mentioned 3 independent variables (the explanation models), which resulted in 3 combinations of explanation model and scenarios, with participants seeing all 3 scenarios and all 3 explanation types. Each combination had 30 participants for a total of 90 participants in the experiment. Each participant is scored on the total number of correct task predictions out of 12 (4 each for each model-scenario combination).
Each experiment ran approximately 50 minutes, and we compensated each participant with 8.5USD (a bonus compensation of 0.5USD was also given to participants for each point above 10). Participants were aged between 23 to 60 (), and of the 90 participants, 51 were male while 38 were female and 1 who did not provide an answer. Participants reported an average self-rated gaming experience and StarCraft II experience of 2.47 and 1.47 out of 5 (5-point Likert) respectively.
color=green!80, ,inline]Tim: A few bits of information missing below: “If the participant failed this, the experimence did not proceed" – I think they were still paid some amount? Just state this and state how much. Also state the threshold use. And also not how many participants were excluded color=yellow!80, ,inline]Prashan: added some text
To ensure the quality of data from participants, we recruited only ‘master class’ workers with or more approval rate. We controlled for language by only recruiting workers from the United States. We excluded the noisy data of users in 3 ways. First, we tested participants to ensure they had learnt about the scenario by asking them to identify actions shown in several videos. If the participant failed this, the experiment did not proceed (participants were paid a $2USD base amount). Second, we tracked how much time each participant spent viewing explanations and answering tasks. If this was regularly below a threshold of a few seconds, we omitted that participant from our results. Third, participants were required to explain their task predictions. If this text was gibberish or a 1-2 word response, we omitted that participant from the results. We filtered out 16 participants according to the above constraints to yield the final participant number of 90.
6.3 Results
| Model (-) | Z-test | T-test | ||||
|---|---|---|---|---|---|---|
| Scenario | p-value | Prop (|) | p-value | t-stat | ||
| C - N | Adversarial | 5.437 | 0.019 | 0.53 | 0.38 | 0.056 | -1.988 |
| Rescue | 2.283 | 0.130 | 0.71 | 0.62 | 0.169 | -1.408 | |
| Collaborative | 0.416 | 0.518 | 0.50 | 0.46 | 0.537 | -0.623 | |
| D - N | Adversarial | 11.269 | <0.001 | 0.60 | 0.38 | <0.001 | -3.791 |
| Rescue | 9.931 | 0.001 | 0.80 | 0.62 | 0.010 | -2.750 | |
| Collaborative | 31.966 | <0.001 | 0.81 | 0.46 | <0.001 | -4.761 | |
| D - C | Adversarial | 1.085 | 0.297 | 0.60 | 0.50 | 0.325 | -1.000 |
| Rescue | 2.784 | 0.095 | 0.80 | 0.71 | 0.221 | -1.249 | |
| Collaborative | 25.511 | <0.001 | 0.81 | 0.50 | <0.001 | -4.367 | |
We first discuss the results on hypothesis 1), where we investigate whether distal explanation models lead to a better understanding of the agent. We present the null hypotheses as and the alternate hypothesis as and , in which N, C, D corresponds to ‘no explanation’, causal and distal explanation models. Here, denotes the proportions of the observed values of correct answers in task predictions by the participants.
We perform Pearson’s Chi-squared test for the three StarCraft II scenarios and obtain the following values: Adversarial (p-value = 0.011, ), Rescue (p-value = 0.034, ) and Collaborative (p-value = <0.001, ). As the Chi-squared test was significant at the 0.05 level across the three scenarios, we investigate the pairwise differences between models using a z-test. We summarise the results in Table 4. From Table 4, considering the proportions () between model pairs, we can see that apart from Adversarial and Rescue scenarios for the D - C model pair, distal explanation models have statistically significant results at the 0.05 level between other combinations. Thus we accept for every StarCraft II scenario and accept only for the Collaborative scenario. We further test the validity of our results by employing a pairwise t-test which produce similar conclusions (results shown in Table 3. We illustrate these results as a box-plot in Figure 9. Clearly, the Collaborative scenario poses a much higher challenge to the participants, and results indicate that distal explanations perform better than other models in this task.
| Metric | Scenario | p-value | Proportions (D|C) | |
|---|---|---|---|---|
| Complete | Adversarial | 3.267 | 0.070 | 0.56 | 0.45 |
| Rescue | 0.074 | 0.785 | 0.33 | 0.35 | |
| Collaborative | 11.428 | <0.001 | 0.40 | 0.20 | |
| Sufficient | Adversarial | 6.020 | 0.014 | 0.56 | 0.40 |
| Rescue | 0.018 | 0.892 | 0.35 | 0.34 | |
| Collaborative | 15.55 | <0.001 | 0.41 | 0.18 | |
| Satisfying | Adversarial | 1.085 | 0.297 | 0.46 | 0.40 |
| Rescue | 1.528 | 0.216 | 0.29 | 0.36 | |
| Collaborative | 9.981 | 0.001 | 0.42 | 0.23 | |
| Understanding | Adversarial | 1.377 | 0.240 | 0.46 | 0.39 |
| Rescue | 0.071 | 0.788 | 0.35 | 0.37 | |
| Collaborative | 15.31 | <0.001 | 0.42 | 0.19 |
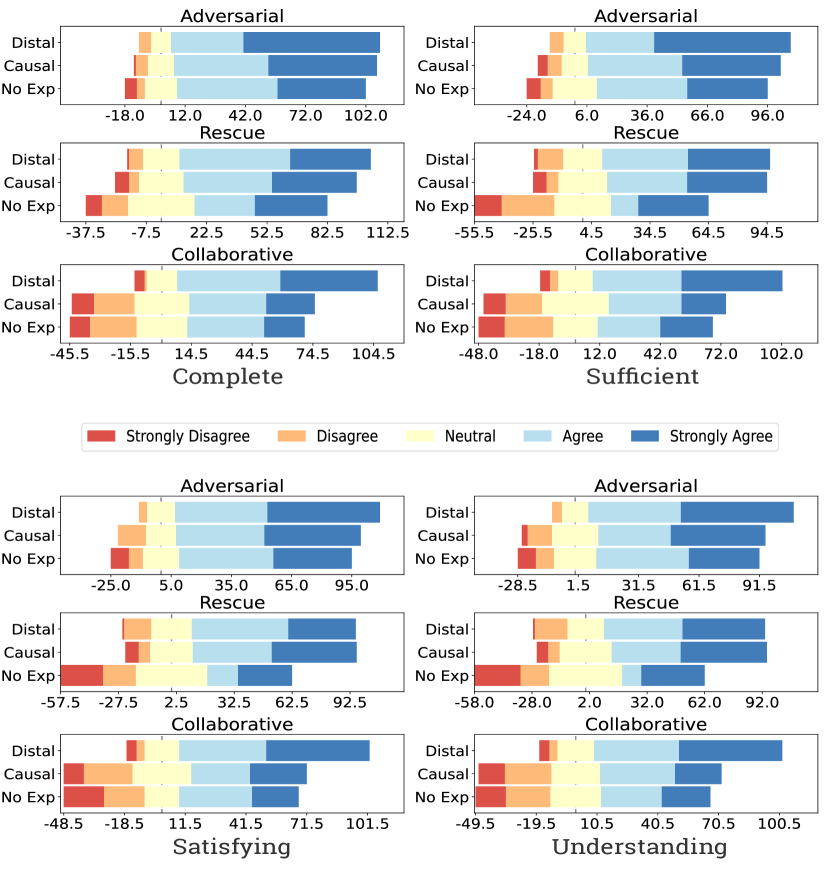
color=green!80, ,inline]Tim: The results use for statistical testing and H2 for the experimental hypothesis, which is a bit confusing. Perhaps don’t use H1 and H2 for the experimental hypothesis; just use 1 and 2? color=yellow!80, ,inline]Prashan: changed
Explanation Quality: The second main hypothesis 2), evaluate whether distal explanations can provide subjectively better explanations. The corresponding null hypothesis is and the alternative hypothesis is . in this case becomes the proportion of the observed values of the Likert scale data (using the survey of Hoffman et al. (2018, p.39)), where participants have rated as ‘5’. We consider four explanation quality metrics; ‘Complete’, ‘Sufficient’, ‘Satisfying’ and ‘Understanding’. As before, we employ Pearson’s Chi-squared test to see the significance of the above 4 metrics in the 3 StarCraft II scenarios, and obtain p-values < 0.01 for every condition. As there are significant differences between explanation models on explanation quality, we reject and conduct a pairwise z-test. We summarise the results in Table 5. Figure 10 captures the Likert scale data distribution across models and scenarios. Though it is visually evident that distal explanation quality across the compared metrics has a positive trend, from the three scenarios, only the Collaborative task yields significant results for every explanation quality metric (see Table 5). Thus we accept only for the Collaborative scenario.
color=green!80, ,inline]Tim: What is the x-axis measure for the likert scales? 0 is neutral, 100 is everyone rating 5, and -100 is everyone rating 1? Needs some explanation color=yellow!80, ,inline]Prashan: added a description to the figure title
Discussion:
The results we obtained for explanation quality mirror the results in task prediction. Intuitively this makes sense as participants are more inclined to rate an explanation ‘good’ if they feel they have a better ‘understanding’ of the agent. Further investigations are needed to explore why distal explanations perform substantially better in human-agent collaborative tasks.
To investigate whether the knowledge of the StarCraft II game had any impact on task prediction scores, we perform a Pearson’s correlation test between task prediction and StarCraft II experience (self-report in a 5-point Likert scale). The obtained values (t = 1.515, p-value = 0.133) indicate that there is no statistically significant correlation between scores and StarCraft II experience. Although our experiment was based on the StarCraft II environment, we used custom maps and scenarios that are different from the game. Thus the results of the correlation test is plausible.
One weakness of our model is the need for a causal graph that is faithful to the problem, in order to learn the opportunity chains. For the purpose of this paper, we hand-crafted the causal graphs for StarCraft II scenarios and the 5 RL benchmarks. While our hand-crafted models can be verified easily with data, we acknowledge that it may become infeasible in larger domains. We view generating a causal graph a distinct problem than generating explanations using a causal graph. As such we propose this as our immediate future work.
color=green!80, ,inline]Tim: Here we need a section on the limitations of the experiment design: external and internal validity in particular color=yellow!80, ,inline]Prashan: added some explanation
Limitations of the experiment design:
Although we used scenarios that have different objectives than the standard Starcraft II game, familiarity with the game’s concepts may have had some impact on the scores even if it is not significant. Participants also may have had commonsense knowledge about such scenarios (in particular rescue and adversarial) that can affect their judgments. Our results should be generalisable across similar scenarios in different domains, though further experiments are needed to evaluate the generalisability across different scenarios (e.g. path planning, manufacturing).
7 Conclusion
We introduce a distal explanation model for model-free reinforcement learning agents that can generate explanations for ‘why’ and ‘why not’ questions. These models learn opportunity chains (in the form of enables and causes ), and approximate a future action that enables due to the current action of the agent. Our motivation comes from insights gained through a human-agent experiment, in which we analysed 240 human explanations. Participants in this study frequently referred to future action that depend on the current action of the agent, which conform to the definition of opportunity chains. To learn opportunity chains at the training phase in reinforcement learning we make use of action influence models to extract causal chains and represent the approximated policy of the agent in a decision tree policy. In contrast to action influence models that use structural causal equations to generate contrastive explanations, we use the decision policy in conjunction with causal chains to improve the accuracy of task prediction. We evaluate our approach in 6 RL benchmarks on task prediction. We then undertake a human study with 90 participants to investigate how the distal explanation model perform in task prediction and explanation quality metrics in three custom scenarios built using the StarCraft II platform.
While results indicate a significantly better performance of distal explanations compared with two other explanation models in collaborative situations, further research is needed to understand the impact this technique may have on other types of scenarios. One weakness of our model is the need of knowing the causal structure of the domain beforehand. Though this can be mitigated by using existing causal discovery methods, the reinforcement learning setting provides a unique opportunity to learn causal graphs that are better suited for explanation through influencing the exploration of the agent. Thus our immediate future work involves generating causal models at the training time of the agent through causal discovery.
color=green!80, ,inline]Tim: Suggest that you go through the references carefully to look for typos etc; e.g. in Brockman “Openai” should be “OpenAI”, and is one Elizalbe reference, “mdp” should be “MDP”. Probably there are others
color=yellow!80, ,inline]Prashan: fixed
References
- Abdul et al. (2018) Ashraf Abdul, Jo Vermeulen, Danding Wang, Brian Y Lim, and Mohan Kankanhalli. Trends and trajectories for explainable, accountable and intelligible systems: An HCI research agenda. In Proceedings of the 2018 CHI conference on human factors in computing systems, page 582. ACM, 2018.
- Amir and Amir (2018) Dan Amir and Ofra Amir. Highlights: Summarizing agent behavior to people. In Proc. of the 17th International conference on Autonomous Agents and Multi-Agent Systems (AAMAS), 2018.
- Böhm and Pfister (2015) Gisela Böhm and Hans-Rüdiger Pfister. How people explain their own and others’ behavior: a theory of lay causal explanations. Frontiers in psychology, 6:139, 2015.
- Boutilier et al. (1995) Craig Boutilier, Richard Dearden, Moises Goldszmidt, et al. Exploiting structure in policy construction. In IJCAI, volume 14, pages 1104–1113, 1995.
- Braun and Clarke (2006) Virginia Braun and Victoria Clarke. Using thematic analysis in psychology. Qualitative research in psychology, 3(2):77–101, 2006.
- Brockman et al. (2016) Greg Brockman, Vicki Cheung, Ludwig Pettersson, Jonas Schneider, John Schulman, Jie Tang, and Wojciech Zaremba. OpenAI Gym, 2016.
- Buhrmester et al. (2011) Michael Buhrmester, Tracy Kwang, and Samuel D Gosling. Amazon’s mechanical turk: A new source of inexpensive, yet high-quality, data? Perspectives on psychological science, 6(1):3–5, 2011.
- Byrne (2019) Ruth MJ Byrne. Counterfactuals in explainable artificial intelligence (XAI): evidence from human reasoning. In Proceedings of the Twenty-Eighth International Joint Conference on Artificial Intelligence, IJCAI-19, pages 6276–6282, 2019.
- Chapman and Kaelbling (1991) David Chapman and Leslie Pack Kaelbling. Input generalization in delayed reinforcement learning: An algorithm and performance comparisons. In IJCAI, volume 91, pages 726–731. Citeseer, 1991.
- De Graaf and Malle (2017) Maartje MA De Graaf and Bertram F Malle. How people explain action (and autonomous intelligent systems should too). In 2017 AAAI Fall Symposium Series, 2017.
- Elizalde and Sucar (2009) Francisco Elizalde and Luis Enrique Sucar. Expert evaluation of probabilistic explanations. In ExaCt, pages 1–12, 2009.
- Elizalde et al. (2007) Francisco Elizalde, Luis Enrique Sucar, Alberto Reyes, and Pablo Debuen. An MDP approach for explanation generation. In ExaCt, pages 28–33, 2007.
- Elizalde et al. (2008) Francisco Elizalde, L Enrique Sucar, Manuel Luque, J Diez, and Alberto Reyes. Policy explanation in factored markov decision processes. In Proceedings of the 4th European Workshop on Probabilistic Graphical Models (PGM 2008), pages 97–104, 2008.
- Fukuchi et al. (2017) Yosuke Fukuchi, Masahiko Osawa, Hiroshi Yamakawa, and Michita Imai. Autonomous self-explanation of behavior for interactive reinforcement learning agents. In Proceedings of the 5th International Conference on Human Agent Interaction, pages 97–101. ACM, 2017.
- Gunning and Aha (2019) David Gunning and David W Aha. Darpa’s explainable artificial intelligence program. AI Magazine, 40(2):44–58, 2019.
- Halpern and Pearl (2005) Joseph Y Halpern and Judea Pearl. Causes and explanations: A structural-model approach. part II: Explanations. The British journal for the philosophy of science, 56(4):889–911, 2005.
- Hayes and Shah (2017) Bradley Hayes and Julie A Shah. Improving robot controller transparency through autonomous policy explanation. In Proceedings of the 2017 ACM/IEEE international conference on human-robot interaction, pages 303–312. ACM, 2017.
- Hilton (1990) Denis J Hilton. Conversational processes and causal explanation. Psychological Bulletin, 107(1):65, 1990.
- Hilton et al. (2005) Denis J Hilton, John L McClure, and Ben R. Slugoski. The course of events: counterfactuals, causal sequences, and explanation. In D.R. Mandel, D.J. Hilton, and P. Catellani, editors, The Psychology of Counterfactual Thinking, pages 56–72. Routledge, 2005.
- Hilton et al. (2010) Denis J Hilton, John McClure, and Robbie M Sutton. Selecting explanations from causal chains: Do statistical principles explain preferences for voluntary causes? European Journal of Social Psychology, 40(3):383–400, 2010.
- Hoffman et al. (2018) Robert R Hoffman, Shane T Mueller, Gary Klein, and Jordan Litman. Metrics for explainable AI: Challenges and prospects. arXiv preprint arXiv:1812.04608, 2018.
- Hornsby (1993) Jennifer Hornsby. Agency and causal explanation. 1993.
- Juozapaitis et al. (2019) Zoe Juozapaitis, Anurag Koul, Alan Fern, Martin Erwig, and Finale Doshi-Velez. Explainable reinforcement learning via reward decomposition. In Proceedings of the IJCAI 2019 Workshop on Explainable Artificial Intelligence, pages 47–53, 2019.
- Keren (2014) Gideon Keren. Between-or within-subjects design: A methodological dilemma. A Handbook for Data Analysis in the Behaviorial Sciences, 1:257–272, 2014.
- Khan et al. (2009) Omar Zia Khan, Pascal Poupart, and James P Black. Minimal sufficient explanations for factored markov decision processes. In ICAPS, 2009.
- Klein (2018) Gary Klein. Explaining explanation, part 3: The causal landscape. IEEE Intelligent Systems, 33(2):83–88, 2018.
- Langley et al. (2017) Pat Langley, Ben Meadows, Mohan Sridharan, and Dongkyu Choi. Explainable agency for intelligent autonomous systems. In Twenty-Ninth IAAI Conference, 2017.
- Lim et al. (2009) Brian Y Lim, Anind K Dey, and Daniel Avrahami. Why and why not explanations improve the intelligibility of context-aware intelligent systems. In Proceedings of the SIGCHI Conference on Human Factors in Computing Systems, pages 2119–2128. ACM, 2009.
- Lin (1992) Long-Ji Lin. Self-improving reactive agents based on reinforcement learning, planning and teaching. Machine learning, 8(3-4):293–321, 1992.
- Lombrozo and Vasilyeva (2017) Tania Lombrozo and Nadya Vasilyeva. Causal explanation. Oxford handbook of causal reasoning, pages 415–432, 2017.
- Madumal et al. (2020) Prashan Madumal, Tim Miller, Liz Sonenberg, and Frank Vetere. Explainable reinforcement learning through a causal lens. In Proceedings of the AAAI Conference on Artificial Intelligence, 2020.
- McClure and Hilton (1997) John McClure and Denis Hilton. For you can’t always get what you want: When preconditions are better explanations than goals. British Journal of Social Psychology, 36(2):223–240, 1997.
- McClure et al. (2007) John McClure, Denis J Hilton, and Robbie M Sutton. Judgments of voluntary and physical causes in causal chains: Probabilistic and social functionalist criteria for attributions. European journal of social psychology, 37(5):879–901, 2007.
- Miller (2018a) Tim Miller. Contrastive explanation: A structural-model approach. arXiv preprint arXiv:1811.03163, 2018a.
- Miller (2018b) Tim Miller. Explanation in artificial intelligence: Insights from the social sciences. Artificial Intelligence, 2018b.
- Nagel and Stephan (2016) Jonas Nagel and Simon Stephan. Explanations in causal chains: Selecting distal causes requires exportable mechanisms. In Proceedings of the 38th Annual Conference of the Cognitive Science Society, pages 806–812. Cognitive Science Society Austin, TX, 2016.
- Roth et al. (2019) Aaron M Roth, Nicholay Topin, Pooyan Jamshidi, and Manuela Veloso. Conservative q-improvement: Reinforcement learning for an interpretable decision-tree policy. arXiv preprint arXiv:1907.01180, 2019.
- Schuster and Paliwal (1997) Mike Schuster and Kuldip K Paliwal. Bidirectional recurrent neural networks. IEEE Transactions on Signal Processing, 45(11):2673–2681, 1997.
- Schwab and Karlen (2019) Patrick Schwab and Walter Karlen. Cxplain: Causal explanations for model interpretation under uncertainty. In Advances in Neural Information Processing Systems, pages 10220–10230, 2019.
- Sloman (2005) Steven Sloman. Causal models: How people think about the world and its alternatives. Oxford University Press, 2005.
- Struckmeier et al. (2019) Oliver Struckmeier, Mattia Racca, and Ville Kyrki. Autonomous generation of robust and focused explanations for robot policies. In 2019 28th IEEE International Conference on Robot and Human Interactive Communication (RO-MAN), pages 1–8. IEEE, 2019.
- Tabrez et al. (2019) Aaquib Tabrez, Shivendra Agrawal, and Bradley Hayes. Explanation-based reward coaching to improve human performance via reinforcement learning. In 2019 14th ACM/IEEE International Conference on Human-Robot Interaction (HRI), pages 249–257. IEEE, 2019.
- Topin and Veloso (2019) Nicholay Topin and Manuela Veloso. Generation of policy-level explanations for reinforcement learning. In Proceedings of the AAAI Conference on Artificial Intelligence, volume 33, pages 2514–2521, 2019.
- van der Waa et al. (2018) Jasper van der Waa, Jurriaan van Diggelen, Karel van den Bosch, and Mark Neerincx. Contrastive explanations for reinforcement learning in terms of expected consequences. arXiv preprint arXiv:1807.08706, 2018.
- Vinyals et al. (2017) Oriol Vinyals, Timo Ewalds, Sergey Bartunov, Petko Georgiev, Alexander Sasha Vezhnevets, Michelle Yeo, Alireza Makhzani, Heinrich Küttler, John Agapiou, Julian Schrittwieser, et al. Starcraft ii: A new challenge for reinforcement learning. arXiv preprint arXiv:1708.04782, 2017.
- Wang et al. (2019) Danding Wang, Qian Yang, Ashraf Abdul, and Brian Y Lim. Designing theory-driven user-centric explainable ai. In Proceedings of the 2019 CHI Conference on Human Factors in Computing Systems, page 601. ACM, 2019.
- Wang et al. (2016) Ning Wang, David V Pynadath, and Susan G Hill. Trust calibration within a human-robot team: Comparing automatically generated explanations. In The Eleventh ACM/IEEE International Conference on Human Robot Interaction, pages 109–116. IEEE Press, 2016.