Structure and magnetic properties of epitaxial CaFe2O4 thin films
Abstract
is a highly anisotropic antiferromagnet reported to display two spin arrangements with up-up-down-down (phase A) and up-down-up-down (phase B) configurations. The relative stability of these phases is ruled by the competing ferromagnetic and antiferromagnetic interactions between spins arranged in two different environments, but a complete understanding of the magnetic structure of this material does not exist yet. In this study we investigate epitaxial thin films grown on (110) substrates by means of Pulsed Laser Deposition (PLD). Structural characterization reveals the coexistence of two out-of-plane crystal orientations and the formation of three in-plane oriented domains. The magnetic properties of the films, investigated macroscopically as well as locally, including highly sensitive Mössbauer spectroscopy, reveal the presence of just one order parameter showing long-range ordering below K and the critical nature of the transition. In addition, a non-zero in-plane magnetization is found, consistent with the presence of uncompensated spins at phase or domain boundaries, as proposed for bulk samples.
Introduction
is an oxide semiconductor that, unlike most of the other ferrites with the same unit formula, does not have the Spinel structure[1] and, instead, crystallizes in a orthorhombic prototype structure with space group and lattice parameters a=9.230 , b=3.024 and c=10.705 [2, 3].
An extensive literature focuses on the catalytic activity of nanoparticles [4, 5] and heterostructures [6, 7, 8, 9], with particular attention to its application as photo-cathode in generation and water splitting reactions. On the other hand, single crystals of this material are only moderately investigated [10, 11, 12, 13, 14, 15, 16] and reports of epitaxial growth of thin films are almost absent [17].
Since the first studies [10, 11], the unusual magnetic structure of has been subject to debate and to date it has not yet been completely understood [18]. Recently, renewed interest in the topic has arisen following the neutron diffraction studies of Stock et al.[15, 16] on single crystals.
In the structure, the ions occupy two crystallographically distinct positions, and , each surrounded by 6 oxygen atoms in octahedral coordination, that form zig-zag chains that run parallel to the b-axis. octahedra within the same chain share edges, whereas neighbouring chains are connected through corners, as shown in Fig.1 [18]. As in many oxides, the magnetic coupling between spins occurs via oxygen mediated superexchange, whose strength and sign depend on the bond angles. Thus, strong inter-chain antiferromagnetic (AF) interactions, and , are found between corner sharing and octahedra, where the bond angles are about 120∘.
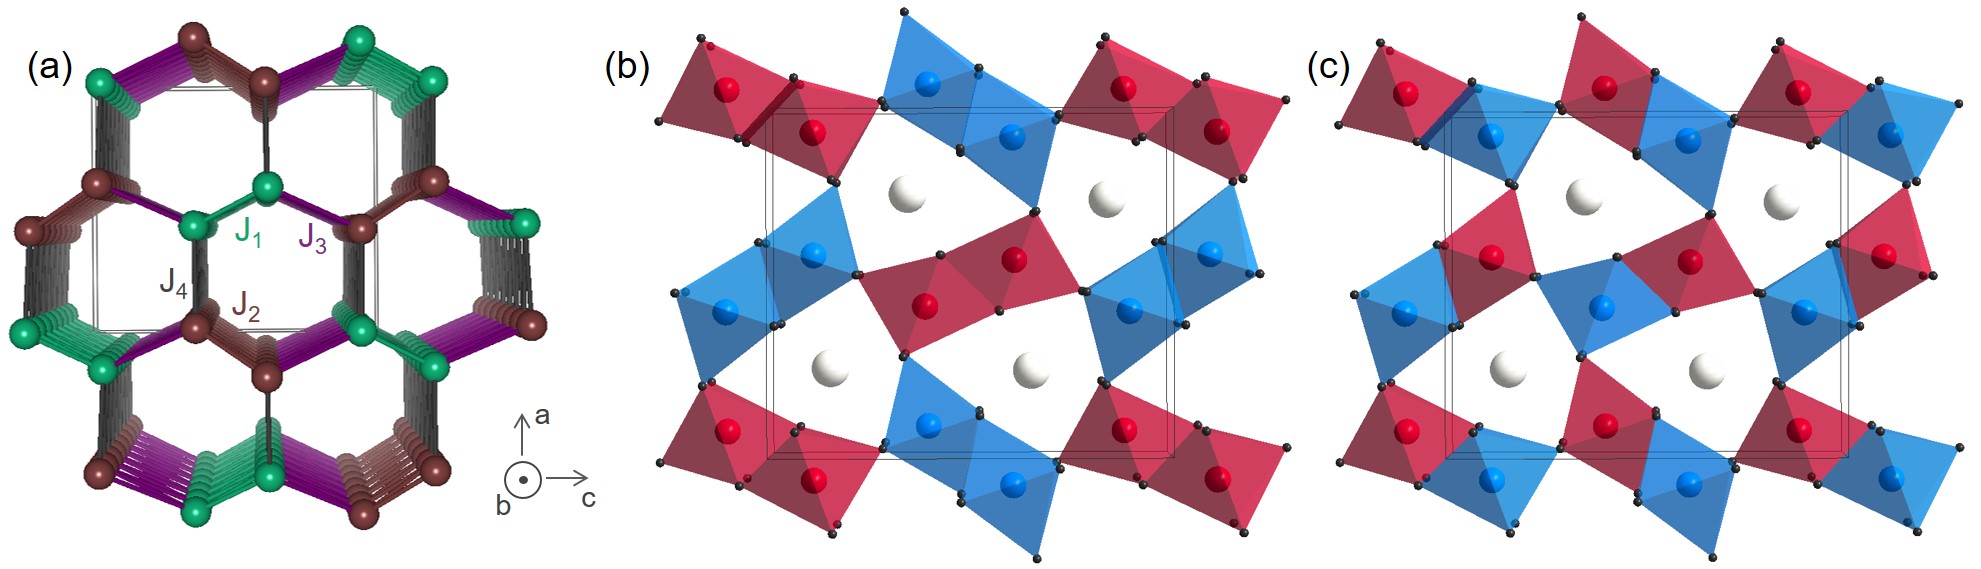
On the other hand, weaker couplings, and , occur between edge-sharing octahedra within the same zig-zag chain, connected through angles of approximately 100∘. Recently, Das et al.[18] have suggested that the magnetic structure of can be viewed as an armchair-type structure extending along the a-axis.
Below the Néel temperature two competing spin arrangements, named A and B, exist, that differ for the sign of the weak intra-chain couplings and, thus, on the c-axis stacking of spins [10, 15]. Specifically, the B structure is characterized by alternating spin up and spin down stripes in the c-direction, while in the A structure the periodicity is doubled with an up-up-down-down configuration (see Fig. 1b-c). In both structures spins align parallel to the b-axis, giving rise to an Ising-like system with large magnetocrystalline anisotropy [14]. At the Néel temperature (=200 K) the material orders in a pure B phase. Upon decreasing temperature below 150 K, the A phase also appears and the coexistence of these two structures has been reported to occur down to low-temperatures, where the A arrangement is favoured [16, 19]. Interestingly, each phase can also be visualized as the local structure of the antiphase boundary between two domains of the other phase, where the “orphan spins” generate an uncompensated magnetic moment along the b-axis[16].
The magnetic properties of this material have been investigated by means of neutron diffraction, DC and AC magnetometry, on single-crystalline and polycrystalline samples. [20, 21, 14, 15, 18, 22]. However, there is no complete agreement in the literature on interpreting the magnetic susceptibility measurements. In particular, the magnetic properties of seem to be very sensitive to the oxygen content. For example, only one magnetic transition at lower has been observed in oxygen-deficient [18]. In addition, oxygen vacancies-driven partial conversion of (HS S=5/2) into (LS S=2) ions has been reported to cause incomplete cancellation of the magnetization below inducing ferrimagnetic behaviour. On the other hand, a ferrimagnetic state is also observed in oxygen superstoichiometric due to the presence of ions and the charge disproportionation between and ions occupying two inequivalent sublattices[21].
In this work we report a detailed structural and magnetic characterization of epitaxial thin films of . The films are relaxed to the bulk structure and show magnetic properties consistent with those reported in single crystals [15, 14]. The well defined microstructure of the films allows us to perform local magnetic characterization, yet unreported in this material, and to shed light into the origin of the net magnetic moment reported in various works [16, 18, 21].
Results
Synthesis and crystal structure
Finding a suitable substrate is the first step for the epitaxial growth of thin films. Unlike for Perovskite and Spinel-type materials, most of the commonly used crystalline substrates do not match the lattice parameters of the prototype structure, making predictions of the epitaxial relation between the film and substrate not straightforward. A previous work on thin films of this material has used (100) substrates [17], due to the similarity between the oxygen octahedra in the rutile-type and structure. Thus, in our work, we also selected crystals as substrates, but cut along the (110) direction, in order to obtain a different out-of-plane orientation of the film.
The optimization of the growth of thin films on (110) substrates by Pulsed Laser Deposition (PLD) requires the control of several physical parameters (see Methods section). Because of the large nominal mismatch between film and this substrate orientation (9), polycrystalline or amorphous films are easily obtained for a large window of growth parameters. However, we observed that relatively thick films of around 100 nm, prepared with a number of laser pulses in between 6 and 20 thousand, as well as a high laser repetition rate (10-15 Hz), are crystalline and textured.
Following the films growth in-situ by reflection high energy electron diffraction (RHEED) indicates island-growth mode: during the first minutes of deposition, the initial sharp reciprocal rods of the atomically flat substrate evolve into a transmission diffraction pattern typical of 3D islands [23]. Finally, at the end of the deposition, no more rods are visible, indicating high surface roughness (see inset Fig. 2a). Despite this, a well-defined epitaxial relation between the films and the substrate is observed, as discussed below.
Increased crystallinity of the films, estimated by the intensity of the out-of-plane peak in the X-Ray diffraction (XRD) pattern (Fig. 2a), was achieved with a substrate temperature of 850 and partial oxygen pressure =0.2 mbar. A relatively high energy density of 2.8 J/cm2 was required in order to ablate and atoms in equal proportion from the ceramic target and achieve near stoichiometric transfer (see Supplementary Note 1). As a result, atoms travelling in the plasma plume reach the surface with high energy and are able to interact chemically with it. This leads to the formation of a Calcium Titanate layer at the interface between film and substrate.
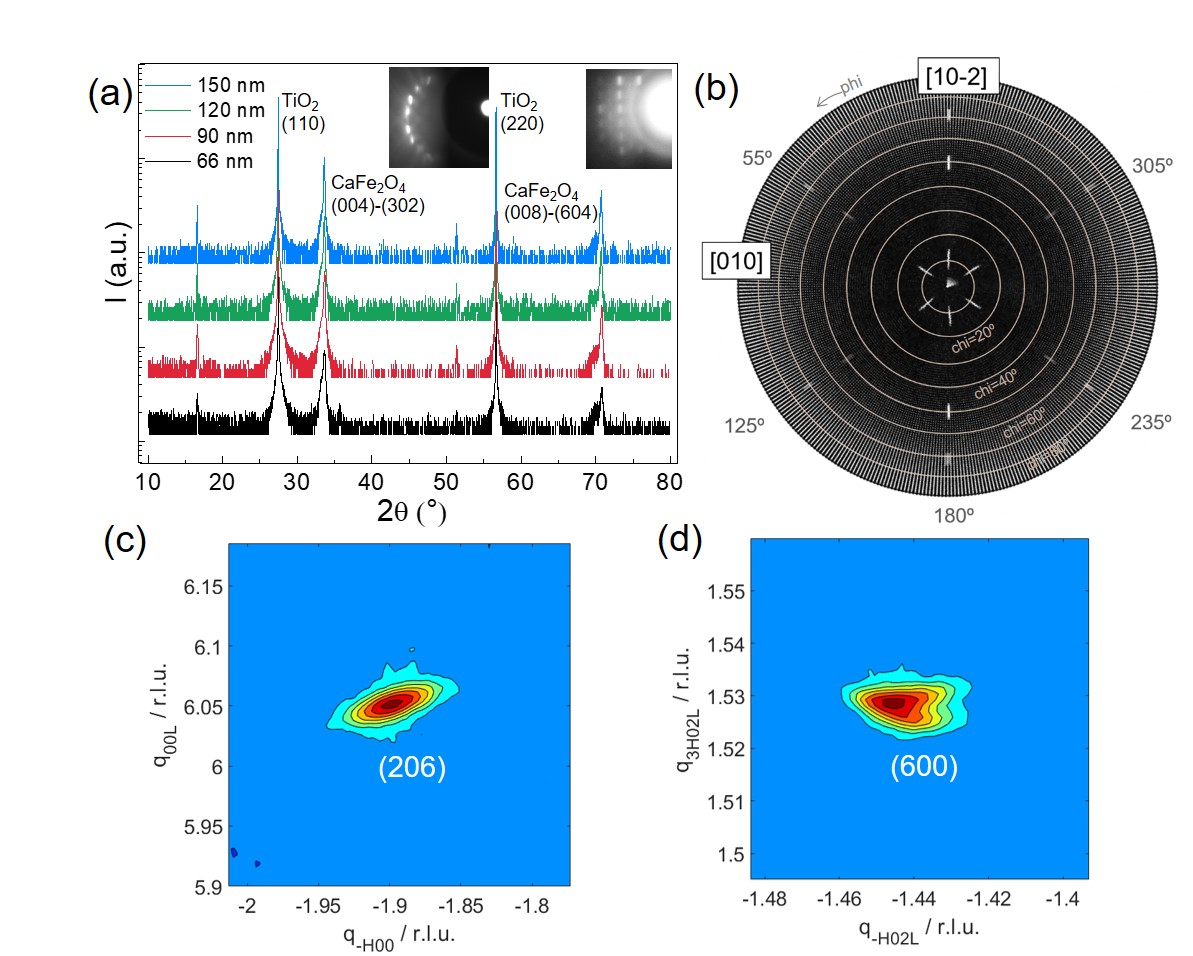
Fig. 2 shows the characterization of the films by means of X-Ray Diffraction (XRD). Two strong peaks in the two-theta-omega scans (Fig. 2a) are seen at angles of 33.6∘ and 70.5∘. The former can belong to both the (004) and (302) planes of and the latter to their second order diffraction. These two families of planes not only share the same lattice spacing, Å, but also display a very similar arrangement of atoms, making it non-trivial to tell them apart in X-Ray experiments (for more details see Supplementary Note 2). Therefore, in order to precisely determine the films orientation, the data from specular reflections need to be complemented by Reciprocal Space Maps (RSMs) around off-specular peaks. In the first map (Fig. 2c), we observe a peak at 2=55.23∘ and =6.48∘, which is the (-206) peak if (004) is the out-of-plane orientation. No peak should be observed in that position in case of the (302) orientation. In the second map (Fig. 2d), we observe a peak at 2=60.25∘ and =-1∘, which is the (600), if (302) is the out-of-plane orientation. Again, no peak should be found at these position in case of the (004) orientation. Therefore, the presence of both the (-206) and (600) peaks is only consistent with the coexistence of both (004) and (302) out-of-plane orientations within the same film. Moreover, from the RSMs we can deduce the epitaxial relation between films and substrate. In both crystal orientations, the [010] direction of the film is in-plane and aligned with the [1-10] direction of the substrate. On the other hand, the substrate [001] direction is parallel to the [100] and [10-2] directions of for (004) and (302) oriented crystals, respectively. This is particularly relevant for the magnetic properties of the films, being the [010] (b-axis) the magnetization direction, which indicates that the spins are oriented in the plane of the films.
Further proof of the coexistence of the (004) and (302) orientations is provided by X-Ray pole Figures. Fig. 2b shows the measurement collected at 2=25.5∘ that corresponds to the lattice spacing of the (202) planes of . The normal to such planes forms an angle of 50∘ with the [004] direction and 10∘ with the [302] direction. Therefore, 2 peaks (at =90∘ and 270∘ from the [010] direction) are expected to appear when rotating the sample with respect to the film normal, for = 50∘ and 10∘. In Fig. 2d, six peaks for each value of appear, indicating that both orientations exist and each of them contains three domains (see the next section). Moreover, we also observe six peaks at =70∘, corresponding to the (-103) planes, with a d-spacing close to that of the (202) planes, forming a 70∘ angle with the (302) planes.
The local structure of the films was further analysed by Transmission Electron Microscopy (TEM) (Fig. 3). High angle annular dark field scanning TEM (HAADF-STEM) and corresponding energy dispersive spectroscopy (EDS) analysis revealed the presence of a 10 nm layer with the perovskite structure between the substrate and the film, arising out of a chemical reaction between the high energy Ca2+ ions in the plasma and the substrate surface (see Supplementary Note 1). The layer is (010) oriented, and fully relaxed by means of dislocations, with 6 planes of the films corresponding to 5 planes of (inset of Fig. 3c).
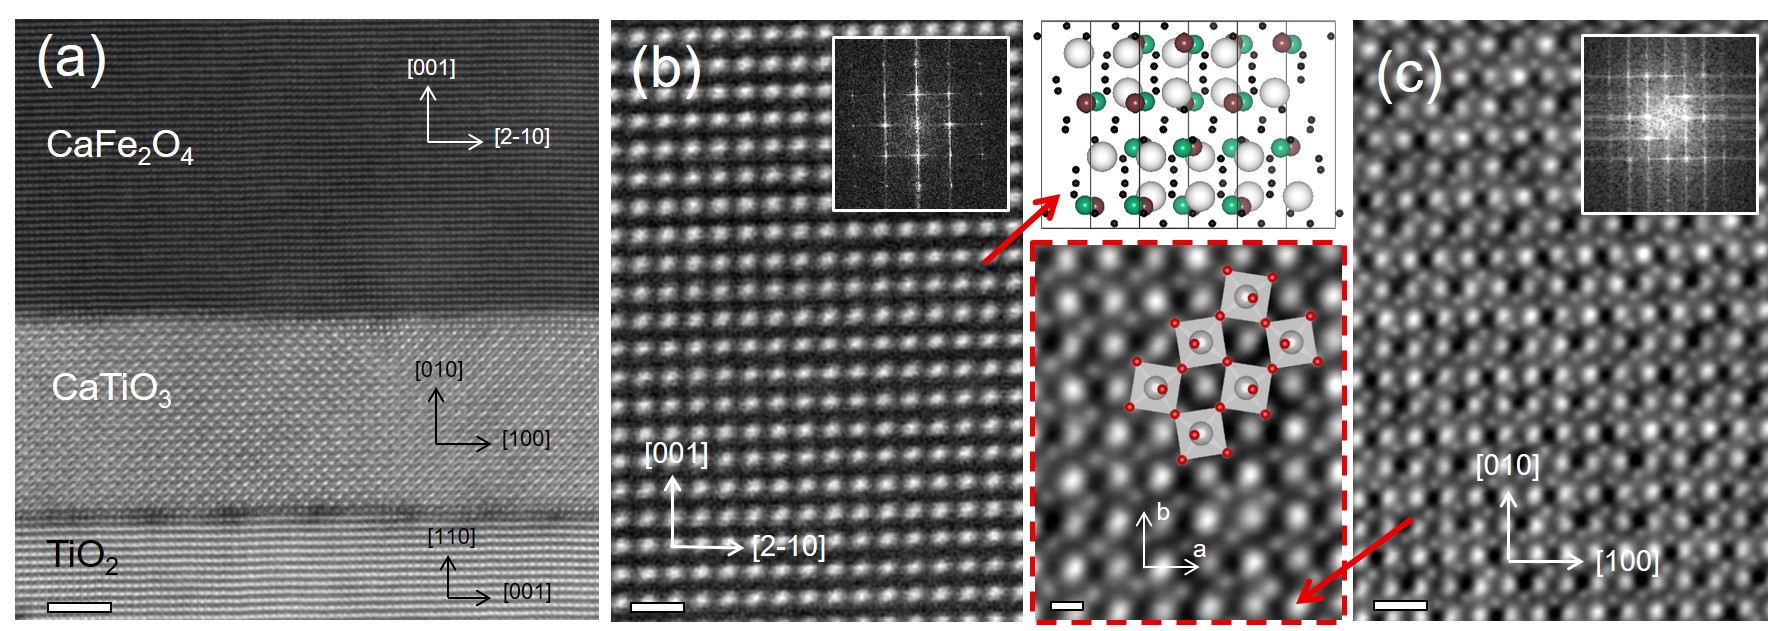
HAADF-STEM image of the layer is shown in Fig. 3b. The square-like pattern corresponds to the projection from the [120] zone axis of a crystallite with (004) out-of-plane orientation. The in-plane lattice parameter of d=2.53-1 corresponds to the (210) d-spacing. This indicates that, in the crystal imaged here, the [010] direction is tilted with respect to the to substrate [1-10] by an angle of approximately 55∘. This is consistent with the domain structure observed by means of Atomic Force Microscopy (AFM) and discussed in the next section.
The oxygen column imaging was further performed through differential phase contrast (DPC) STEM. The integrated DPC-STEM image on the layer (Fig. 3c and corresponding inset) clearly reveals a-a-c+ oxygen octahedral tilt pattern, corresponding to orthorhombic Pnma symmetry. Furthermore, the layer also exhibits 178∘ ferroelastic domain boundaries, reminiscent of bulk [24] (for more details see Supplementary Note 3).
Domain Structure
The thin films prepared in this study display a distinctive domain structure, as clearly seen in the images collected by means of Atomic Force Microscopy (AFM). Each domain is composed of needle-like crystallites with the long axis parallel to the [010] direction. Three specific crystallographic orientations of the domains are found as shown in Fig. 4a: 1- with the [010] parallel to the substrate [1-10], 2 - forming a 55∘ angle with 1 and 3 -forming a -55∘ angle with 1. Consistent results are obtained from X-Ray pole figure measurements. Fig. 4b shows the data collected at 2=33.65∘, that corresponds to the spacing of (302) and (004) planes (first film peak in the 2theta-omega scan of Fig. 2a). Here, for a single domain sample, two peaks are expected to appear at =60∘ and =90∘, 270∘ from the [010] direction. However, together with these, we observe 4 more peaks at =55∘, 125∘, 235∘ and 305∘, which indicate the presence of 3 domains. Finally, the same domain structure emerges when studying the films by means of Electron Backscattered Diffraction (EBSD) in a scanning electron microscope (SEM), which allows to determine the crystallites orientation (see Supplementary Note 4).
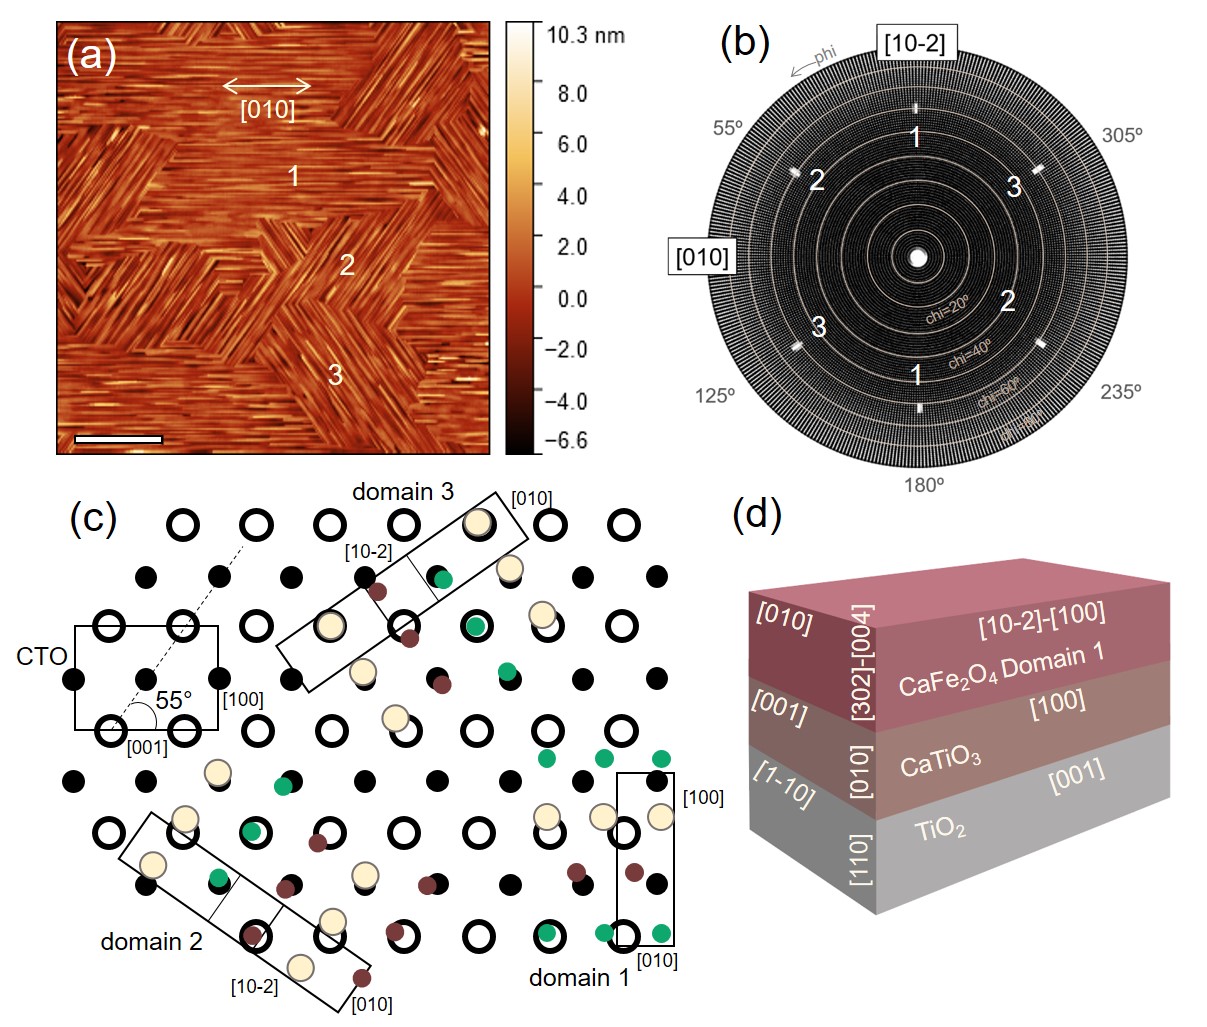
To explain the formation of 55∘ domains in the above mentioned directions, we put forward a model based on optimum structural matching between the crystal lattice of and that of the underlying layer. We notice that 55∘ is the angle between the [001] and [101] in-plane directions. The arrangement of the atoms in the (302) and (004) planes of consists of similarly spaced rows of cations that run parallel to the [010] direction. In both cases, two rows alternate with one row. As Fig. 4c shows, the atoms belonging to the two layers overlap best when the cations rows of are either parallel to the [001] direction or at 55∘ from it. Because the growth of the films of this study follows an island-growth mode, islands with one of the 3 orientations start growing independently and later merge together yielding a rough film. The boundary between 2 adjacent domains is sharp with an herringbone pattern, whereas at the conjunction between 3 or more crystallites, vortex-like structures that can have triangular or diamond shape, are visible. A cartoon to better illustrate the complex epitaxial relation between film and substrate, comprehensive of intermediate layer, is shown in Fig. 4d.
Magnetic properties
After optimization of the growth process, we investigated the magnetic properties of thin films at both local and macro scales. The magnetization of the films is measured as a function of temperature using a SQUID magnetometer for different values of applied magnetic field (). The magnetic susceptibility () from 4 to 400 K in a 100 Oe field parallel to the magnetization direction (b-axis of ) is plotted in Fig. 5a. Here, a clear transition is observed at =188 K (determined by the onset of DC magnetization), where steeply increases in the field-cooled (FC) curve and decreases in the zero-field-cooled (ZFC) one.
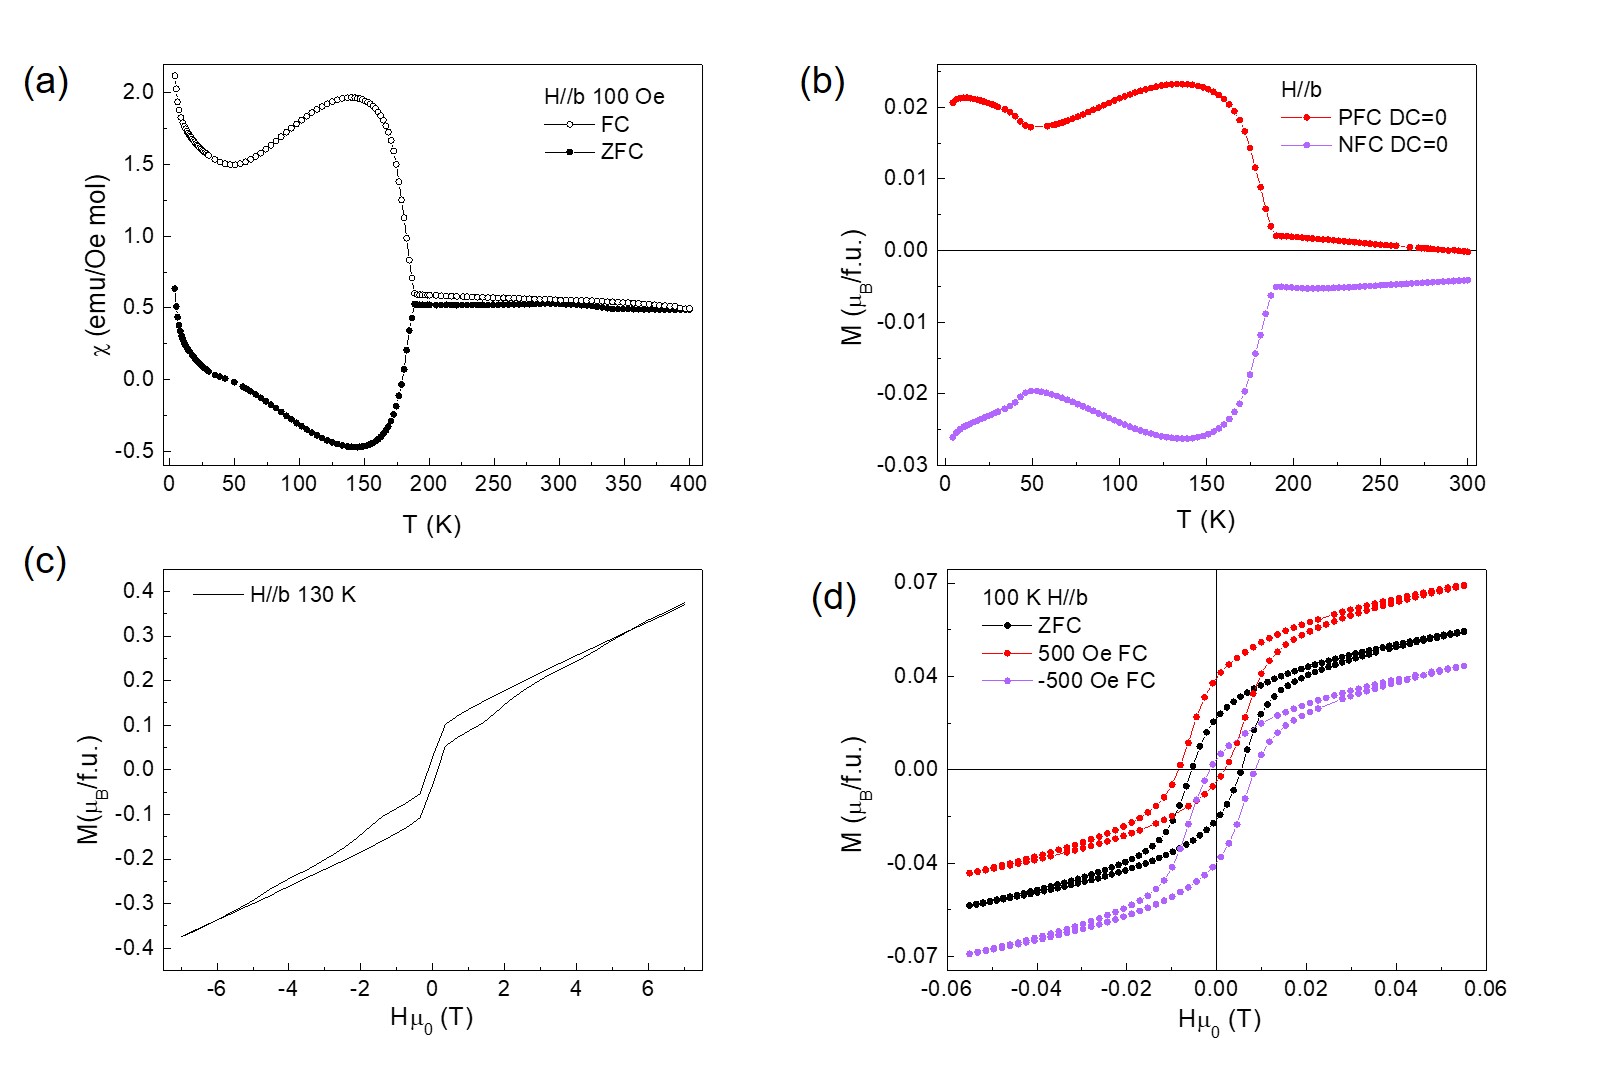
Upon decreasing temperature, reaches a maximum at =140 K after FC, while at the same temperature, reaches a minimum after ZFC. The noticeable splitting of the FC and ZFC data, also observed in our ceramic PLD target (see Supplementary Note 5), evidences the presence of a ferrimagnetic contribution added to the expected AF response. Moreover, in the films case, a small ZFC/FC splitting persists up to temperatures above , where the magnetization value is non-zero. This could be due to the remanent fields that are unavoidably present in the SQUID magnetometer, with different sign depending on the history of the previously applied field[25, 26].
In addition, differently from bulk, in the vs. plots (Fig. 5a) a paramagnetic (PM) tail can be found at below 30 K, that can probably be attributed to the layer at the interface between films and substrates (the latter being diamagnetic). Moreover, the magnetic susceptibility of thin films shows strong orientation dependence, being noticeably lower when the applied magnetic field is perpendicular to the b-axis (see Supplementary Figure 6a-b). This indicates strong magnetocrystalline anisotropy, which is expected for an Ising-like system as [14].
To further investigate the ferrimagnetic behaviour of , we measured the magnetization () as a function of temperature () in zero applied field. Fig. 5b shows the data collected after cooling in a field of 100 Oe parallel to the b-axis. The measured magnetic response indicates the presence of a spontaneous magnetization in films. On the other hand, here the low temperature tail observed in Fig. 5a is absent, confirming its paramagnetic nature. Next to the ordering temperature at =188 K, an anomaly at around 35 K and a broader feature above 200 K are also visible. Such features were also observed in previous studies and have been assigned to a slow spin dynamical process [18] and room-temperature spin interactions [14, 18], respectively.
The presence of an uncompensated magnetic moment is also supported by the hysteresis of the loops measured at various temperatures. In Fig. 5c the measurement at 130 K is shown, where the maximum hysteresis is observed (see Supplementary Figure 6c for the data at 30 and 175 K). Furthermore, when the sample is cooled down through in the presence of a magnetic field parallel to the b-axis, the loop is subjected to a vertical shift in the direction of the applied field. Such shift is absent if the field is applied perpendicular to the magnetization direction.
Measuring loops at low fields (up to 500 Oe) also reveals a small hysteresis that persists above , but no induced shift is observed under FC conditions (see Supplementary Figure 6d).
In order to further characterize the magnetic structure of films, investigate the oxidation state of and rule out the possibility of contamination with different -containing phases or oxides, we also performed Mössbauer Spectrometry in electron conversion mode (CEMS) (Fig. 6). The room-temperature CEMS spectrum (Fig. 6a) exhibits a sharp paramagnetic doublet without any trace of magnetic parasitic phases containing . Therefore, we can exclude contamination by iron oxides or other calcium ferrite phases with higher , such as brownmillerite [27] or [28, 29]. A high resolution CEMS spectrum recorded at RT in a narrow velocity scale is reported in Fig. 6b. This spectrum shows well-defined lines and was fitted with two paramagnetic quadrupolar doublets corresponding to the two inequivalent sites and , as expected for a pure phase[30, 11, 31, 32, 33, 34]. Both components have almost equal spectral area and linewidths (full width at half maximum 0.24 mm s-1). The isomer shift values are also similar (=0.3680.001 mm s-1), but the quadrupole splitting ( ) is different, with values of 0.3130.001 mm s-1 and 0.7430.001 mm s-1 for and , respectively.
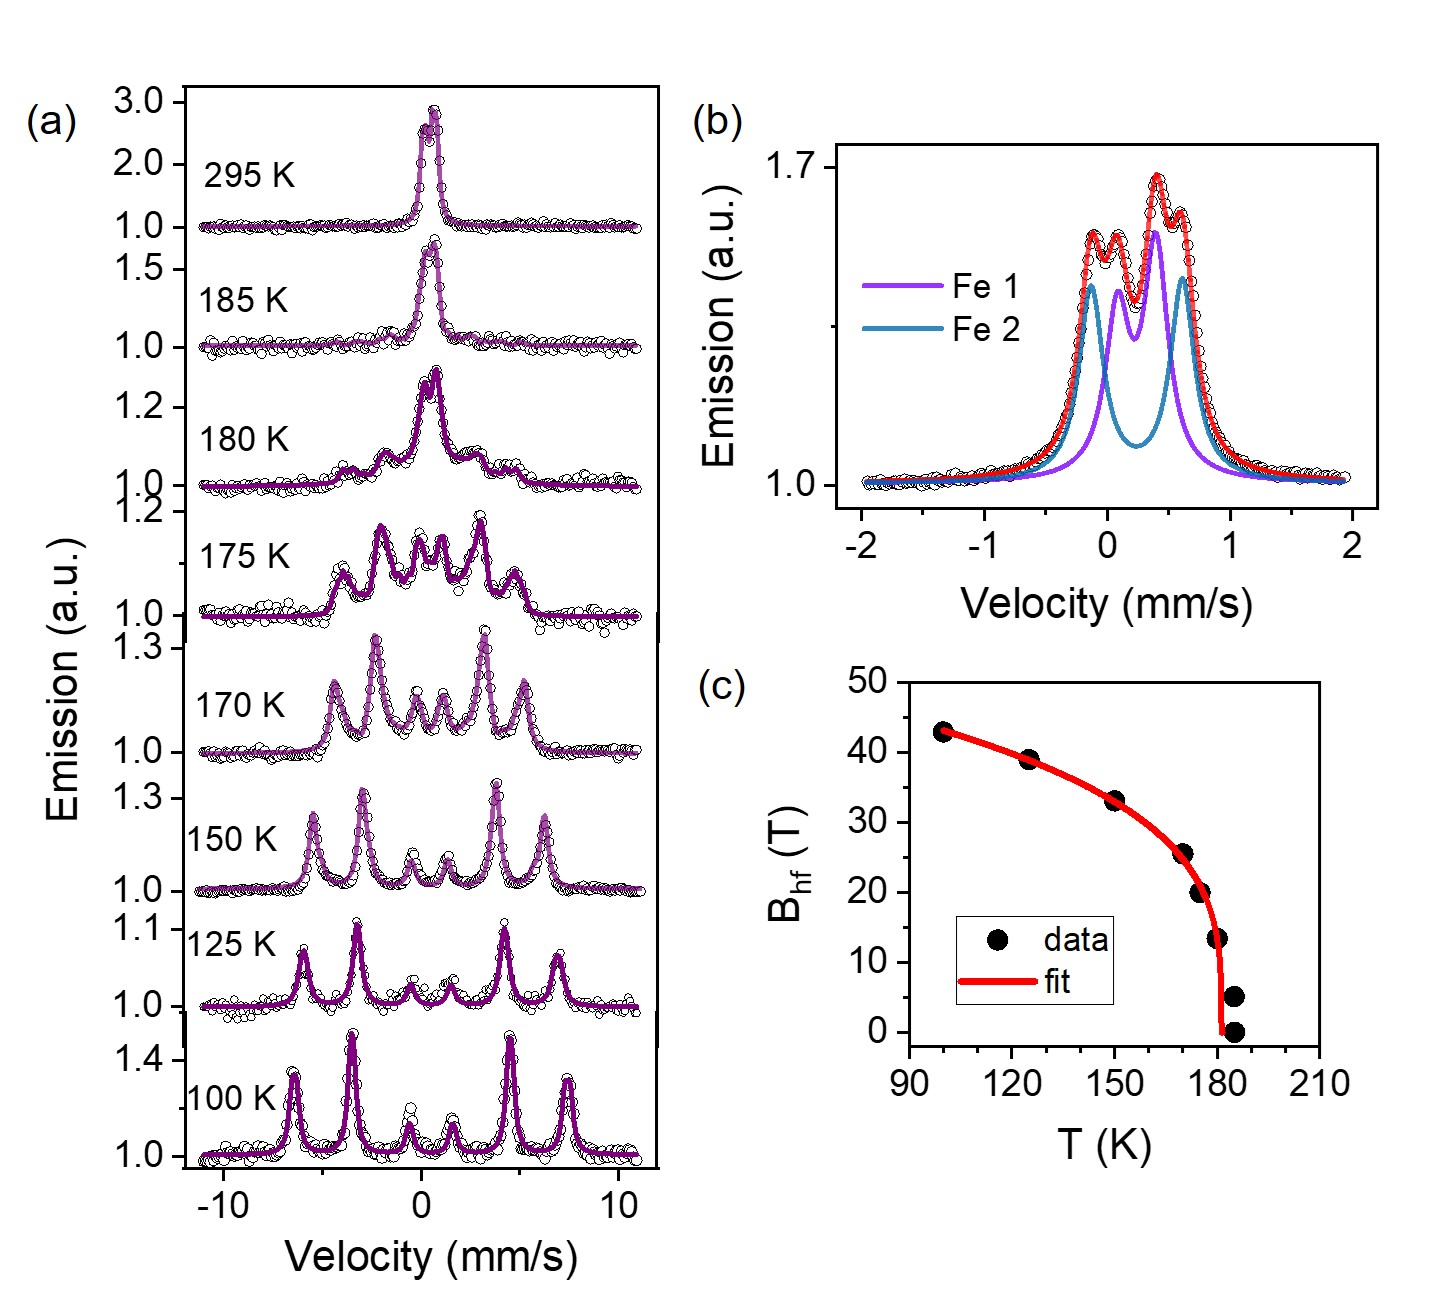
The isomer shift values are typical of ions, and the absence of signal belonging to suggests low oxygen vacancy content in the film. An asymmetry of the line intensity of the doublet, different for each site, is clearly evidenced. Such asymmetry, in case of single crystal and isotropic Lamb-Mössbauer factor, is due to a preferred orientation of the symmetry axis of the electric field gradient (EFG) at the nucleus. If the principal axis of the EFG makes an angle with the incident -beam direction, the line intensity ratio of the quadrupolar doublet is given by , with values ranging from 3 for =0 to 0.6 for =90∘. Here the fit of the spectrum yields = 41∘ and 53∘ for and , respectively.
In Fig. 6a also some selected CEMS spectra at temperatures below room-temperature are reported. The CEMS spectra below 185 K clearly show the onset of long range magnetic order by the appearance of a magnetic sextet due to nuclear Zeeman splitting. For each temperature, the line intensity ratios are close to 3:4:1:1:4:3 for the magnetic sextet, evidencing in plane orientation of the spins. The temperature dependence of the mean magnetic hyperfine field deduced from the fit can be approximated using a power law , where is the critical exponent or the AF order parameter (the staggered sub-unit cell magnetization). A reasonably good fit (Fig. 6c) leads to = (54.84.0) T, = 0.280.05, and = (181.21.6) K. The value of the critical exponent is consistent with the = 1/3 value expected for a 3D Ising antiferromagnet. The Néel temperature obtained from the fit is also consistent with the transition temperature deduced from the SQUID measurements.
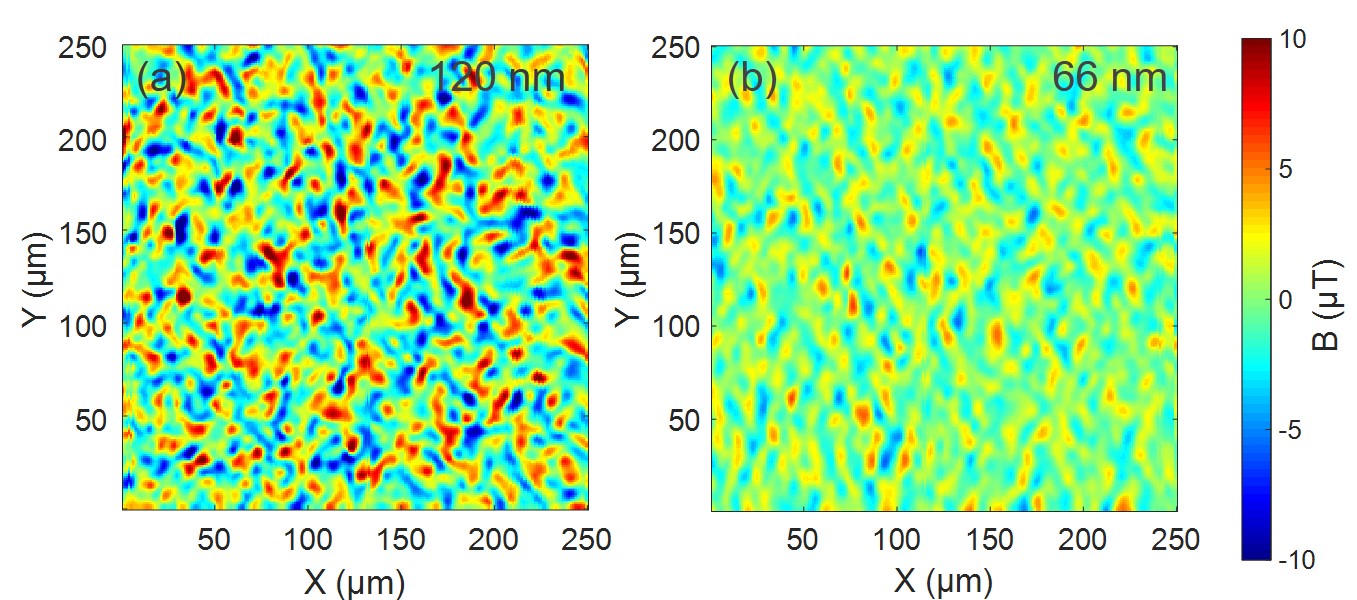
The local magnetic response of the films was also studied by means of scanning SQUID microscopy. Scans collected at 4 K (Fig. 7) indicate clear magnetic activity. The observed patterns resemble those of a weak ferromagnet [35], but no clear structure in the signal is visible. This is due to the spatial resolution of the scanning SQUID setup (approximately 5 m) that causes averaging over multiple domains. Different sample thicknesses give rise to similar magnetic patterns but with different intensities: for a 120 nm film (Fig. 7a) the magnetic field measured is 7-8 T, while when the thickness is reduced to 66 nm the field is approximately halved (Fig. 7b). These values are well above the scanning SQUID sensitivity of approximately 50 nT. This confirms that the signal originates from the full film, and is not just limited to the surface.
In addition, in order to directly compare the magnetic and topographic features of the samples, we also performed magnetic force microscopy (MFM) experiments, that yields a spatial resolution of about 100 nm (Fig. 8). Topography and MFM phase were recorded at various temperatures between 300 and 12 K, with a lift of either 30 nm and 50 nm from the sample surface.
The first images, collected from room-temperature down to 200 K (see Fig. 8a-b-c) do not show any magnetic response. Here, the low contrast observed in Fig. 8b can be attributed to simple cross-talk with the film topography, as an analogous signal is observed when the experiment is repeated with a non-magnetic tip, as shown in Supplementary Figure 7a-b.
Only when the temperature is lowered below the material’s of 185 K a sharp contrast in the phase signal appears. Fig. 8d-e-f show scans collected at 100 K. In these images we observe signatures of magnetic dipoles (alternating red and blue contrast), several of which seem to correspond to some of the edges of the needle-like crystals. Such signal increases in intensity and sharpness at lower scan lifts.
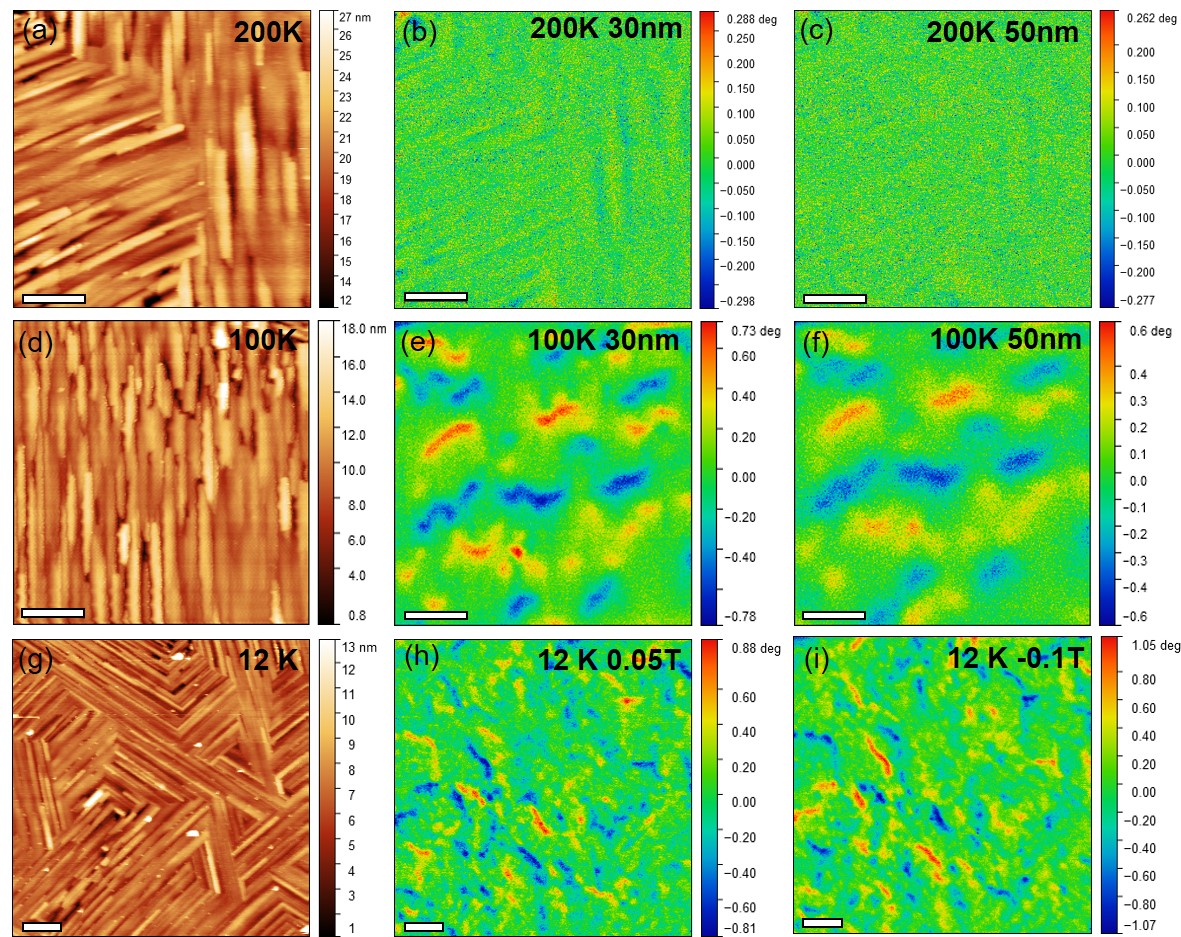
Fig. 8g-h-i also show MFM images collected at 12 K in an applied magnetic field. Here, the color contrast in the second-pass phase is inverted upon reversing the magnetic field sign, from 0.05 T in 8h to -0.1 T in 8i (the difference between the two images can be seen in Supplementary Figure 7c). This indicates that the interaction between the tip and the sample goes from ferromagnetic to antiferromagnetic, and vice versa, upon reversing the tip magnetization.
These results are in good agreement with the expected scenario, in which the spins align along the [010] direction that lies in the plane of the films. Such direction corresponds to the long axis of the needle-like domains, thus the magnetic field lines are only picked-up in MFM experiments (with sensitivity limited to out-of-plane magnetization) at the end of the crystallites, where the magnetic field lines bend in the out-of-plane direction. These results are also consistent with the SQUID measurements, showing that thin films do not display the pure AF behaviour.
Discussion
Despite the single out-of-plane peak observed by XRD in the two-theta-omega scans, in-depth characterization reveals the coexistence of two crystal orientations with identical lattice spacing, namely (004) and (302). Distinguishing between such orientations is complicated by the similar arrangement of and atoms in these two families of crystal planes. The similarity between these two orientations combined with the high frequency deposition, causes islands of both to nucleate at the surface and merge in an homogeneous film as thickness increases. TEM characterization also reveals that the epitaxial growth of films is achieved through the formation of a perovskite layer at the interface with the substrate. The presence of this layer explains the domain structure of the films: oriented needle-like crystallites connected together by herringbone walls. We explain this in terms of optimum matching between the cation positions in the and lattices, which is achieved when the film [010] direction is parallel to the [001] (which is in turn epitaxial with the substrate [1-10]) or at 55∘ from it (see Fig. 4). The presence of these domain variants gives rise to vortex-like structures. Interestingly, the magnetic easy axes of the two crystal orientations coincide, as well as the direction of the net magnetic moment at the antiphase boundaries [16].
As expected for an Ising-like system, the magnetic response of films studied by means of SQUID magnetometry, displays a strong orientation dependence, being higher when the magnetic field is parallel to the b-axis of the crystals (comparison between Fig. 5a-b and Supplementary Figure 6a-b). The behaviour of the magnetic susceptibility as a function of temperature (Fig. 5a) is characterized by a single magnetic transition, defined as the onset of DC magnetization, which occurs at = 188 K, and a maximum around T=140 K. In addition, fitting the hyperfine field thermal variation from the Mössbauer data gives rise to a 185 K as the only detectable transition. A single ground state (A phase) for the undoped material is in agreement with the phase diagram by Corliss et al.[19] and a recent report by Songvilay et al.[22].
Another distinctive feature of the vs plots is the splitting of the FC and ZFC curves below , with the latter having opposite sign for low applied magnetic fields. This indicates the presence of an irreversible contribution to the magnetization of , which can not be switched below a critical field. Moreover, the presence of a spontaneous magnetization is supported by hysteresis (Fig. 5c) in the loops and their vertical shift, the latter appearing when the sample is cooled in a magnetic field (Fig. 5d). Vertical shifts in the loops under field-cooling have been observed before in uncompensated antiferromagnets[36] or inhomogeneous systems characterized by ferrimagnetic moments embedded in a AF matrix. The local magnetic response of films, studied by means of low temperature MFM (Fig. 8), is also consistent with the presence of a magnetic moment: the MFM magnetic signal, which is only sensitive to out-of-plane magnetization, appears below 185 K, and is often localized at the borders of the domains or needle bunches. The observed contrast is opposite (field in- and field out- of the plane) at both sides of the needles, in good agreement with the expected behaviour of magnetic moment aligned along the needle long axis direction, which produces magnetic field lines that bend in the out-of-plane direction when the needles end.
Thus, the overall magnetic response of thin films is more consistent with an uncompensated AF behaviour than pure AF behaviour. In oxygen-deficient polycrystalline samples, Das and coworkers [13] detect the formation of ferrimagnetic clusters induced by oxygen vacancies. These accumulate at the domain boundaries and, by requirement of charge neutrality, introduce a proportional amount of which in turn causes incomplete cancellation of the magnetic moments. Oxygen vacancies are also common in oxide thin films grown by means of PLD. Thus, it is possible that oxygen vacancies are also present in our films, despite having annealed them in 200 mbar oxygen atmosphere after the growth. However, the absence of signature in Mössbauer Spectrometry experiments (Fig. 6) suggests that the spontaneous magnetization of our samples does not originate from oxygen-vacancies induced ferrimagnetic clusters. More consistently with our data, the net magnetization in can be caused by the formation of “orphan spins” at the boundaries between different magnetic [16]. This scenario seems supported by the fact that the largest hysteresis is observed at 130 K (Fig. 5c), where the coexistence of A and B phases is expected to be maximum.
Another possibility is that the net magnetic moment arises from locally uncompensated moments at the boundaries between domains. This would be in line with the scenario recently suggested by Songvilay et al.[22], which does not require the coexistence of two phases with long-range order in a wide temperature range. The presence of crystallographic domains, as those detected in our films, which provide “fixed” magnetic domain walls below the transition temperature, could also play an important role in this scenario. The behavior of the order parameter, extrapolated from Mössbauer Spectrometry data in our samples reveals critical behavior at the Nèel transition of the A phase: this supports the existence of strong fluctuations of the staggered magnetization at TN, decaying away from the transition, interestingly similar to the behaviour of the B-phase order parameter in refs.[[19, 22]]. At the same time, the critical behaviour of the transition contradicts the hypothesis of nucleation of the A phase at the boundaries of the B phase as the transition mechanism, as that would give rise to a discontinuous phase transition.
Previous studies, reported a broad feature in the vs plot above [14, 18], that can be fitted using the Bonner-Fisher model for linear magnetic chains with anisotropic coupling[37]. This might indicate the existence of short-range and low-dimensional AF exchange, before reaching three-dimensional long-range ordering. However, the absence of hyperfine magnetic splitting at room-temperature in Mössbauer Spectrometry experiments contradicts the hypothesis of room-temperature interaction between spins in the samples of this study.
To conclude, thin films have been grown for the first time on (110) substrates by means of PLD with thickness in the order of 100 nm. The films form crystal domains that consist of needle-like crystals with the long axis along the magnetic easy axis, displaying a clear epitaxial relation with the substrate. The magnetic properties of the thin films studied by means of SQUID magnetometry, Mössbauer spectrometry and low-temperature MFM are consistent and reveal an ordering temperature of about 185 K, concomitant with the presence of a net magnetic moment along the b-axis. The vertical shifts of the loops depending on the field-cooling conditions, evidence that the observed net magnetic moment is not standard ferrimagnetic behaviour. The results are consistent with an antiferromagnet with uncompensated moments but the role played by the crystallographic and/or magnetic domains needs to be clarified. A single A-phase ground state is detected and the critical nature of the transition is revealed with a exponent consistent with the 3D Ising antiferromagnet universality class, precluding nucleation and growth as a plausible mechanism for the transition.
Outlook: Further characterization of the magnetic structure of films is needed to completely explain our results. Important questions are still open regarding the stability and coexistence between the A and B magnetic phases observed in bulk samples, the role of critical fluctuations in the stabilization of the B phase and the influence of epitaxial strain on the magnetic phase diagram. Eventually, our goal is to control the relative stability of the A and B phases, in order to obtain a highly responsive system at the boundary between multiple spatial modulations. We believe that thin films represent an interesting prospective system for the study of “spatial chaos”[38] arising from competing interactions. In such systems, the presence of multiple accessible states close in energy, leads to enhanced susceptibility and adaptability, that are crucial for applications in adaptable electronics, such as neuromorphic computing. Finally, the polar nature of the domain boundaries of the layer provides an opportunity to explore the multiferroic properties of these / self-organized heterostructures.
Methods
Sample growth
The films of this study have been deposited by PLD using a KrF (=248 nm) excimer laser. The target was a home-made ceramic pellet of , prepared by solid state synthesis [39, 40, 41] from (3N Sigma Aldrich) and (99.998 Alfa Aesar) precursors. The powders were mixed and milled in an agate ball mill at 200 rpm for 2 hours and pressed into a 20 mm diameter pellet with 9.5 tons. Calcination and sintering were executed at 600 and 1200 respectively. The crystal structure was determined to be single phase via XRD using a Panalytical X’Pert Pro diffractometer in Bragg Brentano geometry. Prior to growth, single crystal (110) substrates (CrysTec Gmbh) were treated to reveal the step edges [42, 43] by etching for 1 min with buffered oxide etch (BHF) followed by 1 hour annealing at 900 under a constant oxygen flux of 17 l/h.
The optimal growth parameters were determined to be as follows. The laser was focused on the target positioned at 50 mm from the substrate with a spot size of 1.8 mm2 . The laser fluence and frequency were 2.8 J/cm2 and 10 Hz respectively. The substrate temperature during growth was 850 and the partial oxygen pressure () in the chamber 0.2 mbar. After deposition the samples were cooled with a rate of -1 ∘/min in =200 mbar. The number of pulses was varied in a range from 6000 to 15000 to obtain different film thicknesses. The film surface was monitored during growth via in-situ RHEED.
Structural characterization
Characterization of the films surface was performed using AFM (Bruker Dimension XR microscope) and SEM (FEI Nova NanoSEM 650). XRD measurements were done with a laboratory diffractometer (Panalytical X’Pert MRD Cradle), using Cu K radiation (1.540598 ). TEM experiments were conducted on a Cs corrected Themis Z (Thermofischer inc.) microscope. Electron beam was operated at a high tension of 300 kV, and STEM imaging was performed at a beam convergence angle of 23.5 m rad. HAADF-STEM images were acquired with an annular detector in the collection range of 65-200 mrad. DPC images were obtained and analysed using segmented detectors. EDS spectra were collected in the ChemiSTEM mode with 4 symmetric detectors along the optical axis.
Mössbauer Spectrometry
The samples used for Mössbauer Spectrometry were grown from a 57 enriched target with the same parameters as above. The target was synthesized as described before, but adding to the standard precursors of the enriched oxide, prepared by annealing of 57 powders at 800 for 2 hours in a constant oxygen flow of 18 l/h [44]. CEMS measurements were performed in normal incidence using a home-made gas flow () proportional counter [45]. For the measurements at low temperatures, the counter was mounted inside a closed-cycle He cryostat [46]. The source was in Rh matrix of about 1.85 GBq activity, mounted in a velocity transducer operating in constant acceleration mode. The spectra were least squares fitted using the histogram method and assuming Lorentzian lines. Isomer shifts are given with respect to at 300 K.
Magnetometry and data analysis
The magnetic properties were studied by means of SQUID magnetometry (Quantum Design MPMS-XL 7) with RSO option in a range of temperature varying from 5 K to 400 K and at fields ranging from 100 Oe up to 7 T. The field was applied either parallel or perpendicular to the magnetization direction of the structural domain with [010] parallel to the substrate [1-10] direction. The long moment values obtained from the SQUID-MPMS has been analyzed using Origin software as follows. First the experimental data has been subtracted of the signal of a clean substrate, measured in the same conditions as the sample. This introduces a small error due to the fact that in the data used as background reference does not contain the signal of the intermediate layer formed during growth. Then, the experimental data (in emu) has been divided by the magnetic field (in Oe) and the number of moles to yield the magnetic susceptibility of in emu/mol Oe (for the loops, the magnetization has been further converted into units of Bohr Magnetrons per formula unit). This step also introduces an error in our estimation, due to the imprecise estimation of the film thickness via TEM, which is necessary to normalized for the amount of material. Therefore, in this study we do not attempt to provide a precise quantitative analysis of the magnetic response.
Scanning SQUID microscopy
The experiments were performed with a scanning SQUID microscope [47] with a spatial resolution of approximately 5 m [35] and field resolution of approximately 50 nT. The samples were cooled and measured in zero background field at 4 K. Various sets of 12 scans of 250 m x 250 m size, with 250 m spacing in between (total covered area about 1.75 mm x 1.75 mm), were collected in different areas to test for homogeneity of the samples.
Magnetic force microscopy
The MFM experiments presented in this study are performed with a customized Attocube scanning probe microscope inserted in a Quantum Design Physical Property Measurement System (PPMS). Multiple scans were collected at different temperatures upon cooling the sample from 300 K to 12 K. In some cases, a magnetic field ranging from -0.1 to 0.1 T was also applied perpendicular to the film surface. The sample surface was scanned using commercial (Nanoworld) coated tips that were magnetized prior to use. The images were collected in dual-pass tapping mode, with a second scan lift of 30 or 50 nm. The data were then processed with the open source software Gwyddion.
Data availability
The datasets generated during and/or analysed during the current study are available from the corresponding author on reasonable request.
References
- [1] Broese van Groenou, A., Bongers, P. F. & Stuyts, A. L. Magnetism, microstructure and crystal chemistry of spinel ferrites Materials Science and Engineering 3, 317–392 (1969).
- [2] Decker, B. F. & Kasper, J. S. The structure of calcium ferrite. Acta Crystallographica 10, 332–337 (1957).
- [3] Galuskina, I. O. et al. Harmunite CaFe2O4 : a new mineral from the Jabel Harmun, West Bank, Palestinian Autonomy, Israel. American Mineralogist 99, 965–975 (2014).
- [4] Lal, G. et al. Rietveld refinement, Raman, optical, dielectric, Mössbauer and magnetic characterization of superparamagnetic fcc-CaFe2O4 nanoparticles. Ceramics International 45, 5837–5847 (2019).
- [5] Khanna, L. & Verma, N. Size-dependent magnetic properties of calcium ferrite nanoparticles. Journal of Magnetism and Magnetic Materials 336, 1–7 (2013).
- [6] Borse, P. H., Kim, J. Y. & Lee, J. S. Ti-dopant-enhanced Photocatalytic Activity of a CaFe2O4/MgFe2O4 Bulk Heterojunction under Visible-light Irradiation. Journal of the Korean Physical Society 61, 73–79 (2012).
- [7] Cao, J. et al. Photoelectrochemical properties of nanomultiple CaFe2O4/ZnFe2O4pn junction photoelectrodes. Langmuir 29, 3116–3124 (2013).
- [8] Ida, S. et al. Preparation of p-type CaFe2O4 photocathodes for producing hydrogen from water. Journal of the American Chemical Society 132, 17343–17345 (2010).
- [9] Kim, H. G. et al. Fabrication of CaFe2O4/MgFe2O4 bulk heterojunction for enhanced visible light photocatalysis. Chemical Communications 39, 5889–5891 (2009).
- [10] Watanabe, H. et al. Neutron diffraction study of CaFe2O4. Journal of the Physical Society of Japan 22, 939–939 (1967).
- [11] Yamamoto, H., Okada, T., Watanabe, H. & Fukase, M. Mössbauer effect study of spin relaxation in CaFe2O4. Journal of the Physical Society of Japan 24, 275–279 (1968).
- [12] Merlini, M. et al. Fe3+ spin transition in CaFe2O4 at high pressure. American Mineralogist 95, 200–203 (2010).
- [13] Das, R., Karna, S., Lai, Y.-C. & Chou, F.-C. Self-adjusted traveling solvent floating zone growth of single crystal CaFe2O4. Crystal Growth & Design 16, 499–503 (2016).
- [14] Gandhi, A. C., Das, R. & Chou, F.-C. Magnetocrystalline two-fold symmetry in CaFe2O4 single crystal. Journal of Physics: Condensed Matter 29, 175802 (2017).
- [15] Stock, C. et al. Solitary magnons in the S=5/2 antiferromagnet CaFe2O4. Physical Review Letters 117, 017201 (2016).
- [16] Stock, C. et al. Orphan spins in the S=5/2 antiferromagnet CaFe2O4. Physical Review Letters 119, 257204 (2017).
- [17] Nishiyama, N. et al. Highly oriented epitaxial CaFe2O4 thin films on TiO2 substrates grown by pulsed-laser deposition. Thin Solid Films 638, 406–409 (2017).
- [18] Das, R., Debnath, S., Rao, G. N., Narasimhan, S. & Chou, F. C. Ferrimagnetic cluster formation due to oxygen vacancies in CaFe2O4-δ. Physical Review B 98, 144404 (2018).
- [19] Corliss, L. M., Hastings, J. M. & Kunnmann, W. Magnetic phase equilibrium in chromium-substituted calcium ferrite. Physical Review 160, 408–413 (1967).
- [20] Apostolov, A. et al. Investigation of the magnetic properties of the Fe2-xCrxCaO4 system. Czech. J. Phys. B 34, 46–52 (1984).
- [21] Lobanovsky, L. S. & Trukhanov, S. V. Magnetic properties of superstoichiometric CaFe2O4+δ obtained by thermobaric synthesis. Crystallography Reports 56, 482–485 (2011).
- [22] Songvilay, M. et al. Disorder and magnetic excitations in CaCrxFe2-xO4 (x=0,0.5). Physical Review B 101, 014407 (2020).
- [23] Hasegawa, S. Reflection high-energy electron diffraction. In Kaufmann, E. N. (ed.) Characterization of Materials, 1925–1938 (Wiley Online Library, 2012).
- [24] Van Aert, S. et al. Direct Observation of ferrielectricity at ferroelastic Domain Boundaries in CaTiO3 by electron microscopy. Advanced Materials 24, 523–527 (2012).
- [25] Buchner, M., Höfler, K., Henne, B., Ney, V. & Ney, A. Tutorial: Basic principles, limits of detection, and pitfalls of highly sensitive SQUID magnetometry for nanomagnetism and spintronics. Journal of Applied Physics 124, 161101 (2018).
- [26] Kumar, N. & Sundaresan, A. On the observation of negative magnetization under zero-field-cooled process. Solid State Communications 150, 1162–1164 (2010).
- [27] Kagomiya, I. et al. Weak ferromagntic ordering in brownmillerite Ca2Fe2O5 and its effect on electric gradient. Phys. Chem. Chem. Phys 19, 31194 (2017).
- [28] Hong, K. H., Arevalo-Lopez, A. M., Cumby, J., Ritter, C. & Attfield, J. P. Long range electronic phase separation in CaFe3O5. Nature Communications 9, 2975 (2018).
- [29] Cassidy, S. J., Orlandi, F., Manuel, P. & Clarke, S. J. Single phase charge ordered stoichiometric CaFe3O5 with commensurate and incommensurate trimeron ordering. Nature Communications 10, 1–10 (2019).
- [30] Hudson, A. & Whitfield, H. Mössbauer effect studies on calcium ferrites. Part I. Temperatures above the Néel point. Journal of the Chemical Society A: Inorganic, Physical, Theoretical 376–378 (1967).
- [31] Hirabayashi, D. et al. Mössbauer characterization of calcium-ferrite oxides prepared by calcining Fe2O3 and CaO. Hyperfine Interactions 167, 809–813 (2006).
- [32] Tsipis, E. et al. Oxygen ionic conductivity, Mössbauer spectra and thermal expansion of CaFe2O. Solid State Ionics 178, 1428–1436 (2007).
- [33] Kharton, V. V. et al. Mixed conductivity and stability of CaFe2O4-δ. Journal of The Electrochemical Society 155, P13–P20 (2008).
- [34] Berchmans, L. J. et al. A rapid one-step mechanosynthesis and characterization of nanocrystalline CaFe2O4 with orthorhombic structure. Journal of Alloys and Compounds 500, 68–73 (2010).
- [35] Reith, P. & Hilgenkamp, H. Analysing magnetism using scanning SQUID microscopy. Review of Scientific Instruments 88, 123706 (2017).
- [36] Henne, B., Ney, V., De Souza, M. & Ney, A. Exchange-bias-like effect of an uncompensated antiferromagnet. Physical Review B 93, 144406 (2016).
- [37] Bonner, J. C. & Fisher, M. E. Linear magnetic chains with anisotropic coupling. Physical Review 135, A640 (1964).
- [38] Jensen, M. & Bak, P. Spatial Chaos. Physica Scripta T9, 64–69 (1985).
- [39] Phillips, B. & Muan, A. Phase equilibria in the system CaO-iron oxide in air and at 1 atm. O2 pressure. Journal of the American Ceramic Society 41, 445–454 (1958).
- [40] Yin, J., Lv, X., Xiang, S., Bai, C. & Yu, B. Influence of CaO Source on the formation behavior of calcium ferrite in solid state. ISIJ International 53, 1571–1579 (2013).
- [41] Rao, C. N. R. Chemical synthesis of solid inorganic materials. Materials Science and Engineering: B 18, 1–21 (1993).
- [42] Yamamoto, Y., Nakajima, K., Ohsawa, T., Matsumoto, Y. & Koinuma, H. Preparation of atomically smooth TiO2 single crystal surfaces and their photochemical property. Japanese Journal of Applied Physics 44, L511–L514 (2005).
- [43] Ahmed, M. H. et al. Wet chemically prepared rutile TiO2 (110) and TiO2 (011): substrate preparation for surface studies under non-UHV conditions. Surface Science 630, 41–45 (2014).
- [44] Lysenko, E. N. et al. The oxidation kinetics study of ultrafine iron powders by thermogravimetric analysis. Journal of Thermal Analysis and Calorimetry 115, 1447–1452 (2014).
- [45] Juraszek, J., Zivotsky, O., Chiron, H., Vaudolon, C. & Teillet, J. A setup combining magneto-optical Kerr effect and conversion electron Mössbauer spectrometry for analysis of the near-surface magnetic properties of thin films. Review of Scientific Instruments 80, 043905 (2009).
- [46] Sougrati, M. T., Jean, M., Jouen, S., Vaudolon, C. & Hannoyer, B. Gas counter for low temperature conversion electron Mössbauer spectroscopy experiments. Hyperfine Interactions 211, 83–97 (2012).
- [47] Kirtley, J. et al. High-resolution scanning squid microscope. Applied Physics Letters 66, 1138–1140 (1995).
Acknowledgements
The authors are grateful to Maxim Mostovoy for introducing them to this interesting material and to Maria Azhar and Maxim Mostovoy for their insight on the interpretation of the magnetic data. We acknowledge useful scientific discussions with Urs Staub and Hiroki Ueda and Kohei Yoshimatsu. We also gratefully acknowledge the technical support of Jacob Baas, ir. Henk Bonder and ir. dr. Václav Ocelík in performing the experiments of this study. Financial support by the Groningen Cognitive Systems and Materials Center (CogniGron) and the Ubbo Emmius Foundation of the University of Groningen is gratefully acknowledged. P.N. acknowledges the funding received from European Union’s Horizon 2020 research and innovation program under Marie Sklodowska-Curie grant agreement No: 794954 (Project name: FERHAZ) and J.J. acknowledges support from Region of Normandy and the European Regional Development Fund of Normandy (ERDF) through the MAGMA project.
Author contributions statement
B.N.conceived the project. S.D. designed the experiments, synthesized the samples, performed the basic structural and magnetic characterization and data analysis. P.N. performed the TEM experiments and analyzed the data. J.J. performed the Mössbauer Spectrometry experiments and analyzed the data. P.R performed the scanning SQUID microscopy experiments under the supervision of H.H. S.D., B.N. and P.N. discussed the results. S.D. wrote the manuscript which was reviewed by all the authors.
Competing interests
The authors declare no competing interests.