123 \volnumber1
I. Jankov, D. Ilic
Narrow lines correlations in an SDSS sample of type 1 quasars
Abstract
Investigation of quasar emission line properties and relationships between spectral parameters is important for understanding the physical mechanisms that originate inside different regions of the active galactic nuclei. In this paper, we investigate the optical spectral parameters of type 1 quasars taken from the Sloan Digital Sky Survey Data Release 7 Quasar Catalog (Shen et al., 2011). Spectral parameters, such are equivalent widths and full widths at half maximum of both narrow and broad lines are taken into account. We perform the analysis of correlation matrix and principal component analysis of our sample. We obtain that the narrow line Baldwin effect is significant enough and deserves further investigation. We provide the correlation coefficients and slope values for Baldwin effect in several narrow lines.
keywords:
galaxies: active–multivariate analysis: principal component analysis1 Introduction
Active galactic nuclei (AGN) or quasars are extremely bright objects with rapidly accreting supermassive black hole at their center. They exhibit a wide range of spectral characteristics, which can give us valuable information about the physical conditions in these extreme environments. Large surveys of quasars showed that there are some correlations between their spectral parameters. Most notable correlations are anti-correlation between [O III] and optical Fe II line strength, as well as the anti-correlation between full width at half maximum (FWHM) of broad H line and ratio of optical Fe II line and broad H line equivalent widths (). These correlations were investigated using principal component analysis (PCA) and represented in the parameter space known as Eigenvector 1 (see e.g. Sulentic et al., 2000b). In addition to the Eigenvector 1 correlations, the strength of some spectral lines appears to decrease with luminosity of the underlying continuum. This trend was first detected in C IV line and is known as the Baldwin effect (Baldwin, 1977).
There is distinction between the Baldwin effect for narrow and broad emission lines because these lines are associated with different regions of AGN with different geometrical and dynamical properties. In case of broad emission lines, it has been studied in great detail (see e.g Dietrich et al., 2002; Shields, 2007; Bian et al., 2012), but its physical origin is still a matter of debate (see e.g. Rakić et al., 2017). One possible explanation for Baldwin effect that is associated with broad emission lines, is that the continuum shape is luminosity-dependent, in a way that more luminous objects have softer UV/X-ray spectra and this results in reduced ionization and photoelectric heating in the broad line region (BLR) gas (e.g. Boroson & Green, 1992; Korista et al., 1998). The narrow line Baldwin effect is still not entirely understood (Shields, 2007), and has been studied by several authors in the past. For example, Kovačević et al. (2010) did a careful spectral measurement of a sample of 300 AGN and noticed a strong anti-correlation between the narrow H and [O III] lines with continuum luminosity, with the correlation coefficients of -0.36 and -0.43, respectively. The explanation of the effect could be due to different scale of narrow line region (NLR) compared to the BLR, or due to the extinction of the continuum luminosity by dust located between the BLR and NLR (e.g. Heard & Gaskell, 2016), or due to some other factors that also need to be taken into account (for more details see Boroson & Green, 1992; McIntosh et al., 1999; Croom et al., 2002; Dietrich et al., 2002; Netzer et al., 2004, 2006; Zhang et al., 2013; Shields, 2007).
The Sloan Digital Sky Survey (SDSS) quasars were previously investigated for the Baldwin effect in narrow lines by Zhang et al. (2013), who studied a large sample of broad-line (i.e. type 1), radio-quiet AGN taken from SDSS Data Release 4. They found that narrow lines show a similar Baldwin effect with slope value of approximately -0.2, which could be explained with the combination of continuum variation and a lognormal distribution of the luminosity. In addition they show that there is no evidence for a relationship between Baldwin effect slope and ionization potential of the narrow lines (Zhang et al., 2013). However, in their analysis they did not consider the host galaxy starlight contamination, which overestimates continuum luminosity, especially for low luminosity quasars (e.g. Bentz et al., 2006; Shen et al., 2011), which is resulting in steeper Baldwin effect slope.
In this paper, we report the results of our analysis based on the correlation matrices and PCA on a sample of type 1 quasars taken from the SDSS Data Release 7 (SDSS DR7) quasar catalog (Shen et al., 2011), with a special focus on the narrow line Baldwin effect, which was not investigated before in case of this catalog.
2 Data Reduction and Analysis
We use the measured spectral line properties of the SDSS quasars from Shen et al. (2011) catalog, and we select our sample putting the following constraints: the signal to noise ratio S/N > 10 and redshift z < 0.39. The higher S/N ratio was set in order to have more precisely measured quantities (Shen et al., 2011) and redshift was limited so both H and H spectral ranges are covered. This has resulted with a sample of 2, 224 type 1 quasars. All objects in the sample have the following spectral parameters measured: the FWHM of broad H and H lines; equivalent widths (EW) of narrow H, H, [O III] 5007 \angstrom, [S II] 6718, 6732 \angstrom and [N II] 6585 \angstrom lines; continuum luminosity at 5100 \angstrom (), and luminosity ratio of [O III] and narrow H line. We emphasize that the final number of objects is obtained so that there are no null values for all spectral parameters.
To analyze the correlations between quasar optical spectral parameters, we constructed a correlation matrix of our sample using Spearman correlation coefficients. The correlation matrix served as a useful tool for the selection of parameters later for PCA, but also for the analysis of correlation coefficients separately from the PCA results.
PCA is sometimes considered to be an unsupervised machine learning algorithm, because it can be used on unlabeled datasets, i.e. it can be applied even if we don’t have a target variable that we want to predict (for more details on PCA see e.g. Boroson & Green, 1992; Francis & Wills, 1999; Grupe, 2004).
In this work, the PCA was applied using the scikit-learn Python library where dimensionality reduction is conducted using Singular Value Decomposition of the data to project it to a lower dimensional space. In this way, only a few components are needed to completely describe total variance in our dataset and each component is representation of the dominant trends in the data.
To calculate the Baldwin effect slope, we performed linear regression for each narrow emission line in our sample. For further analysis of the Baldwin effect, the continuum luminosity was divided onto 9 bins of length 0.2 dex, starting from log and ending with log . The last bin was excluded from the analysis because it contained only one object and it was not representative enough to be taken into account. Finally, to test the effect of the starlight contamination on the Baldwin effect, we corrected the continuum luminosity using the empirical fitting formula of the average host contamination given in Shen et al. (2011), see their Eq. 1, and obtained the pure continuum luminosity of the quasar. The luminosity at 5100 Å has been corrected up to log , since above this value no correction is needed.
3 Results and Discussion
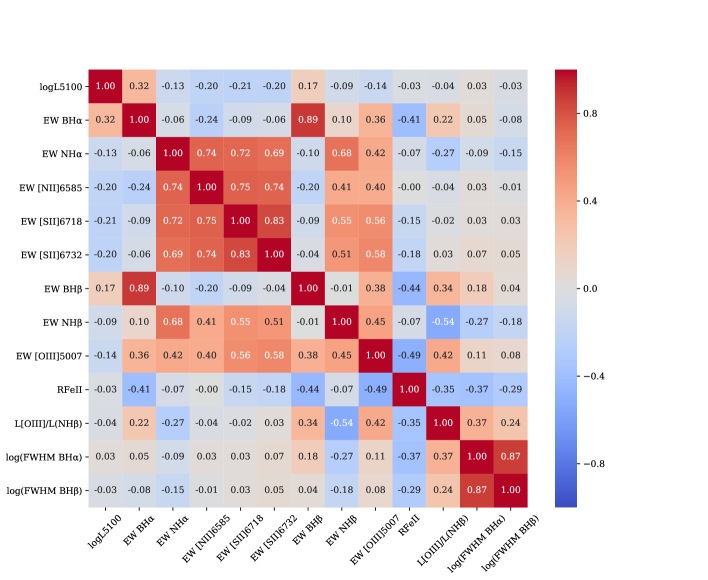
Fig. 1 gives the correlation matrix of all spectral parameters in our sample of type 1 quasars. The most evident result is the presence of correlations between parameters which populate Eigenvector 1 (E1) parameter space, which was well established and investigated previously (for a review see Sulentic et al., 2000a): the anti-correlations between the [O III] equivalent width and the Fe II strength (), and the FWHM of broad H line and (). The strongest correlations are found between the equivalent widths of broad H and H lines () as well as between their narrow components (), which is an expected result.
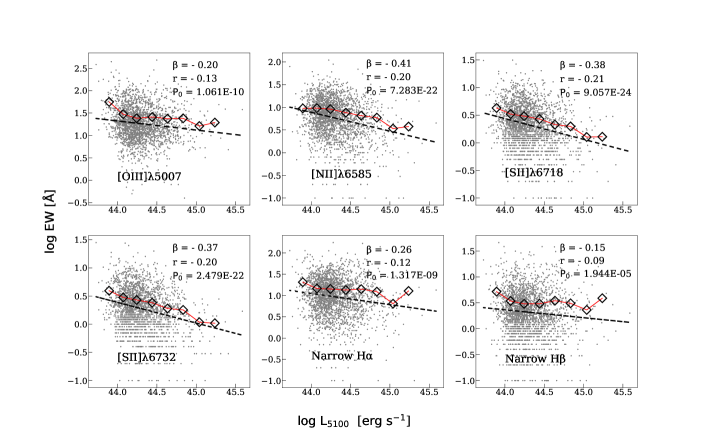
However, the matrix clearly reveals the apparent anti-correlation between continuum luminosity at 5100 \angstrom and equivalent widths of several narrow lines, which include: [O III] 5007 \angstrom, [N II] 6585 \angstrom, [S II] 6718, 6732 \angstrom, narrow H and narrow H. This anti-correlation represents the Baldwin effect for narrow lines in AGN. While Baldwin effect for broad lines in AGN is well established, narrow line Baldwin effect is still under investigation and it may result from different physical mechanisms.
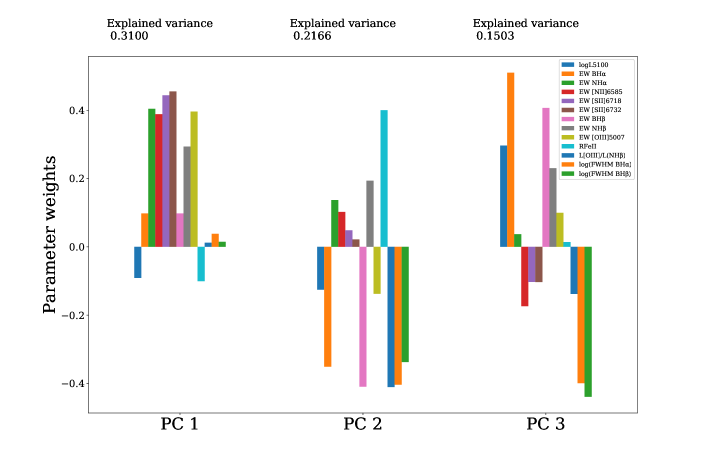
The results of the PCA, which are presented in Fig. 2, are also indicating the presence of these anti-correlations. Furthermore, PCA suggests that this is the dominant trend in our data sample because the relationship between continuum luminosity and narrow line equivalent widths is represented with the first principal component (PC 1). PC 1 explains 31% of the variance in our data sample. The second principal component (PC 2) is dominated by the anti-correlation between and FWHM of broad H (Sulentic et al., 2000b) and anti-correlation between and [O III] 5007 (discovered by Boroson & Green, 1992). One other correlation that is very prominent on PC2 is the correlation between the ratio of [O III] and H luminosity L([O III])/L(H) and FWHM of broad H which was recently discussed by Baron & Ménard (2019).
The summary of correlation coefficients with p-values of the null hypothesis for all narrow lines, along with the values of slopes obtained from linear regression is given in Table 1. These values are also presented on Fig. 3. Table 1 also lists the ionization energy and critical density in case of forbidden lines. The strongest Baldwin effect appears to be associated with [N II] and [S II] lines, however the p-values suggests that these anti-correlations are significant in all narrow lines. The Baldwin effect of the H and H lines shows the lowest correlation with the smallest significance.
We find that the slope for [O III] and H are in agreement with the findings of Zhang et al. (2013), however, for [N II] and [S II] lines the slope is is much steeper ( and , respectively) than previously reported by Zhang et al. (2013) , who received the value of and . This could be the result of the selection effect, since our sample contains low-redshift objects, and both radio loud and radio quiet objects.
| Emission line | log | ||||
|---|---|---|---|---|---|
| -0.200.03 | -0.14 | 35.11 | 5.80 | ||
| -0.420.04 | -0.20 | 14.50 | 4.82 | ||
| -0.380.03 | -0.21 | 10.36 | 2.30 | ||
| -0.380.03 | -0.20 | 10.36 | 2.30 | ||
| Narrow H | -0.260.04 | -0.13 | 13.60 | infinity | |
| Narrow H | -0.150.04 | -0.09 | 13.60 | infinity |
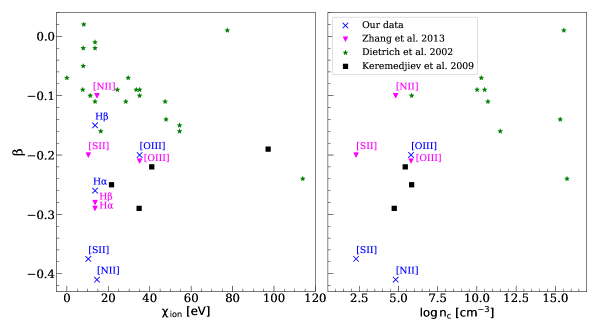
In order to quickly test if the Baldwin effect slope for narrow lines depends on the ionization potential or critical density of the lines, which was noticed to be relevant in case of the broad line Baldwin effect (e.g., Espey & Andreadis, 1999; Dietrich et al., 2002), we plotted those dependencies in Fig. 4, and compared our results with the data obtained from previous studies of narrow line Baldwin effect (Zhang et al., 2013; Keremedjiev et al., 2009; Dietrich et al., 2002). The p-values of the null hypothesis of correlations in question indicate that there is no significant correlation between Baldwin effect slopes and ionization potential (), and no correlation between Baldwin effect slopes and line critical densities () for narrow lines. This is in agreement with findings of Zhang et al. (2013).
Furthermore, we selected from our sample a sub-sample of 405 radio-loud quasars based on detection by the FIRST survey (both lobe- and core-dominated objects are included), and a sub-sample of 1,694 radio-quiet quasars, for which the FIRST survey reported no radio emission. Preliminary results of this analysis indicate that narrow line Baldwin effect slopes are steeper for radio-loud than for radio-quiet quasars. In the case of radio-loud quasars [O III] 5007 line has a slope () of -0.36, correlation coefficient () is -0.24 and p-value of the null hypothesis () is 7.48E-07. On the other hand, in the case of radio-quiet quasars the same line has = -0.20, = -0.14 and = 2.06E-08. For the [N II] 6583 line the results also differ substantially, such that we have for radio-loud sample = -0.56, = -0.35 and = 4.85E-13 and for radio-quiet = -0.41, = -0.19 and = 3.02E-15. The difference that appears in these two sub-samples may originate from the fact that in radio-loud quasars the narrow line emission may be enhanced by the jet-ISM interaction (Labiano, 2008) and also the continuum emission can be enhanced as the result of relativistic beaming. Further investigations are needed to confirm if this is the case.
Finally, we tested how would starlight contamination of the continuum luminosity affect the Baldwin effect in narrow lines. Using the continuum luminosity corrected for the host contribution, we still detect the Baldwin effect in all considered narrow lines, but with consistently smaller slope. The slope of the [O III] 5007 is decreased from -0.20 to -0.16, for [N II] 6585 to -0.32, for [S II] 6718 and [S II] 6732 to -0.29, for H to -0.20, and for H to -0.12. The correlation coefficients remain the same.
4 Conclusions
In this paper, we reported the results of the analysis performed on the sample of 2,224 low-redshift (z < 0.39) quasars from SDSS quasar catalog by Shen et al. (2011), for which we constructed the correlation matrix and applied the PCA on their optical spectral parameters. From our results, we came to the following conclusions: (i) we confirmed the Eigenvector 1 parameter space correlations for our data sample; ii) the Baldwin effect is present in all studied narrow lines, but with different slopes; iii) the slopes and correlation coefficients indicate that the Baldwin effect is the strongest for and lines, whereas in the case of the H and H lines it shows the lowest correlation with the smallest significance; iv) ionization energies needed to create the ions and critical densities of the narrow lines have no correlation with Baldwin effect slopes for narrow lines; and v) the host galaxy contamination of the continuum luminosity is steepening the Baldwin effect, but even with the corrected luminosity, the Baldwin effect remains in all narrow lines. Future investigation should be done to test if the continuum variation could be an explanation of the Baldwin effect as suggested by Zhang et al. (2013).
Acknowledgements.
This work is supported by the project (176001) Astrophysical Spectroscopy of Extragalactic Objects of the Ministry of Education, Science and Technological Development of the Republic of Serbia.References
- Baldwin (1977) Baldwin, J. A., Luminosity Indicators in the Spectra of Quasi-Stellar Objects. 1977, ApJ, 214, 679, DOI: 10.1086/155294
- Baron & Ménard (2019) Baron, D. & Ménard, B., Black hole mass estimation for active galactic nuclei from a new angle. 2019, MNRAS, 487, 3404, DOI: 10.1093/mnras/stz1546
- Bentz et al. (2006) Bentz, M. C., Peterson, B. M., Pogge, R. W., Vestergaard, M., & Onken, C. A., The Radius-Luminosity Relationship for Active Galactic Nuclei: The Effect of Host-Galaxy Starlight on Luminosity Measurements. 2006, ApJ, 644, 133, DOI: 10.1086/503537
- Bian et al. (2012) Bian, W.-H., Fang, L.-L., Huang, K.-L., & Wang, J.-M., The C IV Baldwin effect in quasi-stellar objects from Seventh Data Release of the Sloan Digital Sky Survey. 2012, MNRAS, 427, 2881, DOI: 10.1111/j.1365-2966.2012.22123.x
- Boroson & Green (1992) Boroson, T. A. & Green, R. F., The Emission-Line Properties of Low-Redshift Quasi-stellar Objects. 1992, ApJS, 80, 109, DOI: 10.1086/191661
- Croom et al. (2002) Croom, S. M., Rhook, K., Corbett, E. A., et al., The correlation of line strength with luminosity and redshift from composite quasi-stellar object spectra. 2002, MNRAS, 337, 275, DOI: 10.1046/j.1365-8711.2002.05910.x
- Dietrich et al. (2002) Dietrich, M., Hamann, F., Shields, J. C., et al., Continuum and Emission-Line Strength Relations for a Large Active Galactic Nuclei Sample. 2002, ApJ, 581, 912, DOI: 10.1086/344410
- Espey & Andreadis (1999) Espey, B. & Andreadis, S., Observational Evidence for an Ionization-Dependent Baldwin Effect. 1999, in Astronomical Society of the Pacific Conference Series, Vol. 162, Quasars and Cosmology, ed. G. Ferland & J. Baldwin, 351
- Francis & Wills (1999) Francis, P. J. & Wills, B. J., Introduction to Principal Components Analysis. 1999, in Astronomical Society of the Pacific Conference Series, Vol. 162, Quasars and Cosmology, ed. G. Ferland & J. Baldwin, 363
- Grupe (2004) Grupe, D., A Complete Sample of Soft X-Ray-selected AGNs. II. Statistical Analysis. 2004, AJ, 127, 1799, DOI: 10.1086/382516
- Heard & Gaskell (2016) Heard, C. Z. P. & Gaskell, C. M., The location of the dust causing internal reddening of active galactic nuclei. 2016, MNRAS, 461, 4227, DOI: 10.1093/mnras/stw1616
- Keremedjiev et al. (2009) Keremedjiev, M., Hao, L., & Charmandaris, V., The Mid-Infrared Narrow-Line Baldwin Effect Revealed by Spitzer. 2009, ApJ, 690, 1105, DOI: 10.1088/0004-637X/690/2/1105
- Korista et al. (1998) Korista, K., Baldwin, J., & Ferland, G., Quasars as Cosmological Probes: The Ionizing Continuum, Gas Metallicity, and the Wλ-L Relation. 1998, ApJ, 507, 24, DOI: 10.1086/306321
- Kovačević et al. (2010) Kovačević, J., Popović, L. Č., & Dimitrijević, M. S., Analysis of Optical Fe II Emission in a Sample of Active Galactic Nucleus Spectra. 2010, ApJS, 189, 15, DOI: 10.1088/0067-0049/189/1/15
- Labiano (2008) Labiano, A., Tracing jet-ISM interaction in young AGN: correlations between [O III] 5007 Å and 5-GHz emission. 2008, A&A, 488, L59, DOI: 10.1051/0004-6361:200810399
- McIntosh et al. (1999) McIntosh, D. H., Rieke, M. J., Rix, H. W., Foltz, C. B., & Weymann, R. J., A Statistical Study of Rest-Frame Optical Emission Properties in Luminous Quasars at 2.0<=z<=2.5. 1999, ApJ, 514, 40, DOI: 10.1086/306936
- Netzer et al. (2006) Netzer, H., Mainieri, V., Rosati, P., & Trakhtenbrot, B., The correlation of narrow line emission and X-ray luminosity in active galactic nuclei. 2006, A&A, 453, 525, DOI: 10.1051/0004-6361:20054203
- Netzer et al. (2004) Netzer, H., Shemmer, O., Maiolino, R., et al., Near-Infrared Spectroscopy of High-Redshift Active Galactic Nuclei. II. Disappearing Narrow-Line Regions and the Role of Accretion. 2004, ApJ, 614, 558, DOI: 10.1086/423608
- Rakić et al. (2017) Rakić, N., La Mura, G., Ilić, D., et al., The intrinsic Baldwin effect in broad Balmer lines of six long-term monitored AGNs. 2017, A&A, 603, A49, DOI: 10.1051/0004-6361/201630085
- Shen et al. (2011) Shen, Y., Richards, G. T., Strauss, M. A., et al., A Catalog of Quasar Properties from Sloan Digital Sky Survey Data Release 7. 2011, ApJS, 194, 45, DOI: 10.1088/0067-0049/194/2/45
- Shields (2007) Shields, J. C., Emission-Line versus Continuum Correlations in Active Galactic Nuclei. 2007, in Astronomical Society of the Pacific Conference Series, Vol. 373, The Central Engine of Active Galactic Nuclei, ed. L. C. Ho & J. W. Wang, 355
- Sulentic et al. (2000a) Sulentic, J. W., Marziani, P., & Dultzin-Hacyan, D., Phenomenology of Broad Emission Lines in Active Galactic Nuclei. 2000a, ARA&A, 38, 521, DOI: 10.1146/annurev.astro.38.1.521
- Sulentic et al. (2000b) Sulentic, J. W., Zwitter, T., Marziani, P., & Dultzin-Hacyan, D., Eigenvector 1: An Optimal Correlation Space for Active Galactic Nuclei. 2000b, ApJ, 536, L5, DOI: 10.1086/312717
- Zhang et al. (2013) Zhang, K., Wang, T.-G., Gaskell, C. M., & Dong, X.-B., The Baldwin Effect in the Narrow Emission Lines of Active Galactic Nuclei. 2013, ApJ, 762, 51, DOI: 10.1088/0004-637X/762/1/51