Electric field control of interfacial Dzyaloshinskii-Moriya interaction in Pt/Co/AlOx thin films
Abstract
We studied electric field modification of magnetic properties in a Pt/Co/AlOx trilayer via magneto-optical Kerr microscopy. We observed the spontaneous formation of labyrinthine magnetic domain structure due to thermally activated domain nucleation and propagation under zero applied magnetic field. A variation of the period of the labyrinthine structure under electric field is observed as well as saturation magnetization and magnetic anisotropy variations. Using an analytical formula of the stripe equilibrium width we estimate the variation of the interfacial Dzyaloshinskii-Moriya interaction under electric field as function of the exchange stiffness constant.
I Introduction
Electric-field (EF) control of magnetism in metals is currently an actively expanding field of study, motivated by potential applications in low power spintronics devices. The magnetization of metallic magnetic materials in spintronics devices can be manipulated using magnetic field or spin-polarized currents flow. The ability to control the magnetic properties of a system using a gate voltage is a promising technique which could lead to the development of EF-assisted magnetization switching devices. Since the first experimental demonstration of EF control of coercive field in a FePt thin film by Weisheit et al.
Weisheit et al. (2007), lots of studies have been conducted with the final intention of finding the best conditions for functional devices.
Significant variations in the magnetic anisotropy energy under EF application have been observed by many groups Maruyama et al. (2009); Wang et al. (2012); Niranjan et al. (2010); Nakamura et al. (2009); Endo et al. (2010); Yamada et al. (2013), as well as EF variation of in ultrathin films Ohno et al. (2000); Chiba et al. (2011); Shimamura et al. (2012). Recently, the EF impact on the exchange stiffness parameter has been addressed experimentally Ando et al. (2016); Dohi et al. (2016) and theoretically Oba et al. (2015). In these systems, a dielectric oxide layer is present at the top surface of the ferromagnet to allow the application of an EF in a capacitor geometry. This induces a broken spatial inversion symmetry for the ferromagnetic thin film.
The presence of these non-identical interfaces is the source of an antisymmetric type of exchange, the Dzyaloshinskii-Moriya interaction (DMI), which has been shown to be a source of chiral spin textures in Pt/Co/AlOx for instance Belmeguenai et al. (2015).
The interfacial origin of this DMI and its consequences in spin textures in ultrathin films make DMI another interesting EF tunable parameter. However, distinguishing EF modulation on DMI from other contributions is not straightforward as direct access to DMI is difficult.
In addition to theoretical predictions for ultra-thin samples Yang et al. (2018), several experimental studies have reported a change in the DMI factor under EF application Yang et al. (2018); Nawaoka et al. (2015); Srivastava et al. (2018); Koyama et al. (2018); Zhang et al. (2018); Suwardy et al. (2019). This control was shown for relatively thick layers of Fe (20 nm) Nawaoka et al. (2015); Suwardy et al. (2019), or a material presenting a weak DMI, Ta/FeCoB/TaOx, as demonstrated by Srivastava et al. Srivastava et al. (2018).
More recently, Zhang et al. Zhang et al. (2018) and Koyama et al. Koyama et al. (2018) showed larger EF induced variation of DMI in Pt/Fe/MgO and Pt/Co/Pd/MgO systems presenting intermediate DMI values.
In this work, we analyzed labyrinthine domains (also referred to as stripe domains) in samples of Pt/Co/AlOx presenting large DMI values Belmeguenai et al. (2015); Vanatka et al. (2015).
A reversible evolution of the labyrinthine magnetic domain configurations under EF is observed. We also report an EF variation of the saturation magnetization and anisotropy field. The analysis of the variation of equilibrium stripe width
allowed us to estimate the EF variation of the DMI term . We stress here that this estimation strongly depends on the assumptions made on the exchange constant value.
II System description and characterization
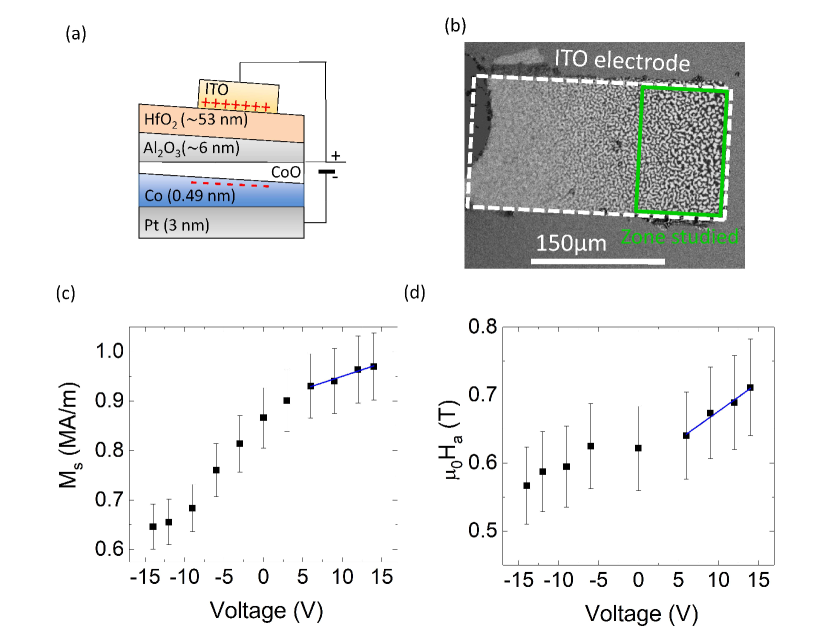
Our system is a Pt(3 nm)/Co(0.6 nm)/AlOx sputtered trilayer, presenting a gradient of oxidation at the Co/AlOx interface. This was induced by the post-oxidation of a wedged-shaped Al top layer (Fig. 1(a)). Using this technique, we get access to a low thicknesses range for Co due to the Co partial oxidation in the region where the deposited Al is thin. The sample has been covered by about 50 nm of a high- insulator, HfO2, deposited using atomic layer deposition. Then an Indium Tin Oxide (ITO) layer was DC sputtered and patterned in electrodes. These transparent electrodes allow to obtain magneto-optical Kerr effect (MOKE) images of the magnetic domains in the Co layer under a gate voltage (Fig. 1(b)). Voltages of different magnitudes were applied between this top electrode and the Co layer. Here a positive voltage application induces electrons accumulation at the surface of the Co layer (Fig. 1(a)).
We used MOKE in polar geometry and recorded images and magnetic hysteresis loops on a single position on the sample through the ITO electrode under different applied voltages (Fig. 1(b)).
To determine the EF variation of the saturation magnetization , we measured the variation of the p-MOKE signal between the two opposite saturated states, for out-of-plane applied magnetic field. The average value of magnetization of the wedged sample has been obtained by measuring with a Vibrating Sample Magnetometer-Superconducting Quantum Interference Device (VSM-SQUID). A of 366 K was estimated from VSM-SQUID measurements on the sample under study which possesses an averaged Co thickness of 0.49 nm due to partial oxidation of the deposited Co (see Fig. 1(a)).
A strong EF dependence of is shown in Fig. 1(c). Such sensitivity of the saturation magnetization is due to the proximity of the to the measurement temperature (room temperature). Similar EF control of associated with strong variations were observed in recent studies Ando et al. (2016); Chiba and Ono (2013).
The EF variation of the anisotropy field is presented in Fig. 1(d). The anisotropy field is extracted using Stoner-Wohlfarth fit of the magnetization rotation toward the hard axis direction, on p-MOKE hysteresis loops, for in-plane applied magnetic field.
From the measurements of , we deduced the variations of the effective magnetic anisotropy energy from the formula , where is the effective magnetic anisotropy and is the surface magneto cristalline anisotropy. A voltage controlled magnetic anisotropy (VCMA) coefficient Dieny and Chshiev (2017) 562 102 fJ/(Vm) is obtained. This is larger compared to the usual range obtained for a charge accumulation effect (10-290 fJ/(Vm)) Wang et al. (2012); Endo et al. (2010); Kita et al. (2012); Nozaki et al. (2016). The enhanced effect is again likely due to the proximity of to the measurement temperature.
III EF variation of equilibrium labyrinthine domains
As discussed earlier, the analysis of the equilibrium domain configuration has been shown to be one of the ways to study the influence of the EF on different magnetic properties Ando et al. (2016); Dohi et al. (2016). At zero and negative gate voltages, the domains are blurry due to a very strong thermally induced domain wall motion, as observed in previous works Bergeard et al. (2012). Thus, in the following we focus our study on positive gate voltages, for which the labyrinthine domains are stable, between 6 V and 14 V. To record the images of labyrinthine states and their variation with the EF, we proceed as follow: under a constant EF, we first saturate the sample with an applied magnetic field, then we turn off the magnetic field and record an image after a waiting time of a few seconds. The images presented in Fig. 2(a)-(d) correspond to the labyrinthine domains which spontaneously appear due to thermally activated nucleation and domain wall propagation. The labyrinthine domains are clearly and reversibly influenced by the application of an EF. The characteristic labyrinthine domain width is estimated using a 2D Fourier transform of the images in Fig. 2(a)-(d). In Fig. 2(e) we present as function of the applied voltage, which shows an increase as a positive voltage is applied to the top ITO electrode.
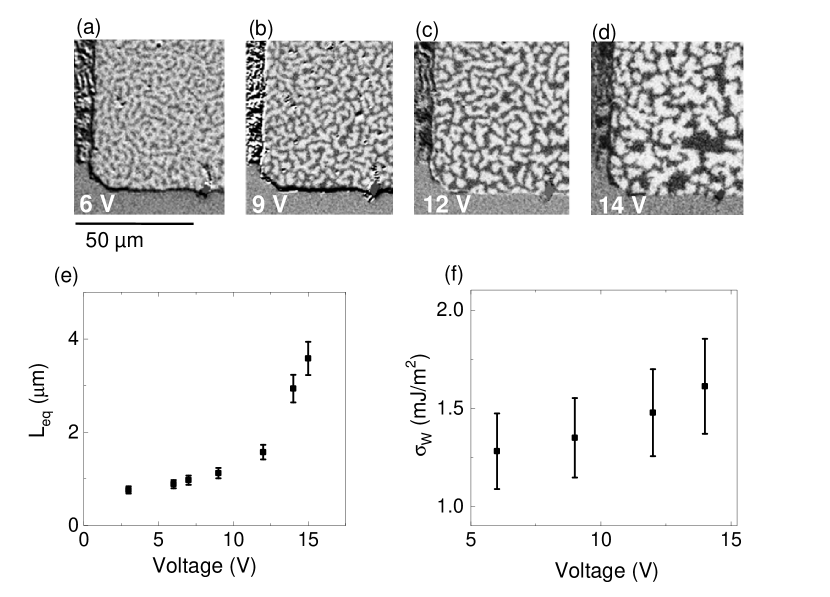
To understand in which way the EF is influencing the domain periodicity, we used an analytical model to describe the domain width in ultrathin films:
| (1) |
where is the cobalt thickness (which is fixed here to 0.49 nm), the dipolar constant and is a model-dependent constant Kaplan and Gehring (1993); Gehanno et al. (1997) of order unity. The experimental domain wall energy in Fig. 2(f) is deduced using the measured and values. We find domain wall energies around mJ/m2 for the range of voltages under study, which is consistent with earlier studies Schott et al. (2017).
IV EF variation of DMI
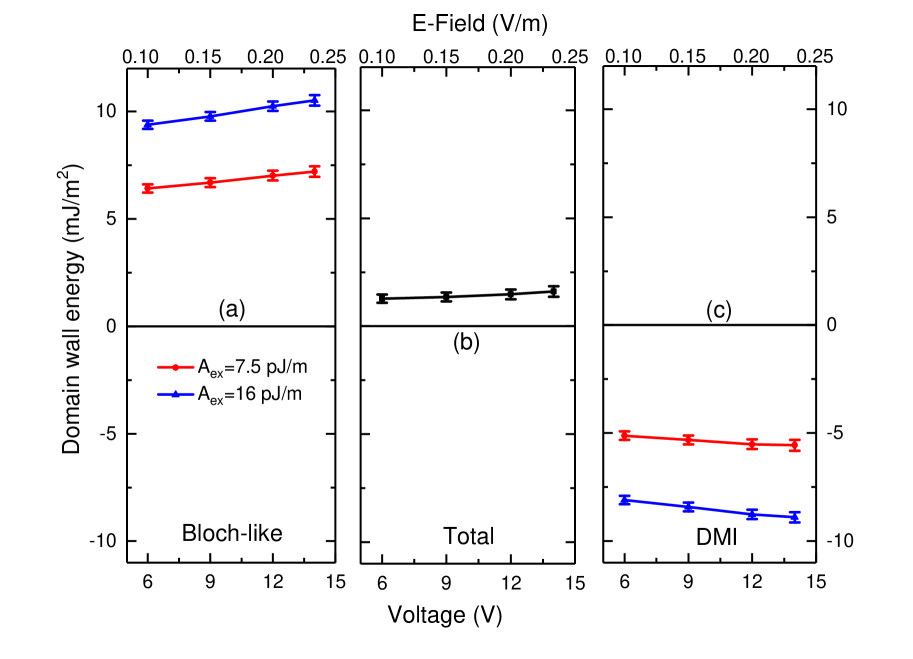
In the presence of sufficiently strong DMI, the domain wall is of Néel type with a sense of rotation which lowers the domain wall energy Heide et al. (2008): , where stands for the bulk DMI constant and is expressed in J/m2, while the surface DMI value is expressed in J/m. We see that in order to extract using the measured and values it is necessary to know the exchange constant . We have used two values for . The first value =7.5 pJ/m (for V=0 V) was deduced from a fit using Kuzmin formula Kuz’min (2005) of the temperature dependence of in our sample measured by VSM-SQUID. This reduced value is coherent with recent studies Yastremsky et al. (2019). The second value =16 pJ/m (for V=0 V) is a value corresponding to bulk thin Co films Metaxas et al. (2007). The fact that the value of extracted from our VSM-SQUID measurements is lower than the bulk Co value is linked to the low of our sample (366 K) and coherent with the low value. For the same reason we can expect to be influenced by EF as it was already suggested by previous studies Ando et al. (2016); Oba et al. (2015); Dohi et al. (2016). We present the different deduced energy terms and their EF variation in Fig. 3. The total domain wall energy , also shown in Fig. 2(f) is presented in Fig. 3(b). In Fig. 3(a) we present two values and variations of the Bloch wall energy deduced from the measured and and the two values of discussed ealier. is considered to vary with EF as , as the general tendency described by mean field approximation is that near Atxitia et al. (2010). Other theoretical studies have found a scaling law of , with being close to 0.2 for low temperatures Moreno et al. (2016); Kvashnin et al. (2015); Turek et al. (2003). Fixing is then a good approximation and will give us an upper limit for the variation we can expect for . From these assumptions we deduce the DMI value and EF variations which are presented in Fig. 3. The value at 6 V is ranging between 1.3-2.4 mJ/m2 depending on the chosen value. We see that EF variation of (Fig. 3(a)) is stronger than the variation of the total wall energy (Fig. 3(b)) and that an EF variation of is necessary to compensate this variation (Fig. 3(c)).

| seed | FM | MOx | DMI | ref | |||
|---|---|---|---|---|---|---|---|
| nm | nm | nm | mJ/m2 | MV/m | fJ/(Vm) | 10-12Jm/C | |
| Pt | Co | AlOx/HfOx | 0.14-0.26 | 133 | 1100-2000 | 3.9-7.2 | here |
| 3 | 0.49 | 6-53 | 0.2 | 700 | |||
| Ta | FeCoB | TaOx/AlOx/HfOx | 0.1 | 167 | 600 | 3.2 | Srivastava et al. (2018)* |
| 3 | 0.65 | 1-10-50 | |||||
| Ta | FeCoB | TaOx/AlOx/HfOx | 0.105 | 667 | 158 | 0.61 | Srivastava et al. (2018) |
| 3 | 0.65 | 1-10-50 | |||||
| Au | Fe | MgO/SiO2 | 12.5 | 3.2 | 1.72 | Nawaoka et al. (2015) | |
| 50 | 20 | 10-270 | |||||
| Pt | Fe | MgO | 0.06 | 800 | 75 | 2.65 | Zhang et al. (2018)* |
| 4 | 2 | 367 | |||||
| Ta/Pt | Co/Pd | MgO/HfOx | 0.038 | 577 | 67 | 0.38 | Koyama et al. (2018) |
| 2.6-2.4 | 0.78-0.4 | 2-50 | |||||
| V/Fe | Co | MgO/SiO2 | 18 | 100 | 5.5 | Suwardy et al. (2019) | |
| 20-20 | 0.14 | 5-50 | |||||
| V/Fe | Co | MgO/SiO2 | 18 | 65 | 14.5 | Suwardy et al. (2018) | |
| 20-20 | 0.26 | 5-50 | |||||
| Pt | Co | MgO | 26 | 0.6-1.76 | Yang et al. (2018) | ||
| 0.6 |
To discuss the DMI variations under EF, we use the voltage-control DMI (VCDMI) coefficient Yang et al. (2018); Srivastava et al. (2018)), defined as (in J/(Vm), with , where is the voltage variation and the dielectric tickness. The coefficient is plotted versus in Fig. 4. It is in the range of 1100 - 2000 700 fJ/(Vm). In order to compare this result with previous works we give a summary of the different values in Table 1. Very spread values between 3.2 and 2000 fJ/(Vm) are obtained. However, these values are not directly comparable, as in addition to different materials and material quality, different thickness ranges of the ferromagnetic layer and different dielectric oxide layers have been used. To obtain comparable values of the (VCDMI) coefficient, we define a new normalized coefficient DMI, which we introduce as the variation of surface DMI constant per surface charge provided at the interface of the ferromagnet: , where is the effective permittivity equal to in the case of a single dielectric layer, where is the permittivity of vaccum and the relative permittivity of the dielectric. This new normalized DMI coefficient takes into account the fact that the DMI is of interfacial origin, and consequently it is the variation of surface DMI constant which should be compared. In addition, as high-k oxides have been used in order to allow smaller EF for a similar effect on DMI we also have to take into account the effective permittivity of the (possibly multilayered) oxide and compare the effect for a given induced surface charge density and not a given electric field (assuming that the EF effect is induced by electron displacement). After performing this renormalization of the EF changes on DMI, we can now compare the DMI values corresponding to different studies from several teams. The obtained values lie within the range 0.6 to 14.5 Jm/C. We first see that the two studies with long time scale measurements (made by Brillouin light Spectroscopy (BLS) Srivastava et al. (2018); Zhang et al. (2018)) provide much larger DMI. This is potentially due to the ion migration contribution from these long measurements. Long (days or hours) and short time (seconds or minutes) measurements present a factor of 5 ratio in DMI Srivastava et al. (2018). Our present result obtained within minute-timescale in ultrathin Co gives intermediate DMI. For the case of the theoretical paper by Yang et al., we have reported two values for the DMI, considering or not that the EF calculated corresponds to an applied EF or takes into account the effect of in the oxide, which is still debated in the community, in particular due to the underestimation of the dielectric permittivity of MgO. These two values are thus giving ranges for theoretical DMI in the Pt/Co/MgO system. The relatively small dispersion in the extracted DMI values is noticeable, as all these studies have been performed in different teams with samples with different ferromagnetic materials, seed layers and oxides, grown with different techniques (magnetron sputtering or molecular beam epitaxy), measured with different methods (BLS, DW asymmetric motion under in-plane magnetic field, analysis of the labyrinthine domain structures, excitation of magneto-static surface spin-waves) with EF ranging from 18 to 800 MV/m. This indicates that the underlying physics is similar for all these samples despite the very different proposed. In order to carefully compare interface effect and optimize the EF effect on DMI, one should thus perform calculation of this renormalized, thickness and oxide-independent DMI.
Conclusion
In conclusion, we were able to deduce a strong EF variation of the magnetic anisotropy energy ( = 562 102 fJ/(Vm)) and of the term ( 1100 - 2000 700 fJ/(Vm)). The strong observed variation of domain size is a result of the combination of variations of every magnetic parameter. The strong coefficients we were able to deduce for PMA and DMI energies are the result of significantly increased EF effects for measurement temperatures close to .
Acknowledgements
The authors thank M. Chshiev and A. Thiaville for fruitful discussions and C. Mahony for his contribution to the editing of the manuscript. This work was supported by the French ANR via Contract No. ELECSPIN ANR-16-CE24-0018), the DARPA TEE program through Grant MIPR No. HR0011831554 and the EUR Grant NanoX No. ANR-17-EURE-0009 in the framework of the “Programme des Investissements d’Avenir”.
References
- Weisheit et al. (2007) M. Weisheit, S. Fähler, A. Marty, Y. Souche, C. Poinsignon, D. Givord, Electric field-induced modification of magnetism in thin-film ferromagnets, Science 315 (2007) 349–351. doi:10.1126/science.1136629.
- Maruyama et al. (2009) T. Maruyama, Y. Shiota, T. Nozaki, K. Ohta, N. Toda, N. Mizuguchi, A. A. Tulapurkar, T. Shinjo, M. Shiraishi, S. Mizukami, Y. Ando, Y. Suzuki, Large voltage-induced magnetic anisotropy change in a few atomic layers of iron, Nature Nanotechnology 4 (2009) 158.
- Wang et al. (2012) W.-G. Wang, M. Li, S. Hageman, C. L. Chien, Electric-field-assisted switching in magnetic tunnel junctions, Nature Materials 11 (2012) 64.
- Niranjan et al. (2010) M. K. Niranjan, C.-G. Duan, S. S. Jaswal, E. Y. Tsymbal, Electric field effect on magnetization at the Fe/MgO(001) interface, Applied Physics Letters 96 (2010) 222504. doi:10.1063/1.3443658.
- Nakamura et al. (2009) K. Nakamura, R. Shimabukuro, Y. Fujiwara, T. Akiyama, T. Ito, A. J. Freeman, Giant Modification of the Magnetocrystalline Anisotropy in Transition-Metal Monolayers by an External Electric Field, Physical Review Letters 102 (2009) 187201. doi:10.1103/PhysRevLett.102.187201.
- Endo et al. (2010) M. Endo, S. Kanai, S. Ikeda, F. Matsukura, H. Ohno, Electric-field effects on thickness dependent magnetic anisotropy of sputtered MgO/CoFeB/Ta structures, Applied Physics Letters 96 (2010) 212503. doi:10.1063/1.3429592.
- Yamada et al. (2013) K. Yamada, H. Kakizakai, K. Shimamura, M. Kawaguchi, S. Fukami, N. Ishiwata, D. Chiba, T. Ono, Electric Field Modulation of Magnetic Anisotropy in MgO/Co/Pt Structure, Applied Physics Express 6 (2013) 073004.
- Ohno et al. (2000) H. Ohno, D. Chiba, F. Matsukura, T. Omiya, E. Abe, T. Dietl, Y. Ohno, K. Ohtani, Electric-field control of ferromagnetism, Nature 408 (2000) 944–946. doi:10.1038/35050040.
- Chiba et al. (2011) D. Chiba, S. Fukami, K. Shimamura, N. Ishiwata, K. Kobayashi, T. Ono, Electrical control of the ferromagnetic phase transition in cobalt at room temperature, Nature Materials 10 (2011) 853.
- Shimamura et al. (2012) K. Shimamura, D. Chiba, S. Ono, S. Fukami, N. Ishiwata, M. Kawaguchi, K. Kobayashi, T. Ono, Electrical control of Curie temperature in cobalt using an ionic liquid film, Applied Physics Letters 100 (2012) 122402. doi:10.1063/1.3695160.
- Ando et al. (2016) F. Ando, H. Kakizakai, T. Koyama, K. Yamada, M. Kawaguchi, S. Kim, K. J. Kim, T. Moriyama, D. Chiba, T. Ono, Modulation of the magnetic domain size induced by an electric field, Applied Physics Letters 109 (2016) 22401. doi:10.1063/1.4955265.
- Dohi et al. (2016) T. Dohi, S. Kanai, A. Okada, F. Matsukura, H. Ohno, Effect of electric-field modulation of magnetic parameters on domain structure in mgo/cofeb, AIP Advances 6 (2016) 075017. doi:10.1063/1.4959905.
- Oba et al. (2015) M. Oba, K. Nakamura, T. Akiyama, T. Ito, M. Weinert, A. J. Freeman, Electric-Field-Induced Modification of the Magnon Energy, Exchange Interaction, and Curie Temperature of Transition-Metal Thin Films, Physical Review Letters 114 (2015) 107202. doi:10.1103/PhysRevLett.114.107202.
- Belmeguenai et al. (2015) M. Belmeguenai, J.-P. Adam, Y. Roussigné, S. Eimer, T. Devolder, J.-V. Kim, S. M. Cherif, A. Stashkevich, A. Thiaville, Interfacial dzyaloshinskii-moriya interaction in perpendicularly magnetized ultrathin films measured by brillouin light spectroscopy, Physical Review B 91 (2015) 180405. doi:10.1103/PhysRevB.91.180405.
- Yang et al. (2018) H. Yang, O. Boulle, V. Cros, A. Fert, M. Chshiev, Controlling Dzyaloshinskii-Moriya Interaction via Chirality Dependent Atomic-Layer Stacking, Insulator Capping and Electric Field, Scientific Reports 8 (2018) 12356. doi:10.1038/s41598-018-30063-y.
- Nawaoka et al. (2015) K. Nawaoka, S. Miwa, Y. Shiota, N. Mizuochi, Y. Suzuki, Voltage induction of interfacial Dzyaloshinskii–Moriya interaction in Au/Fe/MgO artificial multilayer, Applied Physics Express 8 (2015) 063004. doi:10.7567/apex.8.063004.
- Srivastava et al. (2018) T. Srivastava, M. Schott, R. Juge, V. Křižáková, M. Belmeguenai, Y. Roussigné, A. Bernand-Mantel, L. Ranno, S. Pizzini, S. M. Chérif, A. Stashkevich, S. Auffret, O. Boulle, G. Gaudin, M. Chshiev, C. Baraduc, H. Béa, Large-Voltage Tuning of Dzyaloshinskii-Moriya Interactions: A Route toward Dynamic Control of Skyrmion Chirality, Nano Letters 18 (2018) 4871–4877. doi:10.1021/acs.nanolett.8b01502.
- Koyama et al. (2018) T. Koyama, Y. Nakatani, J. Ieda, D. Chiba, Electric field control of magnetic domain wall motion via modulation of the Dzyaloshinskii-Moriya interaction, Science Advances 4 (2018). doi:10.1126/sciadv.aav0265.
- Zhang et al. (2018) W. Zhang, H. Zhong, R. Zang, Y. Zhang, S. Yu, G. Han, G. L. Liu, S. S. Yan, S. Kang, L. M. Mei, Electrical field enhanced interfacial Dzyaloshinskii-Moriya interaction in MgO/Fe/Pt system, Applied Physics Letters 113 (2018) 122406. doi:10.1063/1.5050447.
- Suwardy et al. (2019) J. Suwardy, M. Goto, Y. Suzuki, S. Miwa, Voltage-controlled magnetic anisotropy and Dzyaloshinskii-Moriya interactions in CoNi/MgO and CoNi/pd/MgO, Japanese Journal of Applied Physics 58 (2019) 060917. doi:10.7567/1347-4065/ab21a6.
- Vanatka et al. (2015) M. Vanatka, J.-C. Rojas-Sánchez, J. Vogel, M. Bonfim, M. Belmeguenai, Y. Roussigné, A. Stashkevich, A. Thiaville, S. Pizzini, Velocity asymmetry of dzyaloshinskii domain walls in the creep and flow regimes, Journal of Physics: Condensed Matter 27 (2015) 326002.
- Chiba and Ono (2013) D. Chiba, T. Ono, Control of magnetism in Co by an electric field, Journal of Physics D: Applied Physics 46 (2013) 213001.
- Dieny and Chshiev (2017) B. Dieny, M. Chshiev, Perpendicular magnetic anisotropy at transition metal/oxide interfaces and applications, Review of Modern Physics 89 (2017) 25008. doi:10.1103/RevModPhys.89.025008.
- Kita et al. (2012) K. Kita, D. W. Abraham, M. J. Gajek, D. C. Worledge, Electric-field-control of magnetic anisotropy of Co0.6Fe0.2B0.2/oxide stacks using reduced voltage, Journal of Applied Physics 112 (2012) 33919. doi:10.1063/1.4745901.
- Nozaki et al. (2016) T. Nozaki, A. Kozioł-Rachwał, W. Skowroński, V. Zayets, Y. Shiota, S. Tamaru, H. Kubota, A. Fukushima, S. Yuasa, Y. Suzuki, Large voltage-induced changes in the perpendicular magnetic anisotropy of an mgo-based tunnel junction with an ultrathin fe layer, Physical Review Applied 5 (2016) 044006. doi:10.1103/PhysRevApplied.5.044006.
- Bergeard et al. (2012) N. Bergeard, J. P. Jamet, A. Mougin, J. Ferré, J. Gierak, E. Bourhis, R. Stamps, Dynamic fluctuations and two-dimensional melting at the spin reorientation transition, Physical Review B 86 (2012) 1–5. doi:10.1103/PhysRevB.86.094431.
- Kaplan and Gehring (1993) B. Kaplan, G. A. Gehring, The domain structure in ultrathin magnetic films, Journal of Magnetism and Magnetic Materials 128 (1993) 111–116. doi:10.1016/0304-8853(93)90863-W.
- Gehanno et al. (1997) V. Gehanno, Y. Samson, A. Marty, B. Gilles, A. Chamberod, Magnetic susceptibility and magnetic domain configuration as a function of the layer thickness in epitaxial fepd(0 0 1) thin films ordered in the l1o structure, Journal of Magnetism and Magnetic Materials 172 (1997) 26 – 40. doi:10.1016/S0304-8853(97)00089-9.
- Schott et al. (2017) M. Schott, A. Bernand-Mantel, L. Ranno, S. Pizzini, J. Vogel, H. Béa, C. Baraduc, S. Auffret, G. Gaudin, D. Givord, The skyrmion switch: Turning magnetic skyrmion bubbles on and off with an electric field, Nano Letters 17 (2017) 3006–3012. doi:10.1021/acs.nanolett.7b00328.
- Heide et al. (2008) M. Heide, G. Bihlmayer, S. Blügel, Dzyaloshinskii-moriya interaction accounting for the orientation of magnetic domains in ultrathin films: Fe/w(110), Physical Review B 78 (2008) 140403. doi:10.1103/PhysRevB.78.140403.
- Kuz’min (2005) M. D. Kuz’min, Shape of Temperature Dependence of Spontaneous Magnetization of Ferromagnets: Quantitative Analysis, Physical Review Letters 94 (2005) 107204. doi:10.1103/PhysRevLett.94.107204.
- Yastremsky et al. (2019) I. A. Yastremsky, O. M. Volkov, M. Kopte, T. Kosub, S. Stienen, K. Lenz, J. Lindner, J. Fassbender, B. A. Ivanov, D. Makarov, Thermodynamics and Exchange Stiffness of Asymmetrically Sandwiched Ultrathin Ferromagnetic Films with Perpendicular Anisotropy, Physical Review Applied 12 (2019) 64038. doi:10.1103/PhysRevApplied.12.064038.
- Metaxas et al. (2007) P. J. Metaxas, J. P. Jamet, A. Mougin, M. Cormier, J. Ferré, V. Baltz, B. Rodmacq, B. Dieny, R. L. Stamps, Creep and flow regimes of magnetic domain-wall motion in ultrathin films with perpendicular anisotropy, Physical Review Letters 99 (2007) 217208. doi:10.1103/PhysRevLett.99.217208.
- Atxitia et al. (2010) U. Atxitia, D. Hinzke, O. Chubykalo-Fesenko, U. Nowak, H. Kachkachi, O. N. Mryasov, R. F. Evans, R. W. Chantrell, Multiscale modeling of magnetic materials: Temperature dependence of the exchange stiffness, Physical Review B 82 (2010) 134440. doi:10.1103/PhysRevB.82.134440.
- Moreno et al. (2016) R. Moreno, R. F. L. Evans, S. Khmelevskyi, M. C. Muñoz, R. W. Chantrell, O. Chubykalo-Fesenko, Temperature-dependent exchange stiffness and domain wall width in co, Physical Review B 94 (2016) 104433. doi:10.1103/PhysRevB.94.104433.
- Kvashnin et al. (2015) Y. O. Kvashnin, W. Sun, I. Di Marco, O. Eriksson, Electronic topological transition and noncollinear magnetism in compressed hcp co, Physical Review B 92 (2015) 134422. doi:10.1103/PhysRevB.92.134422.
- Turek et al. (2003) I. Turek, J. Kudrnovský, V. Drchal, P. Bruno, S. Blügel, Ab initio theory of exchange interactions in itinerant magnets, physica status solidi (b) 236 (2003) 318–324. doi:10.1002/pssb.200301671.
- Suwardy et al. (2018) J. Suwardy, K. Nawaoka, J. Cho, M. Goto, Y. Suzuki, S. Miwa, Voltage-controlled magnetic anisotropy and voltage-induced dzyaloshinskii-moriya interaction change at the epitaxial fe(001)/mgo(001) interface engineered by co and pd atomic-layer insertion, Physical Review B 98 (2018) 144432. doi:10.1103/PhysRevB.98.144432.