Measuring the heating and cooling of the interstellar medium at high redshift: PAH and [C II] observations of the same star forming galaxies at
Abstract
Star formation depends critically on cooling mechanisms in the interstellar medium (ISM); however, thermal properties of gas in galaxies at the peak epoch of star formation () remain poorly understood. A limiting factor in understanding the multiphase ISM is the lack of multiple tracers detected in the same galaxies, such as Polycyclic Aromatic Hydrocarbon (PAH) emission, a tracer of a critical photoelectric heating mechanism in interstellar gas, and [C II] 158m fine-structure emission, a principal coolant. We present ALMA Band 9 observations targeting [C II] in six star-forming galaxies with strong Spitzer IRS detections of PAH emission. All six galaxies are detected in dust continuum and marginally resolved. We compare the properties of PAH and [C II] emission, and constrain their relationship as a function of total infrared luminosity (LIR) and IR surface density. [C II] emission is detected in one galaxy at high signal-to-noise (34), and we place a secure upper limit on a second source. The rest of our sample are not detected in [C II] likely due to redshift uncertainties and narrow ALMA bandpass windows. Our results are consistent with the deficit in [C II]/LIR and PAH/LIR observed in the literature. However, the ratio of [C II] to PAH emission at is possibly much lower than what is observed in nearby dusty star-forming galaxies. This could be the result of enhanced cooling via [O I] at high, hotter gas and dust temperatures, and/or a reduction in the photoelectric efficiency, in which the coupling between interstellar radiation and gas heating is diminished.
revtex4-1Repair the float
1 Introduction
Ten billion years ago (), the star-formation rate density of the Universe peaked and individual galaxies were forming more stars than at any other time in cosmic history (e.g., Lilly et al. 1996; Madau et al. 1996; Chary & Elbaz 2001; Madau & Dickinson 2014). Enhanced star-formation was promoted by gas resupply through cold mode accretion onto galaxies (e.g., Kereš et al. 2005, 2009; Genzel et al. 2008; Tacconi et al. 2010), accompanied by a change in the efficiency of star-formation (e.g., Tacconi et al. 2010, 2013, 2018; Genzel et al. 2015; Scoville et al. 2017; Liu et al. 2019), which suggests evolution in the heating and cooling mechanisms of interstellar gas.
The internal transfer of thermal energy is critical for any physical system. Photoelectrons ejected from polycyclic aromatic hydrocarbons (PAHs) are thought to be the most important, albeit inefficient, mechanism for converting stellar radiation to thermal energy in and around sites of active star-formation (Watson & Salpeter, 1972; Bakes & Tielens, 1994; Helou et al., 2001). PAH molecules are complex grains comprised mostly of C and H, and are common in photodissociation regions (PDRs) where gas densities of cm-3 are illuminated by far-UV stellar radiation fields (Tielens & Hollenbach, 1985). Once excited by stellar photons, PAHs emit vibrational lines between m that can contain as much as of total IR emission (LIR, m) (Smith et al., 2007; Sajina et al., 2007; Pope et al., 2008; Dale et al., 2009). Therefore, mid-IR PAH features are direct probes of photoelectric heating in dense PDRs and a key diagnostic of the interstellar medium (ISM).
The energy injected into the ISM by photoelectrons is radiated away in the infrared (IR). Far-IR fine-structure emission lines such as [C II] at 158 m and [O I] at 63 m can contain of LIR (Tielens & Hollenbach, 1985; Stacey et al., 2010; Díaz-Santos et al., 2013; Brisbin et al., 2015; Ibar et al., 2015). [C II] in particular is emerging as a powerful, but complicated diagnostic of the ISM because it comes from different regions in a galaxy. With a critical density of cm-3 at K, [C II] is collisionally excited by H and H2 in PDRs, as well as by warm electrons at 8,000 K (Goldsmith et al., 2012). Ancillary observations of [N II] 205 m emission constrain the fraction of [C II] emission originating from PDRs (e.g., Croxall et al. 2012), which is greater for lower metallcities (Croxall et al., 2017; Cormier et al., 2019), and approaches unity in warm and compact, dusty, star forming regions (Sutter et al., 2019). Thus, [C II] can be used to trace PDR cooling in warm, compact environments, a critical physical process in atomic gas for star-formation to occur.
| Target | R.A. | Dec. | L6.2μm | L11.3μm | M∗aaSee Kirkpatrick et al. (2012) for details on stellar mass calculations. | SFRIR | bb is the integrated AGN power-law emission divided by the total mid-IR IRS flux, and is calculated using the mid-IR decomposition technique of Pope et al. (2008) and Kirkpatrick et al. (2015). We re-fit this template-based model using MCMC and and calculate at each step in the Markov chain. Tabulated values for correspond to the mean of this distribution. Given the data in hand, can be measured with an accuracy of (e.g., Pope et al. 2008; Kirkpatrick et al. 2015). | ||
|---|---|---|---|---|---|---|---|---|---|
| [J2000] | [J2000] | [L⊙] | [L⊙] | [L⊙] | [M⊙] | [M⊙ yr-1] | |||
| GS IRS20 | 03:32:47.58 | -27:44:52.0 | 10.98 | 717 | |||||
| GS IRS46 | 03:32:42.71 | -27:39:27.0 | - ccThe 11.3 m PAH feature is redshifted out of GS IRS46’s IRS spectrum. | - ddGS IRS46 is outside of GOODS-S and CANDELS, preventing the calculation of a stellar mass with comparable methods to the rest of the sample for which deeper data is available. | 376 | ||||
| GS IRS50 | 03:32:31.52 | -27:48:53.0 | 11.03 | 184 | |||||
| GS IRS52 | 03:32:12.52 | -27:43:06.0 | 10.64 | 232 | |||||
| GS IRS58 | 03:32:40.24 | -27:49:49.0 | 11.07 | 207 | |||||
| GS IRS61 | 03:32:43.45 | -27:49:01.0 | 10.90 | 243 |
Note. — When calculating M∗ and SFRIR, we assume a Salpeter IMF and SFRLIR (Kennicutt, 1998). We assume a systematic error of 10% for LIR and include this in the quoted uncertainty, all calculations, and on all figures. Appendix Section A describes our procedure for calculating PAH line luminosities and .
PDR densities are much greater than the critical density of [C II] with its primary collisional partners H and H2 ( cm-3, cm-3), both of which are heated by photoelectrons from PAH grains (Tielens & Hollenbach, 1985; Wolfire et al., 1990; Kaufman et al., 1999; Malhotra et al., 2001; Goldsmith et al., 2012). Thus, a correlation between [C II] and PAH emission is likely if both lines originate from the same PDR regions. Indeed, Helou et al. (2001) found the ratio of [C II] emission over integrated m flux in star-forming galaxies to be independent of far-IR color, which strongly favors a co-spatial origin.
Pope et al. (2013) report a deficit of 6.2 m PAH emission at higher LIR in (ultra) luminous IR galaxies (LIRGs: , ULIRGs: ) and sub-millimeter (mm) galaxies, a feature also observed for [C II] emission in similar galaxy populations. Indeed, the luminosity ratio of [C II] to LIR decreases at higher LIR in local and high- galaxies.111E.g., Malhotra et al. 1997, 2001; Luhman et al. 1998, 2003; Helou et al. 2001; Díaz-Santos et al. 2013, 2014, 2017; Stacey et al. 2010; Magdis et al. 2014; Rigopoulou et al. 2014; Brisbin et al. 2015; Ibar et al. 2015; Zanella et al. 2018; Rybak et al. 2019. In low- (U)LIRGs, Díaz-Santos et al. (2013, 2017) find L/LIR empirically anti-correlates with average dust temperatures and IR luminosity surface densities, suggesting that either harder and more intense radiation fields lower the L/LIR ratio, or larger dust grains out-compete PAHs for ionizing photons, starving the gas. Smith et al. (2017) find the star-formation rate surface density to be a primary factor driving the [C II]-deficit, reconciling nearby resolved measurements and high galaxies with a relation that spans over six orders of magnitude. At , Rybak et al. (2019) find evidence for thermal saturation of C+ as the primary driver of the deficit (see also Muñoz & Oh 2016). Other potential contributors to the [C II]-deficit include positive PAH grain charging where fewer photoelectrons are available to collisionally excite [C II] (e.g., Helou et al. 2001), density effects (e.g., Smith et al. 2017), and/or [C II] self-absorption, although the latter scenario requires unusually large gas column densities in PDRs and is unlikely (Luhman et al., 1998; Malhotra et al., 2001).
Regardless of its origin, the [C II]-deficit implies that one of the most important cooling lines for star-formation falls off in luminosity at higher LIR, or equivalently, higher star-formation rate (SFR, Kennicutt 1998). This implies a change in one or all of the following: the photoelectric heating efficiency of the ISM, far-UV radiation field strength and hardness, gas density and PDR geometry (Smith et al., 2017). Furthermore, galaxies have higher SFR per unit stellar mass at earlier times than they do locally (e.g., Madau & Dickinson 2014), suggesting that ISM conditions evolve as a function of redshift and SFR (Scoville et al., 2017; Tacconi et al., 2018; Liu et al., 2019). Indeed, Stacey et al. (2010) found that the [C II]-deficit is pushed to higher LIR at higher redshifts; however, Zanella et al. (2018) did not observe this offset in a sample of main-sequence galaxies at . In either case, all galaxies may follow the same L/LIR trend as a function of LIR normalized by molecular gas mass (Stacey et al., 2010; Graciá-Carpio et al., 2011). Thus, the gas cooling properties and stellar radiation field strengths in local and star-forming galaxies could be comparable for a given star-formation efficiency (SFESFRM). If this is the case, high star-formation could be a scaled up version of star-formation today with comparable ISM conditions, and therefore, similar mid- and far-IR PDR line ratios.
In this paper, we combine new observations using the Atacama Large Millimeter/submillimeter Array (ALMA) to investigate the properties of ISM heating and cooling in star-forming galaxies through combined observations of [C II] and PAH emission. With archival Spitzer Infrared Spectrograph (IRS) spectra, we can identify pure star-forming galaxies to study the properties of PDRs and star-formation without concern for feedback from an active galactic nucleus (AGN). Using ratios of [C II] to PAH emission, we investigate the photoelectric efficiency in PDRs near the peak in the Universe’s star-formation rate density, a critical epoch for galaxy evolution during which most of the stellar mass in the present day Universe was assembled (e.g., Madau & Dickinson 2014). We investigate the evolution in [C II]/PAH emission with redshift, and comment on the technical aspects of synergistic surveys combining ALMA and mid-IR spectrographs, with applications to the James Webb Space Telescope Mid-Infrared Instrument (JWST/MIRI).
The paper is organized as follows: In Section 2 we present the galaxy sample, selection criterion, and observations including novel and archival data. Our analysis techniques and emission line measurements are described in Section 3. We present our results in Section 4 and discuss their implications in Section 5. Section 6 summarizes our conclusions. Throughout this work we assume a Salpeter IMF and adopt a CDM cosmology with , , and km s-1 Mpc-1.
2 Sample and Observations
2.1 Sample Selection
We have assembled a sample of six IR-luminous galaxies () at with extensive coverage from restframe ultraviolet to sub-mm wavelengths, selected primarily by the presence of luminous PAH features in the mid-IR and little to no underlying power-law continuum. These systems are dominated by star-formation: an AGN would heat dust to high temperatures and emits warm black-body emission at mid-IR wavelengths which we do not detect (e.g., Laurent et al. 2000; Sturm et al. 2000; Tran et al. 2001; Sajina et al. 2007). Our sample comes from a larger multiwavelength parent catalog described in Kirkpatrick et al. (2015). To summarize, multiwavelength data was collected for 343 (U)LIRGs between in the Great Observatories Origins Deep Survey North/South (GOODS-N/S), Extended Chandra Deep Field Survey (ECDFS), and the Spitzer Extragalactic First Look Survey fields. The primary target selection criterion was the presence of mid-IR spectroscopy from Spitzer IRS. For more details on the parent sample selection method, we refer readers to Section 2.1 of Kirkpatrick et al. (2015).
With our ALMA cycle 5 program targeting [C II] emission at , we observed six star-forming galaxies between from the Kirkpatrick et al. (2015) sample with LPAH,6.2/LIR and . These galaxies all have little to no evidence of AGN contamination to the mid-IR spectrum (), based on IRS spectral decomposition, and as evidenced by their 6.2m PAH equivalent widths EW6.2m, which is the threshold established in nearby (U)LIRGs for star-formation dominated systems (Stierwalt et al., 2014). The selection of sources based on strong PAH features in high IR-luminosity galaxies has been shown in the literature to be a robust way for selecting galaxies with minimal AGN contamination (e.g., Houck et al. 2005; Yan et al. 2005; Brandl et al. 2006; Sajina et al. 2007; Smith et al. 2007; Armus et al. 2007; Pope et al. 2008; Veilleux et al. 2009; Kirkpatrick et al. 2012).
Configuring the ALMA Band 9 Local Oscillator to efficiently target [C II] over the redshift range spanned by our sample was a challenging factor in the design of our experiment. Efficient programs capable of observing multiple targets with minimal baseband tunings are optimal for taking advantage of limited high-frequency ALMA observing time. To maximize sample size while minimizing overhead, we manually configured each spectral window within the Band 9 constraints to cover [C II] in multiple galaxies in a given ALMA Science Goal.
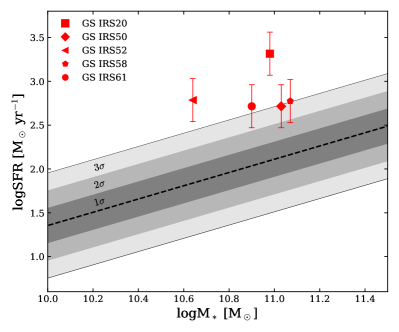
Most of the galaxies in our sample have robust stellar masses constrained by deep HST and Spitzer photometry. Galaxies in our sample are high mass, LogMM, and dusty, as evidenced by Spitzer and Hershel photometry. Figure 1 shows the star-forming main-sequence (MS) of galaxies at taken from Speagle et al. (2014). Our sample lies above the SFMS, with SFMS (the observed SFR over the MS SFR for the same stellar mass) between dex for most galaxies in our sample and as high as dex in GS IRS20, well within the starburst domain. Table 1 summarizes global properties for galaxies in our sample.
2.2 Multiwavelength Observations
Our sources are in ECDFS and were selected to have mid-IR spectroscopy from the Spitzer IRS (Fadda et al., 2010; Kirkpatrick et al., 2012, 2015). A full description of IRS observations, data reduction, and sample-selection can be found in Pope et al. (2008) and Kirkpatrick et al. (2012). The extracted spectra are shown in Figure 2 with simple fits to the mid-IR emission that we use to calculate ; more sophisticated model fits are employed to measure PAH line luminosities (see Appendix A). In addition to Spitzer IRS spectra, photometry from Herschel (PACS and SPIRE), and Spitzer (IRAC and MIPS) is available for all targets (see Kirkpatrick et al. 2015 for details).
ECDFS includes the GOODS-S field, which was covered by the Cosmic Assembly Near-IR Deep Extragalactic Legacy Survey (CANDELS; Grogin et al. 2011; Koekemoer et al. 2011), providing deep WFC3/IR imaging for five out of six galaxies in our sample. We downloaded the H160 and field maps, and correct for the known systematic astrometric offset of in RA and in DEC relative to ALMA’s astrometry in GOODS-S (Elbaz et al., 2018). Thumbnail images for our sample are shown in Figure 3. We also matched our galaxies to visual morphological classifications presented in Kartaltepe et al. (2015) to assess the incidence of mergers in the sample.
2.3 ALMA Observations and Data Processing
We carried out ALMA Band 9 observations of our targets during Cycle 5 (PI A. Pope, Project ID: 2017.1.01347.S) targeting [C II] emission at restframe m. For the range of redshifts in our sample, [C II] is redshifted to an observed frequency of GHz. We estimated integration times necessary to detect the [C II] line at for galaxies in our sample by assuming a conservative L/LIR ratio of 0.002 and [C II] line width of 300 km s-1, characteristic of existing [C II] detections galaxies prior to our observations (Stacey et al., 2010). The minimum predicted [C II] flux for all galaxies in the sample was 15 Jy km s-1, which we used to set the integration time for each observation by requiring a line detection, or equivalently, a sensitivity of 5 mJy over 300 km s-1 bandwidth.
To avoid resolving out [C II] emission at , we requested an angular resolution of . The observations took place in July 2018 in ALMA configuration C43-1 which has an angular resolution of at 650 GHz and maximum recoverable scale of , corresponding to kpc at . The expected radii of sub-mm and HST H160 emission in star-forming galaxies is kpc (e.g., Fig. 3, Zanella et al. 2018; Calistro Rivera et al. 2018; Lang et al. 2019), so it is unlikely that our observations are missing flux on large scales due to interferometric spatial filtering. Six galaxies in our proposal were observed for minutes on-source, achieving the target sensitivity of 5 mJy over 300 km s-1 bandwidth at a native resolution of 31.250 MHz (13.6 km s-1) which was later re-binned to lower spectral resolutions.
The data were reduced using the standard ALMA pipeline in CASA v5.1.1-5 (McMullin et al., 2007). We first imaged the data using tclean with Briggs weighting in continuum-mode, iteratively adjusting the robust parameter to maximize the ratio of peak continuum emission to map RMS. We extracted peak and integrated continuum flux densities through elliptical apertures which were set by fitting a 2D Gaussian function to the bright continuum emission in each observation. We detect continuum emission at representative frequencies of GHz in all of our targets at signal-to-noise (SNR) between . After verifying the presence of underlying continuum, we created a linear continuum model in the -plane, taking care to mask out high-amplitude visibilities that could correspond to potential line emission. Next, we continuum-subtracted the ALMA cubes in the -plane and imaged the spectral windows with tclean and Briggs weighting using . Final continuum measurements, ALMA beam characteristics, and spectral line statistics are given in Table 2.
| Continuum Maps | ||||||||
|---|---|---|---|---|---|---|---|---|
| Target | Beam FWHM | aa Effective wavelength of collapsed ALMA Band 9 cube. | rms | Peak Flux | Integrated Flux | bb The probability of observing the target’s redshifted [C II] line given all redshift uncertainty and the ALMA Band 9 spectral window configuration. See Equation B1 in Section 3.3. | F[CII]cc [C II] line flux. Upper limits are and given for each galaxy, although values in parenthesis are considered unreliable given the low probability of having observed the line. | |
| [arcsec] | [m] | [mJy/beam] | [mJy/beam] | [mJy/beam] | [kpc] | [mJy] | ||
| GS IRS20 | 0.51 0.37 | 466.60 | 0.87 | 1.81 | 0.68 | |||
| GS IRS46 | 0.74 0.66 | 456.95 | 0.54 | 2.63 | 0.56 | () | ||
| GS IRS50 | 0.78 0.67 | 465.07 | 0.41 | 2.72 | 0.29 | () | ||
| GS IRS52 | 0.63 0.51 | 444.77 | 0.10 | 2.15 | 0.01 | ( ) | ||
| GS IRS58 | 0.93 0.86 | 456.95 | 0.13 | 3.36 | 0.22 | () | ||
| GS IRS61 | 0.70 0.54 | 441.62 | 0.95 | 2.34 | 0.93 |
3 Analysis
3.1 [C II] Detection in GS IRS20
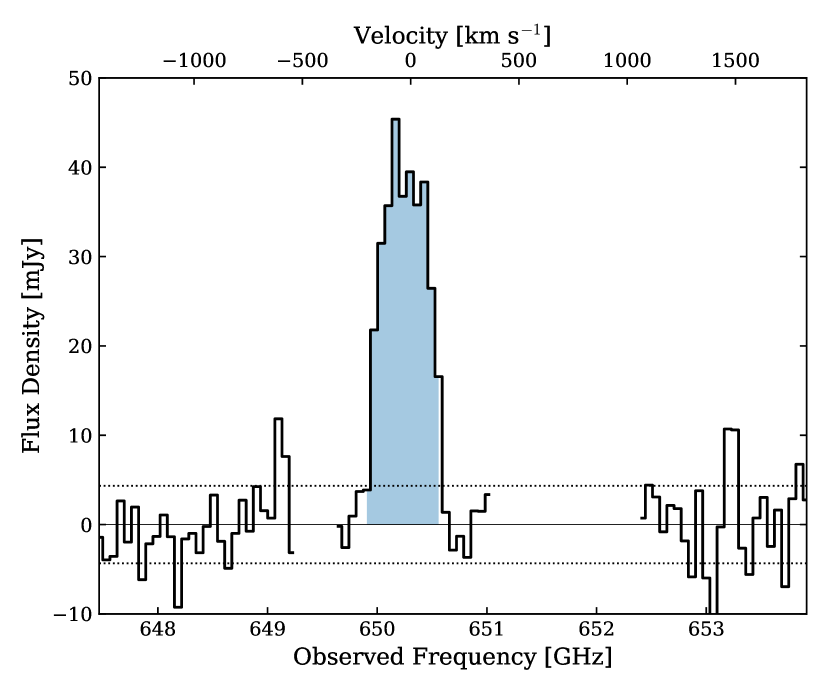
Whereas the dust continuum is clearly detected with ALMA for all 6 galaxies (red contours in Fig. 3), [C II] 158m emission is clearly detected in one of six galaxies in the sample, GS IRS20, at an observed frequency of 650.2505 GHz. This corresponds to a redshift of , in excellent agreement with the PAH-derived redshift: .
We imaged the cube in 30 km s-1 bins, and extracted a spectrum through an elliptical aperture with FWHM and centroid taken from a 2D Gaussian fit to continuum emission. Figure 4 shows the detection of [C II] in GS IRS20’s ALMA Band 9 spectrum. Gaps in spectral coverage are the result of limitations when configuring ALMA’s spectral windows. We integrated the line over the frequency range where emission rose above the continuum level and measured a flux density of Jy km s-1 at a SNR of and line velocity width of km s-1. Next, we calculated the [C II] line luminosity L in solar units following Carilli & Walter (2013):
| (1) |
where is the luminosity distance in Mpc, and is the observed frequency of the line in GHz. From the Band 9 spectrum, we calculate in GS IRS20, the highest SNR detection of [C II] emission in a galaxy to date. From a collapsed ALMA data cube containing only line emission, we find that [C II] in GS IRS20 is marginally resolved with a spatial FWHM of , corresponding to kpc at .
3.2 [C II] Line Searches and Upper Limits
No [C II] emission lines were obvious in the ALMA cubes of GS IRS46, GS IRS50, GS IRS52, GS IRS58, and GS IRS61. To search for marginally detected emission lines, we used a circular aperture with radius to extract a 50 km s-1 spectrum centered on the source’s dust continuum position. Next, we extracted additional spectra through the same circular apertures offset by from the source’s center at various angles, as optical light, dust continuum and [C II] emission can be spatially offset from one another in high redshift ULIRGs (e.g., Zanella et al. 2018; Calistro Rivera et al. 2018). From the set of extracted spectra, we searched each spectral window for the presence of three channels greater than the local rms. No marginally-significant line emission was discovered in this manner, or in stacks of the extracted spectra.
Given that 83% of our observations yielded non-detections, and no data was discarded because of poor atmospheric transmission, two explanations are possible. Either the observations were not deep enough to detect [C II] and an upper limit may be placed on L; or, the line was missed by our ALMA bandpass tunings. To determine which observations can yield a secure upper limit on L, we calculate : the probability our ALMA tunings covered the [C II] line given all redshift uncertainties and the comparatively narrow bandpass widths. The technique adopted for calculating is described in detail in Appendix Section B. In summary, we integrate redshift probability distribution functions in spectral domains with ALMA coverage. We found this detailed analysis to be crucial for interpreting the data. Table 2 includes values of for all targets.
Amongst the non-detections, only GS IRS61 has . For this galaxy, we first calculate the rms over a spectrum at 50 km s-1 resolution (rms50), extracted from an aperture centered on the dust continuum. Then, we calculate the upper limit on the line luminosity using Equation 1 with rms50), assuming km s-1 as is observed in GS IRS20. Our upper limits for GS IRS61 on L are summarized in Table 2, and could be a factor 1.8 (0.25 dex) larger than what is reported if we assume a more extreme km s-1, greater than the noise-weighted average of km s-1 as observed in [C II]-emitters at (e.g., the sample of Gullberg et al. 2015).
3.3 Morphology
In all of our observations, dust continuum emission is marginally resolved: the major and minor axes of 2D Gaussian fits to dust emission are equal to , slightly greater than the ALMA beam in all cases. We use these size measurements to calculate , the radius containing 50% of the total continuum flux at the effective rest-frame wavelengths (approximately m) of our observations. Table 2 includes values of , which we use to calculate IR surface densities. Given that the extent of dust continuum is marginally greater than the ALMA beam in all cases, our measurements of may be thought of as upper limits.
Our ability to distinguish substructure in the ALMA maps is limited; however, extended H160 emission in the HST thumbnails of GS IRS20, GS IRS50 and GS IRS58 suggests disturbed, perhaps merger-driven, morphologies in some cases. We matched our sources to the morphological classification catalog of Kartaltepe et al. (2015) to determine the incidence of mergers in our sample. Each of our targets had the maximum 68 classifications per galaxy. GS IRS20 is considered to be a merger by 80% of classifiers, and irregular by 100%, consistent with its position above the galaxy main sequence (Fig. 1), and the presence of faint extended H160 emission to the North-East, reminiscent of a tidally disrupted stellar population. Dust continuum and [C II] emission in GS IRS20 are co-spatial and coincide with the H160 maximum.
The rest of the sample was not classified as mergers, and GS IRS61 is classified as a spheroid by the full set of classifiers. The spatial extent of H160-band and dust continuum in GS IRS61 is kpc (FWHM), making this galaxy extremely compact. GS IRS46 is offset from the HST/ACS z-band map by after correcting for the astrometry offset between HST and ALMA (see Section 2.2). This corresponds to kpc physical offset between the detected stellar light and dust continuum emission in this galaxy. Given the uncertainty introduced by this offset, we do not report a stellar mass or show optical data points for this dusty galaxy.
3.4 Comparison Samples
Since we have selected our sample to include only star-formation dominated systems, we emphasize literature comparison samples with comparable selections (EWm, Stierwalt et al. 2014). For comparison with local (U)LIRGs, we use mid- and far-IR spectral line measurements from Díaz-Santos et al. (2013, 2014, 2017) and Stierwalt et al. (2014) for galaxies in the Great Observatories All Sky LIRG Survey (GOALS; Armus et al. 2009). To contextualize PAH and [C II] line luminosities at lower LIR, we also compare our data to the intermediate 5 mJy Unbiased Spitzer Extragalactic Survey (5MUSES; Wu et al. 2010), nearby galaxies from Sargsyan et al. (2014), Magdis et al. (2014), and Ibar et al. (2015). To characterize the landscape of [C II] observations at , we also compare our [C II] measurements to galaxies with data from ALMA, APEX, or Herschel FTS (Ivison et al., 2010; Valtchanov et al., 2011; Schaerer et al., 2015; Gullberg et al., 2015; Zanella et al., 2018; Hashimoto et al., 2018; Rybak et al., 2019). Prior observations of both PAH and [C II] in the same galaxy at are limited to a handful of systems observed with Spitzer and the Redshift () and Early Universe Spectrometer (ZEUS) on the Caltech Submillimeter Observatory (CSO) (Stacey et al., 2010; Brisbin et al., 2015).
For GOALS, 5MUSES and the ZEUS/CSO [C II] sample, 6.2m luminosities were derived using PAHFIT (Smith et al., 2007) or CAFE (Marshall et al., 2007). It has been shown that PAHFIT-derived PAH line luminosities are greater than the those produced via continuum fitting methods by a factor of for L6.2μm and L11.3μm (e.g., Sajina et al. 2007; Smith et al. 2007; Pope et al. 2008). This is because PAHFIT is able to measure line emission in extended Lorentzian wings whereas continuum fitting methods do not. The Spitzer IRS spectra do not have sufficient SNRs to use PAHFIT reliably, so we instead measure PAH lines using a continuum fitting technique described in Appendix Section A. In summary, we fit a continuum + line model to isolated m and m regimes allowing the line strength, and galaxy redshift to vary. We also re-measure PAH luminosities in GOALS star-forming galaxies using our method, and divide PAHFIT values by a statistical conversion factor of 1.6 and 2.3 for L6.2μm and L11.3μm respectively to match our quantities derived at higher redshift.
The GOALS sample is nearby and resolved by the Spitzer IRS slit, which is centered on the nuclear region of each galaxy and will not capture the total mid-IR continuum and PAH flux (Armus et al., 2009; Stierwalt et al., 2013). For fair comparison with high- galaxies that are completely covered by the IRS slit, we correct the PAH line fluxes of GOALS using slit-corrections in Stierwalt et al. (2014) determined from the ratio of total Spitzer IRAC 8 m flux to total IRS 8 m flux. These corrections have a median value of 1.14 and a negligible impact on the average value of GOALS galaxies in the diagnostic plots.
3.5 SED Fits to near-IR through sub-mm Photometry
Near-IR through sub-mm photometry are shown in Figure 5. For comparison, we overplot the average SED of star-forming galaxies from Kirkpatrick et al. (2015), scaled to best match the observations. The excellent agreement at m is due to the fact that our galaxies are part of the sample used in generating the Kirkpatrick et al. (2015) templates, which were normalized in the mid-IR.
To calculate total IR luminosities, we fit a two-temperature modified blackbody + power-law model between the IRS spectra at rest wavelengths above m out to the far-IR photometry, motivated by Kirkpatrick et al. (2015) who find that a two-temperature model yields good fits to the far-IR SEDs of (U)LIRGs. For all fits we keep the dust emissivity fixed to a value of , and the temperature of the cold dust component fixed at T K corresponding to the average value of galaxies in the Kirkpatrick et al. (2015) sample with . From the fits, we measure LIR and the fraction of IR emission originating from the cold dust component (Lcold/LIR). Table 3 reports best-fit values for Twarm, the modified-Blackbody temperature of the warm dust component, and Lcold with their associated uncertainties for GS IRS20 and GS IRS61. GS IRS46 and GS IRS52 do not have rest-frame photometry between m, so we determine a best-fit template from the Kirkpatrick et al. (2015) library by matching to the available observations above rest-frame m. The scale-factors for each template are 11.7 and 2.6 in GS IRS46 and GS IRS52 respectively. We then integrate the scaled Kirkpatrick et al. (2015) template to calculate LIR in these two galaxies.
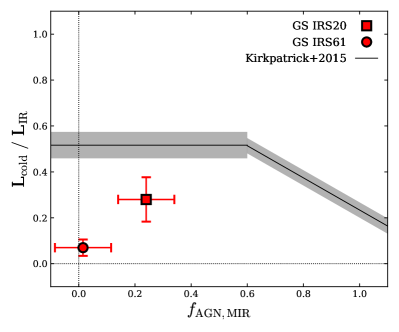
Models fits are shown in Figure 5 as dashed black lines. Kirkpatrick et al. (2015) find that Lcold/LIR on average for (U)LIRGs with . In GS IRS20, the one galaxy where [C II] was detected at high significance, and GS IRS61, the target with a secure [C II] upper limit, we measure Lcold/LIR and respectively, at the extreme lower end of the distribution for galaxies of similar and LIR (Figure 6). GS IRS20 and GS IRS61 deviate from the mean of the Kirkpatrick et al. (2015) sample by and respectively. Both systems have Twarm comparable to stacked templates of similar (Table 3), indicating that low Lcold/LIR is driven by an increase in the warm dust content of these two galaxies, and not a rise in the warm dust temperature.
4 Results
4.1 [C II] Line Luminosities
Of six galaxies targeted with ALMA, we only detect the 158m [C II] fine-structure line in one galaxy, GS IRS20, the most IR-luminous source in our sample. For one other galaxy in our sample, GS IRS61, the [C II] line was reliably covered by our ALMA observations (). For the other targets, our ALMA observations have a probability that we missed the redshifted [C II] line given prior redshift uncertainties and the sparse frequency coverage of ALMA spectral windows in Band 9. For the remainder of the paper we only include GS IRS20 and GS IRS61 in any analysis that involves [C II].
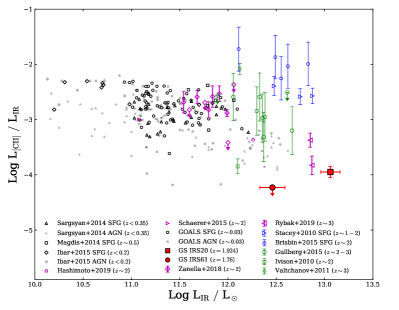
Figure 7 shows the [C II] deficit for low-redshift (U)LIRGs and star-forming galaxies at from this sample and the literature. We note that the number of IR-luminous galaxies at with [C II] detections is growing222E.g., Gallerani, S. et al. 2012; Walter et al. 2012; Riechers et al. 2013; Bussmann et al. 2013; Rawle et al. 2014; De Breuck et al. 2014; Maiolino et al. 2015; Capak et al. 2015; Oteo et al. 2016; Pentericci et al. 2016; Carniani et al. 2017; Jones et al. 2017; Matthee et al. 2017; Smit et al. 2018; Carniani et al. 2018; Gullberg et al. 2018; Decarli et al. 2018; Hashimoto et al. 2018; Le Fèvre et al. 2019; Tadaki et al. 2019; Hashimoto et al. 2019; however, we restrict our current analysis of the high landscape to to focus on galaxy properties near the cosmic star-formation rate density peak. The ratio of L to LIR in GS IRS20 is comparable to other ALMA [C II] detections from Rybak et al. (2019) and possibly consistent with the extrapolation of the low [C II]-deficit to . GS IRS61 is dex below GOALS star-forming galaxies of .
There is a significant offset on the order of dex between L/LIR at found with ALMA and those reported by Stacey et al. (2010) and Brisbin et al. (2015) using ZEUS/CSO (blue in Fig. 7). The spectral resolution of ZEUS is km s-1, comparable to the expected line-width of [C II] emission in some cases, making the flux measurements sensitive to the number of spectral pixels included when integrating a low SNR line. We re-calculate all ZEUS/CSO [C II] luminosities using only the peak pixel flux assuming a line-width of km s-1. After these corrections, the dex offset between ALMA and ZEUS observations in SFGs persists. There are multiple factors that could contribute to this offset, including physical variations in [C II]/LIR with star-formation rate surface density (e.g., Smith et al. 2017; Díaz-Santos et al. 2017), or observational limitations such as large beam sizes, lower spectral resolution, and flux calibration uncertainties on the order of 30% (Brisbin et al., 2015).
| Target | Tcold [K] | Twarm [K] | Lcold/LIR |
|---|---|---|---|
| GS IRS20 | (fixed)aaTcold was fixed in the SED fits of both GS IRS20 and GS IRS61 to the average of galaxies in the Kirkpatrick et al. (2015) sample with | ||
| GS IRS61 | (fixed)aaTcold was fixed in the SED fits of both GS IRS20 and GS IRS61 to the average of galaxies in the Kirkpatrick et al. (2015) sample with | ||
| MIR0.0bbEmpirical templates from Kirkpatrick et al. (2015) of comparable to GS IRS20 and GS IRS61. MIR0.0 and MIR0.2 correspond to and respectively. | |||
| MIR0.2bbEmpirical templates from Kirkpatrick et al. (2015) of comparable to GS IRS20 and GS IRS61. MIR0.0 and MIR0.2 correspond to and respectively. |
4.2 PAH Properties
The relationship between PAH emission and dust emission evolves with redshift and is likely related to a number of factors, including , SFR, and the number of PDRs per unit molecular gas mass (Smith et al., 2007; Pope et al., 2013). Star-forming galaxies in our sample at have 6.2 m PAH luminosities dex brighter than local (U)LIRGs of comparable LIR after accounting for the differences in L6.2μm measurement techniques (see Section 3.4), but follow a deficit in PAH emission towards higher LIR whose magnitude of decline is equal to or greater than the deficit between other far-IR fine-structure lines and LIR (Pope et al., 2008, 2013; Sajina et al., 2008; Graciá-Carpio et al., 2011; Stierwalt et al., 2014; Shipley et al., 2016; Cortzen et al., 2019). In addition to being a function of LIR, L6.2μm/LIR also changes with (e.g. Pope et al. 2013), as demonstrated in Figure 8 (Left) which shows the ratio of L6.2μm to LIR for low- and high- star-forming galaxies. Galaxies at in our sample are brighter in LIR by a factor of dex compared to low- (U)LIRGs of comparable L6.2μm/LIR; changes in either/both of L6.2μm and LIR could drive the difference between low-redshift and galaxies in Fig. 8. In any case, this trend persists if we instead use the ratio of 11.3 m PAH luminosity to LIR as well as values for L6.2μm in GOALS measured using our method described in Section A.
Díaz-Santos et al. (2017) show that the IR surface density is a good predictor of physical PDR conditions such as gas density and incident radiation field strength. Furthermore, spatially resolved studies of nearby and star-forming galaxies have shown the star-formation rate surface density () to be a major driver of the [C II]-deficit (Díaz-Santos et al., 2014; Smith et al., 2017; Rybak et al., 2019). In light of these results, and without spatial information at shorter wavelengths more aptly suited for tracing , we calculate LIR, the effective IR surface density using as measured with ALMA for our sample and Herschel PACS in GOALS. Figure 8 (Right) demonstrates that the offset between high- and low- galaxies in L6.2μm/LIR disappears when plotted against .
4.3 The Ratio of [C II] to PAH Luminosity
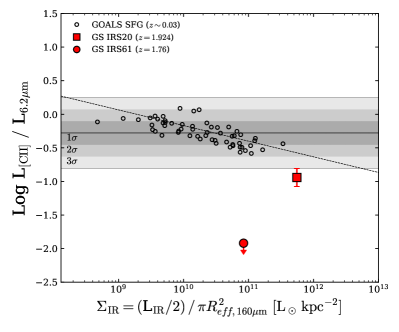
Figure 9 shows L/L6.2μm as a function of for our sample, and local (U)LIRGs. GOALS star-forming galaxies (EWm) have a tight ratio of L/L6.2μm with a dispersion of 0.18 dex, less than the dex dispersion observed in both L/LIR and L6.2μm/LIR. We fit a linear relation to star-forming GOALS galaxies on Figure 9, and find that L/L6.2μm and anti-correlate with a slope of and zero-point . Although high-redshift observations remain limited by small sample statistics, the spread in L/L6.2μm between GS IRS20 and GS IRS61 at is 0.98 dex, five times greater than the dispersion of local star-forming (U)LIRGs, an observation that holds regardless of how the PAH luminosities are measured in GOALS (see Section 3.4).
GS IRS20 and GS IRS61 are and dex respectively below the mean of L/L6.2μm observed in GOALS star-forming galaxies, after accounting for the differences in how the PAHs were measured. GS IRS20 is possibly consistent with the extrapolation of the low negative trend between L/L6.2μm and beyond the most compact GOALS star-forming galaxy; however, this cannot explain the extremely low ratio observed in GS IRS61. GS IRS61 shows no indication of a deeply buried AGN (Figure 2), and there is a low probability that we missed the redshifted [C II] line (see Section 3.2). The dust continuum is marginally more extended than the ALMA beam and would have to be extraordinarily compact ( would have to increase by orders of magnitude) to be consistent with the extrapolated low trend. For these reasons, GS IRS61 is likely a highly unusual source when compared to low star-forming galaxies of comparable .
If we assume that the relevant physical parameters of the galaxies are drawn from the same distribution that is observed in GOALS, then GS IRS20 and GS IRS61 would be and below the low mean. The likelihood of observing two galaxies at and from the norm is . Therefore, the offset in L/L6.2μm between low- (U)LIRGs and what we measure in our sample may relate to changes in the physical ISM conditions.
5 Discussion
5.1 PAH Heating vs. Far-IR Cooling
We find a difference in the ratio of [C II] to PAH emission between local ULIRGs and observations of two dusty star-forming galaxies including one upper limit (Fig. 9), which could be due to changes in heating and cooling mechanisms. As opposed to being scaled up versions of nearby star-forming galaxies, starbursts at earlier times may exhibit evolution in their ISM conditions. While the behavior of both PAH and [C II] changes at a low metallicity (Shivaei et al., 2017; Croxall et al., 2017), we do not expect this to affect our massive (MM) galaxies given the mass-metallicity relation (Sanders et al., 2015).
PAHs and other small grains are important sources of photoelectrons in PDRs (e.g., Bakes & Tielens 1994), and the ratio of far-IR line to PAH emission is sensitive to the photoelectric heating efficiency () of the PDR gas. As noted by Helou et al. (2001), LPAH (or L6.2μm) may be more appropriate normalization factors for L than LIR given the direct relationship with :
| (2) |
where following Croxall et al. (2012), and represent the relative contribution of the two principal cooling channels to the total gas cooling. is the total gas heating via photoelectrons, and the total dust heating accounted for by PAHs. Cooling from other far-IR such as [C I] and [Si II] are assumed to be negligible (i.e., ).
Assuming that the 6.2m PAH feature linearly scales with total PAH luminosity (e.g., Smith et al. 2007), and the fraction of [C II] emission originating from PDRs is roughly constant, then the ratio L/L6.2μm probes the difference of photoelectric efficiency and normalized cooling via [O I]. Knowing that the ratio of [O I] emission to [C II] emission of PDR origin varies by an order of magnitude in nearby (U)LIRGs (Díaz-Santos et al., 2017), the location of GS IRS20 and GS IRS61 on Fig. 9 could be interpreted as evidence for enhanced [O I] cooling in these galaxies if the total is constant. Díaz-Santos et al. (2017) demonstrate that [O I]/[C II] correlates with gas and dust temperature within PDRs, and [O I]/[C II] where dust temperatures exceed K. Indeed, warm-dust blackbodies (T K) dominate the IR SEDs of both GS IRS20 and GS IRS61 (Lcold/LIR, Table 3), consistent with enhanced PDR cooling through [O I] emission. Moreover, our sample has high compared to the average of GOALS (Fig. 8 Right), implying more star-formation in smaller volumes. In such physical conditions, PDR densities are expected to be higher and exposed to more intense radiation fields where [O I] naturally arises as the dominant cooling channel (Díaz-Santos et al., 2017). If the positions of GS IRS20 and GS IRS61 on Fig. 9 are solely due to enhanced [O I] cooling (constant), then we calculate L L⊙ and L L⊙ for these two galaxies respectively in order to bring both in line with the GOALS sample. In this scenario, L/L in GS IRS20 and [O I] dominates far-IR line cooling in both galaxies.
Alternatively, low L/L6.2μm could indicate a low by Equation 2 if [O I] emission is not significantly enhanced in GS IRS20 and/or GS IRS61. We speculate that a decrease in the photoelectric efficiency in high- dusty star-forming galaxies could play a role in enhancing star-formation rates compared to the galaxy main-sequence by reducing the coupling efficiency between interstellar radiation fields and gas heating. In other words, the colder ISM phases become less susceptible to temperature increases via stellar feedback as the reservoir of electrons in PAHs is diminished. Consequently, galaxies above the main-sequence would not exhibit strong far-IR line cooling at higher star-formation rates, as has been observed locally and tentatively at high (Díaz-Santos et al., 2017; Zanella et al., 2018). A comprehensive study of far-IR fine-structure emission lines combined with mid-IR PAH spectra is needed to test this hypothesis, and the nature of gas heating and cooling at will be a function of , , and . Systematically low in dusty star-forming galaxies at would be associated with [O I]/[C II] in a statistical sample controlled for , whereas [O I]/[C II] would favor higher density PDRs with more [O I] cooling. These far-IR cooling line ratios will be key for accessing the physical conditions in which most of the Universe’s stellar mass was formed.
5.2 Differences between GS IRS20 and GS IRS61
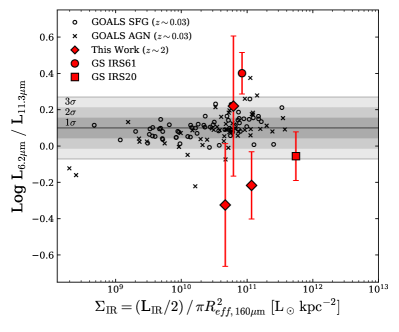
The data in hand portrays an interesting dichotomy of ISM conditions between GS IRS20 and GS IRS61. A dex difference in L/L6.2μm exists between the two galaxies, and is likely a function of PAH ionization state and therefore . Whereas the 6.2 m feature traces ionized PAHs, the 11.3 m complex arises from neutral PAHs yet to lose their surface electrons (Tielens, 2008). As a result, the ratio of L6.2μm/L11.3μm is sensitive to the PAH ionization fraction in a galaxy, and also changes in the grain size distribution as observed near the nuclei of AGN (Smith et al., 2007; Tielens, 2008). Figure 10 shows this ratio as a function of for GOALS and our sample at . GS IRS20 has a PAH line ratio near the local average, as may be expected if star-formation in this merging galaxy is proceeding in a comparable manner to what is found in GOALS, which are mostly mergers themselves. On the other hand, GS IRS61 has the highest ratio of L6.2μm/L11.3μm amongst galaxies at low- and high-redshift. This is consistent with the location of GS IRS61 in Fig. 9: an increase in PAH ionization would lower , decoupling PAH and [C II] emission to produce the extreme deficit in L/L6.2μm observed.
The only low- galaxies within of GS IRS61 on Fig. 10 are a handful of GOALS AGN, and the ratio of L6.2μm/L11.3μm appears larger than most star-forming GOALS galaxies, even after correcting for PAH extinction (see Fig. 2 of Stierwalt et al. 2014). Whether or not this is common at high-redshift remains to be explored; however, the scatter in L6.2μm/L11.3μm we measure at is nearly three times larger than what is seen in the GOALS star-forming sample, although we note that error bars at higher are large. While both GS IRS20 and GS IRS61 have comparable far-IR colors, GS IRS61 has a lower Lcold/LIR (Fig. 6), indicating warmer dust conditions dominating the galaxy, consistent with low as larger dust grains absorb more of the incident radiation field in PDRs. The parameter space of PAH line ratios at cosmic noon has yet to be statistically explored, and may prove key for our understanding of dust properties and the link between stellar radiation fields and the ISM at the peak epoch of galaxy evolution.
5.3 Future Outlook
Testing the nature of gas heating and cooling in the ISM of high-redshift galaxies will be possible with future ALMA observations targeting [C II] in IRS sources. Mid-IR spectra are crucial for constraining , from which the properties of star-formation at high can be reliably characterized in the absence of or presence of an AGN. Spitzer’s cryogenic lifetime has ended, so the number of galaxies with available mid-IR spectra is currently limited. Future surveys with JWST/MIRI will re-open the mid-IR Universe at high spectral sensitivity.
Pending the launch of JWST, ALMA can continue targeting IRS galaxies to explore the relationship between [C II] and PAH emission as a function of LIR and . Understanding the intrinsic scatter in these relations will be crucial when designing efficient surveys that maximize the science potential of JWST, and key for understanding the physics of gas heating and cooling in the early Universe, which observations with future facilities like Origins Space Telescope333https://origins.ipac.caltech.edu/ or SPICA444https://spica-mission.org/ will revolutionize.
6 Summary and Conclusions
We have observed [C II] emission in a sample of star-forming galaxies with existing detections of PAH dust emission in order to explain the balance of heating and cooling in the ISM and how it may be different from . Our main conclusions are as follows :
-
1.
We detect the dust continuum near the peak of the IR SED (m) in all six targets. After correcting for known astrometry offsets between ALMA and HST, the position of the dust continuum emission coincides with the rest-frame optical light in all but GS IRS46. Our most luminous target GS IRS20 is classified as a merger and is a clear starburst on the main-sequence diagnostic diagram.
-
2.
We detect [C II] in one target, GS IRS 20 at high SNR of 34. The bright [C II] emission and interesting optical morphology makes this an excellent target for follow-up ALMA observations to study its gas dynamics at higher spatial resolution. We place a deep upper limit on L in one other galaxy, GS IRS61, after calculating the probability the redshifted [C II] line fell into our ALMA bandpass tuning. For other targets in our sample, our observations likely missed the galaxy’s [C II] line. Our galaxies follow the [C II]-deficit relation observed for nearby (U)LIRGs, as found by several other studies.
-
3.
As found in previous studies, our galaxies and other high- samples show decreasing L6.2μm/LIR with LIR. Star-forming galaxies at have more PAH emission per unit LIR compared to low star-forming galaxies of comparable LIR; however, this offset disappears when comparing L6.2μm/LIR in all galaxies as a function of IR surface density.
-
4.
We explore the balance of heating and cooling in the ISM by looking at the ratio of [C II] to PAH luminosity. For nearby (U)LIRGs, this ratio is relatively tight as a function of LIR. Our galaxies are low relative to this relation. This may be because of warmer environments, suppressed photoelectric efficiencies in PDR gas, and/or the importance of cooling from other far-IR lines such as [O I] at . GS IRS61, the galaxy with the lowest [C II]/PAH, shows evidence for high PAH ionization, consistent with inefficient gas heating in PDR regions.
We caution that our study shows that [C II] and PAH emission may not have a simple relation to LIR, and therefore SFR, in dusty star-forming galaxies. Further observations are needed to validate our results and test the ideas of warmer dust environments and additional cooling channels. These can be obtained by getting more [C II] detections of galaxies with existing PAH measurements from Spitzer/IRS or from future programs tracing the mid-IR and far-IR lines with JWST and ALMA.
Appendix A PAH-Derived redshifts and luminosities
In this section, we describe our method for measuring the PAH redshifts and luminosities that employs MCMC to fully capture the uncertainties. Spitzer IRS mid-IR spectra are shown in Figure 2, which we use to calculate the redshift probability distribution function and PAH line luminosities for galaxies in our sample. Rest frame mid-IR wavelengths are host to a diverse range of spectral features from rotational lines of molecular hydrogen to bending and stretching modes of PAH molecules. In the low SNR regime characteristic of high-redshift observations, only the brightest PAH features remain distinctly observable. These features are intrinsically broad with intensities well-fit by Lorentzian (Drude) profiles:
| (A1) |
where following the convention of Smith et al. (2007), specifies a given PAH complex with central wavelength , fractional full width at half maximum (FWHM) and central intensity . Lorentzian profiles are the theoretical spectrum for a classical damped harmonic oscillator, and carry more power in their extended wings compared to a Gaussian. As a result, individual line emission is difficult to separate from adjacent PAH features, as well as any underlying stellar and dust continuum (see Smith et al. 2007 for examples at low-redshift).
Owing to the number of blended line profiles between m, PAH flux densities in this wavelength domain are sensitive to the measurement technique (see Smith et al. 2007 for a thorough analysis). In particular, how the continuum around each PAH feature is estimated can lead to variations in measured line fluxes and equivalent widths by up to a factor of four (Sajina et al., 2007; Smith et al., 2007; Pope et al., 2008). For this reason, we focus our analysis on the 6.2m and 11.3m PAH luminosities, as these features are comparatively isolated from adjacent lines and trace the total PAH luminosity (LPAH) with low scatter in local and high- star-forming galaxies (Smith et al., 2007; Pope et al., 2008).
Inferring a redshift from PAH features at low SNR and low spectral resolution (R) is complicated by the many broad and blended PAH lines. Prior to our ALMA observations, redshifts were determined via the spectral decomposition model of Kirkpatrick et al. (2015) which fits mid-IR spectra with an AGN power-law component, a fixed star-forming galaxy PAH template, and dust extinction. This model works well for separating AGN and star formation components (i.e., calculating , Table 1), but does not always reproduce observed PAH intensities as demonstrated in Figure 11 (Left). Peak emission at line center places the most constraint on a galaxy’s systemic redshift. Therefore, we adopt a simpler model of Lorentzian profiles plus a power-law continuum to fit only the 6.2m and 11.3m PAH complexes. Using this technique, we leverage the relatively isolated lines to measure the target’s redshift. In the rest-frame, our model is
| (A2) |
where is the power-law scale factor and is the mid-IR spectral index. We assume a wavelength-dependent Milky Way dust attenuation law for the optical depth parameter (Weingartner & Draine, 2001). This assumption has minimal to no impact on our results given that the primary purpose of the power-law component is to approximate continuum emission in the vicinity of each PAH feature. The second term in Equation A2 sums over the various PAH complexes included in the fit, each described by a Lorentzian profile (Eq. A1).
To fit for and , we fix the central wavelengths of the m and m PAH features () and to their values derived in Smith et al. (2007). This implicitly assumes comparable dust grain properties between high- (U)LIRGs and the inner kpc regions of galaxies from the Spitzer Infrared Nearby Galaxies Survey (SINGS; Kennicutt et al. 2003) used to calibrate the PAH free-parameters. Many such features observed in low- star-forming galaxies are also seen in high- dusty systems, suggesting that the grain properties responsible for the intrinsically brightest PAH complexes (e.g., m, m, m, m) do not change between and today (Pope et al., 2013; Kirkpatrick et al., 2015). Although the 6.2 m peak can shift by m from target to target in the Milky Way, these variations are related to the illumination source and relatively stable for both individual and averaged H II regions and PDRs in the Milky Way which are expected to dominate mid-IR emission in star forming galaxies (Section 2.2.2 of Tielens 2008, van Diedenhoven et al. 2004).
We fit our model (Eq. A2) to each IRS spectrum using the Markov Chain Monte Carlo (MCMC) code emcee, an open-sourced package designed to minimize the number of tunable parameters embedded in a Markov Chain algorithm (Foreman-Mackey et al., 2013). We assume uniform priors on , , , and , and restrict the fit to spectral domains around the m and m PAH features (see cyan horizontal lines in Figure 2). The m and m features are unambiguous and readily identified by the code without confusion.
Once the fits have been run, we marginalize over all free parameters and extract from each MCMC chain a redshift posterior probability distribution function . We quote the redshift that maximizes the likelihood function as , and adopt uncertainties from the minimum and maximum redshifts within the 68th percentile of . Next, we use the local continuum around the 6.2 m and 11.3 m line to estimate L6.2μm and L11.3μm, following measurement methods used in the literature for direct comparison with published values (e.g., Uchida et al. 2000; Peeters et al. 2002; Pope et al. 2008, 2013). Error bars on L6.2μm and L11.3μm are derived using Monte Carlo analysis, whereby the observed spectrum is perturbed by pixel noise prior to re-calculating the line-flux and PAH feature luminosity. This process is repeated 1000 times, after which we quote the standard deviation of all iterations as the error. Final measurements and errors of , L6.2μm, and L11.3μm are provided in Table 1. We note that silicate absorption at m can potentially impact the 11.3m PAH feature shape and luminosity. There is little evidence for strong silicate absorption in the spectral decomposition shown in Fig. 2; however, the low SNR data is consistent with optical depths of the 9.7m feature . At this opacity, the 11.3m PAH feature strength is decreased by a factor of 1.4 at most (Smith et al., 2007), which is within the uncertainty of our measurements of L11.3μm.
Appendix B Calculating the probability of observing [C II] from total bandpass coverage
In this section, we consider the uncertainties on the redshifts coupled with the ALMA bandpass to calculate the probabilities of observing [C II] for each galaxy in our sample. This analysis is crucial before one can measure upper limits on [C II] from ALMA data containing frequency gaps in baseband coverage. In designing the ALMA Cycle 5 observations, redshifts were determined for each source by fitting a single star-forming PAH template to each galaxy. As demonstrated by Figure 11 (Left), this method insufficiently matches the brightest PAH emission compared to a Lorentzian profile technique. While both fitting approaches estimate a redshift within of each other corresponding to on average, differences on the order of can shift the [C II] line in or out of the ALMA spectral windows at the highest frequencies. For this reason, our observations may have missed [C II] in some galaxies.
To quantify , we take redshift posterior probability distributions from our MCMC fits to the IRS spectra (Section 3.1, Fig. 2) and from these, compute : the probability [C II] would be redshifted to a given frequency. Next, we integrate first over all frequencies, and then over the frequency domain covered by our bandpass tunings which is typically GHz between GHz not counting gaps between individual spectral windows. Thus, we quantitatively derive according to the following prescription:
| (B1) |
where the summation treats each ALMA spectral window independently and avoids gaps in wavelength coverage. Figure 11 (Right) graphically demonstrates this technique for GS IRS61, the only galaxy in our observations where . Estimates of for all other targets are given in Table 2.
Additional redshift constraint from rest-frame optical spectroscopy can be used to improve the estimate of . In principle, we would multiply optical redshift posteriors with our MCMC-derived and integrate the product. We checked for optical spectroscopic redshifts by matching to catalogs from 3D-HST grism (Momcheva et al., 2016), VLT/FORS-2 (Vanzella et al., 2008), VANDELS (McLure et al., 2017), MUSE GTO surveys, and ALESS (Danielson et al., 2017). GS IRS50 and GS IRS58 have grism spectroscopic redshifts consistent with but with higher uncertainty. GS IRS20 and GS IRS61 have C-grade VLT/FORS-2 spectra, and grism redshifts completely inconsistent with the PAH features in both galaxies by , greater than 10 times the uncertainty on their PAH-derived redshifts. GS IRS46 and GS IRS52 do not have optical spectra. In summary, no significantly accurate optical spectroscopic redshifts () consistent with were found that changed our results using only PAH fits.
| Target | 3.6m | 4.5m | 5.8m | 8m | 16m | 24m | 70m | 100m | 160m | 250m aaConfusion noise for 250 ,, 350 m and 500 m is mJy (see Nguyen et al. 2010 for exact values) and has been included in all SED fits. | 350maaConfusion noise for 250 ,, 350 m and 500 m is mJy (see Nguyen et al. 2010 for exact values) and has been included in all SED fits. | 500maaConfusion noise for 250 ,, 350 m and 500 m is mJy (see Nguyen et al. 2010 for exact values) and has been included in all SED fits. |
|---|---|---|---|---|---|---|---|---|---|---|---|---|
| [Jy] | [Jy] | [Jy] | [Jy] | [Jy] | [Jy] | [Jy] | [mJy] | [mJy] | [mJy] | [mJy] | [mJy] | |
| GS IRS20 | – | |||||||||||
| GS IRS46 | – | – | – | – | ||||||||
| GS IRS50 | – | |||||||||||
| GS IRS52 | – | – | – | |||||||||
| GS IRS58 | – | – | ||||||||||
| GS IRS61 | – |
References
- Armus et al. (2007) Armus, L., Charmandaris, V., Bernard-Salas, J., et al. 2007, ApJ, 656, 148, doi: 10.1086/510107
- Armus et al. (2009) Armus, L., Mazzarella, J. M., Evans, A. S., et al. 2009, PASP, 121, 559, doi: 10.1086/600092
- Bakes & Tielens (1994) Bakes, E. L. O., & Tielens, A. G. G. M. 1994, ApJ, 427, 822, doi: 10.1086/174188
- Brandl et al. (2006) Brandl, B. R., Bernard-Salas, J., Spoon, H. W. W., et al. 2006, ApJ, 653, 1129, doi: 10.1086/508849
- Brisbin et al. (2015) Brisbin, D., Ferkinhoff, C., Nikola, T., et al. 2015, ApJ, 799, 13, doi: 10.1088/0004-637X/799/1/13
- Bussmann et al. (2013) Bussmann, R. S., Pérez-Fournon, I., Amber, S., et al. 2013, ApJ, 779, 25, doi: 10.1088/0004-637X/779/1/25
- Calistro Rivera et al. (2018) Calistro Rivera, G., Hodge, J. A., Smail, I., et al. 2018, ApJ, 863, 56, doi: 10.3847/1538-4357/aacffa
- Capak et al. (2015) Capak, P. L., Carilli, C., Jones, G., et al. 2015, Nature, 522, 455, doi: 10.1038/nature14500
- Carilli & Walter (2013) Carilli, C. L., & Walter, F. 2013, ARA&A, 51, 105, doi: 10.1146/annurev-astro-082812-140953
- Carniani et al. (2018) Carniani, S., Maiolino, R., Smit, R., & Amorín, R. 2018, ApJ, 854, L7, doi: 10.3847/2041-8213/aaab45
- Carniani et al. (2017) Carniani, S., Maiolino, R., Pallottini, A., et al. 2017, A&A, 605, A42, doi: 10.1051/0004-6361/201630366
- Chary & Elbaz (2001) Chary, R., & Elbaz, D. 2001, ApJ, 556, 562, doi: 10.1086/321609
- Cormier et al. (2019) Cormier, D., Abel, N. P., Hony, S., et al. 2019, A&A, 626, A23, doi: 10.1051/0004-6361/201834457
- Cortzen et al. (2019) Cortzen, I., Garrett, J., Magdis, G., et al. 2019, MNRAS, 482, 1618, doi: 10.1093/mnras/sty2777
- Croxall et al. (2012) Croxall, K. V., Smith, J. D., Wolfire, M. G., et al. 2012, ApJ, 747, 81, doi: 10.1088/0004-637X/747/1/81
- Croxall et al. (2017) Croxall, K. V., Smith, J. D., Pellegrini, E., et al. 2017, ApJ, 845, 96, doi: 10.3847/1538-4357/aa8035
- Dale et al. (2009) Dale, D. A., Smith, J. D. T., Schlawin, E. A., et al. 2009, ApJ, 693, 1821, doi: 10.1088/0004-637X/693/2/1821
- Danielson et al. (2017) Danielson, A. L. R., Swinbank, A. M., Smail, I., et al. 2017, The Astrophysical Journal, 840, 78, doi: 10.3847/1538-4357/aa6caf
- De Breuck et al. (2014) De Breuck, C., Williams, R. J., Swinbank, M., et al. 2014, The Messenger, 156, 38
- Decarli et al. (2018) Decarli, R., Walter, F., Venemans, B. P., et al. 2018, ApJ, 854, 97, doi: 10.3847/1538-4357/aaa5aa
- Díaz-Santos et al. (2013) Díaz-Santos, T., Armus, L., Charmandaris, V., et al. 2013, ApJ, 774, 68, doi: 10.1088/0004-637X/774/1/68
- Díaz-Santos et al. (2014) —. 2014, ApJ, 788, L17, doi: 10.1088/2041-8205/788/1/L17
- Díaz-Santos et al. (2017) —. 2017, ApJ, 846, 32, doi: 10.3847/1538-4357/aa81d7
- Elbaz et al. (2018) Elbaz, D., Leiton, R., Nagar, N., et al. 2018, A&A, 616, A110, doi: 10.1051/0004-6361/201732370
- Fadda et al. (2010) Fadda, D., Yan, L., Lagache, G., et al. 2010, ApJ, 719, 425, doi: 10.1088/0004-637X/719/1/425
- Foreman-Mackey et al. (2013) Foreman-Mackey, D., Hogg, D. W., Lang, D., & Goodman, J. 2013, PASP, 125, 306, doi: 10.1086/670067
- Gallerani, S. et al. (2012) Gallerani, S., Neri, R., Maiolino, R., et al. 2012, A&A, 543, A114, doi: 10.1051/0004-6361/201118705
- Genzel et al. (2008) Genzel, R., Burkert, A., Bouché, N., et al. 2008, ApJ, 687, 59, doi: 10.1086/591840
- Genzel et al. (2015) Genzel, R., Tacconi, L. J., Lutz, D., et al. 2015, ApJ, 800, 20, doi: 10.1088/0004-637X/800/1/20
- Giavalisco et al. (2004) Giavalisco, M., Ferguson, H. C., Koekemoer, A. M., et al. 2004, ApJ, 600, L93, doi: 10.1086/379232
- Goldsmith et al. (2012) Goldsmith, P. F., Langer, W. D., Pineda, J. L., & Velusamy, T. 2012, ApJS, 203, 13, doi: 10.1088/0067-0049/203/1/13
- Graciá-Carpio et al. (2011) Graciá-Carpio, J., Sturm, E., Hailey-Dunsheath, S., et al. 2011, ApJ, 728, L7, doi: 10.1088/2041-8205/728/1/L7
- Grogin et al. (2011) Grogin, N. A., Kocevski, D. D., Faber, S. M., et al. 2011, The Astrophysical Journal Supplement Series, 197, 35, doi: 10.1088/0067-0049/197/2/35
- Gullberg et al. (2015) Gullberg, B., De Breuck, C., Vieira, J. D., et al. 2015, MNRAS, 449, 2883, doi: 10.1093/mnras/stv372
- Gullberg et al. (2018) Gullberg, B., Swinbank, A. M., Smail, I., et al. 2018, ApJ, 859, 12, doi: 10.3847/1538-4357/aabe8c
- Hashimoto et al. (2018) Hashimoto, T., Inoue, A. K., Tamura, Y., et al. 2018, arXiv e-prints, arXiv:1811.00030. https://arxiv.org/abs/1811.00030
- Hashimoto et al. (2019) Hashimoto, T., Inoue, A. K., Mawatari, K., et al. 2019, PASJ, 71, 71, doi: 10.1093/pasj/psz049
- Helou et al. (2001) Helou, G., Malhotra, S., Hollenbach, D. J., Dale, D. A., & Contursi, A. 2001, ApJ, 548, L73, doi: 10.1086/318916
- Houck et al. (2005) Houck, J. R., Soifer, B. T., Weedman, D., et al. 2005, ApJ, 622, L105, doi: 10.1086/429405
- Ibar et al. (2015) Ibar, E., Lara-López, M. A., Herrera-Camus, R., et al. 2015, MNRAS, 449, 2498, doi: 10.1093/mnras/stv439
- Ivison et al. (2010) Ivison, R. J., Swinbank, A. M., Swinyard, B., et al. 2010, A&A, 518, L35, doi: 10.1051/0004-6361/201014548
- Jones et al. (2017) Jones, G. C., Willott, C. J., Carilli, C. L., et al. 2017, ApJ, 845, 175, doi: 10.3847/1538-4357/aa7d0d
- Kartaltepe et al. (2015) Kartaltepe, J. S., Mozena, M., Kocevski, D., et al. 2015, ApJS, 221, 11, doi: 10.1088/0067-0049/221/1/11
- Kaufman et al. (1999) Kaufman, M. J., Wolfire, M. G., Hollenbach, D. J., & Luhman, M. L. 1999, ApJ, 527, 795, doi: 10.1086/308102
- Kennicutt (1998) Kennicutt, Robert C., J. 1998, ARA&A, 36, 189, doi: 10.1146/annurev.astro.36.1.189
- Kennicutt et al. (2003) Kennicutt, Robert C., J., Armus, L., Bendo, G., et al. 2003, PASP, 115, 928, doi: 10.1086/376941
- Kereš et al. (2009) Kereš, D., Katz, N., Fardal, M., Davé, R., & Weinberg, D. H. 2009, MNRAS, 395, 160, doi: 10.1111/j.1365-2966.2009.14541.x
- Kereš et al. (2005) Kereš, D., Katz, N., Weinberg, D. H., & Davé, R. 2005, MNRAS, 363, 2, doi: 10.1111/j.1365-2966.2005.09451.x
- Kirkpatrick et al. (2015) Kirkpatrick, A., Pope, A., Sajina, A., et al. 2015, ApJ, 814, 9, doi: 10.1088/0004-637X/814/1/9
- Kirkpatrick et al. (2012) Kirkpatrick, A., Pope, A., Alexander, D. M., et al. 2012, ApJ, 759, 139, doi: 10.1088/0004-637X/759/2/139
- Koekemoer et al. (2011) Koekemoer, A. M., Faber, S. M., Ferguson, H. C., et al. 2011, The Astrophysical Journal Supplement Series, 197, 36, doi: 10.1088/0067-0049/197/2/36
- Lang et al. (2019) Lang, P., Schinnerer, E., Smail, I., et al. 2019, arXiv e-prints, arXiv:1905.06960. https://arxiv.org/abs/1905.06960
- Laurent et al. (2000) Laurent, O., Mirabel, I. F., Charmandaris, V., et al. 2000, A&A, 359, 887. https://arxiv.org/abs/astro-ph/0005376
- Le Fèvre et al. (2019) Le Fèvre, O., Béthermin, M., Faisst, A., et al. 2019, arXiv e-prints, arXiv:1910.09517. https://arxiv.org/abs/1910.09517
- Lilly et al. (1996) Lilly, S. J., Le Fevre, O., Hammer, F., & Crampton, D. 1996, ApJ, 460, L1, doi: 10.1086/309975
- Liu et al. (2019) Liu, D., Schinnerer, E., Groves, B., et al. 2019, arXiv e-prints, arXiv:1910.12883. https://arxiv.org/abs/1910.12883
- Luhman et al. (2003) Luhman, M. L., Satyapal, S., Fischer, J., et al. 2003, ApJ, 594, 758, doi: 10.1086/376965
- Luhman et al. (1998) —. 1998, ApJ, 504, L11, doi: 10.1086/311562
- Madau & Dickinson (2014) Madau, P., & Dickinson, M. 2014, ARA&A, 52, 415, doi: 10.1146/annurev-astro-081811-125615
- Madau et al. (1996) Madau, P., Ferguson, H. C., Dickinson, M. E., et al. 1996, MNRAS, 283, 1388, doi: 10.1093/mnras/283.4.1388
- Magdis et al. (2014) Magdis, G. E., Rigopoulou, D., Hopwood, R., et al. 2014, ApJ, 796, 63, doi: 10.1088/0004-637X/796/1/63
- Maiolino et al. (2015) Maiolino, R., Carniani, S., Fontana, A., et al. 2015, MNRAS, 452, 54, doi: 10.1093/mnras/stv1194
- Malhotra et al. (1997) Malhotra, S., Helou, G., Stacey, G., et al. 1997, ApJ, 491, L27, doi: 10.1086/311044
- Malhotra et al. (2001) Malhotra, S., Kaufman, M. J., Hollenbach, D., et al. 2001, ApJ, 561, 766, doi: 10.1086/323046
- Marshall et al. (2007) Marshall, J. A., Herter, T. L., Armus, L., et al. 2007, ApJ, 670, 129, doi: 10.1086/521588
- Matthee et al. (2017) Matthee, J., Sobral, D., Boone, F., et al. 2017, ApJ, 851, 145, doi: 10.3847/1538-4357/aa9931
- McLure et al. (2017) McLure, R., Pentericci, L., & VANDELS Team. 2017, The Messenger, 167, 31
- McMullin et al. (2007) McMullin, J. P., Waters, B., Schiebel, D., Young, W., & Golap, K. 2007, in Astronomical Society of the Pacific Conference Series, Vol. 376, Astronomical Data Analysis Software and Systems XVI, ed. R. A. Shaw, F. Hill, & D. J. Bell, 127
- Momcheva et al. (2016) Momcheva, I. G., Brammer, G. B., van Dokkum, P. G., et al. 2016, ApJS, 225, 27, doi: 10.3847/0067-0049/225/2/27
- Muñoz & Oh (2016) Muñoz, J. A., & Oh, S. P. 2016, MNRAS, 463, 2085, doi: 10.1093/mnras/stw2102
- Nguyen et al. (2010) Nguyen, H. T., Schulz, B., Levenson, L., et al. 2010, A&A, 518, L5, doi: 10.1051/0004-6361/201014680
- Oteo et al. (2016) Oteo, I., Ivison, R. J., Dunne, L., et al. 2016, ApJ, 827, 34, doi: 10.3847/0004-637X/827/1/34
- Peeters et al. (2002) Peeters, E., Hony, S., Van Kerckhoven, C., et al. 2002, A&A, 390, 1089, doi: 10.1051/0004-6361:20020773
- Pentericci et al. (2016) Pentericci, L., Carniani, S., Castellano, M., et al. 2016, ApJ, 829, L11, doi: 10.3847/2041-8205/829/1/L11
- Pope et al. (2008) Pope, A., Chary, R.-R., Alexander, D. M., et al. 2008, ApJ, 675, 1171, doi: 10.1086/527030
- Pope et al. (2013) Pope, A., Wagg, J., Frayer, D., et al. 2013, ApJ, 772, 92, doi: 10.1088/0004-637X/772/2/92
- Rawle et al. (2014) Rawle, T. D., Egami, E., Bussmann, R. S., et al. 2014, ApJ, 783, 59, doi: 10.1088/0004-637X/783/1/59
- Riechers et al. (2013) Riechers, D. A., Bradford, C. M., Clements, D. L., et al. 2013, Nature, 496, 329, doi: 10.1038/nature12050
- Rigopoulou et al. (2014) Rigopoulou, D., Hopwood, R., Magdis, G. E., et al. 2014, ApJ, 781, L15, doi: 10.1088/2041-8205/781/1/L15
- Rybak et al. (2019) Rybak, M., Calistro Rivera, G., Hodge, J. A., et al. 2019, arXiv e-prints. https://arxiv.org/abs/1901.10027
- Sajina et al. (2007) Sajina, A., Yan, L., Armus, L., et al. 2007, ApJ, 664, 713, doi: 10.1086/519446
- Sajina et al. (2008) Sajina, A., Yan, L., Lutz, D., et al. 2008, ApJ, 683, 659, doi: 10.1086/589914
- Sanders et al. (2015) Sanders, R. L., Shapley, A. E., Kriek, M., et al. 2015, ApJ, 799, 138, doi: 10.1088/0004-637X/799/2/138
- Sargsyan et al. (2014) Sargsyan, L., Samsonyan, A., Lebouteiller, V., et al. 2014, ApJ, 790, 15, doi: 10.1088/0004-637X/790/1/15
- Schaerer et al. (2015) Schaerer, D., Boone, F., Jones, T., et al. 2015, A&A, 576, L2, doi: 10.1051/0004-6361/201425542
- Scoville et al. (2017) Scoville, N., Lee, N., Vanden Bout, P., et al. 2017, ApJ, 837, 150, doi: 10.3847/1538-4357/aa61a0
- Shipley et al. (2016) Shipley, H. V., Papovich, C., Rieke, G. H., Brown, M. J. I., & Moustakas, J. 2016, ApJ, 818, 60, doi: 10.3847/0004-637X/818/1/60
- Shivaei et al. (2017) Shivaei, I., Reddy, N. A., Shapley, A. E., et al. 2017, ApJ, 837, 157, doi: 10.3847/1538-4357/aa619c
- Smit et al. (2018) Smit, R., Bouwens, R. J., Carniani, S., et al. 2018, Nature, 553, 178, doi: 10.1038/nature24631
- Smith et al. (2007) Smith, J. D. T., Draine, B. T., Dale, D. A., et al. 2007, ApJ, 656, 770, doi: 10.1086/510549
- Smith et al. (2017) Smith, J. D. T., Croxall, K., Draine, B., et al. 2017, ApJ, 834, 5, doi: 10.3847/1538-4357/834/1/5
- Speagle et al. (2014) Speagle, J. S., Steinhardt, C. L., Capak, P. L., & Silverman, J. D. 2014, ApJS, 214, 15, doi: 10.1088/0067-0049/214/2/15
- Stacey et al. (2010) Stacey, G. J., Hailey-Dunsheath, S., Ferkinhoff, C., et al. 2010, ApJ, 724, 957, doi: 10.1088/0004-637X/724/2/957
- Stierwalt et al. (2013) Stierwalt, S., Armus, L., Surace, J. A., et al. 2013, ApJS, 206, 1, doi: 10.1088/0067-0049/206/1/1
- Stierwalt et al. (2014) Stierwalt, S., Armus, L., Charmandaris, V., et al. 2014, ApJ, 790, 124, doi: 10.1088/0004-637X/790/2/124
- Sturm et al. (2000) Sturm, E., Lutz, D., Tran, D., et al. 2000, A&A, 358, 481. https://arxiv.org/abs/astro-ph/0002195
- Sutter et al. (2019) Sutter, J., Dale, D. A., Croxall, K. V., et al. 2019, ApJ, 886, 60, doi: 10.3847/1538-4357/ab4da5
- Tacconi et al. (2010) Tacconi, L. J., Genzel, R., Neri, R., et al. 2010, Nature, 463, 781, doi: 10.1038/nature08773
- Tacconi et al. (2013) Tacconi, L. J., Neri, R., Genzel, R., et al. 2013, ApJ, 768, 74, doi: 10.1088/0004-637X/768/1/74
- Tacconi et al. (2018) Tacconi, L. J., Genzel, R., Saintonge, A., et al. 2018, The Astrophysical Journal, 853, 179, doi: 10.3847/1538-4357/aaa4b4
- Tadaki et al. (2019) Tadaki, K.-i., Iono, D., Hatsukade, B., et al. 2019, ApJ, 876, 1, doi: 10.3847/1538-4357/ab1415
- Tielens (2008) Tielens, A. G. G. M. 2008, ARA&A, 46, 289, doi: 10.1146/annurev.astro.46.060407.145211
- Tielens & Hollenbach (1985) Tielens, A. G. G. M., & Hollenbach, D. 1985, ApJ, 291, 722, doi: 10.1086/163111
- Tran et al. (2001) Tran, Q. D., Lutz, D., Genzel, R., et al. 2001, ApJ, 552, 527, doi: 10.1086/320543
- Uchida et al. (2000) Uchida, K. I., Sellgren, K., Werner, M. W., & Houdashelt, M. L. 2000, ApJ, 530, 817, doi: 10.1086/308379
- Valtchanov et al. (2011) Valtchanov, I., Virdee, J., Ivison, R. J., et al. 2011, MNRAS, 415, 3473, doi: 10.1111/j.1365-2966.2011.18959.x
- van Diedenhoven et al. (2004) van Diedenhoven, B., Peeters, E., Van Kerckhoven, C., et al. 2004, ApJ, 611, 928, doi: 10.1086/422404
- Vanzella et al. (2008) Vanzella, E., Cristiani, S., Dickinson, M., et al. 2008, A&A, 478, 83, doi: 10.1051/0004-6361:20078332
- Veilleux et al. (2009) Veilleux, S., Rupke, D. S. N., Kim, D. C., et al. 2009, ApJS, 182, 628, doi: 10.1088/0067-0049/182/2/628
- Walter et al. (2012) Walter, F., Decarli, R., Carilli, C., et al. 2012, Nature, 486, 233, doi: 10.1038/nature11073
- Watson & Salpeter (1972) Watson, W. D., & Salpeter, E. E. 1972, ApJ, 174, 321, doi: 10.1086/151492
- Weingartner & Draine (2001) Weingartner, J. C., & Draine, B. T. 2001, ApJ, 548, 296, doi: 10.1086/318651
- Wolfire et al. (1990) Wolfire, M. G., Tielens, A. G. G. M., & Hollenbach, D. 1990, ApJ, 358, 116, doi: 10.1086/168966
- Wu et al. (2010) Wu, Y., Helou, G., Armus, L., et al. 2010, ApJ, 723, 895, doi: 10.1088/0004-637X/723/1/895
- Yan et al. (2005) Yan, L., Chary, R., Armus, L., et al. 2005, ApJ, 628, 604, doi: 10.1086/431205
- Zanella et al. (2018) Zanella, A., Daddi, E., Magdis, G., et al. 2018, MNRAS, 481, 1976, doi: 10.1093/mnras/sty2394