Harmonics Based Representation in Clarinet Tone Quality Evaluation
Abstract
Music tone quality evaluation is generally performed by experts. It could be subjective and short of consistency and fairness as well as time-consuming. In this paper we present a new method for identifying the clarinet reed quality by evaluating tone quality based on the harmonic structure and energy distribution. We first decouple the quality of reed and clarinet pipe based on the acoustic harmonics, and discover that the reed quality is strongly relevant to the even parts of the harmonics. Then we construct a features set consisting of the even harmonic envelope and the energy distribution of harmonics in spectrum. The annotated clarinet audio data are recorded from 3 levels of performers and the tone quality is classified by machine learning. The results show that our new method for identifying low and medium high tones significantly outperforms previous methods.
Index Terms— tone quality evaluation, acoustic model, harmonic features, machine learning, clarinet tone quality
1 Introduction
Persistent practice for many years in controlling breath, fingers, tongue and lips is required to approach the desired tone quality for students to perform a woodwind instrument. Since beginners are often unable to evaluate the tone quality they played, guidance of experts is imperative during practicing. However, the evaluation simply based on the subjective judgement of teachers could be inconsistent as well as time-consuming. Automatic tone quality evaluation of instrumental music has both theoretical and practical values and the techniques of acoustic identification and evaluation can play important roles in speech recognition [1], speaker verification [2] and music identification [3], etc., as well as music student audition and instrument manufacturing.
Many efforts are made to study the quality of music instruments. The efforts were made on influence of physical components [4], and instrument controlling skills in rendition [5, 6] and tone colors in music context [7, 8]. The studies on the evaluation of saxophone timbre were considered as lack of systematic understanding of how the features contribute to tone quality [9, 10, 11]. In [12], Chavez et al. showed that the clarinet tone quality is distinguishable visually via spectrogram, and in [13] the image representation by a popular convolutional neural network (CNN) structure, AlexNet, is analyzed with an average accuracy of 76.56%. Yet, few have analyzed the tone quality with respect to different quality of reeds and found an effective representation of tone quality.
Differentiating the quality of reed and that of pipe is very important for selecting reed and improving pipe quality of clarinet and other woodwind instruments with reed. In this paper, we present a new method for identifying the clarinet reed quality by evaluating tone quality. By analyzing the clarinet acoustic model and the clarinet audio signal we discover that the tone quality could be decoupled to that of reed and pipe in terms of harmonics. As pipe mainly produce the odd harmonics, the clarinet reed quality depends largely on the even parts of the harmonic series. The harmonic energy distribution in spectrum is highly related to tone quality and harmonic-to-noise ratios in different spectrum ranges is utilized as a part of tone representation. Thus, the tone quality representation is based on two key parts: the harmonic structure and harmonic energy distribution.
The annotated clarinet audio data are recorded from 3 levels of performers and a support vector machine (SVM) based classifier is developed. The effectiveness of the representation proposed in the paper is demonstrated by the performance data with two classification strategies: single-note strategy and multi-notes strategy. The results show that our method significantly outperforms previous methods.
2 RELATION TO PRIOR WORK
Our efforts focus on the representation of clarinet tone and its quality evaluation related to instrument physics, acoustic signal analysis and music theory. Most related work carried out by previous researchers focused on the classification techniques, such as random forest in multi-class classification [11] and the structures of CNN [13]. A few efforts were made on the feature representation of instrumental tone quality. Hsiao et al. [9] analyzed the waveform-shape-based features of saxophone, whereas systematical investigation is not conducted on the belief that tone quality relies on the richness of harmonics in frequency domain. Guo et al. [10] constructed a one-dimension feature from energy distribution but without clarifying the relation to timbre. In addition, researchers have attempted to evaluate physical structures in a clarinet using optical holography [4] and investigated instrumental performance techniques [5, 6] as well as the timbre of instruments such as bright, sweet, thick and transparent [7, 8].
Most of these studies have not addressed the identification of reed quality. Our study focuses on the instrument physical model and its acoustic signal with insight into the representation of clarinet tone quality.
3 Harmonics based model and clarinet tone evaluation method
3.1 Harmonic Structure Features
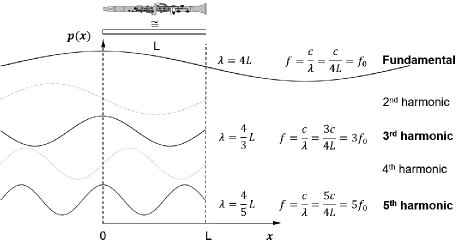
An instrument can be formulated as an input-output system model. For a clarinet, the single vibrating reed, pipe and output signal are considered as the input, system and output of the model, respectively. As shown in Fig.1, the clarinet is modeled as a cylindrical pipe of length opening at the far end (i.e., bound-unbound boundary) but almost closed at the other end (i.e., hard boundary) because the aperture between reed and mouthpiece is tiny enough to cause a reflection almost like that from a completely closed end [14]. We distinguish the open end and closed end by coordinates and , respectively. The acoustic pressure at a point at can be described by the ideal acoustic model in Eq.1, which is the superposition of the bi-directional propagation of waves in the pipe [15].
| (1) |
where and are the amplitudes of the bi-directional waves, is the angular frequency, is the angular wave number, and is the speed of sound in air. In the acoustic model, the pressure node and pressure antinode appear at the bound-unbound boundary and hard boundary, accordingly (i.e., and ). Consequently, only the standing waves with odd numbers of quarter wavelength are allowed between the two boundaries, and the frequencies can be expressed by:
| (2) |
where is the frequency of the -th standing wave. The sound is described as acoustic pressure in physics, and is measured with an electrical transducer. The sampled signal is defined as [16]:
| (3) |
Actually, the captured sound is a superposition of the sound generated directly by the reed and the pipe:
| (4) |
It is demonstrated that the sound quality has a strong correlation with harmonics [17, 18]. Here, we can rewrite the signal into a Fourier series with a harmonic part and a noise part. The signal produced by the reed and pipe can be rewritten as follows:
| (5) |
| (6) |
where is the index of the harmonics, is the fundamental angular frequency, and are constant coefficients, and and are the random noise. As analyzed above, the clarinet pipe produces only the odd harmonics.
By substituting Eq.5 and Eq.6 into Eq.4, we can obtain:
| (7) |
where , , the fundamental angular frequency . We note that the odd harmonics are the combination of signals coming from both reed and pipe, whereas the even harmonics depend on reed vibration only. We also observe in experiments that the amplitudes of odd harmonics are larger than those of even harmonics in lower frequencies, which has also been reported in [14]. Thus, we consider that the even harmonics encode the characteristics of reeds and are more effective in evaluating their quality.
Furthermore, as experimentally analyzed and concluded in [19, 20], the intervals, namely, unison, octave, perfect fifth and perfect fourth are pleasing to listen and are called perfect consonances. Since the first four harmonics constitute a perfect consonance with adjacent intervals of octave, perfect fifth and perfect fourth, their relative amplitudes in dB are strongly related to the nuances of tone quality. Therefore, we extract the following harmonics-based features for the clarinet tone quality representation from the even parts of the first four harmonics and an overall spectral shape described by harmonics:
where denotes the harmonic structure feature set, , and are the amplitude of the first, second and fourth harmonics, , are the harmonics nearest to 2kHz and 5kHz, commensurately, and are the differences between two harmonic amplitudes. From the analysis above, we consider and in this feature set as a result of reed vibration. The differences between harmonics are inspired by a psycho-acoustic model of voice quality and have effectively been applied to speaker verification in [18]. In our case, , contain important information of sound quality: the spectral slope of odd-to-even harmonic and even-to-even harmonic. The high frequency components, and indicate the spectral noise level and are negatively correlated with the quality of sound. In general, a higher level of high frequency noise leads to a lower level of tone quality.
3.2 Harmonic Energy Features
Energy is a measure of amount of sound produced by reed vibration. Previous studies [4, 10] present that the distribution of energy and symmetry of reed in vibration accounts for tone quality. The symmetry of reed in vibration results in periodicity in signal, so we consider a representation associated with harmonics and noise, indicating periodic and non-periodic parts separately. Thus the harmonic-to-noise ratio (HNR) is calculated as follows:
| (8) |
where is the harmonic component, is the noise component and the signal is a mixture of them . is the number of samples in a spectral segment. In order to describe the energy distribution of harmonics, we divided the spectrum into five parts, containing fundamental and harmonics in lower frequency. As we are more interested in the lower frequency parts, we construct the feature as follows:
where denotes the harmonic energy feature set, , , , are the harmonic-to-noise ratios within the frequencies of 500Hz, 1500Hz, 2500Hz and 3500Hz. is the root mean square of total energy. A better tone quality attributes to a higher HNR and a lower overall energy.
3.3 Clarinet Tone Quality Classification
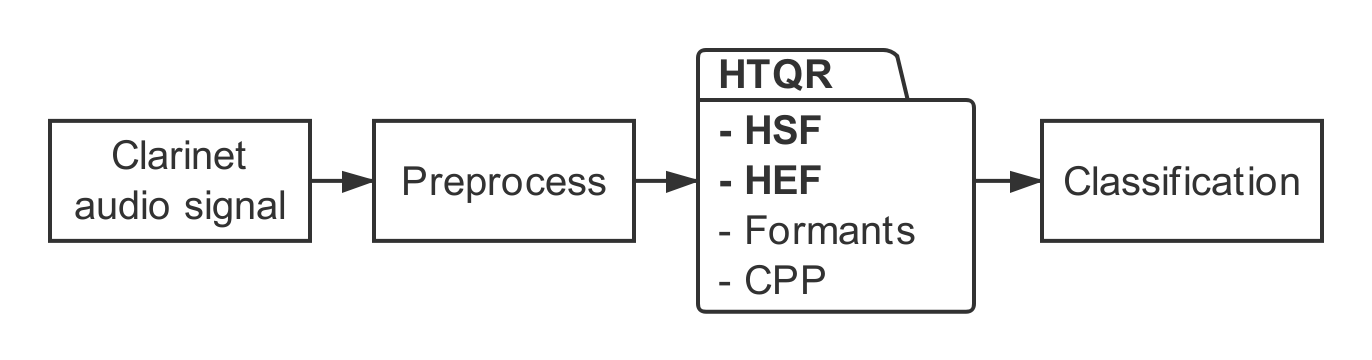
As shown in Fig.2, the scheme of clarinet tone quality classification is composed of preprocessing, feature extraction and classification. Clarinet audio signals are sampled at the rate of 96kHz and we intercept the steady state by removing the transient state segment and decay state segment. We construct a -dimensional feature vector, named harmonics-based tone quality representation (HTQR), to represent clarinet audio signals, where the harmonic structure features (HSF) and the harmonic energy features (HEF) introduced above are adopted as key features. Other complementary audio features are the frequencies and bandwidths of the first four formants (Formants) and cepstral peak prominence (CPP). Features in HTQR are achieved after a short time Fourier transform performed using a sliding window of width 25ms and step size 10ms with Voice Sauce software [21]. The SVM classifier using the radial basis function (RBF) kernel is utilized to evaluate the performance of the features. Considering the dataset is not large, more complex classifiers may outfit. In the work, we divide the tone quality into three levels and implement the classifiers with one-versus-one strategy to address the multi-class classification problem.
4 Experimental Results
4.1 The Experimental Testbed
A clarinet tone dataset is created in a professional recording room using professional equipment: a condenser microphone, a voice channel microphone preamp and an audio interface. Three professional clarinet performers from Xi’an Conservatory of Music are invited for data collection. We utilize a B clarinet and 80 reeds of three levels of quality: low level, medium level and high level. For data collection, we choose 13 tones from the frequently used range (E3 to E6) covering the chalumeau, clarion and altissimo register of the B clarinet. For each tone, every reed is used to generate nine 3-second samples. In total, the dataset consists of audio samples and lasts around 7.8 hours. There are , and samples at the low, medium and high level of quality, correspondingly.
The data is randomly split into two parts: 75% for training and 25% for testing. We obtain 20-dimensional HTQR feature vector (i.e., ) for feature extraction. In the classification process, the kernel width of RBF is set to , and penalty in the error term is considered with parameter to improve the generalization ability.
To study the dependency of classification results on different tones, we design the experiment with the following two strategies: multi-notes strategy (MN) builds a single classification model for the samples of all 3 different qualities and 13 different tones; single-note strategy (SN) builds multiple classification models, each for the samples of the same tone. Four single-note datasets are used in the experiment, namely E3 (165Hz), E4 (330Hz), E5 (659Hz), and E6 (1319Hz).
4.2 Ablation Study for HTQR
In this experiment, we examine how variation in the proposed feature set affects tone quality evaluation and show the effectiveness of HTQR for different tones. We test five kinds of representation in the ablation study, where HTQR is the complete data set, corresponds to the features generated by removing HSF from HTQR, and the other cases are presented in a similar manner. The performance was evaluated by F1-score and accuracy metrics as appropriate.
Table 1 reports the results of ablation study for the five cases. HTQR including our proposed HSF, HEF and the other complementary features introduced in section 3.3 achieves the best performance in tone quality evaluation. We also observe that obtains the lowest value in all the cases and also largely contributes, which demonstrates that harmonic structure and energy distribution play a crucial role. In addition, formants indicate the first four harmonics whose intervals are consonant and CPP is an important feature in defect detection.
| Features | F1-score | Accuracy |
|---|---|---|
| HTQR | 0.85 | 0.84 |
| 0.77 | 0.78 | |
| 0.79 | 0.79 | |
| 0.81 | 0.80 | |
| 0.84 | 0.85 |
4.3 Classification Performance Evaluation on the Multi-notes and Single-note dataset
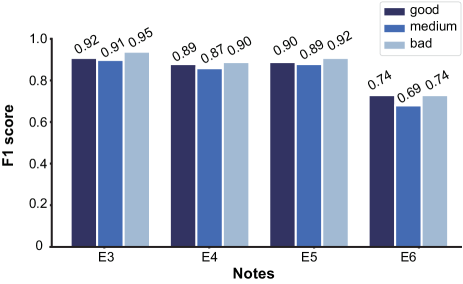
In this subsection, we test the performance of HTQR for the tone quality evaluation and compare it with the widely used Mel Frequency Cepstral Coefficients (MFCC) (20-dimensional) [11, 22]. We implement the experiments with two strategies introduced in section 4.1: MS and SN. Table 2 compares the results of HQTR and MFCC with two different strategies. We first observe that HTQR achieves the satisfactory performance, i.e., 0.84 and 0.92 in accuracy, with both strategies. Additionally, SN outperforms MN since it results in a lower within-class variance than the latter. Turning to Fig.3, it provides a more detailed result for the quality evaluation of each tone in the SN strategy. It depicts that the low-frequency tones, such as E3, E4 and E5 reported significantly a higher F1-score than the high-frequency tones. This decline in high frequency appears as well using MFCC. A challenge for both features is to improve performance in high frequency, because the high-frequency tones are sparse in spectrum, that is, carrying less information and easier to be disturbed by high-frequency noises. Table 2 also illustrates that the proposed HTQR outstrips the MFCC features with an absolute improvement of 14% to 20%.
| Feature set | Level | MN | SN(E3) | ||
|---|---|---|---|---|---|
| F1 | ACC | F1 | ACC | ||
| HTQR | good | 0.85 | 0.84 | 0.92 | 0.92 |
| medium | 0.83 | 0.91 | |||
| bad | 0.86 | 0.95 | |||
| MFCC | good | 0.66 | 0.64 | 0.78 | 0.78 |
| medium | 0.60 | 0.75 | |||
| bad | 0.64 | 0.81 | |||
5 CONCLUSIONS
In this paper, an effective representation called HTQR is proposed for identification of clarinet reed quality by tone quality evaluation. It is discovered that the quality of reed could be decoupled from that of pipe based on the harmonics of the audio signal. The pipe mainly produces odd harmonics, and the even harmonics encode the tone characteristics of reeds. Then based on the reed vibration mode, the harmonic energy with respect to noise is highly relevant to tone quality. Accordingly, we extract harmonic structure features (HSF) and harmonic energy features (HEF). A feature set HTQR is eventually constructed by combining HSF, HEF and the other 2 widely used features in audio analysis as supplementary. Testing results based on the dataset demonstrate that HSF play a pivotal role in the tone quality representation of reed. We conclude that HTQR significantly improves clarinet tone quality identification with the accuracy of 84% and 92% by MN and SN strategy, respectively. Our next step is to classify the tone quality of performers with the minimum effect of instrument quality.
References
- [1] Jinxi Guo, Tara N Sainath, and Ron J Weiss, “A spelling correction model for end-to-end speech recognition,” in ICASSP 2019-2019 IEEE International Conference on Acoustics, Speech and Signal Processing (ICASSP). IEEE, 2019, pp. 5651–5655.
- [2] Jinxi Guo, Ning Xu, Kailun Qian, Yang Shi, Kaiyuan Xu, Yingnian Wu, and Abeer Alwan, “Deep neural network based i-vector mapping for speaker verification using short utterances,” Speech Communication, vol. 105, pp. 92–102, 2018.
- [3] Li Chun Wang and Julius O Smith Iii, “Systems and methods for recognizing sound and music signals in high noise and distortion,” Journal of the Acoustical Society of America, vol. 121, no. 4, pp. 4176, 2018.
- [4] Fabrice Pinard, Benoit Laine, and Holger Vach, “Musical quality assessment of clarinet reeds using optical holography,” The Journal of the Acoustical Society of America, vol. 113, no. 3, pp. 1736–1742, Mar. 2003.
- [5] Ian R Fasel, Kurt D Bollacker, and Joydeep Ghosh, “A neural network based classifier and biofeedback device for improving clarinet tone-quality,” in IJCNN’99. International Joint Conference on Neural Networks. Proceedings (Cat. No. 99CH36339). IEEE, 1999, vol. 3, pp. 1924–1928.
- [6] Mathieu Barthet, Philippe Guillemain, Richard Kronland-Martinet, and Sølvi Ystad, “From Clarinet Control to Timbre Perception,” Acta Acustica united with Acustica, vol. 96, pp. 678–689, July 2010.
- [7] Hui-Jen Yang, Yun-Long Lay, and Chern-Sheng Lin, “Automatic timbre quality evaluation in chinese traditional flute industry,” Expert Systems with Applications, vol. 32, no. 4, pp. 1004–1010, 2007.
- [8] Ron Yorita and John Clements, “Using spectral analysis to evaluate flute tone quality,” in Proceedings of Meetings on Acoustics 169ASA. ASA, 2015, vol. 23, p. 035001.
- [9] Yu-Hsiang Hsiao and Chao-Ton Su, “Multiclass mts for saxophone timbre quality inspection using waveform-shape-based features,” IEEE Transactions on Systems, Man, and Cybernetics, Part B (Cybernetics), vol. 39, no. 3, pp. 690–704, 2009.
- [10] Jinxi Guo, Mengying Ding, Xiaohong Guan, Youtian Du, Jicheng Feng, Qinping Gao, and Zheng Liu, “Timbre identification of instrumental music via energy distribution modeling,” in Proceedings of the 7th International Conference on Internet Multimedia Computing and Service. ACM, 2015, p. 67.
- [11] Zhe Lei, Mengying Ding, Xiaohong Guan, Youtian Du, Jicheng Feng, Qinping Gao, and Zheng Liu, “Tone quality recognition of instruments based on multi-feature fusion of music signal,” American Journal of Networks and Communications, vol. 5, no. 2, pp. 11–16, 2016.
- [12] Francisco Chávez and F Fernández de Vega, “Assessing quality of sound emission in beginning clarinetists using optimization processes,” in 16th International Society for Music Information Retrieval Conference-ISMIR15, LATE-BREAKING DEMO, Málaga, 2015.
- [13] Francisco Fernádez de Vega, Francisco J Rodríguez Diaz, et al., “Analyzing quality clarinet sound using deep learning. a preliminary study,” in 2017 IEEE Symposium Series on Computational Intelligence (SSCI). IEEE, 2017, pp. 1–7.
- [14] David M Howard and Jamie Angus, Acoustics and psychoacoustics, Routledge, 2017.
- [15] Thomas D Rossing and Neville H Fletcher, Principles of vibration and sound, Springer Science & Business Media, 2012.
- [16] Jacob Møller Hjerrild and Mads Græsbøll Christensen, “Estimation of guitar string, fret and plucking position using parametric pitch estimation,” in ICASSP 2019-2019 IEEE International Conference on Acoustics, Speech and Signal Processing (ICASSP). IEEE, 2019, pp. 151–155.
- [17] Jody Kreiman, Bruce R Gerratt, Marc Garellek, Robin Samlan, and Zhaoyan Zhang, “Toward a unified theory of voice production and perception,” Loquens, vol. 1, no. 1, 2014.
- [18] Marc Garellek, Robin Samlan, Bruce R Gerratt, and Jody Kreiman, “Modeling the voice source in terms of spectral slopes,” The Journal of the Acoustical Society of America, vol. 139, no. 3, pp. 1404–1410, 2016.
- [19] R. Plomp and W. J. M. Levelt, “Tonal consonance and critical bandwidth,” The Journal of the Acoustical Society of America, vol. 38, no. 4, pp. 548–560, 1965.
- [20] Jesse Berezovsky, “The structure of musical harmony as an ordered phase of sound: A statistical mechanics approach to music theory,” Science advances, vol. 5, no. 5, pp. eaav8490, 2019.
- [21] Yen-Liang Shue, Patricia Keating, Chad Vicenik, and Kristine Yu, “Voicesauce: A program for voice analysis,” The Journal of the Acoustical Society of America, vol. 126, 10 2009.
- [22] Beth Logan, “Mel frequency cepstral coefficients for music modeling,” in ISMIR, 2000, vol. 270, pp. 1–11.