11email: rdscholz@aip.de
New ultracool dwarf neighbours within 20 pc from Gaia DR2
Abstract
Aims. The Gaia data release 2 (DR2) contains 6000 objects with parallaxes mas placing them within 20 pc from the Sun. Since the expected numbers extrapolating the well-known 10 pc census are much lower, nearby Gaia stars need a quality assessment. The 20 pc sample of white dwarfs (WDs) had already been verified and completed with Gaia DR2. We aimed to check and complete the 20 pc sample of ultracool dwarfs (UCDs) with spectral types M7 and given Gaia DR2 parallaxes.
Methods. Dividing the Gaia DR2 20 pc sample into subsamples of various astrometric and photometric quality, we studied their distribution on the sky, in the vs. colour-magnitude diagram (CMD), and as a function of magnitude and total proper motion. After excluding 139 known WDs and 263 known UCDs from the CMD, we checked all remaining 3500 candidates with mag (used to define UCDs in this study) for the correctness of their Gaia DR2 proper motions via visual inspection of finder charts, comparison with proper motion catalogues, and comparison with our own proper motion measurements. For confirmed UCD candidates we estimated spectral types photometrically using Gaia and near-infrared absolute magnitudes and colours.
Results. We failed to confirm new WDs, but found 50 new UCD candidates not mentioned in three previous studies using Gaia DR2. They have relatively small proper motions and tangential velocities and are concentrated towards the Galactic plane. Half of them have spectral types in SIMBAD and/or previous non-Gaia distance estimates that placed them already within 20 pc. For 20 of the 50 objects, we estimated photometric spectral types of M6-M6.5, slightly below the classical UCD spectral type limit. However, seven L4.5-L6.5, four L0-L1, five M8.5-M9.5, and three M7-M8 dwarfs can be considered as completely new UCDs discoveries within 20 pc based on Gaia DR2. Four M6.5 and two L4.5 dwarfs have high membership probabilities (64%-99%) in the ARGUS, AB Doradus, or Carina Near young moving groups.
Key Words.:
Parallaxes – Proper motions – brown dwarfs – Stars: distances – Hertzsprung-Russell and C-M diagrams – solar neighbourhood1 Introduction
Objects of spectral types M7 and later were first called ultracool dwarfs (UCDs) by Kirkpatrick et al. (1997). This definition by spectral type M7 is still being used for classical UCDs. With cooler and cooler UCDs discovered with time, three additional spectral classes, L, T, and Y had to be created (see Cushing 2014, for a historical review and brief discussion of the changing physical conditions and resulting spectral morphology of UCDs). From individual dynamical masses of M7-T5 UCDs in the solar neighbourhood, Dupuy & Liu (2017) found that a spectral type of L4 and mass of 70 Jupiter masses roughly correspond to the hydrogen-burning limit. However, a spectral type of L4 can not be considered as a boundary between stellar and substellar objects in the solar neighbourhood, since their ages are different (and difficult to determine) and brown dwarfs change their spectral types as they cool down.
Despite many long-term efforts the solar neighbourhood is still not fully explored, and even at very short distances (10 pc) from the Sun new discoveries of a few white dwarfs (WDs), up to 10% more red dwarf stars, and probably at least 20% more brown dwarfs can be expected (Henry et al. 2018; Kirkpatrick et al. 2019). The knowledge about our nearest stellar and substellar neighbours is important for many aspects of astronomical research. This includes the estimated outcome of star formation (e.g. Kirkpatrick 2013; Kirkpatrick et al. 2019), the local density and velocity distribution and the role of (sub)stellar encounters (e.g. Scholz 2014; Mamajek et al. 2015; Bailer-Jones 2015; Martínez-Barbosa et al. 2017) and interstellar comets (e.g. de la Fuente Marcos et al. 2018; Portegies Zwart et al. 2018; Hallatt & Wiegert 2019). The search for extrasolar planets and investigation of planetary systems around low-mass stars (e.g. Anglada-Escudé et al. 2016; Gillon et al. 2017; Ribas et al. 2018) and brown dwarfs (Miles-Paez et al. 2019; Bedin et al. 2019) can also be carried out very effectively in our close neighbourhood. Some of the brown dwarfs crossing the solar neighborhood may be relatively young (10-100 Myr). They can still be relatively bright and may have not yet cooled down to T or Y types, and an opportunity for age determinations arises from their kinematic membership in nearby young moving groups (YMGs; Aller et al. 2016; Gagné et al. 2017; Riedel et al. 2019).
According to the statistics of the REsearch Consortium On Nearby Stars (RECONS, see www.recons.org), in the time from 2000 to 2018, the total number of stars and brown dwarfs within 10 pc from the Sun rose from 291 to 428. This increase was achieved mainly thanks to 85 new M dwarfs and 49 new LTY dwarfs, but also three new WDs uncovered in the immediate solar neighbourhood. In 2000, only 198 M dwarfs, one of the LTY dwarfs, and 18 WDs were known. The RECONS 10 pc census for 2018 was compiled before the second data release of Gaia (DR2; Gaia Collaboration et al. 2018b). Incorporating results from Gaia DR2, Henry et al. (2019) provided a slightly smaller total number of 418 individual objects and mentioned that 15% of the previously known systems are missing in Gaia DR2, whereas only 8 systems were added by Gaia to the 10 pc sample so far. We are aware of only one published new system within 10 pc, consisting of a WD/M dwarf pair discovered already based on Gaia DR1 data (Scholz et al. 2018), and assume the other seven unpublished Gaia-based discoveries to consist of early- and mid-M dwarfs.
For Gaia, observing in the optical, many of the cooler brown dwarfs represent difficult targets at the limiting magnitude of the survey. Assuming a limiting magnitude mag, Smart et al. (2017) predicted distance limits for L0-T9 dwarfs observable by Gaia. According to their Table 1, all L6 dwarfs within 23 pc should be detectable by Gaia. With later L types, the Gaia distance limit continuously falls to 19 pc at L7, 15 pc at L8, and 12 pc at L9. However, it rises again to 14 pc for all T0-T4 dwarfs, before dropping to 12 pc at T5, 10 pc at T6, …, and finally 2 pc at T9.
Compared to the above described RECONS 10 pc census, the number of 1722 Gaia DR2 entries with parallaxes larger than 100 mas appears much too high. Henry et al. (2019) estimated that at least 80% of these data are unreliable and ”only careful vetting will reveal the real members” of the 10 pc sample. Here, we study the Gaia DR2 20 pc sample (an eight times larger volume) in Sect. 2 with respect to various astrometric and photometric quality criteria (Sect. 2.1). In contrast to the classical UCD definition by spectral type (M7), we define an absolute Gaia magnitude limit of mag for all UCDs considered in this study and review previous studies of UCDs and WDs with respect to the Gaia DR2 20 pc sample (Sect. 2.2). Finally, we describe our search for new UCDs and WDs ((Sect. 2.3). In our search we tried to find nearby UCDs in particular among the faintest Gaia objects, which have typically unreliable data. All detected UCDs that were not yet included in three previous UCD-related studies involving Gaia DR2 data are considered as ”new UCDs” in this study. In Sect. 3, we classify these new UCDs found in Gaia DR2 photometrically, in Sect. 4, we briefly investigate their spatial distribution and kinematics, and in Sect. 5 we study their membership in nearby young moving groups (YMGs), before we conclude with an outlook to future Gaia data releases (Sect. 6).
2 The Gaia DR2 20 pc sample
To select an initial Gaia DR2 20 pc sample we applied a soft parallax cut using the parallax errors mas, as it was also done by Hollands et al. (2018) to define their Gaia 20 pc WD sample. This soft parallax cut yielded 6105 objects, whereas with a sharp cut of mas we found only 5400 objects. Both numbers are much higher than the expected number of objects within 20 pc, derived from the latest estimate for the 10 pc sample (Henry et al. 2019) and assuming a constant density of objects. On the other hand, we think that Gaia DR2 may have missed a similarly large fraction of real members of the 20 pc sample as found by Henry et al. (2019) for the 10 pc sample (15%).
The parallax errors of all 6105 objects are smaller than 5 mas. This means that almost all (except for 14 objects) of them have formally better than 10% parallax precision. There is a strong correlation of the parallax errors with the magnitude. Whereas between mag and mag the median of the parallax error is always below 0.1-0.2 mas (with outliers reaching 1-2 mas), it raises systematically to 0.5 mas at the bright end ( mag) and 3.5 mas at the faint end ( mag). With the formally high precision of the parallaxes in the Gaia DR2 20 pc sample, we can compute absolute magnitudes as , where the parallax is in units of mas.
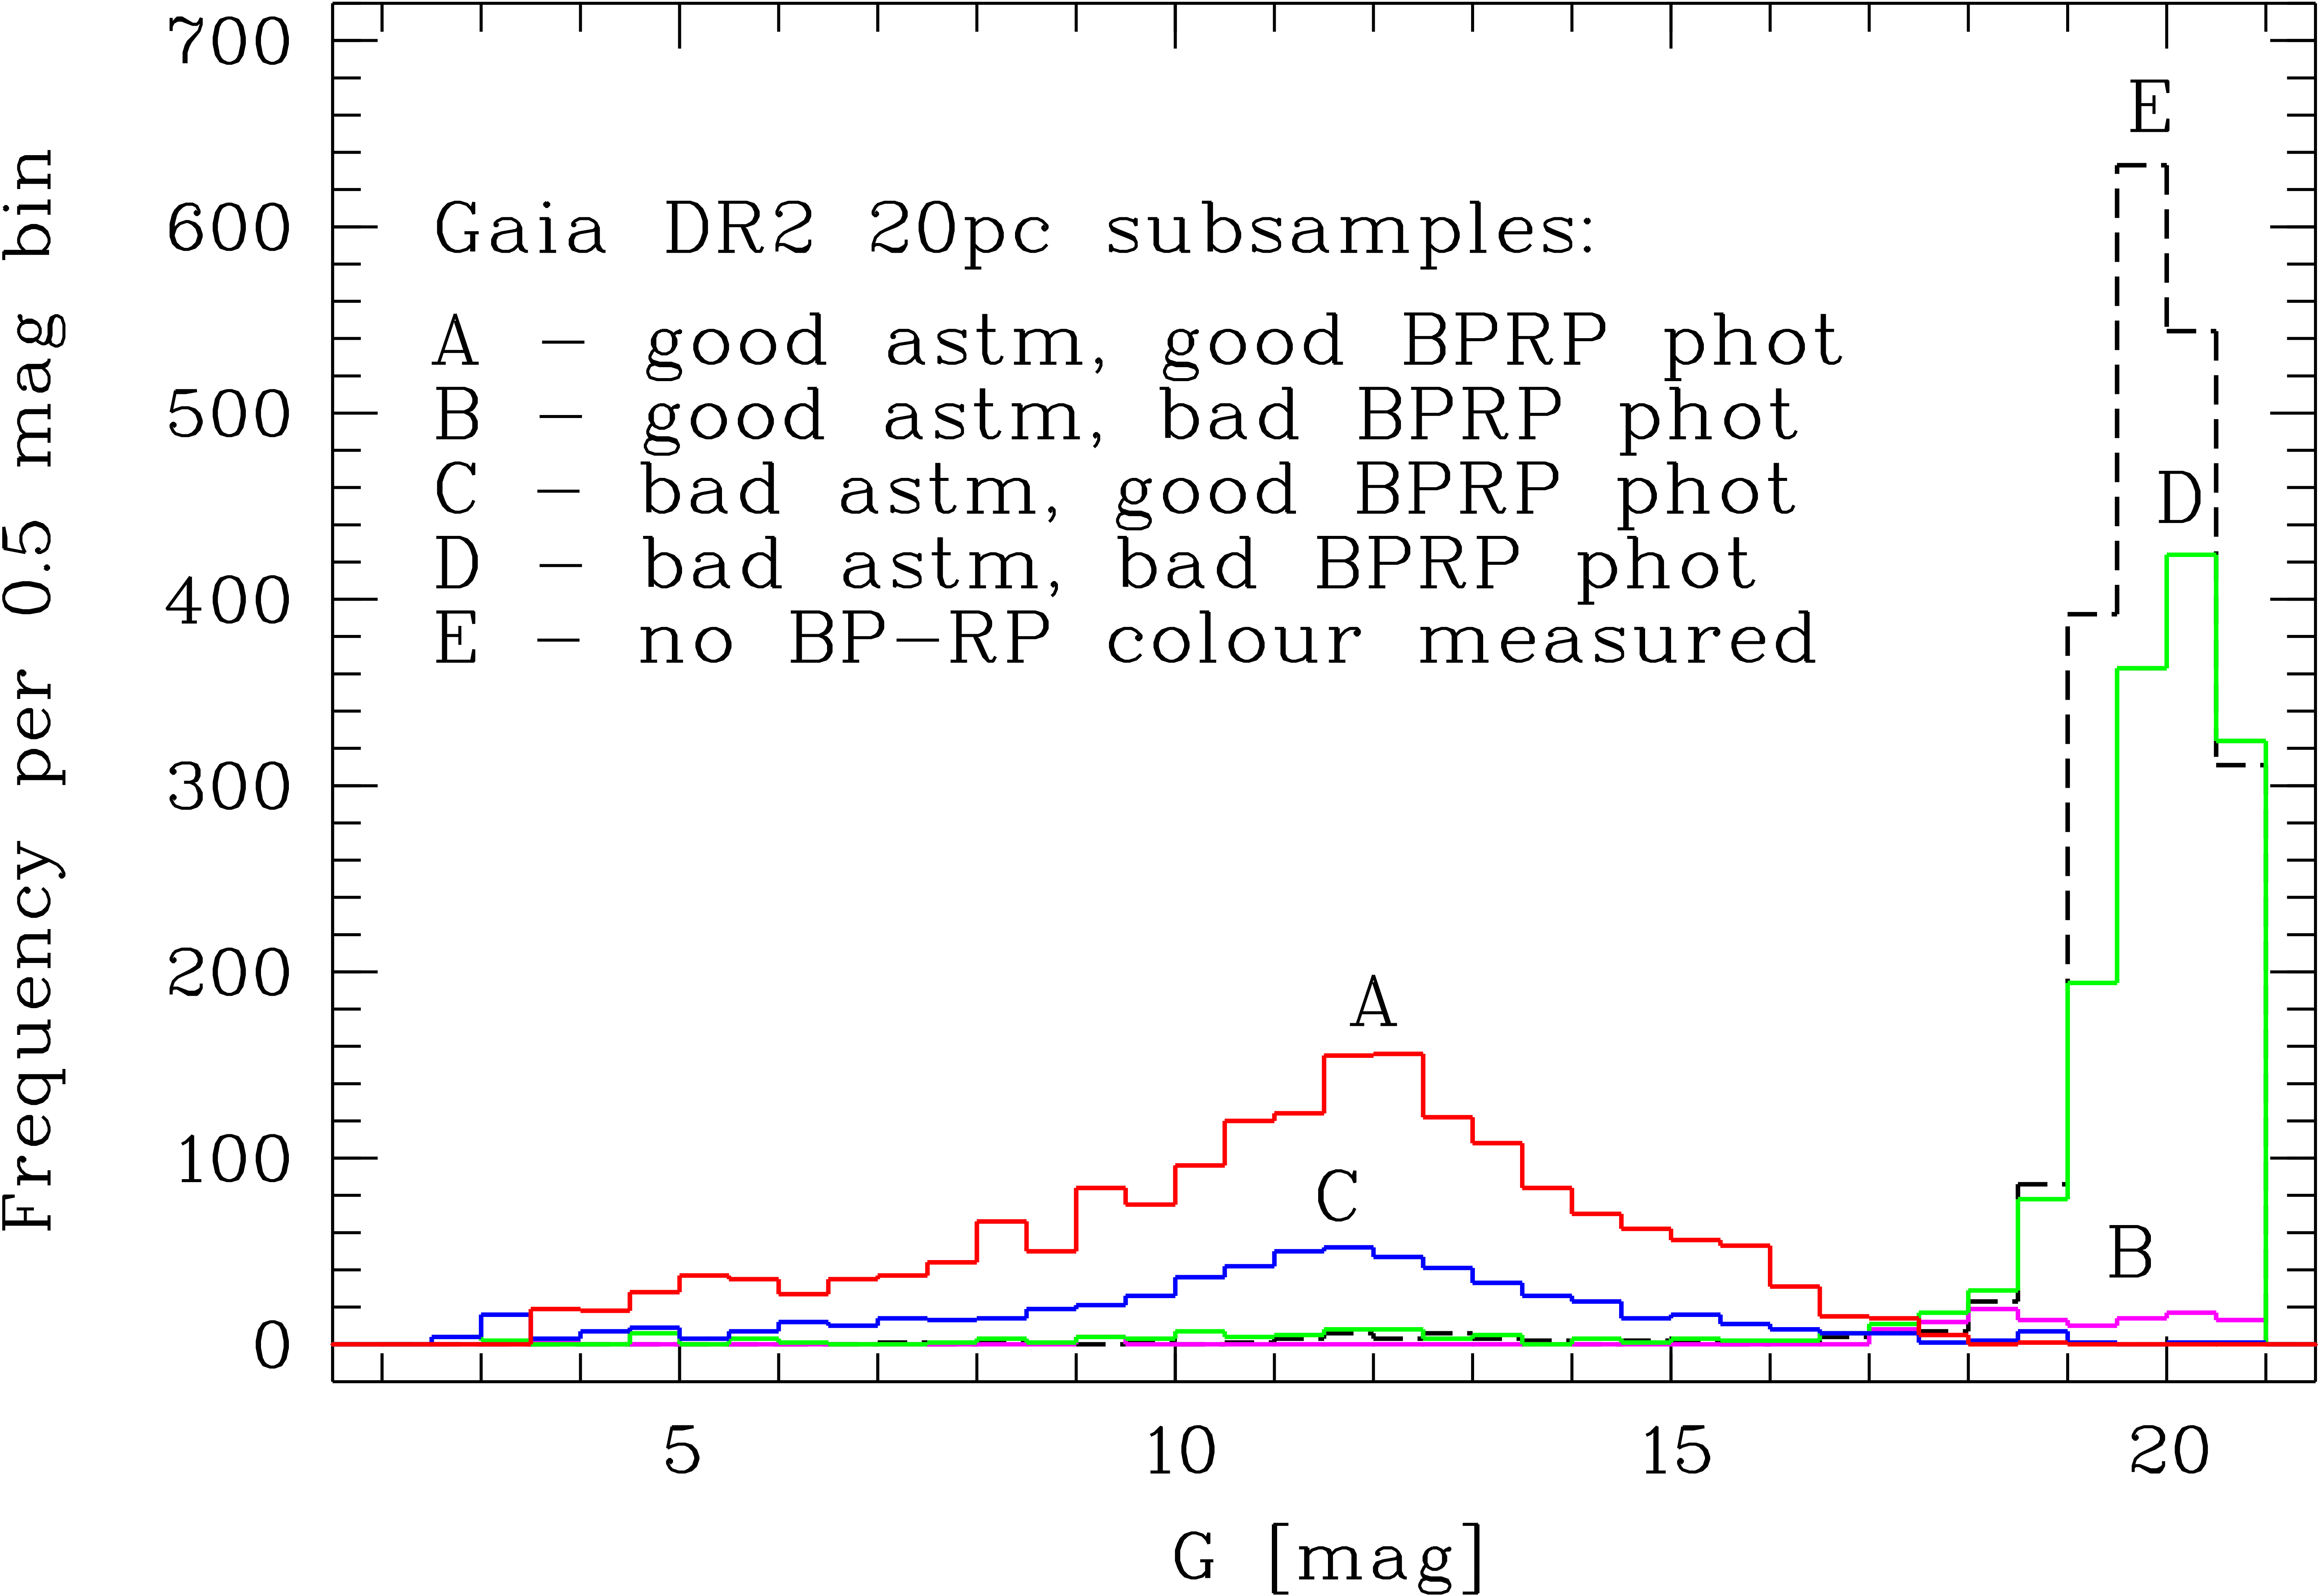
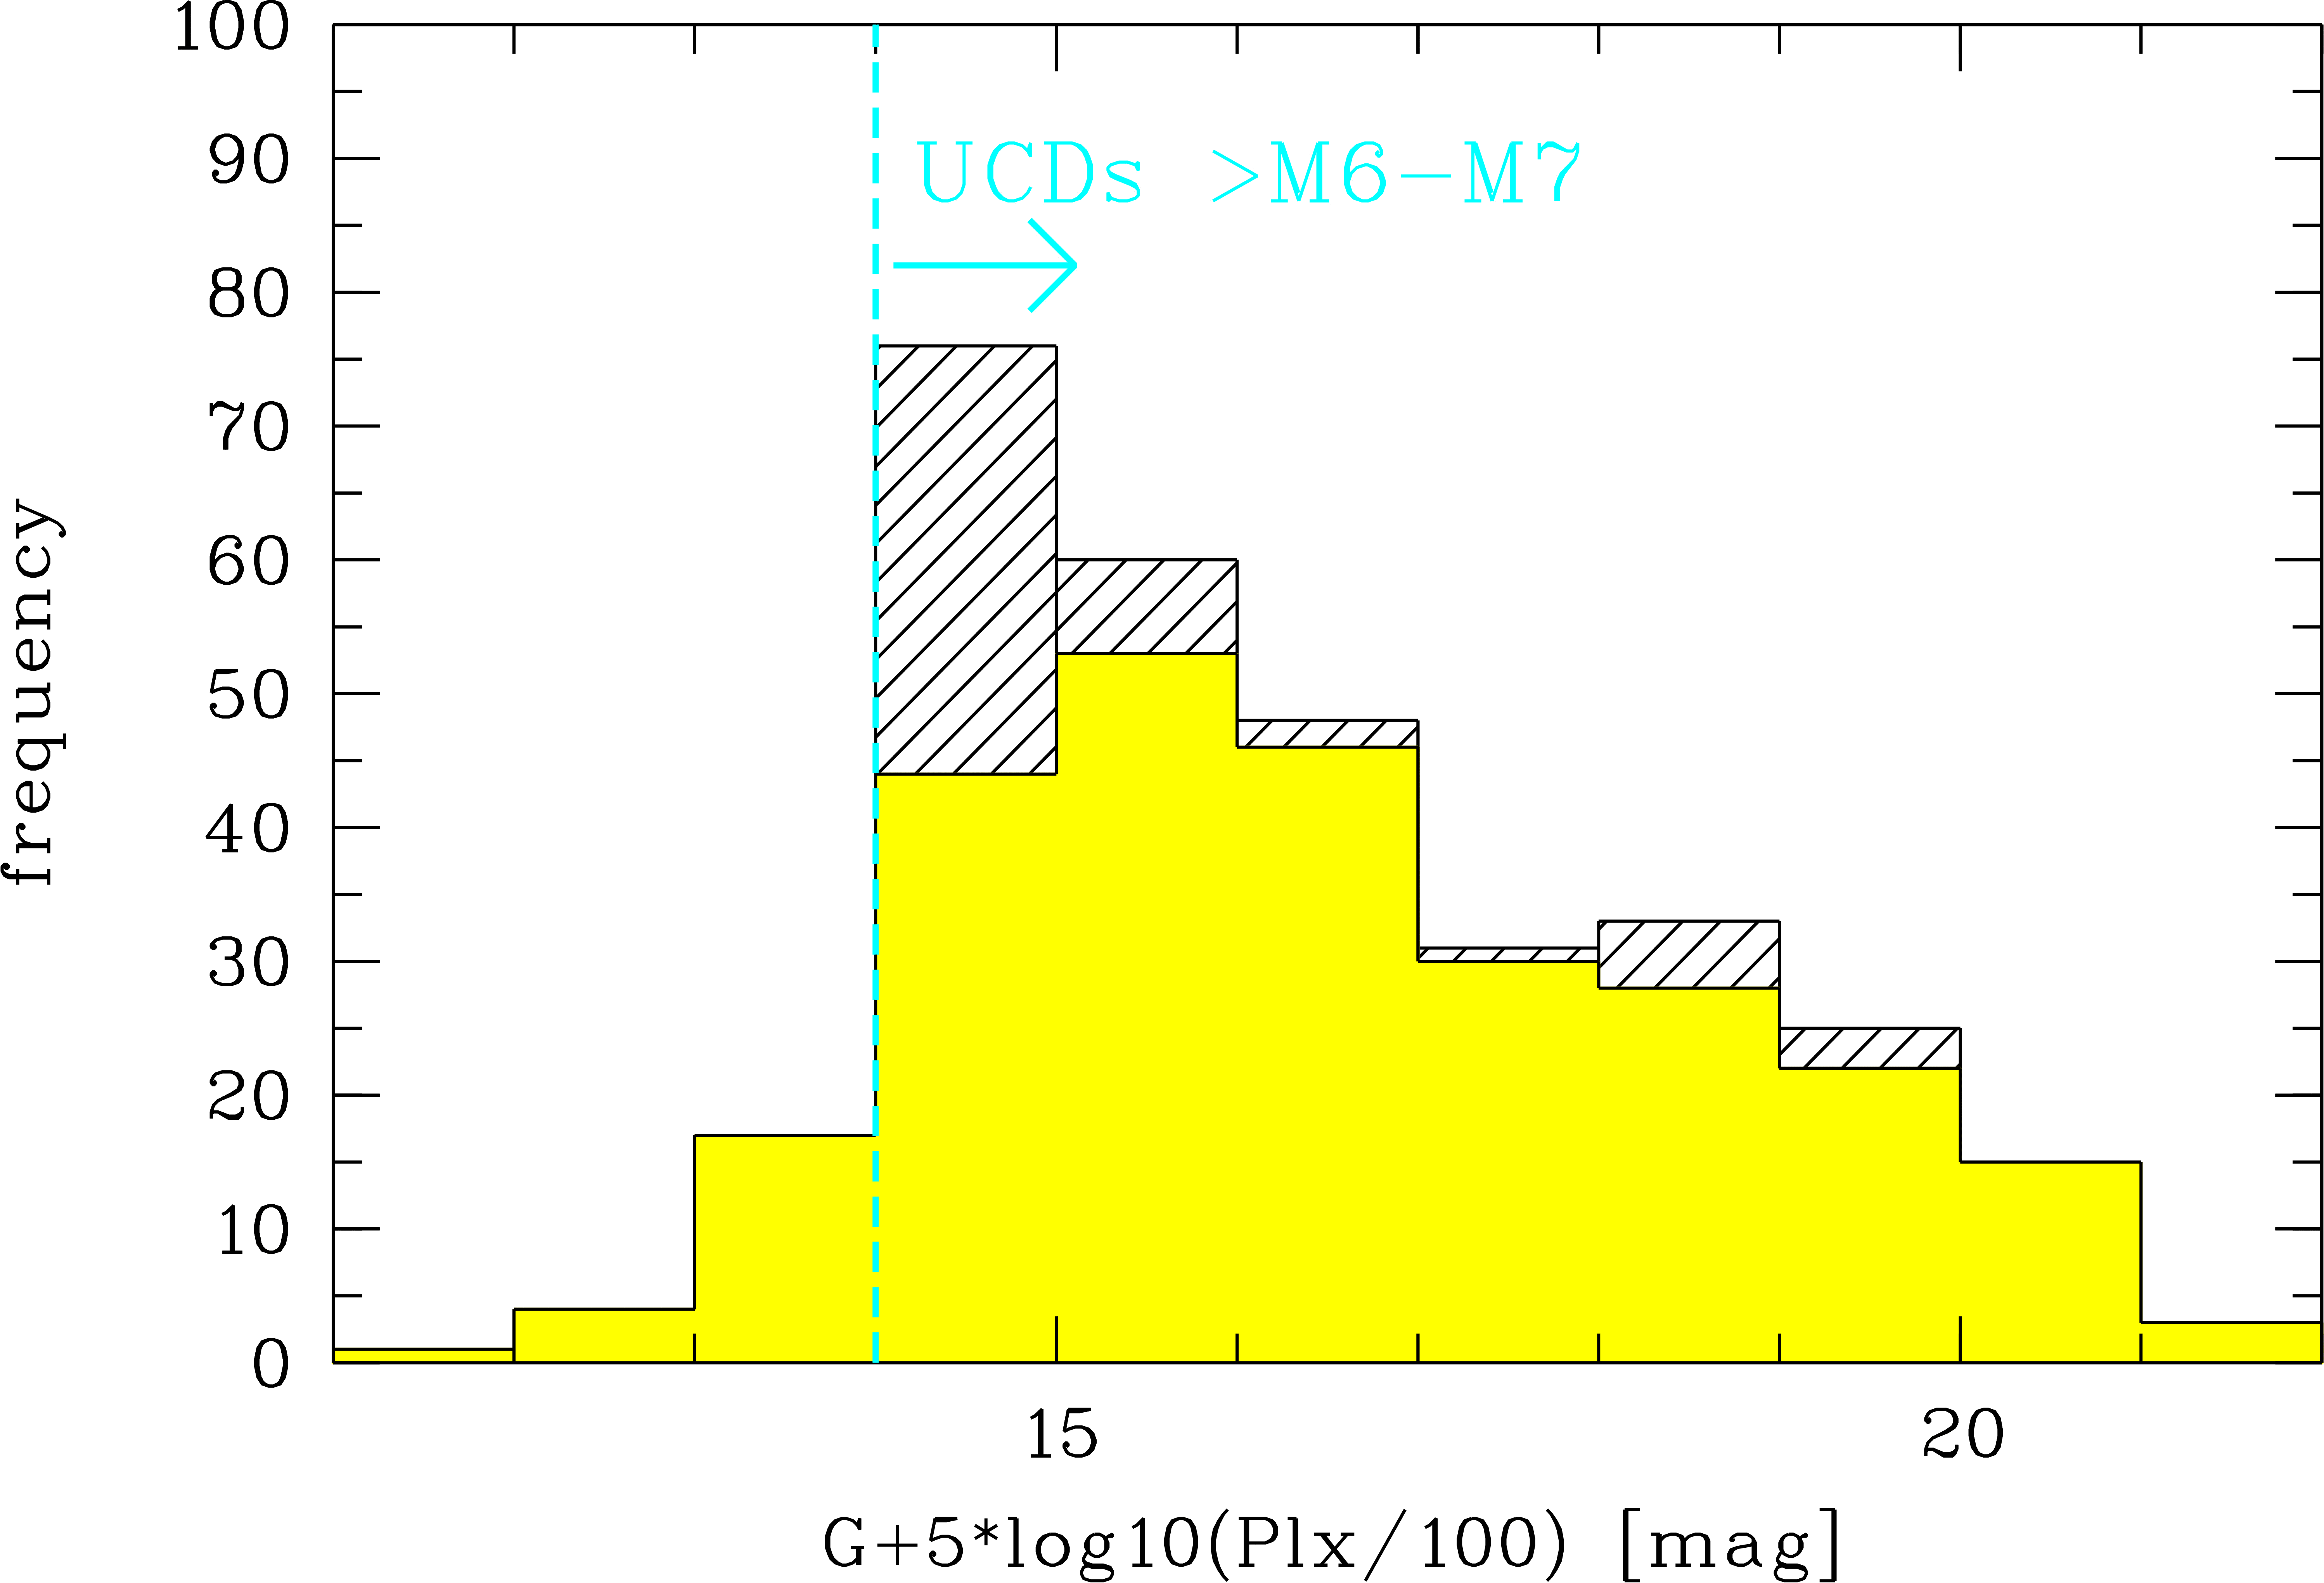
Most of the objects in our Gaia DR2 20 pc sample are rather faint ( mag), where both astrometric and photometric measurements in Gaia DR2 are problematic (see Sect.2.1). In addition, many predominantly faint objects lack colour information, as shown by the dashed histogram in Fig. 1. The colour measurements are used for assessing the photometric quality, in particular in crowded fields, e.g. in the Galactic plane (Sect.2.1). Only 4065 out of the 6105 objects have colours and 4102 have colours measured in Gaia DR2.
Observational Hertzsprung-Russell or colour-magnitude diagrams (CMDs) with absolute magnitudes determined directly from the parallaxes have been presented by Gaia Collaboration et al. (2018a), and Lindegren et al. (2018) demonstrated how the CMD is getting cleaner when astrometric and photometric quality criteria, similar to those described in Sect. 2.1, are applied. The Gaia DR2 CMDs displaying absolute magnitudes as a function of colour show a better separation between the main sequence (MS) and the WD sequence than CMDs with vs. colour (Smart et al. 2019). Therefore, we also use the colour, if available, in the CMDs included in the following subsections (Figs. 3, 4, and 6).
2.1 astrometric and photometric quality criteria
Following the recommendations given in Gaia Collaboration et al. (2018b) and Lindegren (2018), we selected four subsamples with different quality criteria from all objects in the Gaia DR2 20 pc sample with available colour measurements. These subsamples were defined by us as:
- A
-
- good astrometry AND good photometry,
- B
-
- good astrometry BUT bad photometry,
- C
-
- bad astrometry BUT good photometry,
- D
-
- bad astrometry AND bad photometry.
We considered the astrometry as ”good”, when all of the following three criteria were fulfilled (otherwise ”bad”):
- astm_q1
-
- ,
- astm_q2
-
- ,
- astm_q3
-
- visibility_periods_used.
As the most important astrometric quality parameter in addition to the obviously important ratio , Lindegren (2018) introduced the renormalised unit weight error (), and we apply the same limit of 1.4 that he suggested for well-behaved single sources, not affected by close binary companions or background objects in crowded fields. The corresponds to the formerly used simple unit weight error (Lindegren et al. 2018), after normalisation over both magnitude and colour. The parameter visibility_periods_used gives the number of groups of observations during the only 22 months used for Gaia DR2. The minimum number for all objects with parallaxes included in Gaia DR2 was visibility_periods_used6. Gaia Collaboration et al. (2018a) applied visibility_periods_used8 in their study of Gaia DR2 CMDs, as we do here.


As we are in particular interested in the location of faint objects and possible nearby UCDs falling in crowded fields in Gaia DR2 CMDs, we also estimated their photometric quality. For ”good” photometry, all of the following three criteria had to be fulfilled (otherwise the photometry was considered ”bad”):
- phot_q1
-
- phot_bp_mean_flux_over_error,
- phot_q2
-
- phot_rp_mean_flux_over_error,
- phot_q3
-
- phot_bp_rp_excess_factor ,
where the first two conditions ensure better than 10% uncertainty in and fluxes corresponding to 0.1 mag in and magnitudes (Lindegren et al. 2018) and were also applied in ”Selection A” of Lindegren et al. (2018). The third condition, applied in ”Selection C” of Lindegren et al. (2018) and by Gaia Collaboration et al. (2018a), uses the flux excess factor indicating problematic or photometry (Evans et al. 2018), mainly of faint sources in crowded fields.
Out of 4065 objects with available colours in the Gaia DR2 20 pc sample, only 48% are qualified by us to have good astrometry. Their magnitude distribution (subsamples A and B) is shown in Fig. 1. Only 3%, mainly at faint magnitudes, have good astrometry but bad photometry (subsample B). The histogram of subsample C, with bad astrometry but good photometry, peaks at a similarly bright magnitude of 12 mag as that of subsample A. Subsample D, with both bad astrometry and bad photometry, contains more than one third (38%) of all objects and shows a strong concentration at faint magnitudes, similar to the additional 2040 objects without colour measurements (subsample E), also shown in Fig. 1. Only a negligible part of subsample E (10 objects) can be qualified as objects with good astrometry (not shown in Fig. 1).
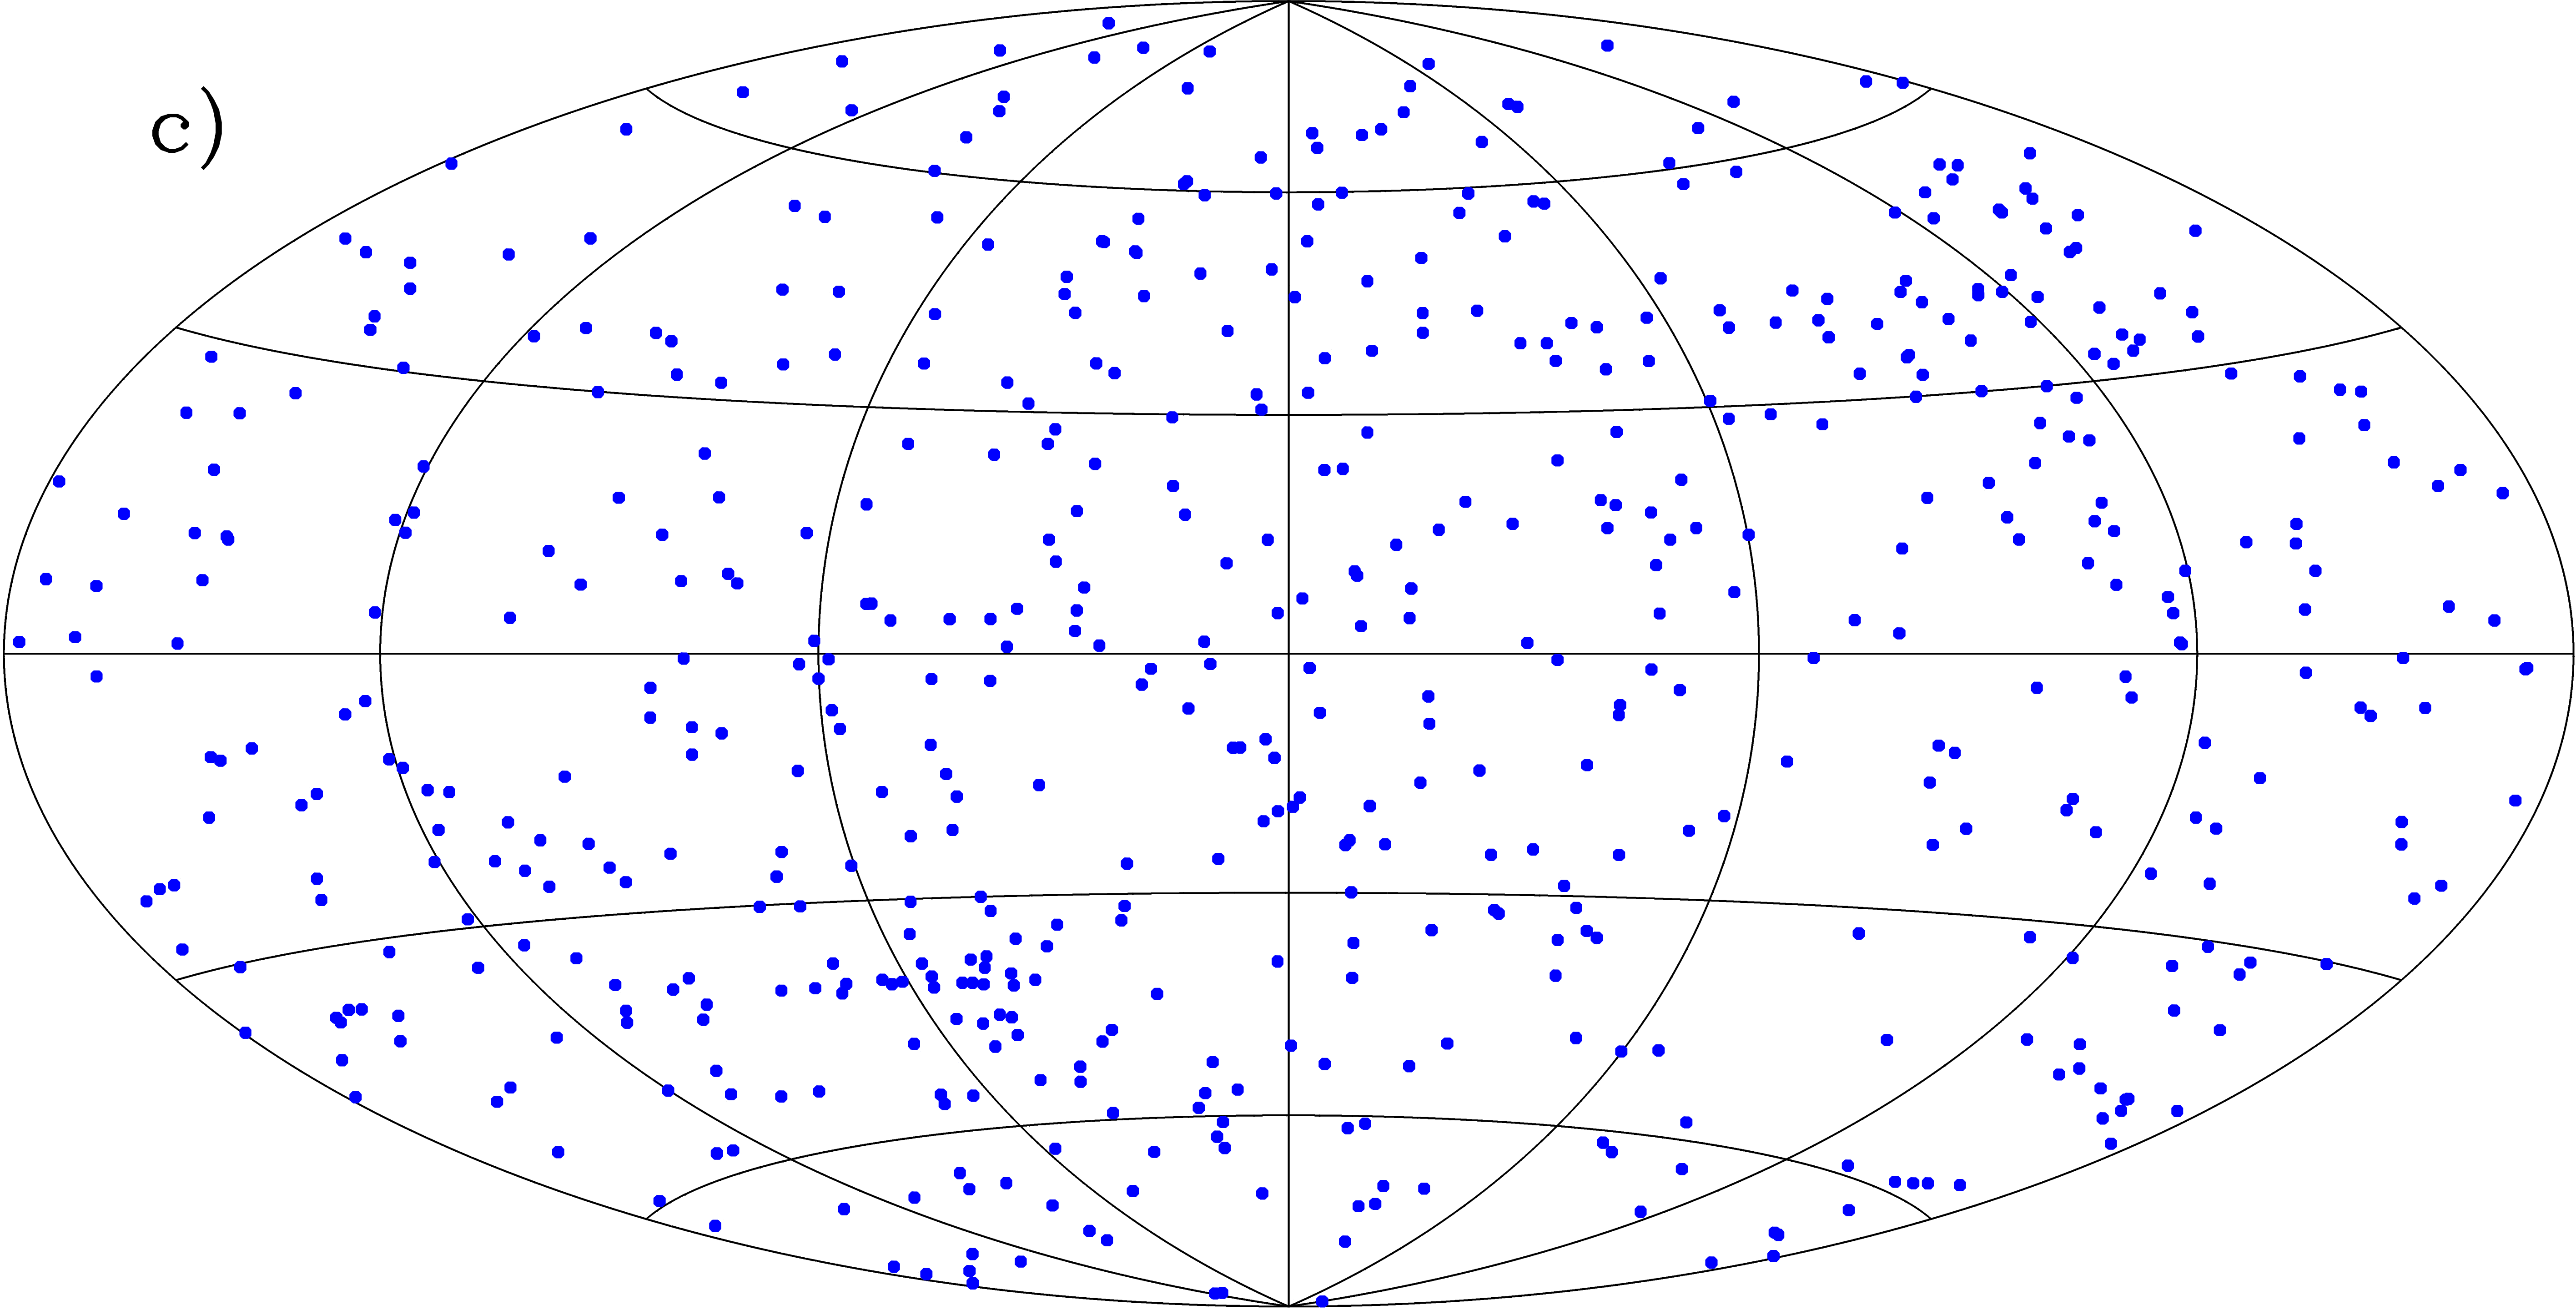
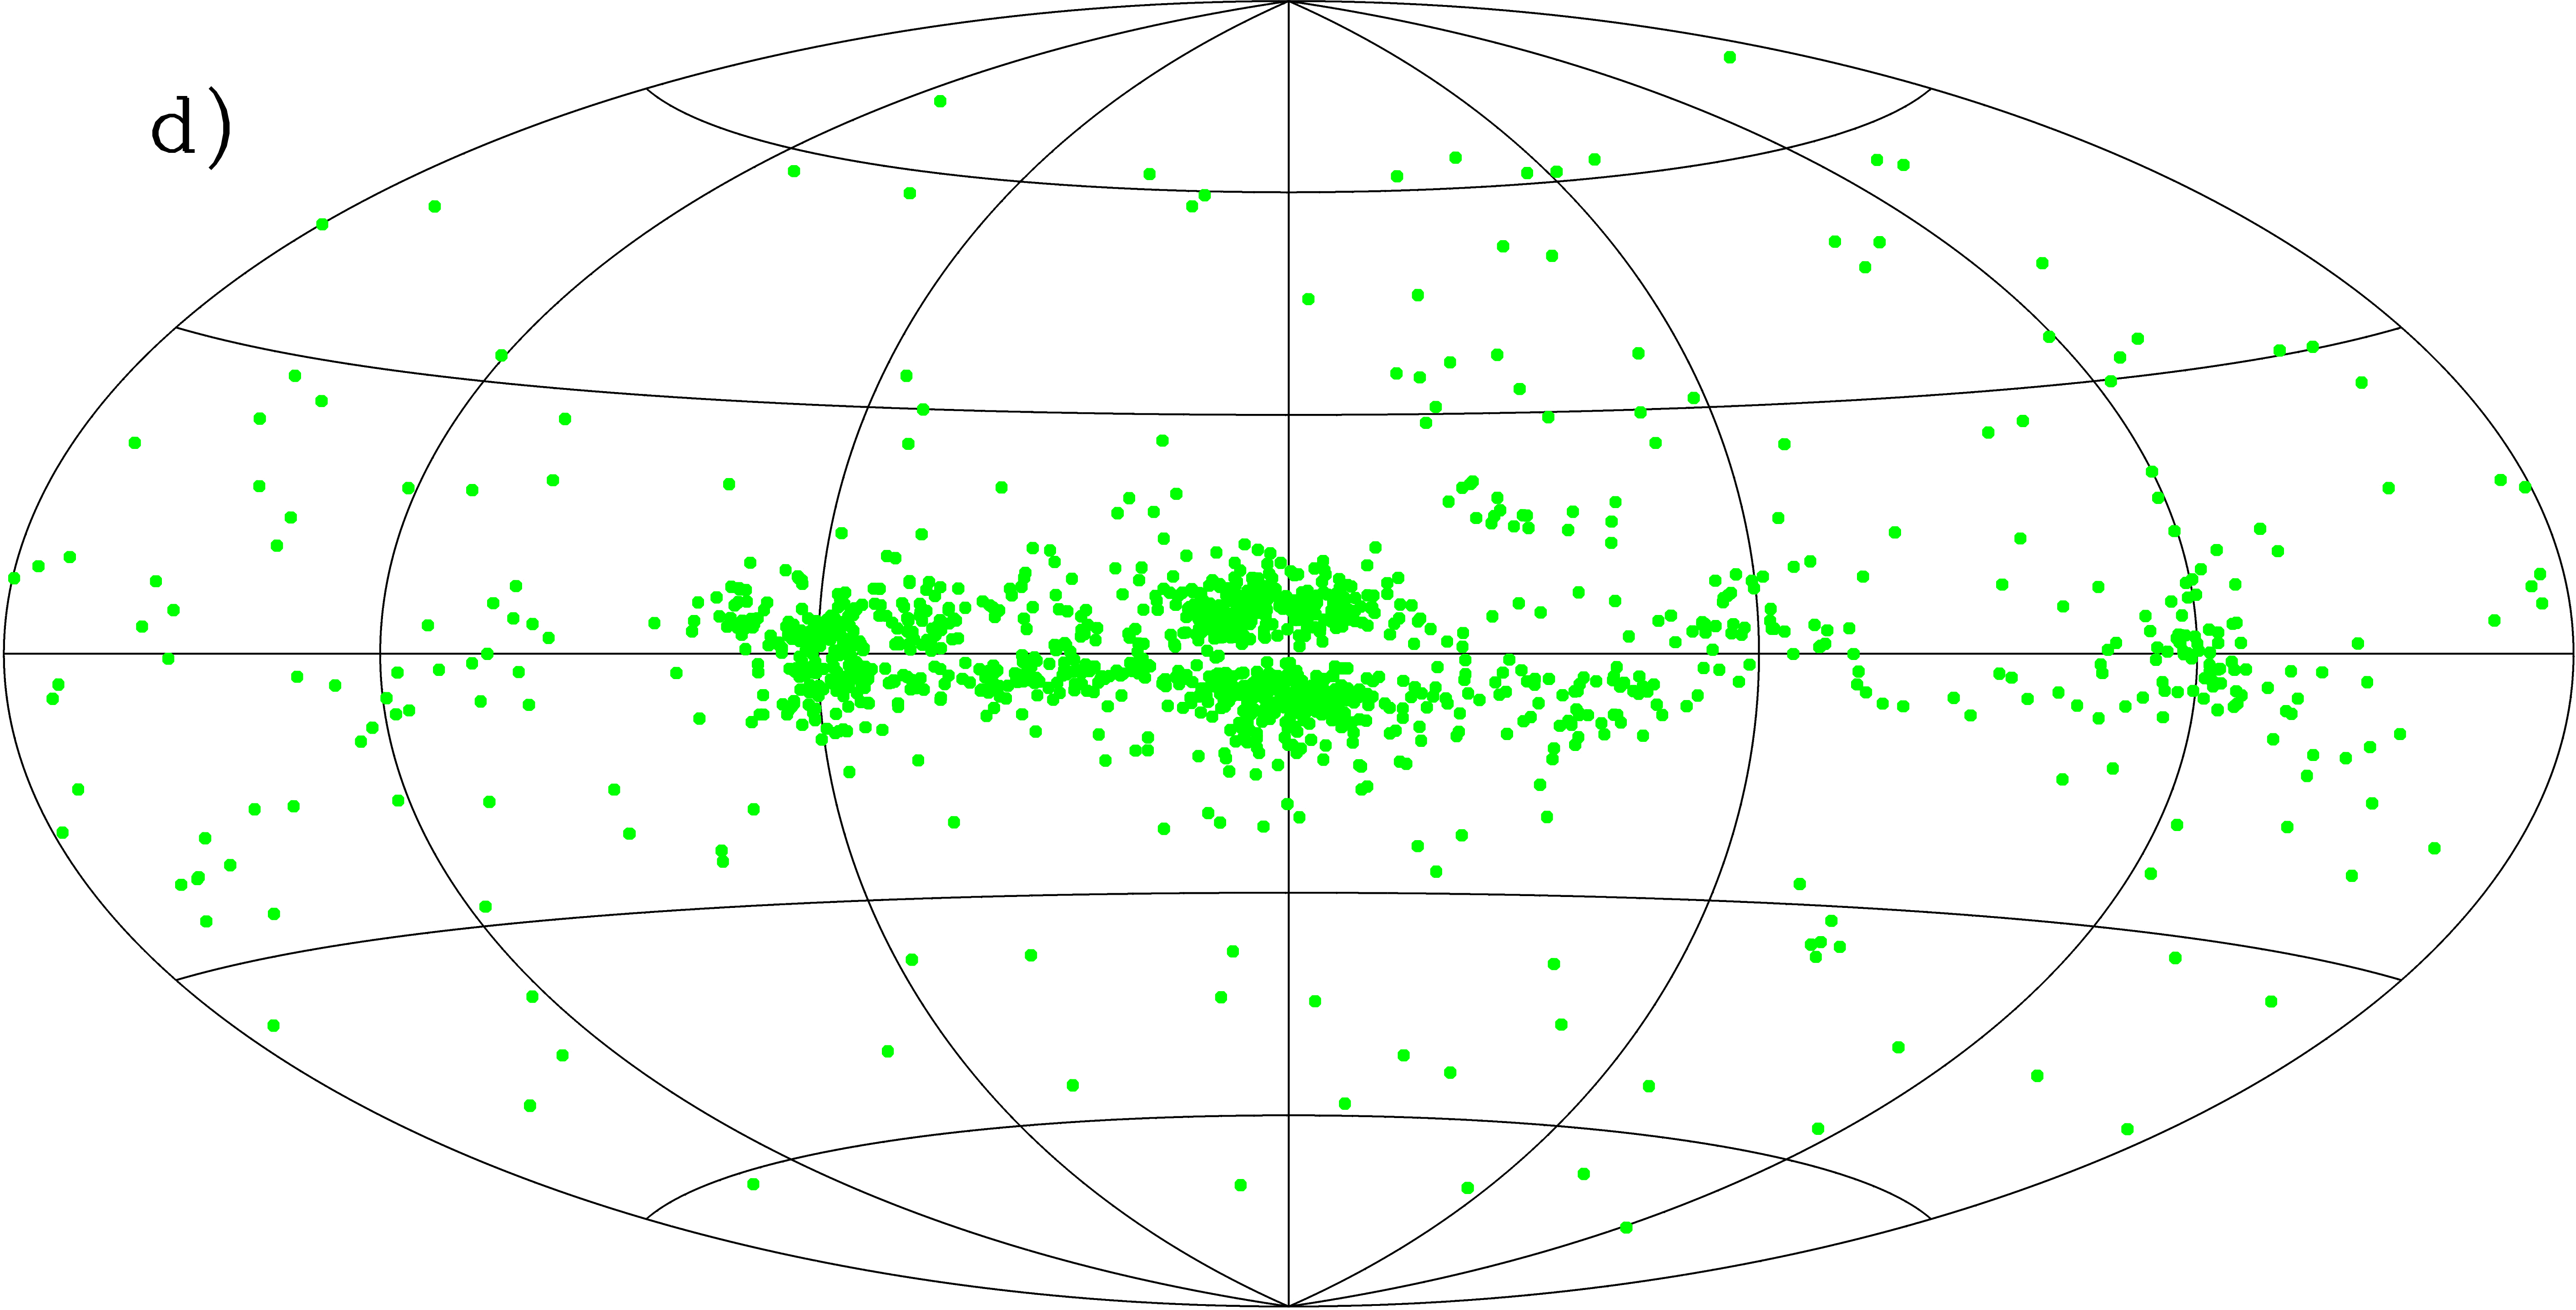
The subsamples of different astrometric and photometric quality show characteristic distributions on the sky (Fig.2). The two top panels a) and b) display the objects with good astrometry. They are, as expected for nearby objects, uniformely distributed over the sky, except for some empty regions seen in panel a), where only few observations could be included in Gaia DR2 (visibility_periods_used). Panel c) corresponding to bad astrometry and good photometry logically contains overdensities in those regions that were empty in panel a). Other concentrations of objects connected to the scanning history of Gaia DR2 are not seen but become visible when we plot higher numbers of these objects within a larger distance limit of 100 pc (not shown here). Panel d) with both bad astrometry and bad photometry displays a very high density in the crowded regions expected close to the Galactic centre and along the Galactic plane, and in the Large Magellanic cloud (at ). Finally, panel e) represents objects without colours with a sky distribution very similar to that of panel d).
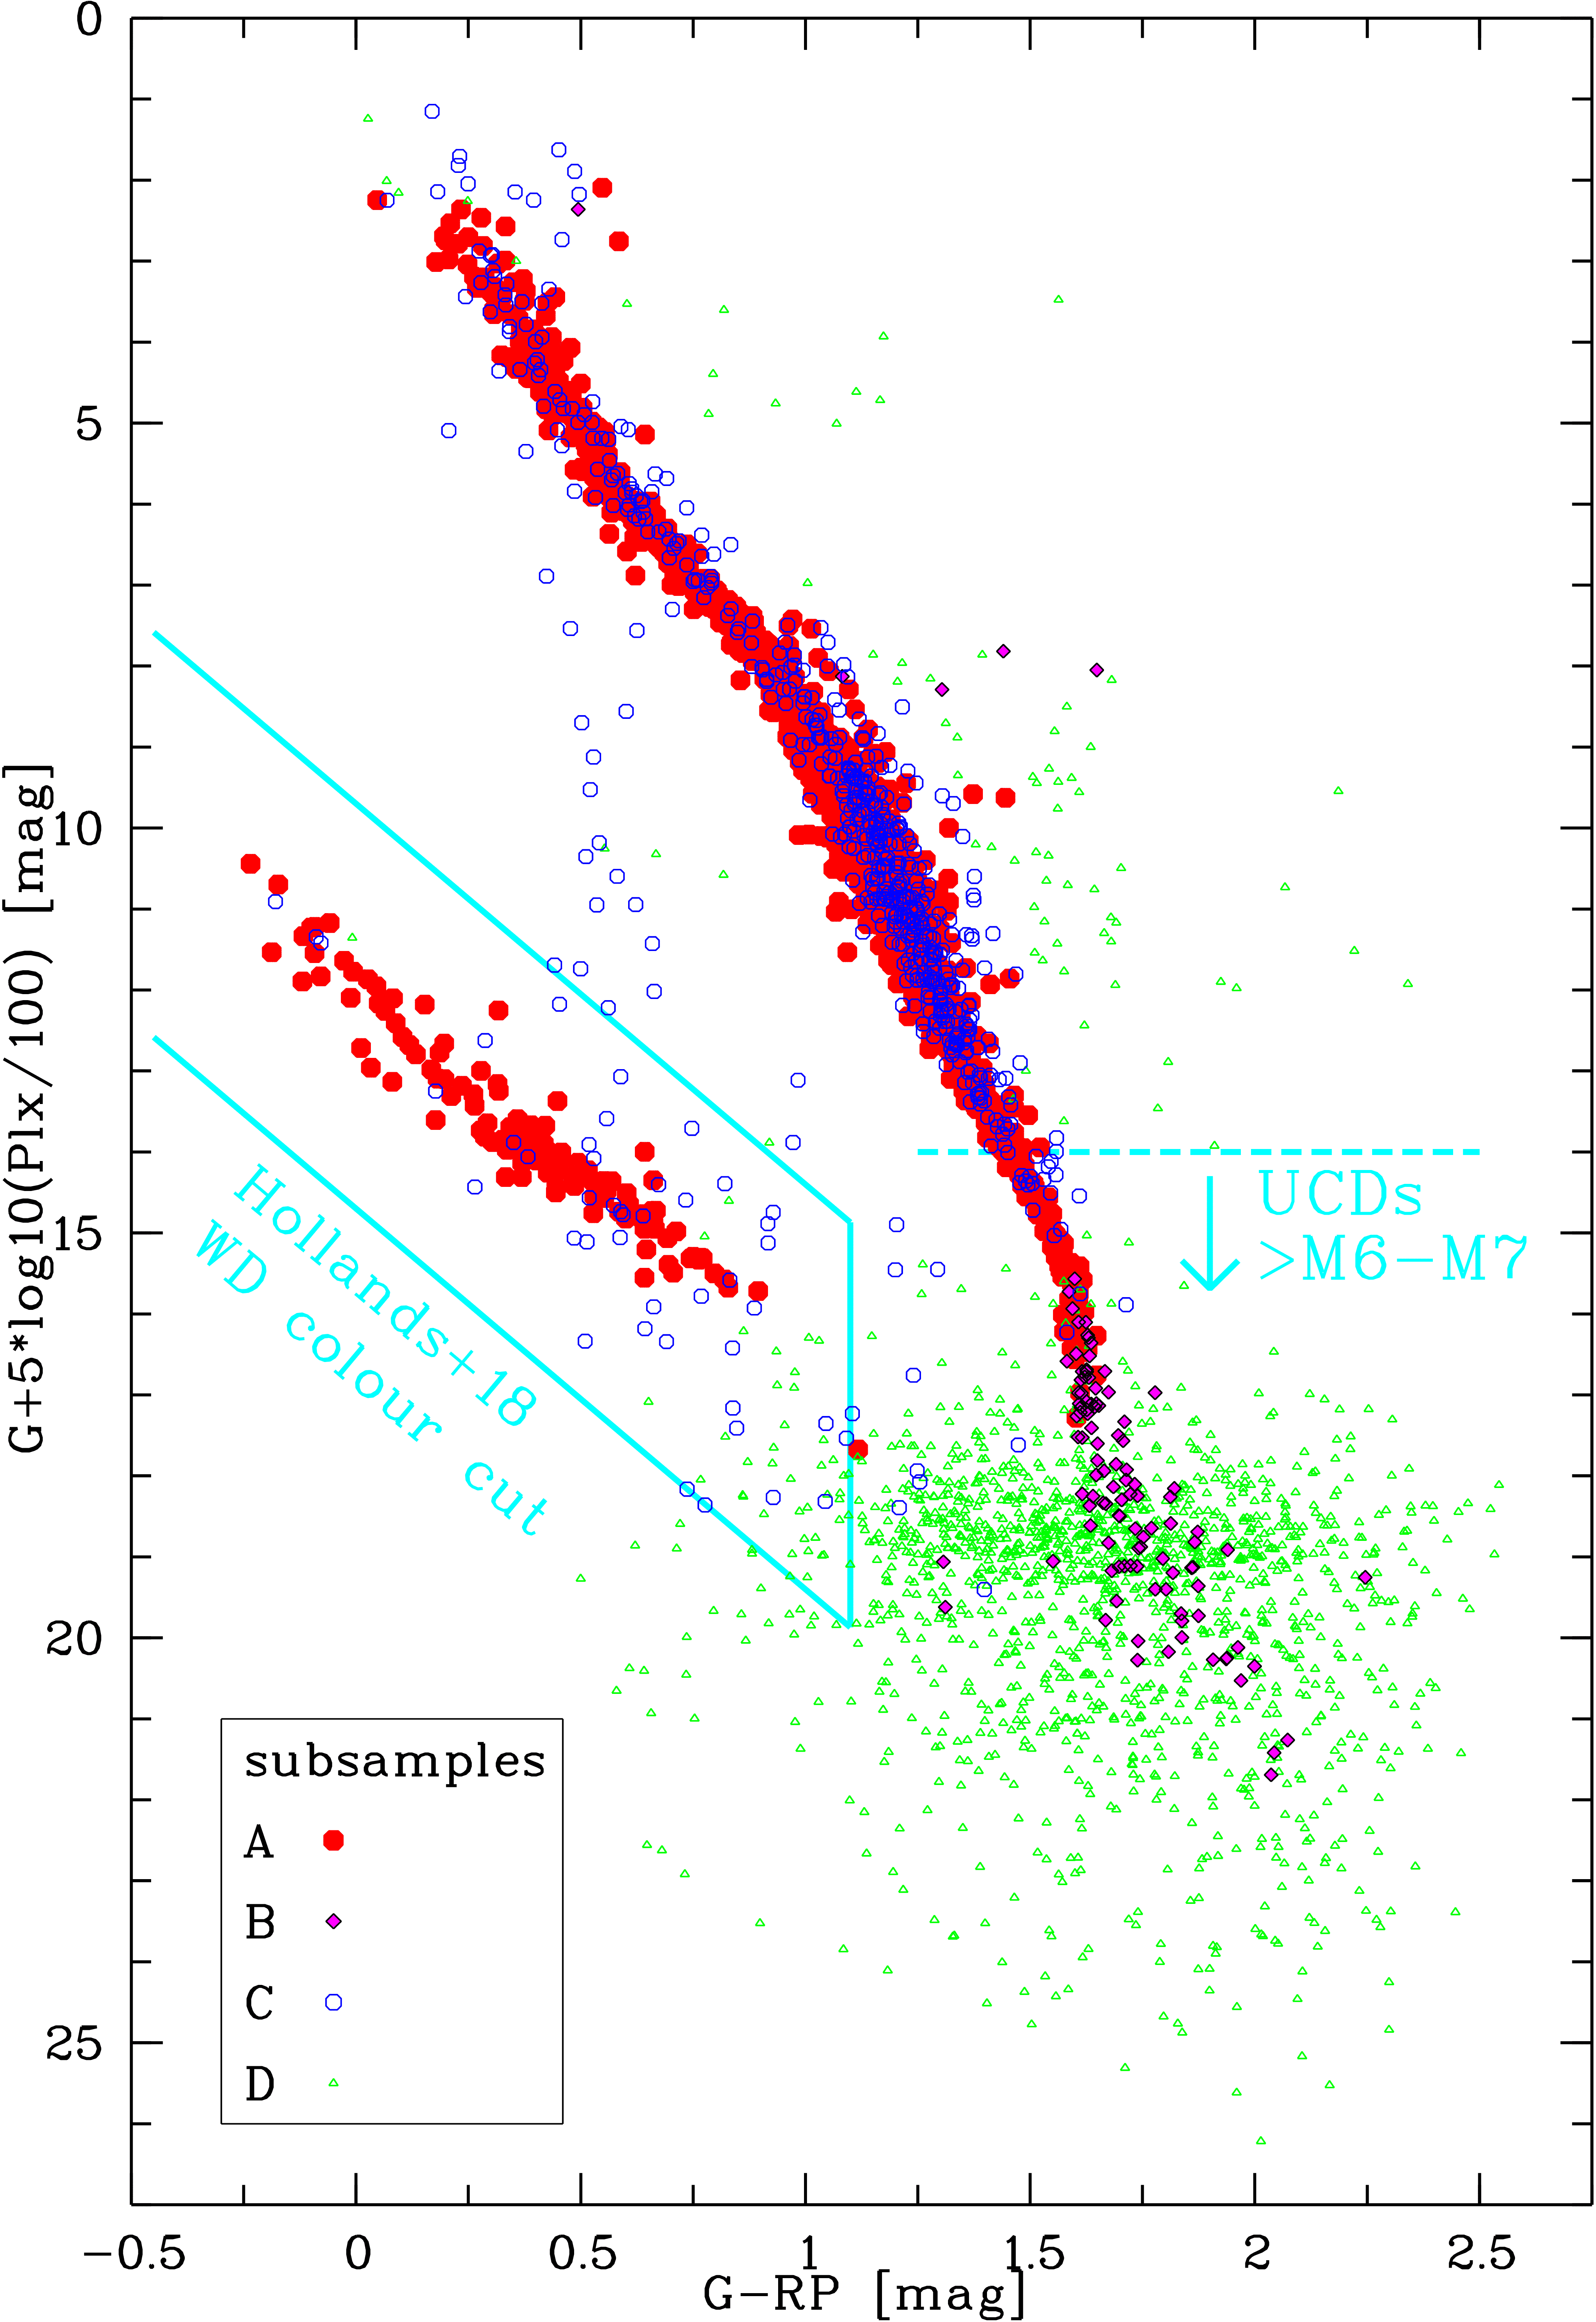
The CMD in Fig.3 represents the full Gaia DR2 20 pc sample of 4108 objects, except for one bright star (Hip 65109) with bad photometry and bad astrometry falling outside the frame. Subsample A, with good astrometry and good photometry, shows a relatively clean MS as well as a clear WD sequence located in the central part of the WD colour box defined by Hollands et al. (2018). In particular, the lower MS, in the range 13 mag17 mag is relatively narrow, if we consider the red large filled symbols only. At fainter absolute magnitudes most objects with good astrometry have bad photometry and belong to subsample B (magenta small filled symbols). Only a few brighter objects of subsample B appear to the right of the MS. The majority of objects with bad astrometry but good photometry (subsample C) follow the MS, but there are also many of the corresponding blue large open symbols scattered below the upper MS towards and around the WD region. Finally, subsample D, representing bad astrometry and bad photometry, mainly separates into two wide distributions, one very wide (the majority of green small open symbols) scattered around the bottom of the MS and reaching the WD colour box of Hollands et al. (2018), and one (with fewer objects) scattered to the right side of the MS above the UCD absolute magnitude cut, which we define at mag.
The faintest objects with good astrometry in our Gaia DR2 20 pc sample (magenta small filled symbols in Fig.3) have absolute magnitudes mag, comparable with the value previously derived for mid-T dwarfs by Smart et al. (2017, see their Fig. 15) based on Gaia DR1 (Gaia Collaboration et al. 2016) photometry and parallaxes from the literature. On the other hand, our more problematic objects with bad astrometry and bad photometry (green small open symbols) reach a faint limit of 26 mag that would probably correspond to late-T or even early-Y dwarfs, if real. In the following, we will show, which of the many faint data points at the bottom of the MS in the Gaia DR2 20 pc CMD (Fig.3) correspond to the relatively small numbers of already known and new real UCDs, respectively.
2.2 known UCDs and WDs
After their initial study of known spectroscopically classified UCDs in Gaia DR1 (Smart et al. 2017), Smart et al. (2019) investigated the structure at the bottom of the MS based on Gaia DR2. The input catalogues of these two studies included 1885 and 3093 known M, L, T, and Y dwarfs, respectively. Since the larger list is dominated by L and T dwarfs, which are mostly too faint for Gaia, only 695 of the 3093 UCDs were found by Smart et al. (2019) in Gaia DR2, and only 134 fall in our Gaia DR2 20 pc sample. Concerning potential members of the Gaia DR2 20 pc sample, only few additional objects were added to the input catalogue of Smart et al. (2019). Among them, there were three mid- to late-L dwarf candidates with estimated photometric distances between 10 pc and 20 pc discovered as red high proper motion (HPM) objects from the Two Micron All Sky Survey (2MASS; Skrutskie et al. 2006), the Wide-field Infrared Survey Explorer (WISE; Wright et al. 2010), and with help from Gaia DR1 and other catalogues (Scholz & Bell 2018). All three were subsequently spectroscopically confirmed (Faherty et al. 2018; Cushing et al. 2018; Lodieu et al. 2019), but only the nearest one (2MASS J19251275+0700362) has a measured Gaia DR2 parallax.

Smart et al. (2019) also mentioned the VVV Infrared Astrometric Catalogue (VIRAC; Smith et al. 2018) as a source for new nearby UCD candidates. The latter work includes ten objects with VIRAC parallaxes 40 mas. We found all of them in Gaia DR2, but only four falling in the Gaia DR2 20 pc sample, including one WD (VVV J14115932-59204570) and one object that appears slightly brighter than our chosen UCD absolute magnitude cut of mag. The remaining two UCD candidate members of the Gaia DR2 20 pc sample from Smith et al. (2018) are the L5 dwarf VVV J17264015-27380372 formerly discovered as VVV BD001 by Beamín et al. (2013) and included in Smart et al. (2019), and another mid-L dwarf candidate (with similar 16.7 mag and colour 1.7 mag), VVV J17134060-39521521, that is missing in Smart et al. (2019).
Reylé (2018) searched for new UCD candidates in Gaia DR2 and found 14 915 objects, all with available colours, and provided spectral type estimates based on photometry. According to these estimates, given in the corresponding machine-readable table including only few of the original Gaia DR2 data (without errors), most of the candidates are late M dwarfs, whereas only 280 (2%) are L dwarfs. After an initial selection of only 74 out of 14 915 objects with parallaxes 40 mas, we used their parallaxes and magnitudes for a cross-match with the full Gaia DR2, since the Gaia DR2 names were not correct for many sources in the machine-readable table of Reylé (2018). Finally, we selected 25 of the 74 objects falling in our Gaia DR2 20 pc sample, according to our soft parallax cut involving the parallax errors (see beginning of Sect. 2). There was only one object in common with the above mentioned subsample of 134 objects from Smart et al. (2019), and the missing VVV J17134060-39521521 was found among those 25 objects from Reylé (2018). These 25 UCD candidates are systematically brighter in absolute magnitudes (13.7 mag17.4 mag, with a peak at 15 mag) than the 134 objects from Smart et al. (2019) (14.5 mag21.7 mag, with a peak at 17 mag).
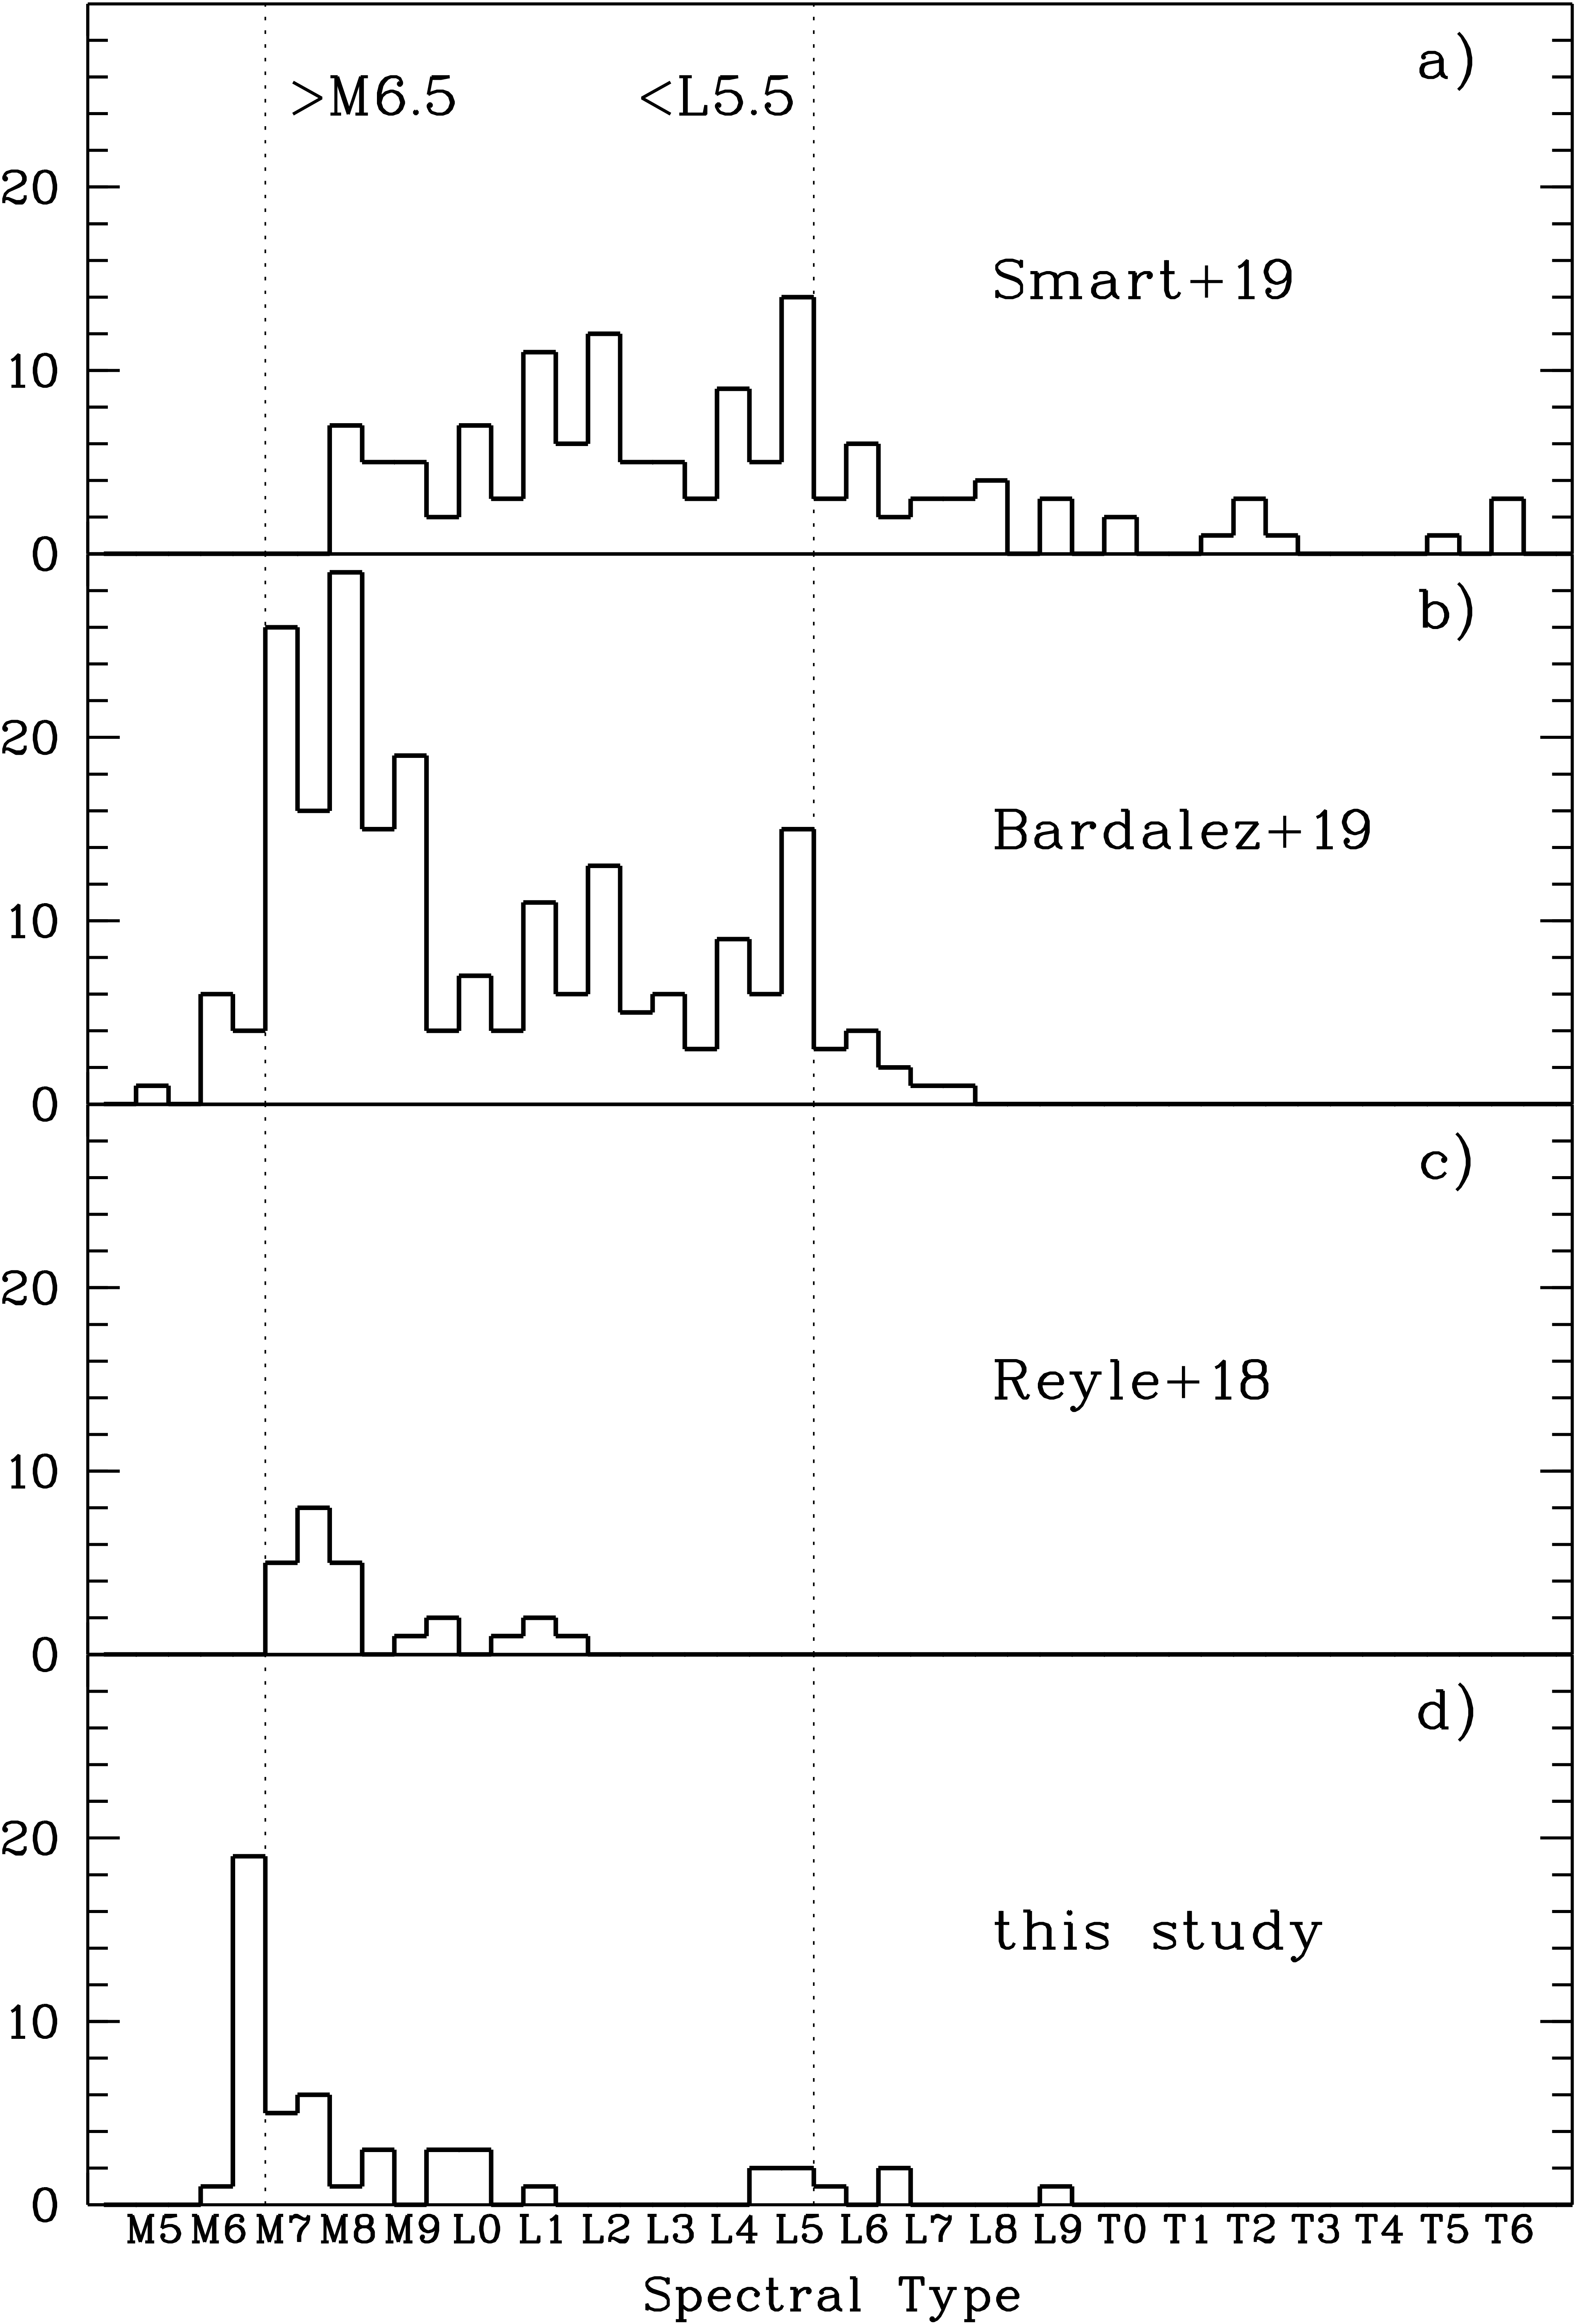
A volume-limited spectroscopic sample of M7-L5 dwarfs within 25 pc was presented by Bardalez Gagliuffi et al. (2019). Out of the 471 entries in their (machine-readable) Table 6, we found 220 belonging to the Gaia DR2 20 pc sample, of which however only 203 were listed with their Gaia DR2 parallaxes by Bardalez Gagliuffi et al. (2019). The 220 entries correspond to 216 Gaia DR2 sources (four are unresolved in Gaia DR2). From these 216 UCDs, there are 109 in common with Smart et al. (2019), whereas Bardalez Gagliuffi et al. (2019) did not include 24 nearby UCDs of Smart et al. (2019), mainly because these have later spectral types (L7-T6). Only two objects out of the 25 new UCD candidates from Reylé (2018) with photometrically estimated spectral types were found among the 216 UCDs of Bardalez Gagliuffi et al. (2019) (one of them was also found in Smart et al. (2019)). The 216 Gaia DR2 sources of Bardalez Gagliuffi et al. (2019) show a wide distribution in absolute magnitudes (11.3 mag20.3 mag, with a peak at 15 mag). The peak in their absolute magnitude distribution is similar to that of the much smaller sample of Reylé (2018), but the even brighter border of the magnitude interval is more typical of mid-M dwarfs than of UCDs. However, there is a large spread in absolute magnitudes of M7 dwarfs. Using the spectral types given by Bardalez Gagliuffi et al. (2019) and selecting only well-measured (resolved or single) objects in Gaia DR2, we find mean values (and standard deviations) of 14.04 (0.470) mag for six M6.0 and 14.02 (1.01) mag for 26 M7.0 dwarfs. For later types we see a clear trend towards fainter absolute magnitudes: 15.12 (0.48) mag for 26 M8.0 and 16.07 (0.27) mag for 19 M9.0 dwarfs. These numbers confirm that our chosen UCD absolute magnitude limit of mag, indicated by a dashed line in all our CMDs, roughly corresponds to M6-M7 spectral types.
The Gaia DR2 20 pc sample of Bardalez Gagliuffi et al. (2019) includes some M5.0-M6.5 dwarfs, which do not meet the classical UCD definition by spectral types M7 (Fig.5). Within the spectral type range M7-L5 of their volume-limited sample (marked by dotted lines), their L dwarfs mostly overlap with those in Smart et al. (2019), whereas they added many more M-type UCDs. The UCD candidates of Reylé (2018) were selected by photometrically estimated spectral types M6.5 corresponding to the spectral type definition of UCDs. However, their spectroscopic classification is still needed and some of these objects may in fact be of earlier spectral types. On the other hand, Reylé (2018) may have excluded some real UCDs by their photometric spectral type cut. The spectroscopic classification of the new UCD candidates of our study will be of course necessary, too. This may lead to changes both towards earlier and later spectral types.
In total, we identified 263 known UCDs from Bardalez Gagliuffi et al. (2019), Smart et al. (2019), and Reylé (2018) in the Gaia DR2 20 pc sample. Out of these 263 objects, 14 lack the and colour measurements and belong to subsample E. The other 249 known UCDs are overplotted in Fig. 4 as open squares. They are wide-spread with respect to their astrometric and photometric quality criteria defined in Sect. 2.1. Out of these 249 known UCDs, 108 (43%) fall in subsample A, 94 (38%) in subsample B, 22 (9%) in subsample C, and 25 (10%) in subsample D.
Concerning the nearby WD census, Hollands et al. (2018) have already investigated the Gaia DR2 20 pc sample and found nine additions, the closest of which lies at a distance of 13 pc, based on Gaia DR2 parallaxes. Their updated WD sample consists of 139 objects. According to their study of the distance-dependent Gaia DR2 completeness, some very nearby WDs (e.g. four known WDs within 10 pc) are still missing, whereas Gaia DR2 should be close to complete with respect to WDs at about 20 pc. In all our CMDs we have marked the WD colour cuts used by Hollands et al. (2018). Out of the 139 known WDs from Hollands et al. (2018), overplotted in Fig. 4 as open lozenges, 119 (86%) belong to subsample A, none to subsample B, 18 (13%) to subsample C, and only 2 (1%) to subsample D. These numbers and the fact that all 139 WDs have measured colours confirm the higher quality of the Gaia DR2 data of nearby WDs compared to that of nearby UCDs. This is simply related to the relatively bright magnitudes and blue colours, at which nearby WDs can be observed.
However, nearby WD companions in close binary systems and nearby WDs overlapping with background objects (e.g. in crowded fields along the Galactic plane) may be difficult targets for Gaia. The two known WDs with both bad astrometry and bad photometry (subsample D) are labelled in Fig.4. Whereas one of them, Sirius B, was obviously hard to be measured by Gaia, the other, Gaia DR2 4970215770740383616, is one of the nine new WDs found by Hollands et al. (2018). This is a previously known HPM star (= LP 941-19) at high Galactic latitude () that happened to move at the Gaia DR2 epochs very close to a similarly bright and blue background star (angular separation 1.2 arcsec).
2.3 search for new UCDs and WDs
After excluding all known UCDs and WDs described in Sect. 2.2 from the Gaia DR2 20 pc sample, we tried to find additional UCDs (called ”new UCDs” in the following) and cool WDs among all 3500 remaining objects with absolute magnitudes mag. Only 44% of these candidates have colour measurements, and their CMD is presented in Fig. 6). At mag, the CMD is clearly dominated by candidates with bad astrometry and bad photometry, which are plotted as green small open triangles. There is only a small number of candidates with good astrometry, which are shown as red and magenta filled symbols. The corresponding UCD candidates are concentrated at the faint end of the MS in the interval 14 mag15 mag and they also extend to fainter magnitudes with a larger scatter in colour. This distribution is similar to that of the previously known UCDs shown in Fig. 4. Only one WD candidate with good astrometry and good photometry falls close to the border of the WD colour box of Hollands et al. (2018) at 1.1 mag. Within this colour box, there is no more trace of a WD sequence. In addition to our general selection of UCD and WD candidates with mag, we also searched for hotter WDs among the small number of brighter objects with 1 mag falling within or a few magnitudes above the WD colour box of Hollands et al. (2018). All these objects have bad astrometry and are shown with open symbols.

The Gaia DR2 5-parameter astrometric solution includes both the parallax and the proper motion of a star. The latter can be easily compared with independent measurements and provide a hint on the reliability of the former. Therefore, we checked the given Gaia DR2 proper motions of all candidates by
- step 1
-
- visual inspection of multi-epoch finder charts from the NASA/IPAC Infrared Science Archive (IRSA; http://irsa.ipac.caltech.edu/applications/finderchart/),
- step 2
-
- comparison with other accurate proper motion catalogues provided by VizieR (http://vizier.u-strasbg.fr/) if available, and
- step 3
-
- comparison with our own proper motion determination using positional data from various catalogues, if needed.
In step 1 we took advantage of the near-infrared (NIR) images from 2MASS (epoch 2000) and WISE (epoch 2010), which are provided by IRSA at a glance with the multi-colour optical images (epochs between 1950 and 2000) from photographic Schmidt plates and, in part of the sky, from the Sloan Digital Sky Survey (SDSS; Abazajian et al. 2009). For UCDs we expected an increase in brightness from the optical to the NIR so that all nearby UCDs should be well seen in 2MASS and WISE images. On the other hand, nearby WDs may be visible or not in WISE and 2MASS but should appear bright and relatively blue in the optical.
In step 2 we found the catalogue of Tian et al. (2017) very useful. This proper motion catalogue combined Gaia DR1, the Pan-STARRS1 Surveys (PS1; Chambers et al. 2016), SDSS, and 2MASS astrometry over about 3/4 of the sky. For some of our brighter late-M candidates other proper motion catalogues like the PPMXL (Roeser et al. 2010) and the first U.S. Naval Observatory Robotic Astrometric Telescope Catalog (URAT1; Zacharias et al. 2015) could also be used for comparison with the Gaia DR2 proper motions.
We performed step 3, when it was necessary, in particular in the case of red objects (which are brighter in 2MASS and WISE) with small proper motions according to both Gaia DR2 and our visual check in step 1. For our own proper motion determination we combined Gaia DR1 and DR2 positions with those from PS1, 2MASS and WISE. When available, we also included positional measurements from the UKIDSS Galactic Plane Survey (GPS; Lucas et al. 2008), the VISTA Hemisphere Survey (VHS; McMahon et al. 2013), the fifth U.S. Naval Observatory Astrograph Catalogue (UCAC5; Zacharias et al. 2017), the final Carlsberg Meridian Catalogue (CMC15; Muiños & Evans 2014), and the first SkyMapper Southern Survey (Wolf et al. 2018).
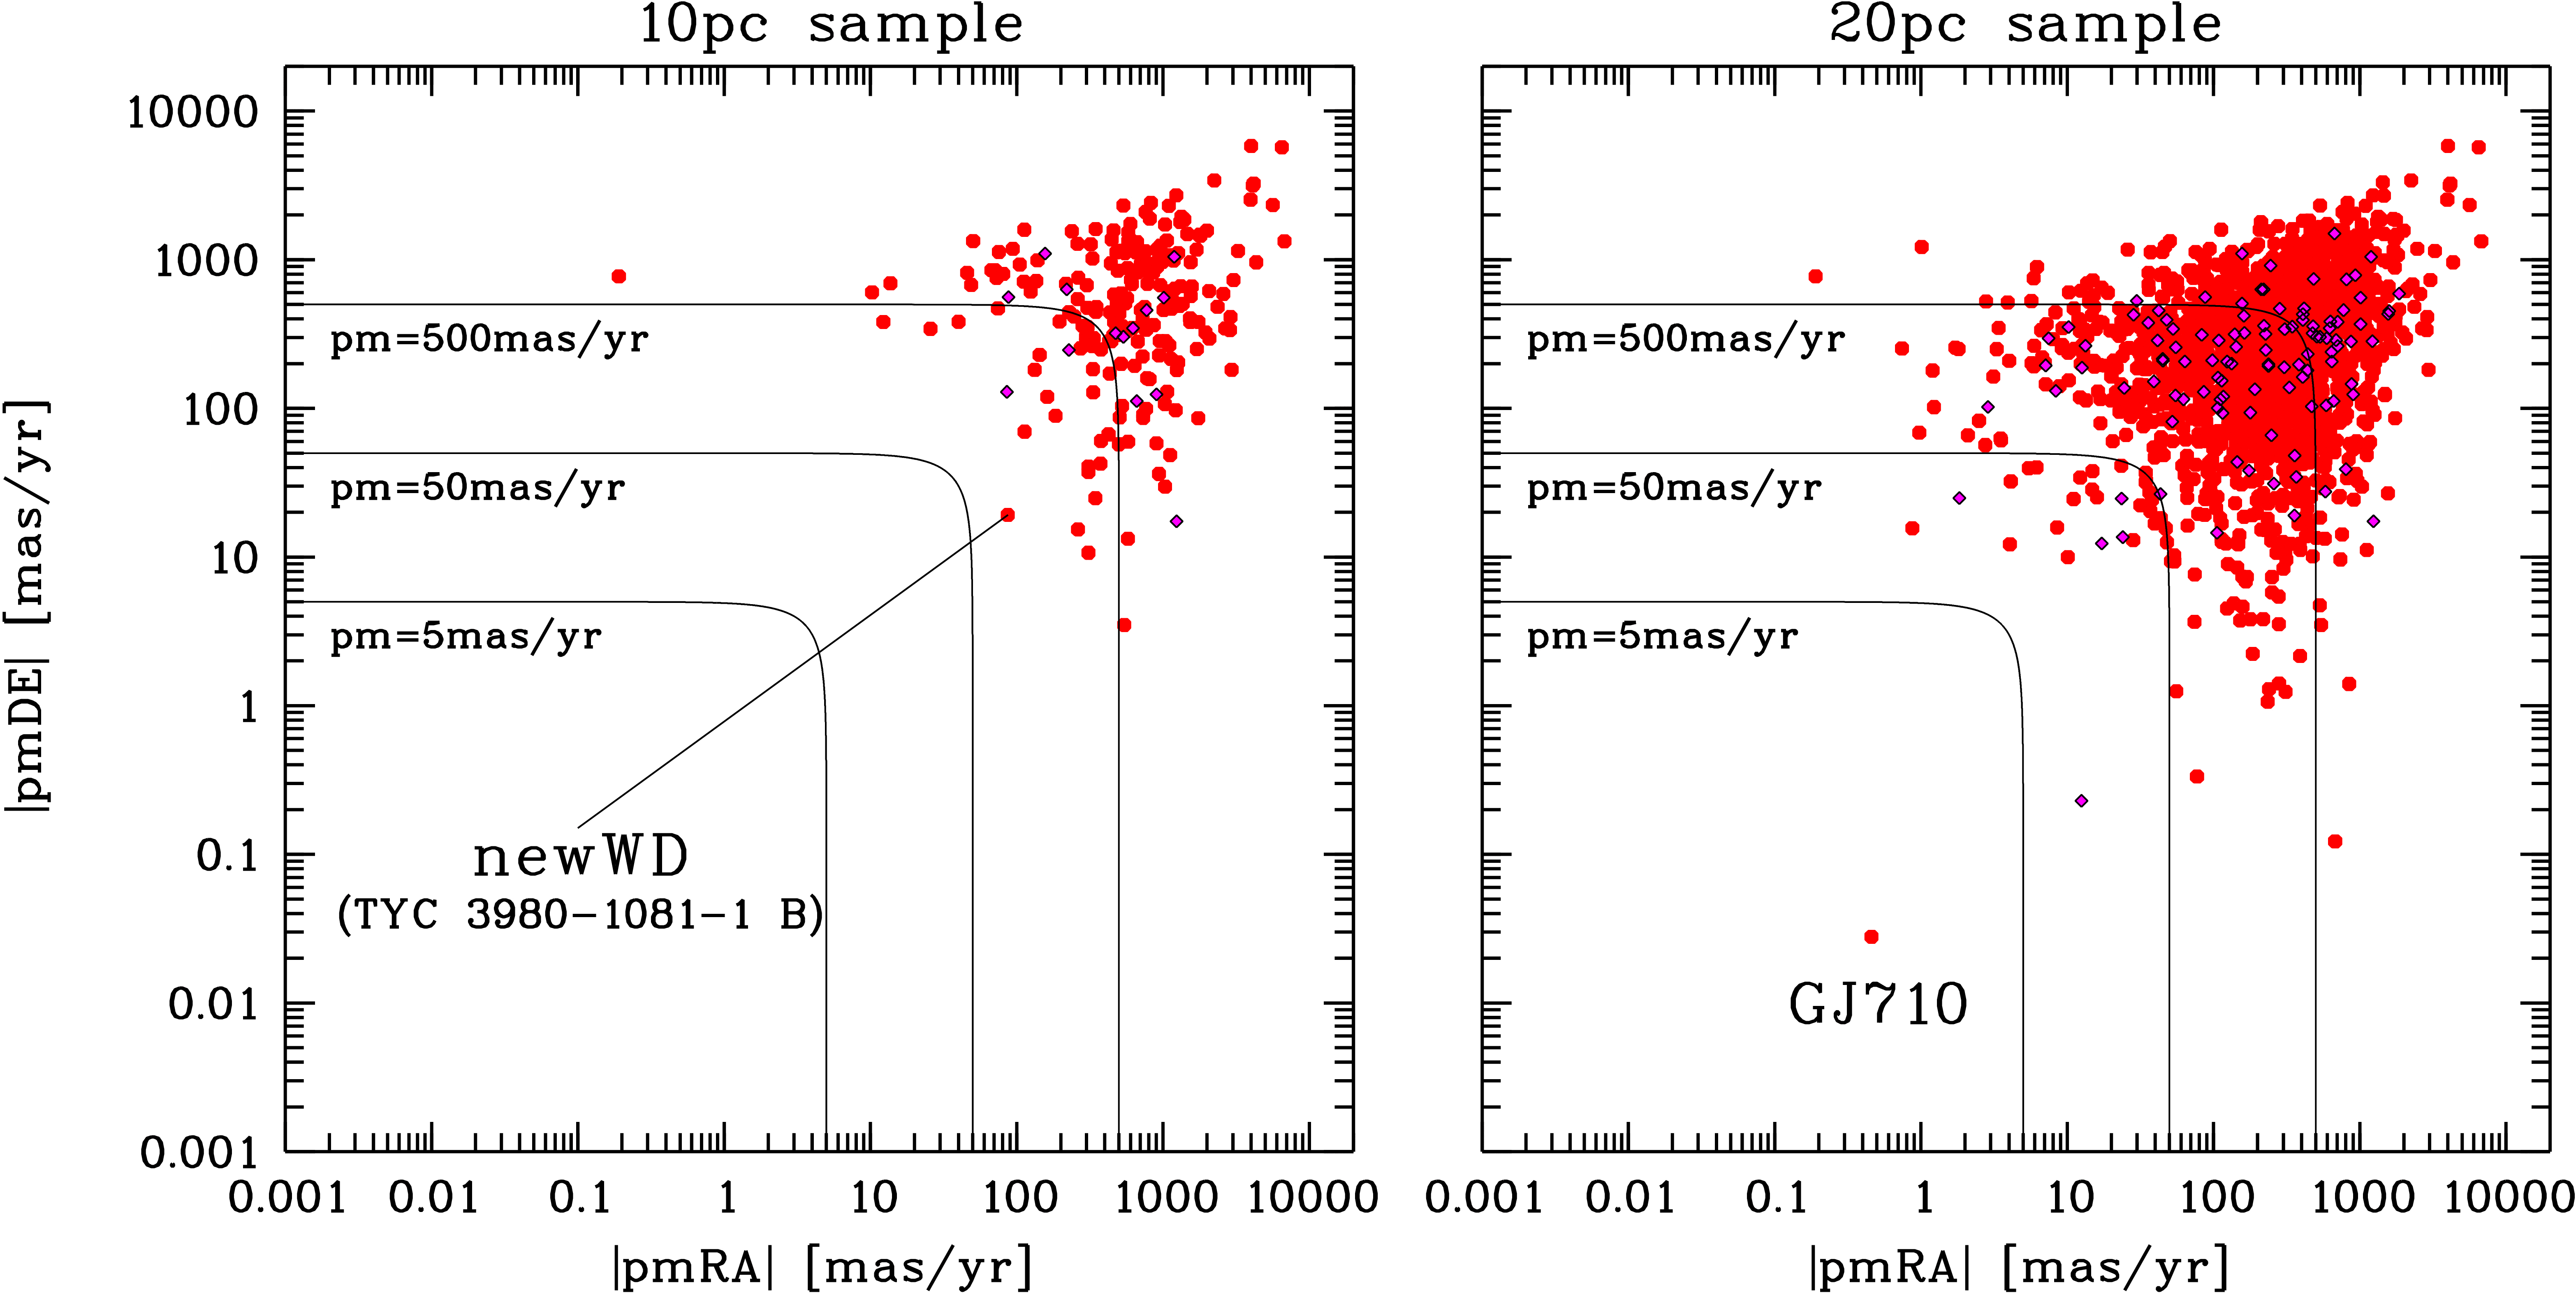

The smaller the Gaia DR2 proper motion, the more difficult it is to confirm or reject it from comparison with other data. However, among the known objects within 20 pc there are only few with very small proper motions. In Fig.7 the absolute proper motion components and are plotted for our subsamples A-D of different astrometric and photometric quality. If we consider only the objects with good astrometry in the top row, the majority of the nearest objects within 10 pc (top left) are clear HPM objects that have total proper motions 500 mas/yr. Their smallest proper motion is 100 mas/yr, and we note that the corresponding object, the new WD TYC 3980-1081-1 B, was only recently discovered (Scholz et al. 2018). Extending the distance of the objects with good astrometry to 20 pc (top right), we see the majority having total proper motions 100 mas/yr, while few objects have smaller proper motions but still mostly 10 mas/yr. Interestingly, there is only one exception of a proper motion of 1 mas/yr, which belongs to the well-known K dwarf GJ 710 that will have a close encounter with the Sun in about 1.3 Myr (Bailer-Jones 2015).
When we look at the bottom row in Fig.7, containing the objects with bad astrometry, we see two remarkable differences that mainly concern the objects with both bad astrometry and bad photometry (subsample D; green small open symbols). First, many of these objects have smaller proper motions than the astrometrically good objects shown in the upper row. Second, there is a suspicious trend to an equal (large) size of both proper motion components (a concentration of objects along the upper diagonal of the plots), which would not be expected for real proper motion distributions. We speculate that this could be the result of systematic mismatches of objects in crowded fields that happened during the data reduction of Gaia DR2. Such errorneous HPM components that are equal in size can also be found for distant objects with very small parallaxes. For instance, we found 50% of the sample of 28 distant hyper-velocity candidates of Du et al. (2019), which appear as Gaia DR2 HPM stars in the Galactic centre and anticentre direction, to be affected by this error.
Although we observed these systematic differences in the proper motions of astrometrically good and bad objects, we tried to find real UCDs and WDs among all our candidates using our three-step procedure for checking the Gaia DR2 proper motions. The success rate of finding new UCDs and WDs was expected to be very low in the Galactic plane regions, dominated by objects of subsamples D and E. Because the DR2 20 pc WD sample was already filled by Hollands et al. (2018) and contained predominantly well-measured objects of subsample A, we did not expect to find many new nearby WDs. On the other hand, the fact that a relatively large fraction of the known UCDs are members of subsample D or belong to subsample E as they have no measured colours (Sect. 2.2) supported our motivation to check the complete sample of unknown UCD and WD candidates.
We were able to confirm 50 of our candidates as red HPM objects, mostly with well-measured bright counterparts in 2MASS and also appearing bright but sometimes merged with other objects in WISE. We considered all these objects as new UCD members of the Gaia DR2 20 pc sample (Fig. 6; six out of 50 are not shown because of they lack colours). On the other hand, we did not succeed in finding new WD members. In particular, the only one object falling at the right border of the WD colour box and belonging to subsample A in Fig. 6 turned out to have a doubtful proper motion in Gaia DR2.
Our new UCDs were not included in the three previous studies of UCDs based on Gaia DR2 data (Bardalez Gagliuffi et al. 2019; Smart et al. 2019; Reylé 2018). However, these studies may have missed some nearby UCDs with previous non-Gaia distance estimates. Therefore, after looking in the SIMBAD data base, we divided our 50 new UCDs in two groups, one with SIMBAD identifications (Table 1, pluses in Fig. 6) and one without (Table 2, crosses in Fig. 6).
The first group consists of 31 objects previously found as nearby candidates in various HPM surveys, as seen from their designations (e.g. LSPM (Lépine & Shara 2005), 2MASS (Kirkpatrick et al. 2016; Luhman & Sheppard 2014; Schneider et al. 2016; Cruz et al. 2003; Phan-Bao et al. 2001; Monet et al. 2000), LP, NLTT, LHS (Luyten 1979b, a), SCR (Finch et al. 2007), SIPS (Deacon & Hambly 2007)). There are also three common parallax and proper motion (CPPM) companions (LP 889-37B, BD+52 911B, GJ 283 B) among them. Their primaries are mid- and early-M dwarfs, and a WD, respectively. About two thirds of the new UCDs in Table 1 have previous trigonometric or photometric distance estimates, which were in some cases based on measurements of their brighter companions. We list them as parallaxes rounded to integer values and mention that their uncertainties were of the order of several milli-arcseconds. Nevertheless, they agreed in most cases rather well with the Gaia DR2 parallaxes. Only for NLTT 14748 the previous parallax value was much larger than measured by Gaia, and, except for LP 816-10, all objects with previous distance estimates were already known to be within 20 pc. About half of the new UCDs in this group had already spectral type information provided in SIMBAD (see references of Table 1).
Among the 19 new UCDs in the second group without SIMBAD identification (Table 2) we found no distance nor spectral type estimates in the literature, except for Gaia DR2 3106548406384807680, already discovered by Mamajek et al. (2018) at its Gaia DR2-based distance of about 13.9 pc (marked in Fig. 6). The new UCDs in this second group and the seven new UCDs from the first group (Table 1) that had no previous distance nor spectral type estimates contain all 12 L-type UCDs and all three M9.5 dwarfs found in this study. We note that two mid-L-type new UCDs and two M9.5 dwarfs (as well as two M8-M8.5 dwarfs) are not shown in Fig. 6, because they lack colour measurements and belong to subsample E.
| SIMBAD | RA | DE | RA | DE | Lit. | SIMBAD | phot. | Q | |||||||
|---|---|---|---|---|---|---|---|---|---|---|---|---|---|---|---|
| Name | tri/pho | SpT (Ref) | SpT | ||||||||||||
| (degrees) | (degrees) | (mas) | (mas/yr) | (mas/yr) | (mag) | (mag) | (mag) | (mag) | (mag) | (mas) | (km/s) | ||||
| LSPM J0025+5422 | 6.314290 | 54.380298 | 59.450.12 | 342.740.14 | 376.190.13 | 14.61 | 1.52 | 10.65 | 10.09 | 9.69 | 68 T (11) | - | M7.51.0a𝑎aa𝑎a( not used) | 41 | A |
| 2MASS J01581572+1807128 | 29.565101 | 18.120624 | 50.840.18 | 88.200.23 | 86.780.19 | 14.19 | 1.45 | 10.50 | 9.93 | 9.60 | - | - | M6.52.0a𝑎aa𝑎a( not used) | 12 | A |
| LP 889-37B | 62.231268 | 31.482721 | 55.780.15 | 19.340.20 | 217.400.44 | 14.77 | - | - | - | - | 64 T (12)b𝑏bb𝑏bparallax of primary | - | M8.01.0 | 19 | E |
| LSPM J0449+5138 | 72.269109 | 51.643140 | 54.390.14 | 36.680.17 | 373.360.13 | 14.61 | 1.51 | 10.50 | 9.78 | 9.42 | 61 T (11) | - | M7.01.0a𝑎aa𝑎a( not used) | 33 | A |
| BD+52 911Bc𝑐cc𝑐ccompanion discovered by Ward-Duong et al. (2015), | 75.856375 | 53.122082 | 72.520.18 | 1286.920.31 | 1570.930.30 | 15.03 | 1.63 | - | - | - | 71 T (13)b𝑏bb𝑏bparallax of primary | - | M8.50.5 | 133 | D |
| NLTT 14748e𝑒ee𝑒ewith non-zero YMG membership probability given in Table 3. | 79.223914 | 56.670247 | 68.830.11 | 140.540.15 | 408.280.14 | 14.23 | 1.47 | 10.35 | 9.76 | 9.38 | 98 T (11) | - | M6.51.5a𝑎aa𝑎a( not used) | 30 | A |
| LP 718-5 | 83.840233 | 9.519472 | 52.180.13 | 343.890.24 | 230.670.20 | 14.39 | 1.51 | 10.41 | 9.77 | 9.42 | 52 P (1) | M6.5Ve (1) | M7.01.0a𝑎aa𝑎a( not used) | 38 | A |
| LSPM J0540+6417 | 85.094863 | 64.283877 | 57.480.20 | 323.870.18 | 105.530.20 | 16.10 | - | 11.60 | 10.93 | 10.54 | - | - | M9.51.0 | 28 | E |
| 2MASS J06320891-1009269 | 98.037603 | 10.158467 | 48.680.82 | 98.031.37 | 210.371.65 | 18.65 | 1.77 | 13.43 | 12.58 | 11.94 | - | - | L5.00.5 | 23 | B |
| 2MASS J06431389+1631428 | 100.808283 | 16.528867 | 49.820.16 | 112.940.28 | 62.300.23 | 14.23 | 1.48 | 10.34 | 9.72 | 9.35 | - | - | M6.51.0a𝑎aa𝑎a( not used) | 12 | A |
| GJ 283 B | 115.085915 | 17.415063 | 109.050.08 | 1152.390.11 | 536.550.12 | 14.17 | 1.47 | 10.34 | 9.82 | 9.48 | 107 T (14) | M6.5Ve (2) | M6.51.5a𝑎aa𝑎a( not used) | 55 | A |
| 2MASS J08334323-5336417 | 128.428118 | 53.609780 | 50.410.09 | 256.010.20 | 388.870.18 | 14.64 | 1.53 | 10.53 | 9.86 | 9.49 | - | - | M7.50.5a𝑎aa𝑎a( not used) | 44 | A |
| SCR J0838-5855 | 129.508533 | 58.934257 | 90.040.22 | 61.820.55 | 317.830.41 | 14.18 | 1.54 | 10.08 | 9.48 | 9.04 | 93 T (15) | M6e (3) | M6.50.5a𝑎aa𝑎a( not used) | 17 | C |
| LP 788-1 | 142.841347 | 17.295745 | 72.180.27 | 367.200.35 | 152.130.34 | 14.29 | 1.48 | 10.37 | 9.76 | 9.36 | 71 T (15) | M6.5 (4) | M6.51.0a𝑎aa𝑎a( not used) | 26 | C |
| LP 848-50 | 160.672533 | 24.267132 | 96.150.47 | 40.790.77 | 156.580.69 | 14.01 | 1.45 | 10.19 | 9.59 | 9.25 | 94 T (15) | - | M6.01.5a𝑎aa𝑎a( not used) | 8 | C |
| 2MASS J11155037-6731332 | 168.965807 | 67.526850 | 57.530.09 | 534.690.17 | 227.090.18 | 15.21 | 1.57 | 10.88 | 10.20 | 9.76 | - | - | M8.50.5a𝑎aa𝑎a( not used) | 48 | A |
| LP 793-34d𝑑dd𝑑dfound as common proper motion companion of LP 793-33=Hip 57361 by Gould & Chanamé (2004). | 176.398174 | 20.351067 | 51.760.10 | 148.820.18 | 68.730.11 | 14.10 | 1.47 | 10.30 | 9.69 | 9.35 | 50 T (13)b𝑏bb𝑏bparallax of primary | M5e (5) | M6.51.5a𝑎aa𝑎a( not used) | 15 | A |
| LP 675-7e𝑒ee𝑒ewith non-zero YMG membership probability given in Table 3. | 185.965979 | 8.979938 | 52.260.12 | 231.610.25 | 275.780.14 | 14.29 | 1.48 | 10.45 | 9.90 | 9.55 | 52 P (16) | M6.5Ve (1) | M6.51.5a𝑎aa𝑎a( not used) | 33 | A |
| LP 911-56 | 206.690122 | 31.823075 | 73.230.16 | 343.360.23 | 158.620.26 | 14.18 | 1.48 | 10.30 | 9.76 | 9.36 | 75 P (17) | M6 (5) | M6.51.0a𝑎aa𝑎a( not used) | 24 | A |
| NLTT 37185 | 215.763247 | 51.775978 | 57.700.10 | 362.660.16 | 193.420.14 | 14.69 | 1.52 | 10.69 | 10.11 | 9.76 | 54 T (18) | - | M7.51.5a𝑎aa𝑎a( not used) | 34 | A |
| 2MASS J14241870-3514325 | 216.077896 | 35.242757 | 52.390.24 | 8.050.45 | 76.490.32 | 14.41 | 1.50 | 10.44 | 9.79 | 9.40 | 54 P (19) | M6.5 (6) | M7.01.0a𝑎aa𝑎a( not used) | 7 | C |
| LHS 2930 | 217.650558 | 59.724252 | 100.290.08 | 808.010.14 | 157.250.13 | 14.87 | 1.53 | 10.80 | 10.15 | 9.79 | 104 T (20) | M6.5V (7) | M7.51.0a𝑎aa𝑎a( not used) | 39 | A |
| LP 624-54 | 243.604961 | 2.848627 | 68.700.13 | 7.220.23 | 367.830.13 | 14.43 | 1.50 | 10.49 | 9.87 | 9.46 | 68 P (5) | M5.0V (8) | M7.01.0a𝑎aa𝑎a( not used) | 25 | A |
| PM J17189-4131 | 259.726030 | 41.531726 | 88.790.18 | 220.050.17 | 911.540.15 | 14.32 | 1.49 | 10.35 | 9.74 | 9.36 | - | M6 (3) | M6.51.0a𝑎aa𝑎a( not used) | 50 | A |
| SIPS J1848-8214e𝑒ee𝑒ewith non-zero YMG membership probability given in Table 3. | 282.211515 | 82.246211 | 56.930.10 | 50.530.14 | 272.510.20 | 14.38 | 1.51 | 10.26 | 9.70 | 9.28 | 57 T (15) | - | M6.51.0a𝑎aa𝑎a( not used) | 23 | A |
| 2MASS J20021341-5425558e𝑒ee𝑒ewith non-zero YMG membership probability given in Table 3. | 300.556473 | 54.433768 | 55.300.11 | 61.130.15 | 365.000.13 | 14.23 | 1.47 | 10.33 | 9.75 | 9.36 | 58 P (17) | M6e (5) | M6.51.5a𝑎aa𝑎a( not used) | 32 | A |
| LP 695-372 | 310.689258 | 5.004822 | 59.640.10 | 241.330.16 | 117.300.11 | 14.08 | 1.46 | 10.33 | 9.75 | 9.42 | 51 P (17) | M6.5 (9) | M6.51.5a𝑎aa𝑎a( not used) | 21 | A |
| LSPM J2049+3336 | 312.363261 | 33.612383 | 59.730.09 | 207.680.13 | 412.070.13 | 14.28 | 1.48 | 10.38 | 9.75 | 9.42 | 68 T (11) | - | M6.51.5a𝑎aa𝑎a( not used) | 37 | A |
| LP 816-10 | 312.471081 | 17.269443 | 53.390.10 | 301.910.17 | 98.570.11 | 14.41 | 1.49 | 10.45 | 9.85 | 9.44 | 45 P (17) | M6 (10) | M7.01.0a𝑎aa𝑎a( not used) | 28 | A |
| 2MASS J21010483+0307047 | 315.274368 | 3.117811 | 54.340.16 | 1023.180.27 | 55.150.26 | 14.56 | 1.54 | 10.38 | 9.64 | 9.24 | 56 T (21) | - | M7.51.0a𝑎aa𝑎a( not used) | 89 | A |
| SIPS J2151-4017 | 327.883041 | 40.290912 | 56.110.15 | 402.560.17 | 265.500.18 | 14.16 | 1.49 | 10.19 | 9.51 | 9.16 | - | - | M6.51.0a𝑎aa𝑎a( not used) | 41 | A |
(1) Reid et al. (2003), (2) Davison et al. (2015), (3) Phan-Bao et al. (2017), (4) Rajpurohit et al. (2013), (5) Phan-Bao & Bessell (2006), (6) Cruz et al. (2003), (7) Bessell (1991), (8) Deshpande et al. (2012), (9) Reid et al. (2004), (10) Phan-Bao et al. (2001), (11) Dittmann et al. (2014), (12) Bartlett et al. (2017), (13) Perryman et al. (1997), (14) Costa et al. (2005), (15) Winters et al. (2017), (16) Scholz et al. (2005), (17) Winters et al. (2015), (18) Finch & Zacharias (2016), (19) Cruz et al. (2003), (20) Monet et al. (1992), (21) Jao et al. (2017).
| Gaia DR2 | RA | DE | RA | DE | phot. | Q | |||||||
|---|---|---|---|---|---|---|---|---|---|---|---|---|---|
| Identifier | SpT | ||||||||||||
| (degrees) | (degrees) | (mas) | (mas/yr) | (mas/yr) | (mag) | (mag) | (mag) | (mag) | (mag) | (km/s) | |||
| Gaia DR2 3195979005694112768 | 63.195222 | 7.571338 | 59.690.34 | 407.800.46 | 429.580.29 | 17.41 | 1.64 | - | 10.92 | 10.80 | L1.01.0 | 47 | B |
| Gaia DR2 3432218798435750016e𝑒ee𝑒efootnotemark: | 95.821390 | 26.524936 | 48.560.71 | 7.681.81 | 131.871.97 | 18.18 | 1.71 | 13.10 | 11.97 | 11.30 | L4.52.5 | 13 | D |
| Gaia DR2 2923887295576778496 | 100.105867 | 23.872644 | 49.890.73 | 191.540.87 | 134.231.52 | 18.88 | 1.75 | 13.56 | 12.58 | 11.93 | L5.51.0 | 22 | B |
| Gaia DR2 3106548406384807680e,h𝑒ℎe,he,h𝑒ℎe,hfootnotemark: | 100.903030 | 2.387939 | 71.921.38 | 28.282.34 | 221.222.48 | 19.96 | 1.93 | 14.77 | 13.66 | 12.91 | L9.02.0 | 15 | D |
| Gaia DR2 5535283658436274944e𝑒ee𝑒efootnotemark: | 113.536854 | 43.506480 | 48.250.84 | 39.141.81 | 151.662.01 | 19.14 | 1.86 | 13.98 | 13.00 | 12.43 | L6.51.0 | 15 | B |
| Gaia DR2 5424690587034891264e,f𝑒𝑓e,fe,f𝑒𝑓e,ffootnotemark: | 143.353445 | 43.893269 | 57.030.10 | 190.580.18 | 162.250.17 | 14.20 | 1.48 | 10.32 | 9.66 | 9.30 | M6.51.0a𝑎aa𝑎afootnotemark: | 21 | A |
| Gaia DR2 5424690587034982144e,f𝑒𝑓e,fe,f𝑒𝑓e,ffootnotemark: | 143.358169 | 43.892756 | 56.910.10 | 196.750.17 | 165.150.16 | 14.14 | 1.48 | 10.26 | 9.61 | 9.21 | M6.51.5a𝑎aa𝑎afootnotemark: | 21 | A |
| Gaia DR2 5432670704985289088 | 145.874266 | 38.566282 | 77.720.09 | 95.110.13 | 161.640.15 | 14.19 | 1.46 | 10.35 | 9.82 | 9.48 | M6.51.5a𝑎aa𝑎afootnotemark: | 11 | A |
| Gaia DR2 5229173470875537664 | 157.802139 | 73.385923 | 54.090.13 | 39.630.23 | 59.370.21 | 15.94 | - | 11.47 | 10.90 | 10.42 | M9.51.0 | 6 | E |
| Gaia DR2 3460907947316392704 | 179.858244 | 36.581076 | 50.450.27 | 78.840.31 | 140.940.20 | 15.87 | 1.68 | 11.07 | 10.35 | 9.82 | L0.01.0 | 15 | D |
| Gaia DR2 1477762323724646272g𝑔gg𝑔gCPPM with the known M4 dwarf UCAC3 244-106602 (angular separation 9 arcsec), | 214.942956 | 31.619184 | 52.650.10 | 104.210.17 | 21.290.17 | 14.07 | 1.46 | 10.30 | 9.70 | 9.36 | M6.51.5a𝑎aa𝑎afootnotemark: | 10 | A |
| Gaia DR2 6031367499416648192e𝑒ee𝑒efootnotemark: | 252.101014 | 29.219946 | 50.000.76 | 62.371.47 | 115.010.69 | 18.50 | 1.70 | 13.30 | 12.29 | 11.63 | L4.51.5 | 12 | B |
| Gaia DR2 4169232338868860160 | 262.863382 | 7.997935 | 54.170.17 | 40.760.28 | 227.520.26 | 15.20 | - | 10.93 | 10.25 | 9.82 | M8.50.5a𝑎aa𝑎afootnotemark: | 20 | E |
| Gaia DR2 4171383636445972096 | 271.776456 | 6.430673 | 53.400.47 | 124.010.48 | 206.120.38 | 16.26 | 1.63 | 11.63 | 10.98 | 10.49 | L0.00.5 | 21 | B |
| Gaia DR2 4159791176135290752 | 277.826216 | 7.540994 | 54.000.40 | 136.960.72 | 154.840.67 | 15.89 | 1.71 | 11.16 | 10.36 | 9.86 | L0.01.5 | 18 | C |
| Gaia DR2 4283084190940885888 | 279.045710 | 3.257012 | 54.590.85 | 256.581.37 | 175.691.58 | 18.54 | - | 13.48 | 12.56 | 11.92 | L5.01.0 | 27 | E |
| Gaia DR2 4206320171755704320 | 286.529838 | 5.251398 | 49.120.61 | 223.820.71 | 45.200.59 | 15.88 | 1.64 | 11.37 | 10.72 | 10.27 | M9.50.5 | 22 | D |
| Gaia DR2 6759481141756109056 | 290.376628 | 29.262960 | 66.670.22 | 512.180.30 | 250.760.26 | 14.68 | 1.53 | 10.57 | 9.97 | 9.56 | M7.51.0a𝑎aa𝑎afootnotemark: | 41 | A |
| Gaia DR2 2034222547248988032 | 298.988643 | 32.255061 | 59.340.93 | 381.901.54 | 560.211.49 | 19.14 | - | 14.14 | 13.20 | 12.60 | L6.52.0 | 54 | E |
3 Photometric classification of new UCDs
From Fig.8 it becomes clear that our new UCD additions in the Gaia DR2 20 pc sample considerably filled the lowest absolute magnitude bin 14 mag15 mag. This was expected, as there was no strict absolute magnitude limit in the UCD selections of Bardalez Gagliuffi et al. (2019); Smart et al. (2019), and Reylé (2018). Instead, their samples were selected based on spectral types, where Smart et al. (2019) tended to mainly include L and T dwarfs, whereas the other two studies aimed at a complete census of M-type UCDs, too. Our search was also quite successful in the range 15 mag20 mag, roughly corresponding to spectral types between M8 and L8.
For the photometric classification of our new UCDs we first cross-identified our list with the 2MASS and found high-quality NIR photometry ( quality flags ”AAA”) for almost all of our targets. Only in a few cases, because of bright companions or merged background objects, no magnitudes (LP 889-37B, BD+52 911B) were available, or the magnitude was missing (Gaia DR2 3195979005694112768). In Tables 1 and 2, we list all the corresponding optical and NIR absolute magnitudes and the optical () colour indices, if available.
To estimate mean spectral types, we applied four spectral type-absolute magnitude (, , , and ) and three spectral type-colour (, , and ) relations as given in Reylé (2018, their Table 1). For 27 out of 31 entries in Table1, and five out of 19 entries in Table 2, the relation between spectral type and colour given by Reylé (2018) was not used as it was only valid for M9-T6 dwarfs. For the objects with partly lacking photometric measurements, the spectral types were estimated based on fewer data and are therefore less reliable. The given uncertainties are the standard deviations of the values determined from the different relations for a given object. The mean values and their uncertainties were rounded to 0.5 spectral types. Typical uncertainties fall in the range from 1.0 to 1.5 spectral types. Only 16% (8 of 50 objects in Tables 1 and 2) have more precise 0.5 spectral types. On the other hand, for only 8%, including one M6.5 dwarf in Table 1 and three L4.5-L9 dwarfs in Table 2, the uncertainties were larger (from 2.0 to 2.5 spectral types). For the M8 dwarf LP 889-37B, lacking colour and photometry, we adopted an uncertainty of 1.0 spectral types.
We mentioned that the estimated spectral types for M-type UCDs appeared systematically earlier from spectral type-colour relations than from spectral type-absolute magnitude relations. Nevertheless, we preferred to use the mean spectral types derived from all available data, rather than to restrict our photometric classification to spectral type-absolute magnitude relations only. Previously determined spectral types of nearly half of the objects in Table 1, all of relatively early-type (M5-M6.5) UCDs, are in good agreement with our photometric spectral type estimates. Except for our M71.0 dwarf LP 624-54, formerly classified as M5 by Deshpande et al. (2012), their spectral types agree within our uncertainties. This supported our decision to use all spectral type relations listed in Table 1 of Reylé (2018) in our photometric classification.
Among the new UCDs with SIMBAD identification (Table 1) there are only few late-M (M8-M9.5) dwarfs and only one L dwarf (with a spectral type of L5). However, Table 2, listing the new UCDs without previous SIMBAD identification, contains systematically later types with nearly 60% of them being classified as L dwarfs, including seven L5 dwarfs.
With the UCD definition by an absolute magnitude cut applied in this study, it is clear that all our new UCD candidates will need spectroscopic follow-up. In particular those with photometrically estimated spectral types at or below the classical UCD spectral type dividing line M6.5/M7 may later turn out not to be classical UCDs. However, we note that three of the UCD candidates of Reylé (2018) with photometrically estimated spectral types of M7 and even 15 of the spectroscopically classified by Bardalez Gagliuffi et al. (2019) classical UCDs with M7 fall below our absolute magnitude cut at mag. Because of the already mentioned relatively large spread in absolute magnitudes observed for known M7 dwarfs (Sect.2.2), we found it justified to include a relatively large number of M6.5 dwarfs and one M6 dwarf, as classified by us photometrically, in our new UCD sample presented in Tables 1 and 2.
4 Sky distribution and kinematics of new UCDs
Because of the general difficulty to identify UCDs in crowded fields, we expected some incompleteness of previous searches, e.g. along the Galactic plane. In fact, the sky distributions of previously known and new UCDs are remarkably different (Fig. 9). The distribution of the 263 previously known UCDs reveals some lack of objects in the southern Galactic hemisphere. The north-south asymmetry accounts to 148:115 UCDs. There is also a deficit of objects within from the Galactic equator - only 21% fall in that Galactic latitude zone, whereas with a uniform sky distribution about 26% would be expected. On the other hand, the new UCDs exhibit a north-south ratio of 27:23, and are mainly found close to the Galactic equator - 54% of them are in the Galactic equatorial zone with . This is more than two times larger than expected with a uniform distribution. A comparison of the extended pole regions with also leads to different results for the old and new UCD samples. Out of 263 previously known UCDs, 76 fall in these regions. This corresponds exactly to the about 29% expected with a uniform distribution. But only 6 of the 50 new UCDs can be counted in the extended pole regions, which corresponds to only 12%. Note that the concentration of new UCDs towards the Galactic plane is even stronger for those without SIMBAD identification (crosses in Fig. 9).


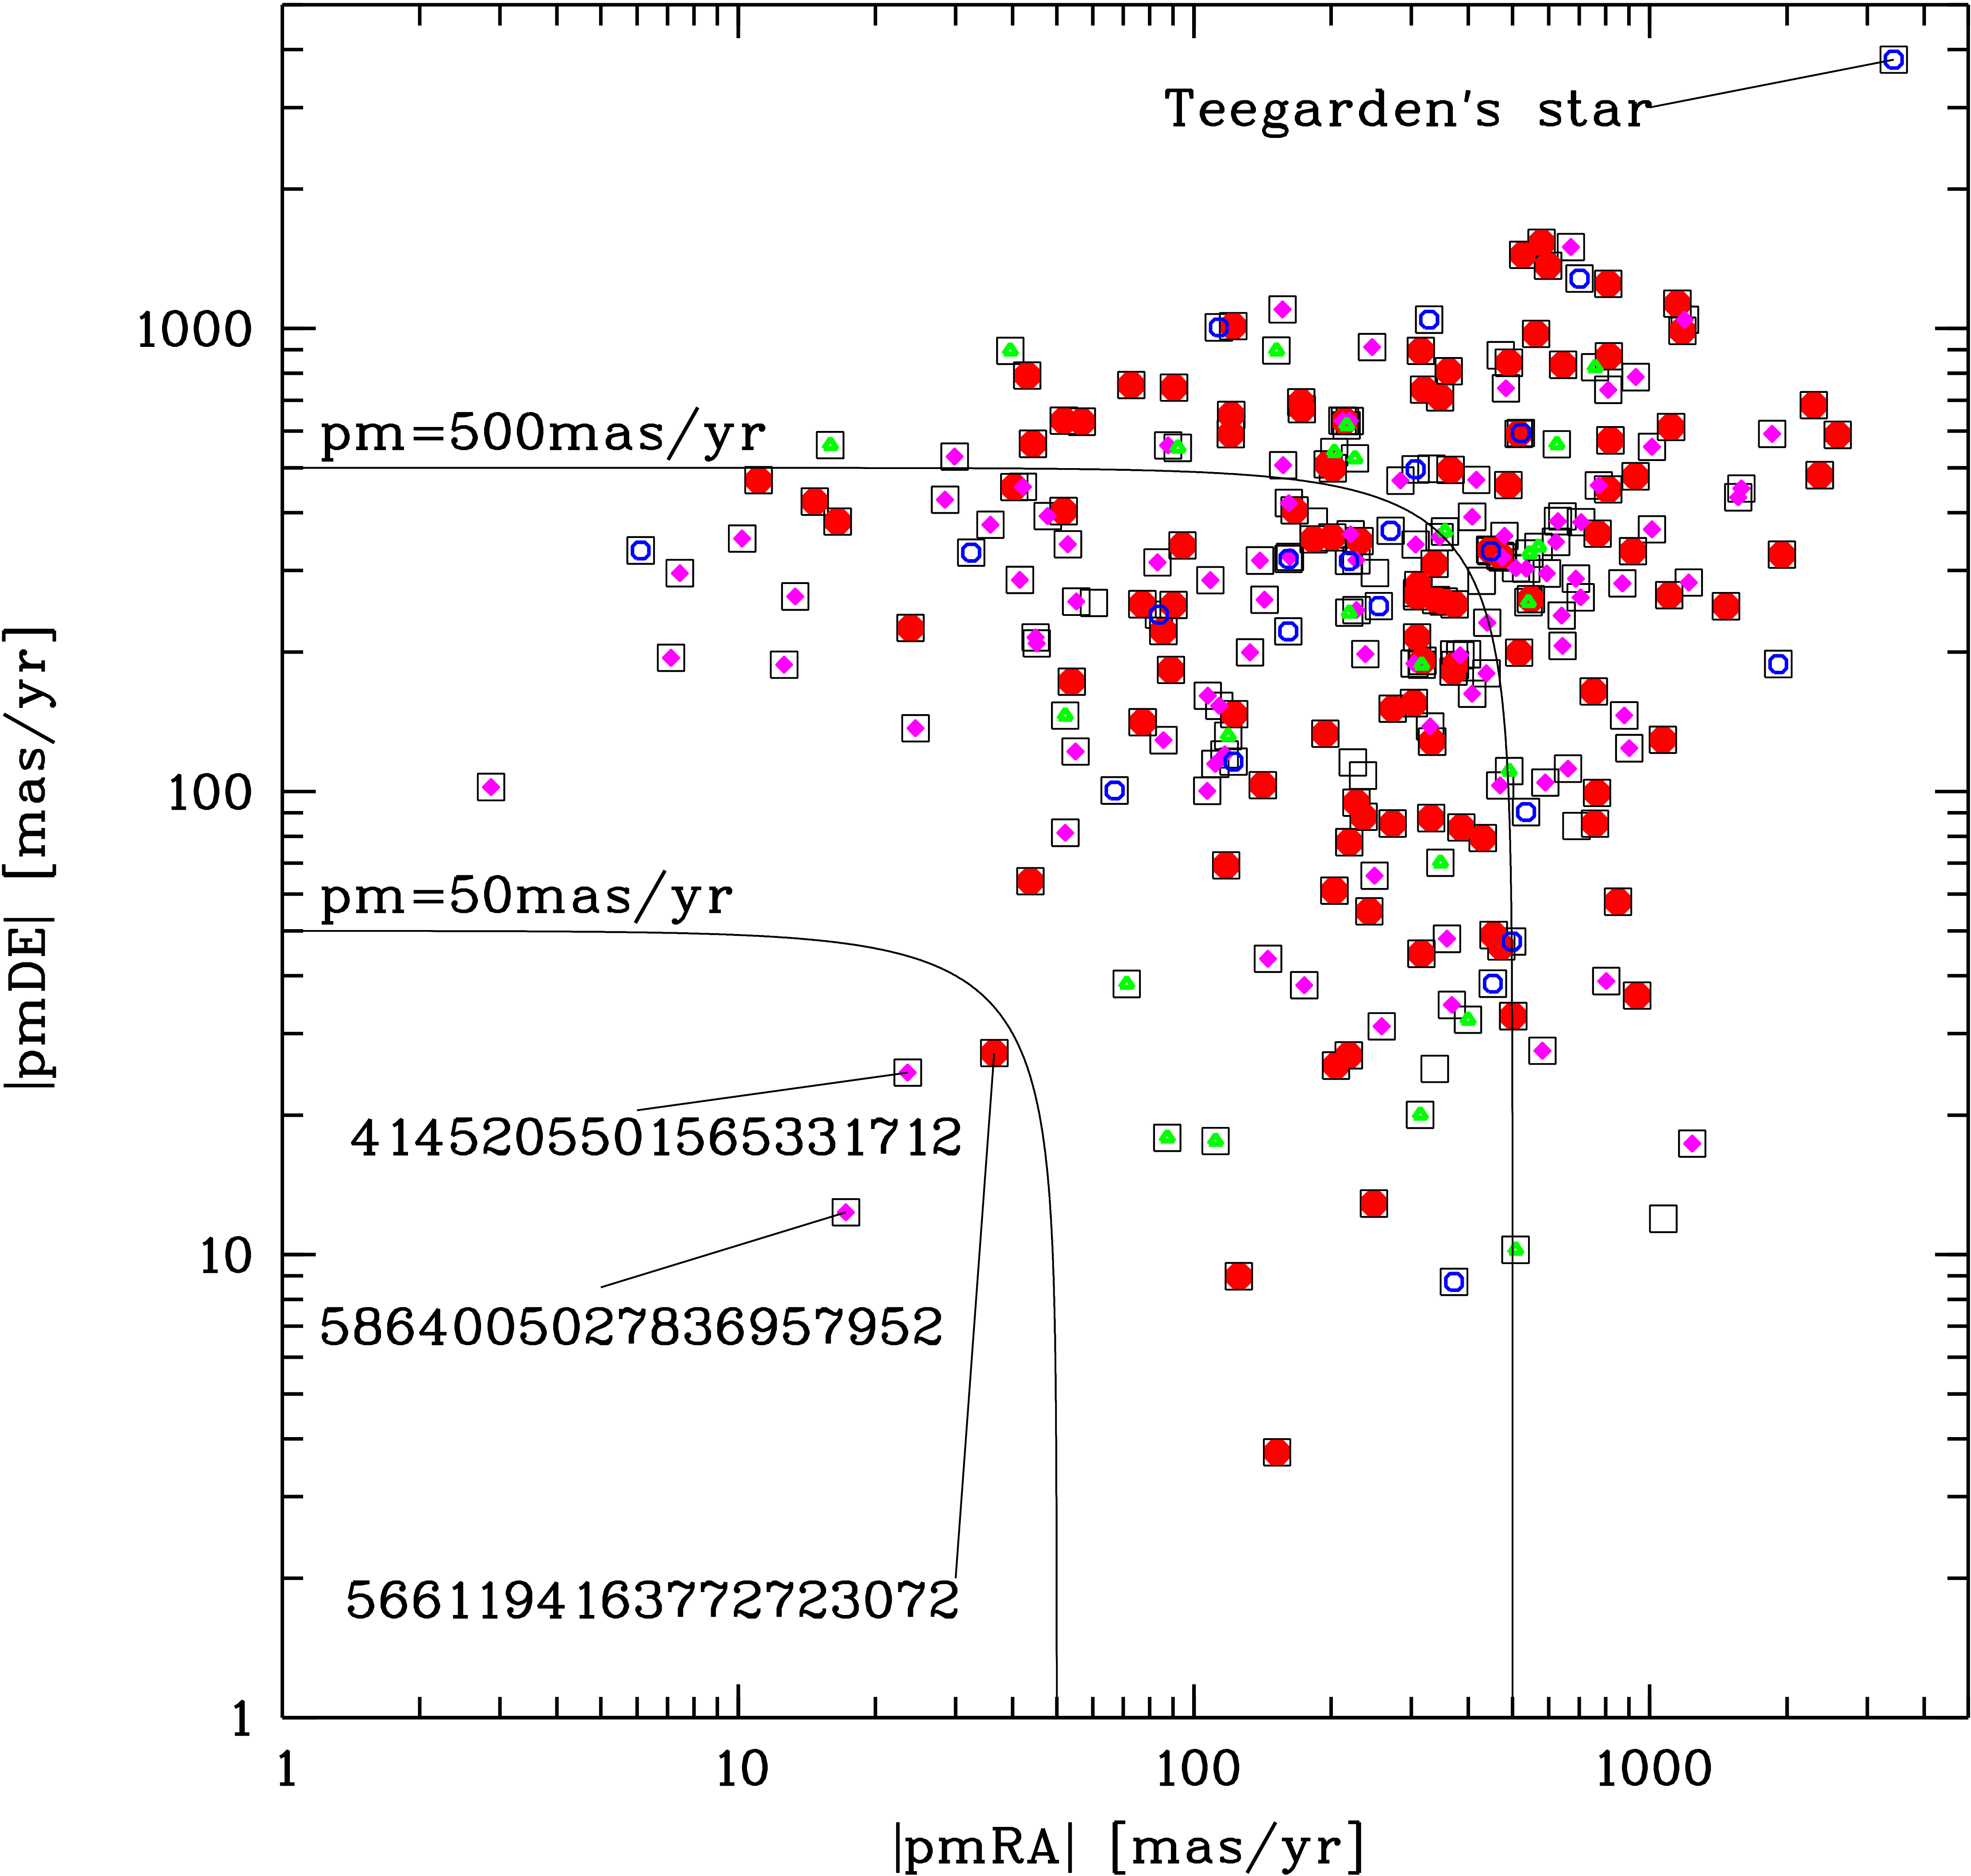
The proper motions of the new UCDs are typically not as large as those of the previously known ones (Fig. 10). Whereas nearly half (48%) of the known UCDs had total proper motions larger than 500 mas/yr, only 10 out of 50 (20%) new UCDs were found with such large proper motions. Even if we account for the fact that all newly found UCDs in the Gaia DR2 20 pc sample are at distances larger than 9 pc, we still notice relatively small proper motions. If we select only the 234 known UCDs at a distance 9 pc, then 43% of them (101 objects) have 500 mas/yr proper motion. This fraction is still more than twice as large as that of the new ones. A trend towards smaller proper motions of new neighbours was expected, since HPM surveys (e.g. Luyten 1979b; Lépine & Shara 2005; Scholz et al. 2005; Deacon & Hambly 2007; Luhman & Sheppard 2014; Kirkpatrick et al. 2016) played an important role in the search for nearby UCDs in the pre-Gaia era.
However, among the new UCDs we did also not find such extremely small proper motions 50 mas/yr as observed for three known UCDs. These three known UCDs as well as one with the largest proper motion are marked in the top panel of Fig. 10, respectively. The latter is Teegarden's star (Teegarden et al. 2003), listed in Bardalez Gagliuffi et al. (2019) as an M7 dwarf and confirmed by the Gaia DR2 parallax of 261 mas as the second nearest known UCD (the nearest in that list and of all 263 known UCDs in our Gaia DR2 20 pc sample is the well-known M6.5 dwarf GJ 1111 with a parallax of 279 mas). Interestingly, all three known UCDs with the smallest proper motions, Gaia DR2 4145205501565331712, Gaia DR2 5661194163772723072, and Gaia DR2 5864005027836957952, were found as UCD candidates in Gaia DR2 by Reylé (2018) and photometrically classified as L1.5, M8.0, and M9.5 dwarfs, respectively. One of them, Gaia DR2 5661194163772723072 was also mentioned in a nearby M dwarfs multiplicity survey by Winters et al. (2019). When we look again at the top right panel of Fig. 7 and compare it with the top panel of Fig. 10, then we note that there are good Solar neighbour candidates with small proper motion and earlier spectral types. However, these possibly not yet identified early- to mid-M dwarf neighbours were not subject of this investigation.

As in Fig. 6, the new UCDs are plotted in Figs.9 and 10 with plus signs, when they were already identified in SIMBAD (Table 1), and with crosses, when they were not (Table 2). In both Figs. 9 and 10 the different astrometric and photometric quality of the known and new UCDs can be seen from the underplotted coloured symbols. There are no obvious systematic effects with quality, neither in the distributions on the sky (panel a) in Fig.9) nor in the absolute proper motion diagrams of the known UCDs (top panel in Fig. 10). In the bottom panel of Fig. 10 one can see that the new UCDs with SIMBAD identification (pluses) have on average larger total proper motions than those without SIMBAD identification (crosses). There is another clear trend visible in the sky distribution of the new UCDs (panel b) in Fig.9), if we exclude the Galactic plane by cutting at and . Outside of such an asymmetric Galactic plane zone, two times broader in the north than in south, there is a lack of open coloured symbols (corresponding to subsamples C and D) and only one exceptional case (see below) of a missing underplotted coloured symbol in the south (corresponding to subsample E). This means, outside of this Galactic plane region, almost all new UCD neighbours appear to be astrometrically well-behaved.
The one exception, LP 889-37B marked in panel b) of Fig. 9, is the fainter component of a close binary (separation 1.2 arcsec) resolved in Gaia DR2 as a CPPM pair (with a mean parallax of 55.5 mas), as already mentioned by Knapp & Nanson (2019). The primary, LP 889-37A, appears 3 mag brighter (13.0 mag) and astrometrically well-behaved (), whereas LP 889-37B is lacking the and measurements and can also be classified as a bad astrometry object (). The previously unresolved HPM star LP 889-37 was included in the catalogue of bright M dwarfs (Lépine & Gaidos 2011) and classified by Bartlett et al. (2017) as a nearby M4 dwarf with a much larger trigonometric parallax (64 mas) than measured by Gaia DR2. The parallax measurement of Bartlett et al. (2017) was probably affected by the unresolved companion.
In Tables 1 and 2 we also list the tangential velocities of the new UCDs computed based on Gaia DR2 data. For comparison, we note that Torres et al. (2019) have studied the different Galactic populations, thin disk, thick disk, and halo, of WDs within 100 pc and compared Gaia DR2 results with simulated data. They showed that the lower limits of the observed tangential velocity of thick disk and halo stars are at 90 km/s and 200 km/s, respectively. However, there is a large overlap of the tangential velocity distributions of thin disk, thick disk and halo stars. According to Fig. 10 of Torres et al. (2019), the tangential velocities of thick disk stars may be as low as 50 km/s, while those of thin disk stars may reach up to about 100 km/s. The highest tangential velocities of thick disk stars are around 160 km/s, but halo stars may have minimum tangential velocities of about 120 km/s.
As a consequence of the already noted systematic differencees in the total proper motions (bottom panel of Fig. 10), the tangential velocities of the new UCDs without SIMBAD identification (Table 2) are systematically lower than those of the new UCDs with SIMBAD identification (Table 1). Whereas all new UCDs without SIMBAD identification have 50 km/s and probably belong to the thin disk population, among those with SIMBAD identification there are two with much larger . One of them, 2MASS J21010483+0307047 has 90 km/s, which lies just at the above mentioned limit between thin and thick disk stars. This HPM star was discovered by Monet et al. (2000), mentioned as a binary by Jao et al. (2017), and reported as an object with clear astrometric evidence of orbital motion (Winters et al. 2019, see their Fig. 12) but not resolved in Gaia DR2. The new UCD with the highest tangential velocity is BD+52 911B (Ward-Duong et al. 2015) with 130 km/s (also marked as the new UCD with the most extreme HPM in Fig. 10). The primary of this resolved Gaia DR2 CPPM companion (separation 5.6 arcsec), BD+52 911, is a long-known high tangential velocity star (e.g. Lee 1984) included in the catalogues of bright M dwarfs (Lépine & Gaidos 2011) and of Gaia DR2 radial velocity standard stars, and targetted by many spectroscopic surveys like HADES (Perger et al. 2017) and CARMENES (Jeffers et al. 2018). From comparison with the population study of Torres et al. (2019), we conclude that this system belongs most probably to the Galactic thick disk. Using the Gaia DR2 data for BD+52 911, including its radial velocity of 65.80.2 km/s, we computed Galactic space velocity (Johnson & Soderblom 1987) components of km/s. According to Fig. 9 (bottom panel) of Dame et al. (2016) showing 3 velocity ellipsoids for different Galactic populations taken from Chiba & Beers (2000), the values fall outside the Galactic thin disk and within the thick disk boundaries, confirming our former conclusion based on tangential velocities alone.
5 Membership in young moving groups
To estimate the possible YMG membership of our 50 new UCDs we used the Bayesian Analysis for Nearby Young AssociatioNs (BANYAN) of Gagné et al. (2018). Their tool provided at http://www.exoplanetes.umontreal.ca/banyan/ allows for kinematic membership determination in 29 known YMGs. As input parameters we used the coordinates, proper motions and parallaxes, but no radial velocities. Those UCDs that had non-zero membership probabilities in at least one of the YMGs are listed in Table 3 and marked by a footnote in Tables 1 and 2.
| Object name | ABDMG | CARN | COL | ARG | Field |
|---|---|---|---|---|---|
| (%) | (%) | (%) | (%) | (%) | |
| NLTT 14748 | 2.4 | 95.4 | 0.1 | 0.1 | 2.0 |
| LP 675-7 | 99.6 | - | - | - | 0.4 |
| SIPS J1848-8214 | 2.3 | - | - | - | 97.7 |
| 2MASS J20021341-5425558 | 64.2 | - | - | - | 35.8 |
| Gaia DR2 3432218798435750016 | - | 0.2 | - | 99.0 | 0.8 |
| Gaia DR2 3106548406384807680 | - | - | 2.4 | - | 97.6 |
| Gaia DR2 5535283658436274944 | - | 0.3 | - | 5.5 | 94.2 |
| Gaia DR2 5424690587034891264 | - | - | - | 40.8 | 59.2 |
| Gaia DR2 5424690587034982144 | - | - | - | 71.4 | 28.5 |
| Gaia DR2 6031367499416648192 | - | - | - | 71.0 | 29.0 |
All of the possible YMG members listed in Table3 have membership probabilities ranging between 0.1% and 99.6%, and belong to one of the following four YMGs: AB Doradus (ABDMG; Zuckerman et al. 2004), Carina Near (CARN; Zuckerman et al. 2006), Columba (COL; Torres et al. 2008), and Argus (ARG; Makarov & Urban 2000). The ABDMG has, according to Luhman et al. (2005) and Barenfeld et al. (2013), an age of 125 Myr, comparable with that of the Pleiades. A relatively old age of about 200 Myr (Zuckerman et al. 2006) is still assumed for CARN, but this YMG has only been sparsely investigated since its discovery. Bell et al. (2015) determined a young age of about 42 Myr for COL and failed to assign an unambiguous age to ARG, because of a contaminated membership list. However, Zuckerman (2019) recently determined a young age of about 40-50 Myr for ARG, too.
Concerning COL, there are only very low membership probabilities determined for two of our UCDs. On the other hand, three of the UCDs listed in Table 3 have very high membership probabilities, between 95% and 100%, in one of the other three YMGs. Of these three, neither the two with SIMBAD identifications (NLTT 14748 in CARN and LP 675-7 in ABDMG) nor the one without (Gaia DR2 3432218798435750016 in ARG) were previously known as YMG members, although one of them, LP 675-7 was included in the input catalogue of Gagné et al. (2015), who searched for UCD members in YMGs. Another three entries of Table 3 show still relatively large membership probabilities between about 64% and 71%. Again, we found that the one of them already identified in SIMBAD 2MASS J20021341-5425558 in ABDGM) was included in the input list of Gagné et al. (2015). The other two, Gaia DR2 5424690587034982144 and Gaia DR2 6031367499416648192, join the highly-probable ARG member Gaia DR2 3432218798435750016. The CPPM companion of Gaia DR2 5424690587034982144, Gaia DR2 5424690587034891264 has a lower 41% membership probability in the same YMG. The many ARG members among our new UCDs, including two photometrically classified L4.5 dwarfs (Gaia DR2 3432218798435750016 and Gaia DR2 6031367499416648192) are remarkable, as they may represent relatively low-mass young brown dwarfs.
6 Discussion and outlook
Some of the nearest known members of the 20 pc sample were not included in Gaia DR2 or have only photometry but no parallax and proper motion measurements, because they are close binaries that could not be well described by the 5-parameter astrometric solution. This concerned all of the nearest known UCD binaries including L and T dwarfs: WISE J1049-5319AB (L7.5+T0.5 at 2.0 pc; Luhman 2013; Burgasser et al. 2013; Lazorenko & Sahlmann 2018), eps Indi Ba+Bb (T1+T6 at 3.6 pc; Scholz et al. 2003; McCaughrean et al. 2004; Dieterich et al. 2018), and SCR J1845-6357A+B (M8.5+T6 at 3.9 pc Hambly et al. 2004; Biller et al. 2006). The first one, WISE J1049-5319AB, was resolved in Gaia DR2 as two nearly equally bright components (16.95 mag) with an angular separation of about 0.9 arcsec, both without proper motion and parallax. The second, eps Indi Ba+Bb, was discovered by McCaughrean et al. (2004) with an angular separation of about 0.7 arcsec in August 2003 and should have appeared with similar separations during the Gaia observational epochs about 12 years later, since the orbital period was found to be about 11.4 yr by Dieterich et al. (2018). However, eps Indi Ba+Bb was not resolved in Gaia DR2 and listed with photometry only (18.6 mag). The third nearest UCD binary, SCR J1845-6357A+B, was found with an angular separation of about 1.2 arcsec in 2005 (Biller et al. 2006). The Gaia DR2 provided full astrometry of the M8.5 primary (with 14.0 mag) but no other object within an angular separation of 3.5 arcsec. A very similar system of a late-M dwarf with a close mid-T dwarf companion is WISE J072003.20-084651.2 (M9.5+T5.5 at 6.8 pc; Scholz 2014; Burgasser et al. 2015; Dupuy et al. 2019). At the expected position of this system, Gaia DR2 contained only an unresolved source (15.3 mag) lacking the parallax and proper motion. This binary had, according to Dupuy et al. (2019), separations of the order of only 0.2 arcsec at the Gaia DR2 epochs.
Some known WDs within 20 pc, including four within 10 pc, are missing from Gaia DR2, or are listed without parallax and proper motion measurements. Hollands et al. (2018) attempted to provide explanations for this. Interestingly, Sirius B had a measured parallax (Fig. 4), whereas Procyon B was not included in Gaia DR2 due to saturation of its very bright primary (separation 4 arcsec). Another very nearby WD companion of a bright star, 40 Eri B (separation 8 arcsec), was listed without parallax and proper motion. The WD Wolf 489, which was missing although not known to be affected by a companion or merged background star, was noted by Hollands et al. (2018) as having an extremely large total proper motion of 4 arcsec/yr. This may have led to matching problems in the Gaia DR2 data reduction. The fourth WD within 10 pc listed without parallax and proper motion is G 99-47, for which Hollands et al. (2018) do not give a note. As in case of Wolf 489, the IRSA finder charts do not show any disturbing background object, but G 99-47 could be a close binary. Toonen et al. (2017) found that possibly more than ten resolved double WDs were not yet recognised in the Gaia DR2 20pc sample.
We speculate that some other nearby and apparently single objects may be also missing in Gaia DR2 because of their not yet uncovered close binary nature. With the next data releases of Gaia, the number of individual epoch measurements will increase, but the astrometric solution will include more parameters, taking into account possible orbital motion of close companion(s). With the growing number of parameters one will have to newly evaluate the astrometric and photometric quality, probably based on a larger number of quality criteria than applied in this work. Again, one can expect that some still problematic nearby objects will be missing or be only partly supplied with the astrometric parameters in Gaia DR3. For those objects with at least given parallax and proper motion, we think that external proper motion checks and visual inspection of IRSA (or other) finder charts will continue to play an important role. This will again help us finding the real nearby stars among probably still large numbers of false positives that we expect in Gaia DR3, especially in crowded regions.
The total number of UCDs increased to 313 objects. We still observe a clear Galactic north-south assymetry of 175:138. However, 83 of the 313 UCDs (26.5%) fall within . This is almost exactly what would be expected with a uniform distribution. Therefore, as a result of our study, this Galactic plane region can no longer be considered as incomplete with respect to UCDs.
We mentioned that our latest-type (L9) new UCD, Gaia DR2 3106548406384807680 (= WISE J064336.71-022315.4; marked in Fig. 6), was already discovered and spectroscopically classified by Mamajek et al. (2018) as an L8 brown dwarf with a distance of 13.9 pc based on Gaia DR2 but not yet included in SIMBAD. Our photometric estimate of the spectral type is in reasonable good agreement with the spectroscopic classification. The relatively small tangential velocity (15 km/s) but nearly ten times larger radial velocity (140 km/s) measured by Mamajek et al. (2018) led them conclude that this object kinematically belongs to the Galactic thick disk and passed close (only 1.4 pc) from the Sun just 100 000 years ago. Currently, only one even closer flyby is known in the recent past, which is that of WISE J072003.20-084651.2 (Mamajek et al. 2015). This already mentioned UCD binary with lacking Gaia DR2 astrometry passed, according to the most recent results of Dupuy et al. (2019), at a distance of 0.33 pc from the Sun just 80 000 years ago.
From their tangential velocities alone (Tables 1 and 2), almost all new UCDs can be considered thin disk members. Only two of them have 90 km/s and are more likely thick disk members. Especially those with the smallest tangential velocities (10 km/s) may be interesting targets for radial velocity measurements. Among them one could find more such close encounters with the Sun, where the total radial velocity is much larger than the tangential velocity. If such cases arise, they possibly represent thick disk members crossing the solar neighbourhood. As we were not able to confirm any new UCD neighbours with extremely small proper motions, we may still miss slowly moving thin disk members like GJ 710 that pass very close from the Sun. Bailer-Jones et al. (2018) investigated the about seven million relatively bright stars with radial velocity measurements in Gaia DR2 and found that GJ 710 is the closest encounter (only 0.08 pc from the Sun. With its exceptional (for stars within 20 pc) zero proper motion and zero tangential velocity, and a radial velocity of only 14 km/s, this is a clear representative of the Galactic thin disk.
We found six most likely members in three YMGs (ABDGM, CARN, and ARG) with membership probabilities between 64% and 100%, one of which has a CPPM companion that has also a relatively high membership probability of 41% in the same YMG. Five of these seven YMG members were photometrically classified by us as M6.5-M7 dwarfs, two of which had already comparable SIMBAD spectral types. There are also two L4.5 dwarfs that were found as 99% and 71% members of ARG, the youngest of the three YMGs, where most members were detected. These mid-L type UCDs may represent very low-mass young brown dwarfs. Low- and medium-resolution spectroscopy are needed to confirm the spectral types of all new UCD YMG members and to search for spectral signatures of youth, respectively.
Only two new UCDs were found within 10 pc, GJ 283 B at about 9.2 pc and LHS 2930 at about 10.0 pc. Both were already known in SIMBAD as M6.5 dwarfs and as members of the 10 pc sample (Table 1), and our photometric spectral types were derived as M6.5 and M7.5, respectively. The next nearest new UCDs found (between 10 pc and 15 pc) are also predominantly of relatively early types (M6-M8.5) with the exception of the late L dwarf Gaia DR2 3106548406384807680 (L8 according to Mamajek et al. (2018), L9 from our photometric classification) at about 14 pc, close to the expected Gaia distance limit predicted by Smart et al. (2017) for objects of this spectral type. The new UCDs found at distances between about 15 and 20 pc are more uniformly spread over spectral types (M6.5-L6.5). We have not found any new T dwarfs within the expected Gaia distance limits (e.g. about 14 pc for T0-T4 according to Smart et al. (2017)). This may be because previous searches for nearby T dwarfs were more successful and complete than for nearby L and late-M dwarfs.
Our UCDs were defined by absolute magnitude and need spectroscopic confirmation, before some of them can be considered as classical UCDs. In Table 1, there are already 14 non-classical UCDs with SIMBAD spectral types between M5 and M6.5, which we classified photometrically as M6.5-M7.5 dwarfs. For another 12 (Table 1) and five (Table 2) only photometrically classified M6-M7.5 dwarfs we can also expect that only part of them will be confirmed spectroscopically as classical UCDs. However, we think that at least the remaining five and 14 photometrically classified M8-L9 dwarfs in Tables 1 and 2 are in fact classical UCDs.
Acknowledgements.
This work analyses results from the European Space Agency (ESA) space mission Gaia. Gaia data are being processed by the Gaia Data Processing and Analysis Consortium (DPAC). Funding for the DPAC is provided by national institutions, in particular the institutions participating in the Gaia MultiLateral Agreement (MLA). The Gaia mission website is https://www.cosmos.esa.int/gaia. The Gaia archive website is https://archives.esac.esa.int/gaia. We have also extensively used SIMBAD and VizieR at the CDS/Strasbourg and would like to thank the CDS staff for their valuable work. The detailed referee report was very helpful for imroving the content and presentation of this paper.References
- Abazajian et al. (2009) Abazajian, K. N., Adelman-McCarthy, J. K., Agüeros, M. A., et al. 2009, ApJS, 182, 543
- Aller et al. (2016) Aller, K. M., Liu, M. C., Magnier, E. A., et al. 2016, ApJ, 821, 120
- Anglada-Escudé et al. (2016) Anglada-Escudé, G., Amado, P. J., Barnes, J., et al. 2016, Nature, 536, 437
- Bailer-Jones (2015) Bailer-Jones, C. A. L. 2015, A&A, 575, A35
- Bailer-Jones et al. (2018) Bailer-Jones, C. A. L., Rybizki, J., Andrae, R., & Fouesneau, M. 2018, A&A, 616, A37
- Bardalez Gagliuffi et al. (2019) Bardalez Gagliuffi, D. C., Burgasser, A. J., Schmidt, S. J., et al. 2019, ApJ, 883, 205
- Barenfeld et al. (2013) Barenfeld, S. A., Bubar, E. J., Mamajek, E. E., & Young, P. A. 2013, ApJ, 766, 6
- Bartlett et al. (2017) Bartlett, J. L., Lurie, J. C., Riedel, A., et al. 2017, AJ, 154, 151
- Beamín et al. (2013) Beamín, J. C., Minniti, D., Gromadzki, M., et al. 2013, A&A, 557, L8
- Bedin et al. (2019) Bedin, L. R., Apai, D., Burgasser, A. J., & Libralato, M. 2019, Confirmation of an Astrometrically Detected Exoplanet Candidate Orbiting the closest Brown Dwarfs, HST Proposal
- Bell et al. (2015) Bell, C. P. M., Mamajek, E. E., & Naylor, T. 2015, MNRAS, 454, 593
- Bessell (1991) Bessell, M. S. 1991, AJ, 101, 662
- Biller et al. (2006) Biller, B. A., Kasper, M., Close, L. M., Brandner, W., & Kellner, S. 2006, ApJ, 641, L141
- Burgasser et al. (2015) Burgasser, A. J., Gillon, M., Melis, C., et al. 2015, AJ, 149, 104
- Burgasser et al. (2013) Burgasser, A. J., Sheppard, S. S., & Luhman, K. L. 2013, ApJ, 772, 129
- Chambers et al. (2016) Chambers, K. C., Magnier, E. A., Metcalfe, N., et al. 2016, arXiv e-prints, arXiv:1612.05560
- Chiba & Beers (2000) Chiba, M. & Beers, T. C. 2000, AJ, 119, 2843
- Costa et al. (2005) Costa, E., Méndez, R. A., Jao, W. C., et al. 2005, AJ, 130, 337
- Cruz et al. (2003) Cruz, K. L., Reid, I. N., Liebert, J., Kirkpatrick, J. D., & Lowrance, P. J. 2003, AJ, 126, 2421
- Cushing (2014) Cushing, M. C. 2014, Astrophysics and Space Science Library, Vol. 401, Ultracool Objects: L, T, and Y Dwarfs, ed. V. Joergens, 113
- Cushing et al. (2018) Cushing, M. C., Moskovitz, N., & Gustafsson, A. 2018, Research Notes of the American Astronomical Society, 2, 50
- Dame et al. (2016) Dame, K., Gianninas, A., Kilic, M., et al. 2016, MNRAS, 463, 2453
- Davison et al. (2015) Davison, C. L., White, R. J., Henry, T. J., et al. 2015, AJ, 149, 106
- de la Fuente Marcos et al. (2018) de la Fuente Marcos, C., de la Fuente Marcos, R., & Aarseth, S. J. 2018, MNRAS, 476, L1
- Deacon & Hambly (2007) Deacon, N. R. & Hambly, N. C. 2007, A&A, 468, 163
- Deshpande et al. (2012) Deshpande, R., Martín, E. L., Montgomery, M. M., et al. 2012, AJ, 144, 99
- Dieterich et al. (2018) Dieterich, S. B., Weinberger, A. J., Boss, A. P., et al. 2018, ApJ, 865, 28
- Dittmann et al. (2014) Dittmann, J. A., Irwin, J. M., Charbonneau, D., & Berta-Thompson, Z. K. 2014, ApJ, 784, 156
- Du et al. (2019) Du, C., Li, H., Yan, Y., et al. 2019, ApJS, 244, 4
- Dupuy & Liu (2017) Dupuy, T. J. & Liu, M. C. 2017, ApJS, 231, 15
- Dupuy et al. (2019) Dupuy, T. J., Liu, M. C., Best, W. M. J., et al. 2019, AJ, 158, 174
- Evans et al. (2018) Evans, D. W., Riello, M., De Angeli, F., et al. 2018, A&A, 616, A4
- Faherty et al. (2018) Faherty, J. K., Gagné, J., Burgasser, A. J., et al. 2018, ApJ, 868, 44
- Finch et al. (2007) Finch, C. T., Henry, T. J., Subasavage, J. P., Jao, W.-C., & Hambly, N. C. 2007, AJ, 133, 2898
- Finch & Zacharias (2016) Finch, C. T. & Zacharias, N. 2016, AJ, 151, 160
- Gagné et al. (2017) Gagné, J., Faherty, J. K., Burgasser, A. J., et al. 2017, ApJ, 841, L1
- Gagné et al. (2015) Gagné, J., Lafrenière, D., Doyon, R., Malo, L., & Artigau, É. 2015, ApJ, 798, 73
- Gagné et al. (2018) Gagné, J., Mamajek, E. E., Malo, L., et al. 2018, ApJ, 856, 23
- Gaia Collaboration et al. (2018a) Gaia Collaboration, Babusiaux, C., van Leeuwen, F., et al. 2018a, A&A, 616, A10
- Gaia Collaboration et al. (2018b) Gaia Collaboration, Brown, A. G. A., Vallenari, A., et al. 2018b, A&A, 616, A1
- Gaia Collaboration et al. (2016) Gaia Collaboration, Brown, A. G. A., Vallenari, A., et al. 2016, A&A, 595, A2
- Gillon et al. (2017) Gillon, M., Triaud, A. H. M. J., Demory, B.-O., et al. 2017, Nature, 542, 456
- Gould & Chanamé (2004) Gould, A. & Chanamé, J. 2004, ApJS, 150, 455
- Hallatt & Wiegert (2019) Hallatt, T. & Wiegert, P. 2019, arXiv e-prints, arXiv:1911.02473
- Hambly et al. (2004) Hambly, N. C., Henry, T. J., Subasavage, J. P., Brown, M. A., & Jao, W.-C. 2004, AJ, 128, 437
- Henry et al. (2019) Henry, T., Jao, W.-C., Riedel, A. R., Slatten, K. J., & Winters, J. 2019, in American Astronomical Society Meeting Abstracts, Vol. 233, American Astronomical Society Meeting Abstracts #233, 259.32
- Henry et al. (2018) Henry, T. J., Jao, W.-C., Winters, J. G., et al. 2018, AJ, 155, 265
- Hollands et al. (2018) Hollands, M. A., Tremblay, P. E., Gänsicke, B. T., Gentile-Fusillo, N. P., & Toonen, S. 2018, MNRAS, 480, 3942
- Jao et al. (2017) Jao, W.-C., Henry, T. J., Winters, J. G., et al. 2017, AJ, 154, 191
- Jeffers et al. (2018) Jeffers, S. V., Schöfer, P., Lamert, A., et al. 2018, A&A, 614, A76
- Johnson & Soderblom (1987) Johnson, D. R. H. & Soderblom, D. R. 1987, AJ, 93, 864
- Kirkpatrick (2013) Kirkpatrick, J. D. 2013, Astronomische Nachrichten, 334, 26
- Kirkpatrick et al. (1997) Kirkpatrick, J. D., Henry, T. J., & Irwin, M. J. 1997, AJ, 113, 1421
- Kirkpatrick et al. (2016) Kirkpatrick, J. D., Kellogg, K., Schneider, A. C., et al. 2016, ApJS, 224, 36
- Kirkpatrick et al. (2019) Kirkpatrick, J. D., Martin, E. C., Smart, R. L., et al. 2019, ApJS, 240, 19
- Knapp & Nanson (2019) Knapp, W. & Nanson, J. 2019, Journal of Double Star Observations, 15, 21
- Lazorenko & Sahlmann (2018) Lazorenko, P. F. & Sahlmann, J. 2018, A&A, 618, A111
- Lee (1984) Lee, S. G. 1984, AJ, 89, 720
- Lépine & Gaidos (2011) Lépine, S. & Gaidos, E. 2011, AJ, 142, 138
- Lépine & Shara (2005) Lépine, S. & Shara, M. M. 2005, AJ, 129, 1483
- Lindegren (2018) Lindegren, L. 2018, Gaia Technical Note GAIA-C3-TN-LU-LL-124-01
- Lindegren et al. (2018) Lindegren, L., Hernández, J., Bombrun, A., et al. 2018, A&A, 616, A2
- Lodieu et al. (2019) Lodieu, N., Chinchilla, P., Ruiz, M. T., et al. 2019, Research Notes of the American Astronomical Society, 3, 30
- Lucas et al. (2008) Lucas, P. W., Hoare, M. G., Longmore, A., et al. 2008, MNRAS, 391, 136
- Luhman (2013) Luhman, K. L. 2013, ApJ, 767, L1
- Luhman & Sheppard (2014) Luhman, K. L. & Sheppard, S. S. 2014, ApJ, 787, 126
- Luhman et al. (2005) Luhman, K. L., Stauffer, J. R., & Mamajek, E. E. 2005, ApJ, 628, L69
- Luyten (1979a) Luyten, W. J. 1979a, LHS catalogue. A catalogue of stars with proper motions exceeding 0”5 annually
- Luyten (1979b) Luyten, W. J. 1979b, New Luyten catalogue of stars with proper motions larger than two tenths of an arcsecond; and first supplement; NLTT. (Minneapolis (1979)); Label 12 = short description; Label 13 = documentation by Warren; Label 14 = catalogue
- Makarov & Urban (2000) Makarov, V. V. & Urban, S. 2000, MNRAS, 317, 289
- Mamajek et al. (2015) Mamajek, E. E., Barenfeld, S. A., Ivanov, V. D., et al. 2015, ApJ, 800, L17
- Mamajek et al. (2018) Mamajek, E. E., Marocco, F., Rees, J. M., et al. 2018, Research Notes of the American Astronomical Society, 2, 205
- Martínez-Barbosa et al. (2017) Martínez-Barbosa, C. A., Jílková, L., Portegies Zwart, S., & Brown, A. G. A. 2017, MNRAS, 464, 2290
- McCaughrean et al. (2004) McCaughrean, M. J., Close, L. M., Scholz, R. D., et al. 2004, A&A, 413, 1029
- McMahon et al. (2013) McMahon, R. G., Banerji, M., Gonzalez, E., et al. 2013, The Messenger, 154, 35
- Miles-Paez et al. (2019) Miles-Paez, P., Metchev, S., Burgasser, A., et al. 2019, Confirming the First Exoplanet around an L Dwarf, Spitzer Proposal
- Monet et al. (1992) Monet, D. G., Dahn, C. C., Vrba, F. J., et al. 1992, AJ, 103, 638
- Monet et al. (2000) Monet, D. G., Fisher, M. D., Liebert, J., et al. 2000, AJ, 120, 1541
- Muiños & Evans (2014) Muiños, J. L. & Evans, D. W. 2014, Astronomische Nachrichten, 335, 367
- Perger et al. (2017) Perger, M., García-Piquer, A., Ribas, I., et al. 2017, A&A, 598, A26
- Perryman et al. (1997) Perryman, M. A. C., Lindegren, L., Kovalevsky, J., et al. 1997, A&A, 500, 501
- Phan-Bao & Bessell (2006) Phan-Bao, N. & Bessell, M. S. 2006, A&A, 446, 515
- Phan-Bao et al. (2017) Phan-Bao, N., Bessell, M. S., Nguyen-Thanh, D., et al. 2017, A&A, 600, A19
- Phan-Bao et al. (2001) Phan-Bao, N., Guibert, J., Crifo, F., et al. 2001, A&A, 380, 590
- Portegies Zwart et al. (2018) Portegies Zwart, S., Torres, S., Pelupessy, I., Bédorf, J., & Cai, M. X. 2018, MNRAS, 479, L17
- Rajpurohit et al. (2013) Rajpurohit, A. S., Reylé, C., Allard, F., et al. 2013, A&A, 556, A15
- Reid et al. (2003) Reid, I. N., Cruz, K. L., Allen, P., et al. 2003, AJ, 126, 3007
- Reid et al. (2004) Reid, I. N., Cruz, K. L., Allen, P., et al. 2004, AJ, 128, 463
- Reylé (2018) Reylé, C. 2018, A&A, 619, L8
- Ribas et al. (2018) Ribas, I., Tuomi, M., Reiners, A., et al. 2018, Nature, 563, 365
- Riedel et al. (2019) Riedel, A. R., DiTomasso, V., Rice, E. L., et al. 2019, AJ, 157, 247
- Roeser et al. (2010) Roeser, S., Demleitner, M., & Schilbach, E. 2010, AJ, 139, 2440
- Schneider et al. (2016) Schneider, A. C., Greco, J., Cushing, M. C., et al. 2016, ApJ, 817, 112
- Scholz (2014) Scholz, R. D. 2014, A&A, 561, A113
- Scholz & Bell (2018) Scholz, R.-D. & Bell, C. P. M. 2018, Research Notes of the American Astronomical Society, 2, 33
- Scholz et al. (2003) Scholz, R. D., McCaughrean, M. J., Lodieu, N., & Kuhlbrodt, B. 2003, A&A, 398, L29
- Scholz et al. (2005) Scholz, R. D., Meusinger, H., & Jahreiß, H. 2005, A&A, 442, 211
- Scholz et al. (2018) Scholz, R. D., Meusinger, H., & Jahreiß, H. 2018, A&A, 613, A26
- Skrutskie et al. (2006) Skrutskie, M. F., Cutri, R. M., Stiening, R., et al. 2006, AJ, 131, 1163
- Smart et al. (2017) Smart, R. L., Marocco, F., Caballero, J. A., et al. 2017, MNRAS, 469, 401
- Smart et al. (2019) Smart, R. L., Marocco, F., Sarro, L. M., et al. 2019, MNRAS, 485, 4423
- Smith et al. (2018) Smith, L. C., Lucas, P. W., Kurtev, R., et al. 2018, MNRAS, 474, 1826
- Teegarden et al. (2003) Teegarden, B. J., Pravdo, S. H., Hicks, M., et al. 2003, ApJ, 589, L51
- Tian et al. (2017) Tian, H.-J., Gupta, P., Sesar, B., et al. 2017, ApJS, 232, 4
- Toonen et al. (2017) Toonen, S., Hollands, M., Gänsicke, B. T., & Boekholt, T. 2017, A&A, 602, A16
- Torres et al. (2008) Torres, C. A. O., Quast, G. R., Melo, C. H. F., & Sterzik, M. F. 2008, Young Nearby Loose Associations, ed. B. Reipurth, Vol. 5, 757
- Torres et al. (2019) Torres, S., Cantero, C., Rebassa-Mansergas, A., et al. 2019, MNRAS, 485, 5573
- Ward-Duong et al. (2015) Ward-Duong, K., Patience, J., De Rosa, R. J., et al. 2015, MNRAS, 449, 2618
- Winters et al. (2019) Winters, J. G., Henry, T. J., Jao, W.-C., et al. 2019, AJ, 157, 216
- Winters et al. (2015) Winters, J. G., Henry, T. J., Lurie, J. C., et al. 2015, AJ, 149, 5
- Winters et al. (2017) Winters, J. G., Sevrinsky, R. A., Jao, W.-C., et al. 2017, AJ, 153, 14
- Wolf et al. (2018) Wolf, C., Onken, C. A., Luvaul, L. C., et al. 2018, PASA, 35, e010
- Wright et al. (2010) Wright, E. L., Eisenhardt, P. R. M., Mainzer, A. K., et al. 2010, AJ, 140, 1868
- Zacharias et al. (2017) Zacharias, N., Finch, C., & Frouard, J. 2017, AJ, 153, 166
- Zacharias et al. (2015) Zacharias, N., Finch, C., Subasavage, J., et al. 2015, AJ, 150, 101
- Zuckerman (2019) Zuckerman, B. 2019, ApJ, 870, 27
- Zuckerman et al. (2006) Zuckerman, B., Bessell, M. S., Song, I., & Kim, S. 2006, ApJ, 649, L115
- Zuckerman et al. (2004) Zuckerman, B., Song, I., & Bessell, M. S. 2004, ApJ, 613, L65