The physics of Galaxy Evolution with SPICA observations
Abstract
The evolution of galaxies at Cosmic Noon (1z3) passed through a dust-obscured phase, during which most stars formed and black holes in galactic nuclei started to shine, which cannot be seen in the optical and UV, but it needs rest frame mid-to-far IR spectroscopy to be unveiled. At these frequencies, dust extinction is minimal and a variety of atomic and molecular transitions, tracing most astrophysical domains, occur. The future IR space telescope mission, SPICA, currently under evaluation for the 5th Medium Size ESA Cosmic Vision Mission, fully redesigned with its 2.5-m mirror cooled down to will perform such observations. SPICA will provide for the first time a 3-dimensional spectroscopic view of the hidden side of star formation and black hole accretion in all environments, from voids to cluster cores over 90% of cosmic time. Here we outline what SPICA will do in galaxy evolution studies.
keywords:
telescopes, galaxies: evolution, galaxies: active, galaxies: starburst, quasars: emission lines, galaxies: ISM, galaxies: abundances, galaxies: high-redshift, infrared: galaxies1 Introduction
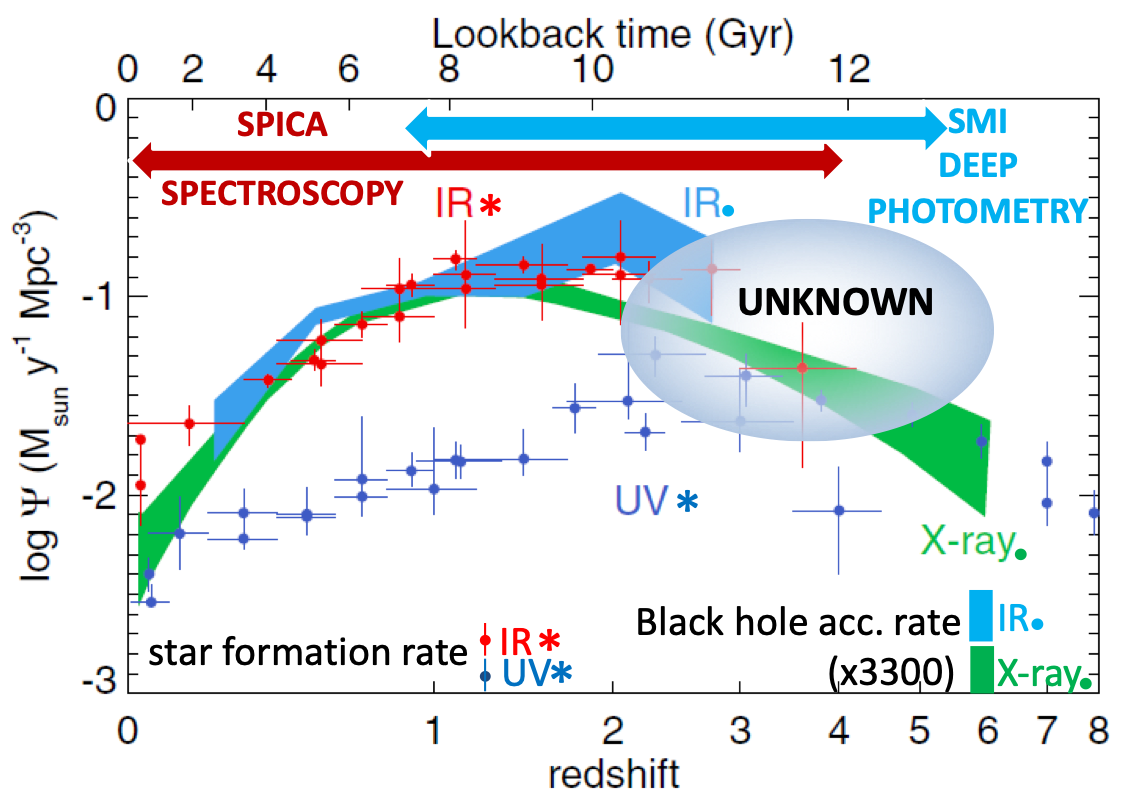
Most of the activity in galaxy evolution, the formation of stars and supermassive black holes at the center of galaxies, took place more than six billion years ago, with a sharp drop to the present epoch (e.g., Madau & Dickinson , 2014, Fig. 1). Since most of the energy emitted by stars and accreting SMBHs is absorbed and re-emitted by dust, understanding the physics of galaxy evolution requires infrared (IR) observations of large, unbiased galaxy samples spanning a range in luminosity, redshift, environment, and nuclear activity. From Spitzer and Herschel photometric surveys the global Star Formation Rate (SFR) and Black Hole Accretion Rate (BHAR) density functions have been estimated through measurements of the bolometric luminosities of galaxies (Le Floc’h et al., 2005; Gruppioni et al., 2013; Delvecchio et al., 2014). However, such integrated measurements could not separate the contribution due to star formation from that due to BH accretion (see, e.g., Mullaney et al., 2011). This crucial separation has been attempted so far through modelling of the spectral energy distributions and relied on model-dependent assumptions and local templates, with large uncertainty and degeneracy. On the other hand, determinations from UV (e.g. Bouwens et al., 2007) and optical spectroscopy (e.g., from the Sloan Digital Sky Survey, Eisenstein et al., 2011) track only marginally ( 10%) the total integrated light (Fig. 1). X-ray analyses of the BHAR, in turn, are based on large extrapolations and possibly miss a large fraction of obscured objects. Furthermore, the SFR density at 2-3 is very uncertain, since it is derived from UV surveys, highly affected by dust extinction. As opposite, through IR emission lines, the contributions from stars and BH accretion can be separated. SPICA spectroscopy will allow us to directly measure redshifts, SFRs, BHARs, metallicities and dynamical properties of gas and dust in galaxies at lookback times down to about 12 Gyrs. SPICA spectroscopic observations will allow us for the first time to redraw the SFR rate and BHAR functions (Fig. 1) in terms of measurements directly linked to the physical properties of the galaxies.
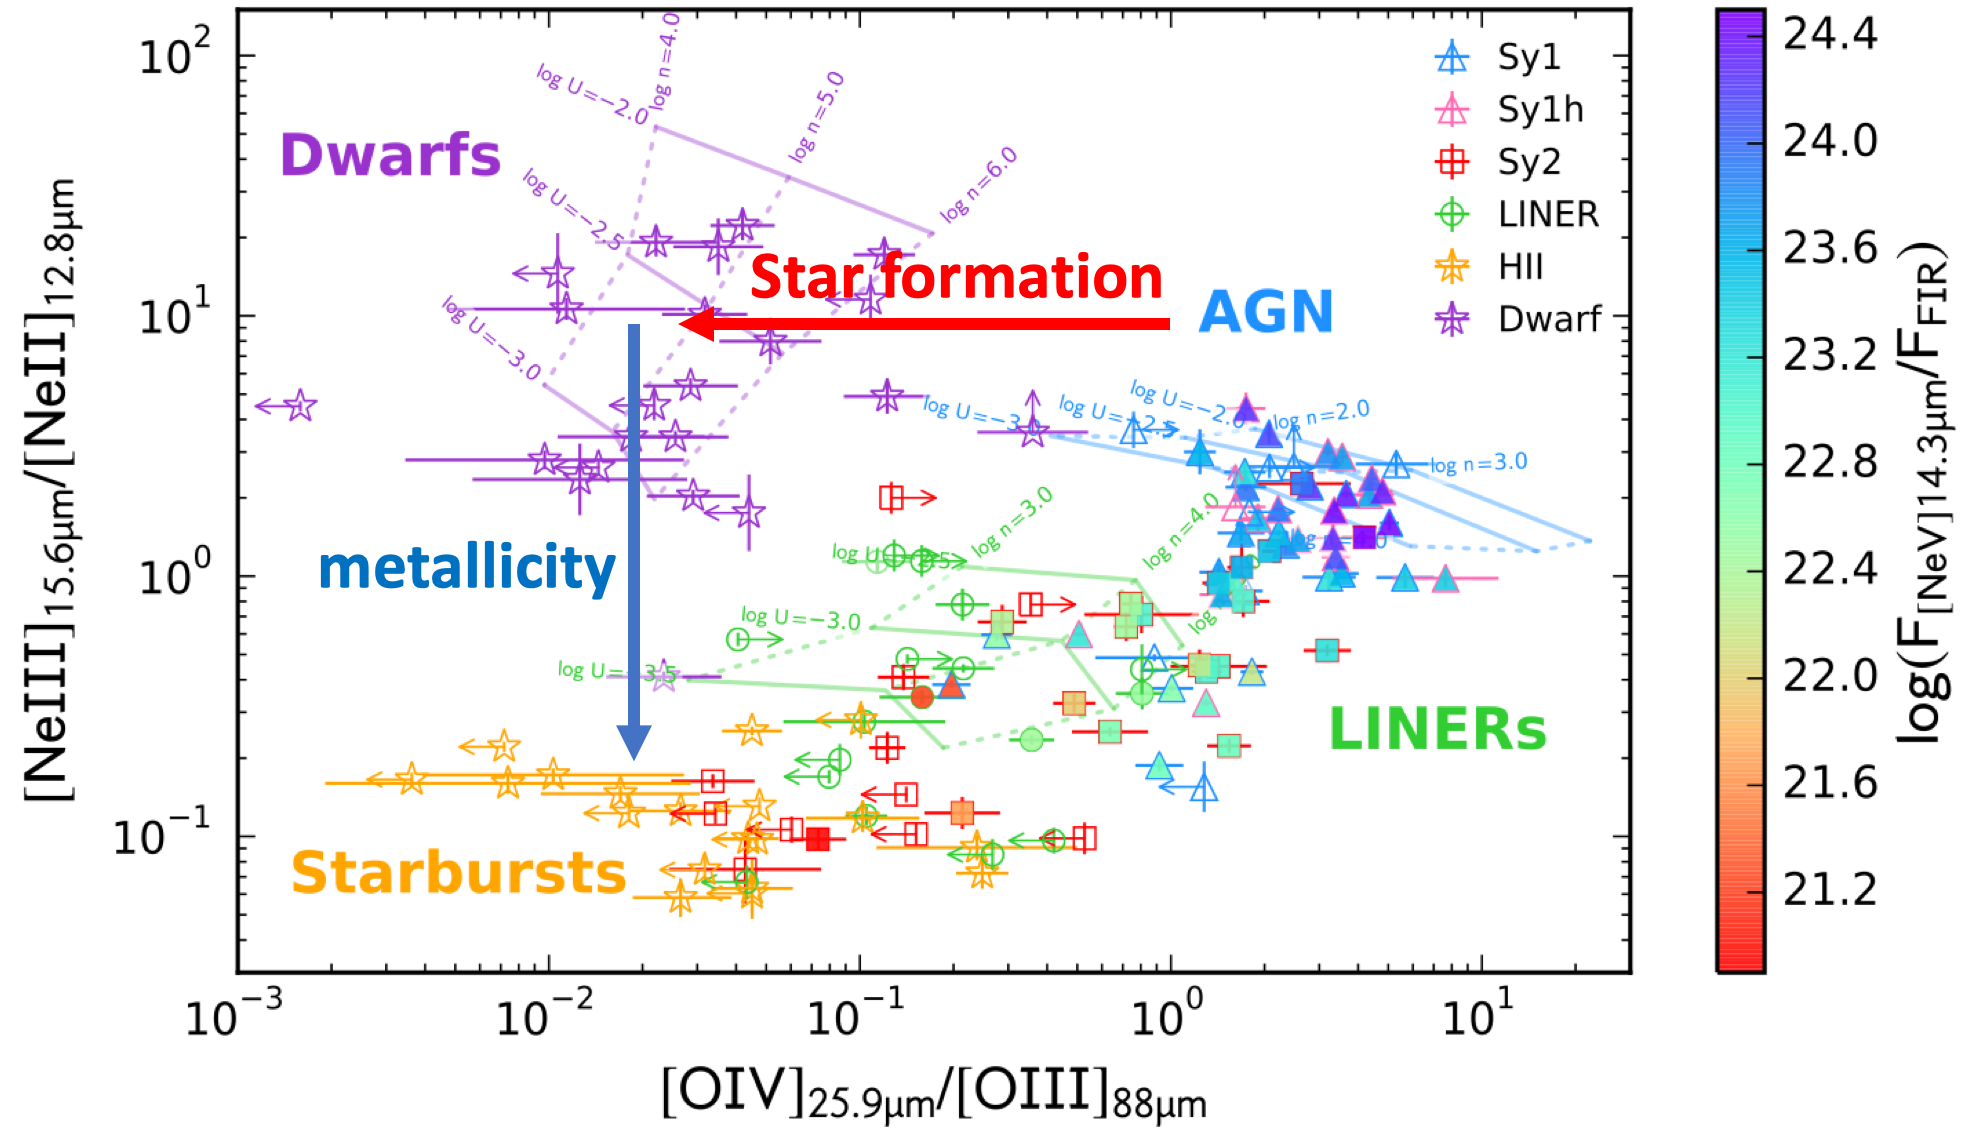
The mid- to far-IR spectral range hosts a suite of atomic and ionic transitions, covering a wide range of excitation, density and metallicity, directly tracing the physical conditions in galaxies. Ionic fine structure lines (e.g. [NeII], [SIII], [OIII]) probe HII regions around hot young stars, providing a measure of the SFR and the gas density. Lines from highly ionized species (e.g. [OIV], [NeV]) trace the presence of AGN and can measure the BHAR (Spinoglio & Malkan, 1992). Through line ratio diagrams, like the new IR BPT diagram (Fernández-Ontiveros et al., 2016, Fig. 2), IR spectroscopy can separate the galaxies in terms of both the source of ionization – either young stars or AGN excitation – and the gas metallicity, during the dust-obscured era of galaxy evolution ().
2 SPICA observations of galaxy evolution
For a complete description of the SPace Infrared telescope for Cosmology and Astrophysics (SPICA), we refer to Roelfsema et al. (2018). We concentrate here on the work that only an IR observatory such as SPICA will be able to do to unveil galaxy evolution.
-
1.
SPICA will provide for the first time a 3-dimensional spectroscopic view of the hidden side of star formation and black hole accretion in all environments, from voids to cluster cores over 90% of cosmic time. This will lead to a complete census – as a function of cosmic time – of:
the star formation in galaxies from low-mass dust-poor star-forming galaxies to high-mass heavily dust-obscured starbursts, setting a fundamental new benchmark for cosmological models, allowing unambiguous tests of the physics driving star, galaxy and large-scale structure formation.
the black hole accretion in the nuclei of galaxies, including also heavily obscured Compton thick nuclei.
From these observations, we will be able to derive both the average cosmic star-formation and accretion histories of the Universe as well as the physical conditions of each individual galaxy through their spectra in the large cosmic time interval since about 12 billion years (Spinoglio et al., 2017). SPICA will allow us to understand the physical origin of the dramatic change in the efficiency of star formation and accretion around cosmic noon, one of the major challenges for theoretical models in present-day cosmology.
-
2.
SPICA will measure if and how energetic (radiative and mechanical) feedback from starburst and AGN influences galaxy evolution. SPICA will determine the role of active galactic nuclei in quenching star formation in galaxies and address the origin of the low stellar to dark matter halo mass ratio in massive galaxies (González-Alfonso et al., 2017).
-
3.
SPICA will determine how galaxies build up their metals and dust during the last ten Gyrs of cosmic time and how are these metals recycled in the ISM and injected into the CGM (Fernández-Ontiveros et al., 2017). IR line based tracers will allow SPICA to peer through the heavily opaque medium of main-sequence galaxies at the cosmic noon and probe their true chemical ages. Galaxies at z 2-3 show extremely low metallicities in optically-based traces, down to 0.8 dex below solar (Onodera et al., 2016), which is in conflict with the large amounts of dust inferred from IR photometry (Fig. 1), suggesting much higher metallicities. SPICA will also probe the first production of dust and metals, assess the presence of hot dust in the most distant galaxies (z6) and determine the physical properties of infrared bright galaxies and quasar hosts at the epoch of re-ionization.
2.1 SPICA observational strategy to unveil galaxy evolution
We briefly show here some of the results of the scientific work that has been done in preparation of the galaxy evolution studies that will performed with the SPICA mission.
In the context of the development of a coherent observing strategy, we have considered a step by step observational sequence, aimed at optimising the measure of basic astrophysical quantities in galaxies through their evolution in the last 12 Gyrs. This sequence can be summarised as follows:
(i) Deep spectrophotometric and photometric surveys in the mid-IR, using the SPICA Mid-IR Instrument (SMI) of large enough fields (of order 1-10 deg2) down to very faint flux limits (i.e. 3-12Jy in the continuum at 34m and 2-510-20 W/m2 in the spectral lines). These observations will be complemented with the B-BOP camera at 70m (at a 30Jy depth). This survey will provide a 3-dimensional view of galaxy evolution.
(ii) Identification of a sample of galaxies based on the outcome of the above surveys, in terms of redshift, mid-IR luminosity, classification (i.e. Starburst-dominated or AGN-dominated), characterisation of the Stellar Masses, Dust Masses and (where possible) Bolometric Luminosities using available multifrequency data.
(iii) Deep follow-up observations with the grating spectrometers (both SAFARI and SMI at spectral medium resolution) of above defined sample. This will provide a complete spectral atlas of galaxies as a function of redshift, luminosity and stellar mass.
From the spectral atlas of galaxies we will determine their physical properties as a function of cosmic time: the Star Formation Rate (SFR), the Black Hole Accretion Rate (BHAR), the metal abundances, the outflow/infall occurrence, etc.
2.2 Predictions of the SMI ultra-deep survey
Following the work already presented in Kaneda et al. (2017) and Gruppioni et al. (2017), we are planning to perform an ultra-deep survey of 1 deg2 with the SMI imaging low-resolution spectrometer (Kaneda et al., 2018) down to the photometric limit of 3Jy in the continuum at 34m in a typical observing time of about 600 hours.
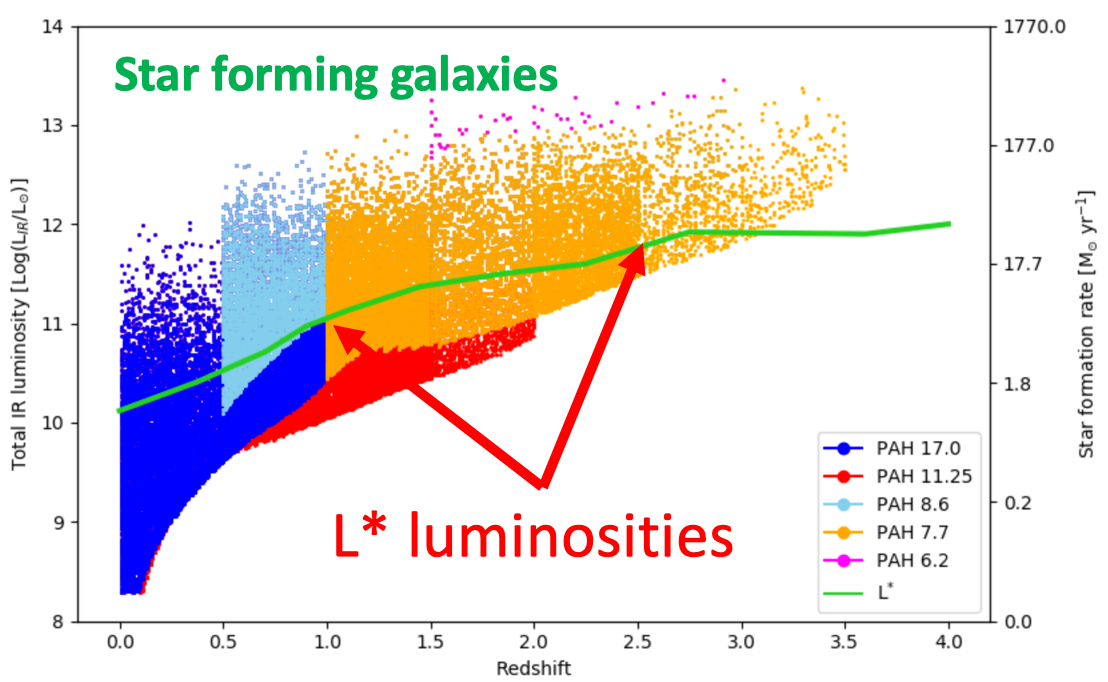
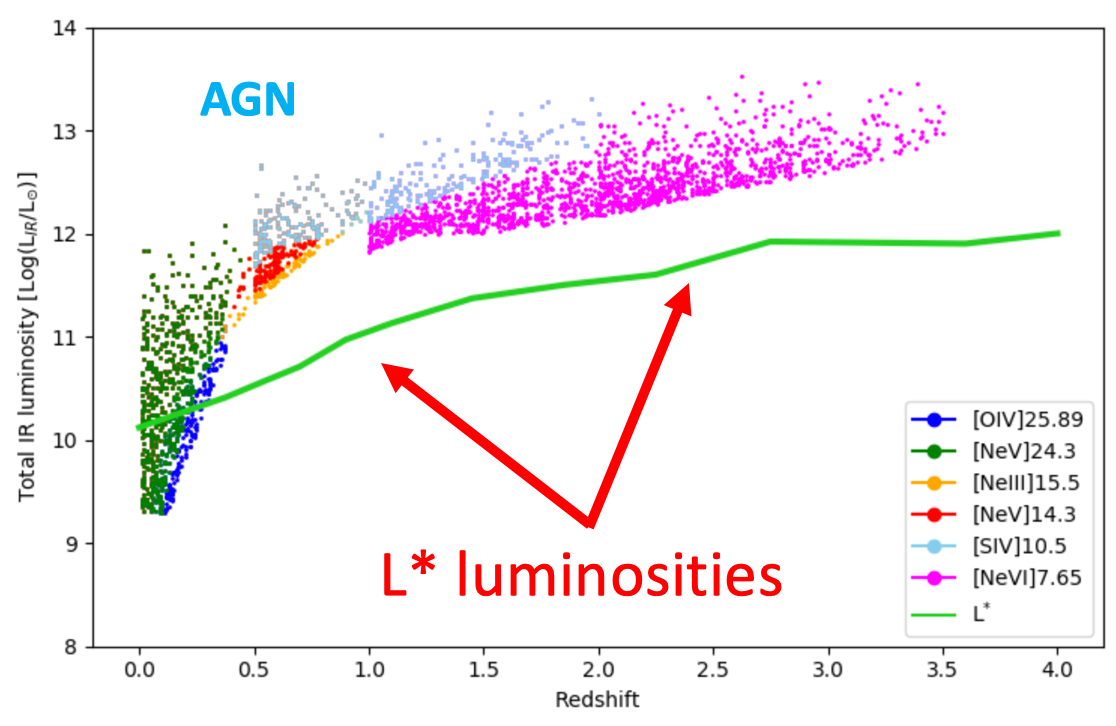
We show in Fig. 3 the predictions of how the SPICA SMI ultra-deep survey of 1 deg2 will fill the luminosity-redshift plane for Star Forming Galaxies (left diagram) and for AGN (right diagram). The Star Forming galaxies are detected through the Polycyclic Aromatic Hydrocarbon (PAH) features at 6.2, 7.7, 8.6, 11.25 amd 17.0 m, while the AGN can be detected through a set of high-ionization fine-structure lines, [NeVI]7.65m, [SIV]10.5m, [NeV]14.3 and 24.3m, [NeIII]15.5m, and [OIV]15.9m.
We have used the far-IR luminosity functions as derived from Herschel photometric observations (Gruppioni et al., 2013) and the IR linea and PAH features calibrations to the total IR luminosities from observations in the local Universe. The details of these simulation can be found in Mordini et al (2020, in preparation).
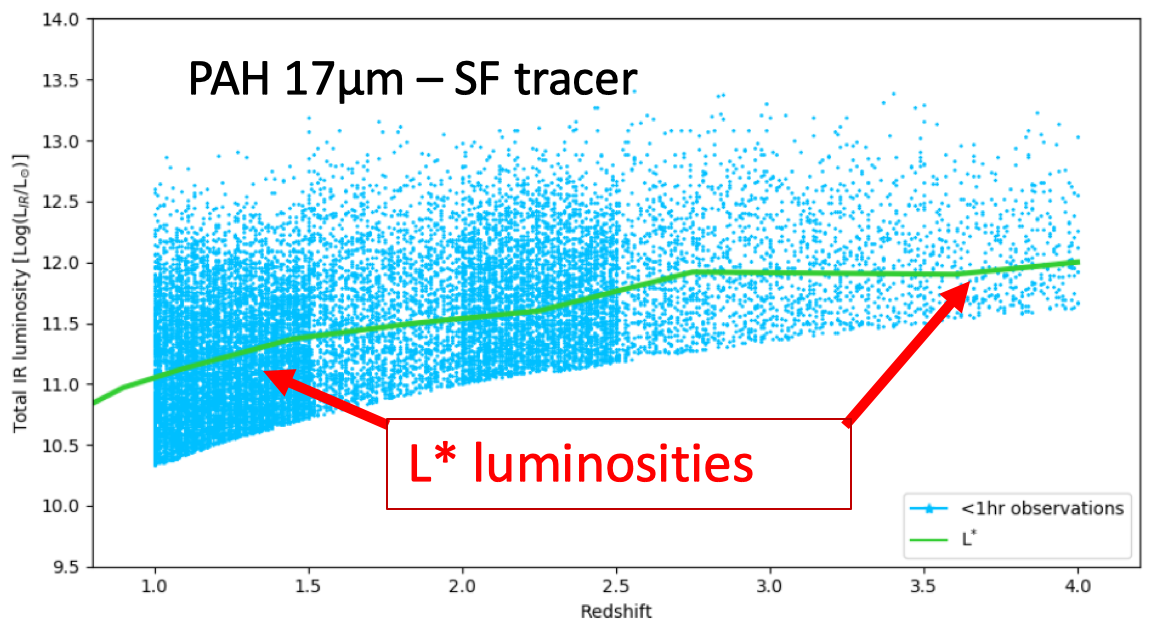
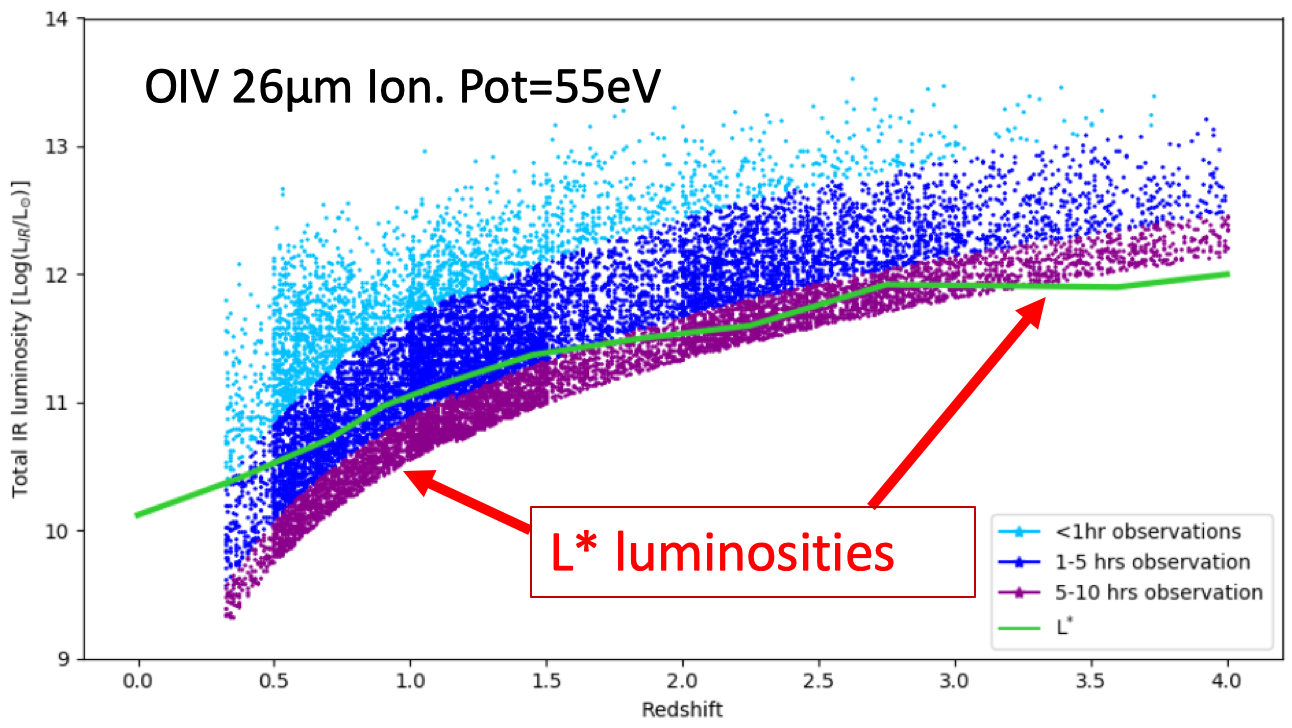
2.3 Predictions of SAFARI follow-up pointed spectroscopic observations
Following step ii) outlined in Section 2.1, i.e. the definition of a suitable sample of galaxies, of order 1,000 objects, we have made predictions of the observability of such sample with the SAFARI spectrometer (Roelfsema et al., 2018). We show these predictions in Fig. 4, where, on the left, the luminosity-redshift plane for Star Forming Galaxies through the detection of the Polycyclic Aromatic Hydrocarbon (PAH) feature at 17m is shown. Analogously, on the left diagram of Fig. 4, the luminosity-redshift plane for AGN is shown, where the detections by SPICA-SAFARI are made in the [OIV]25.9m line. We can see from these predictions that SPICA will be able to measure the SFR and the BHAR of galaxies far below the knee of the luminosity functions at each redshift, in particular beyond z4 for Star Forming galaxies and up to z3.5 for AGN.
Acknowledgements
This paper is dedicated to the memory of Bruce Swinyard, who initiated the SPICA project in Europe, but unfortunately died on 22 May 2015 at the age of 52. He was ISO-LWS calibration scientist, Herschel-SPIRE instrument scientist, first European PI of SPICA and first design lead of SAFARI. We acknowledge the whole SPICA Collaboration Team, as without its multi-year efforts and work this paper could not have been possible. We also thank the SPICA Science Study Team appointed by ESA and the SPICA Galaxy Evolution Working Group. LS and JAFO acknowledge financial support by the Agenzia Spaziale Italiana (ASI) under the research contract 2018-31-HH.0.
References
- André et al. (2019) André, Ph. et al. 2019, PASA, 36, e029
- Bouwens et al. (2007) Bouwens, R. R. et al. 2007, ApJ, 670, 928
- Delvecchio et al. (2014) Delvecchio, I. et al. 2014, MNRAS, 439, 2736
- Eisenstein et al. (2011) Eisenstein, D.J. et al. 2011, AJ, 142, 72
- Fernández-Ontiveros et al. (2016) Fernández-Ontiveros, J.A. et al. 2016, ApJS, 226, 19
- Fernández-Ontiveros et al. (2017) Fernández-Ontiveros, J.A. et al. 2017, PASA, 34, e053
- González-Alfonso et al. (2017) González-Alfonso, E. et al.2017, PASA, 34, e054
- Gruppioni et al. (2013) Gruppioni, C. et al. 2013, MNRAS, 432, 23
- Gruppioni et al. (2017) Gruppioni, C. et al. 2017, PASA, 34, e055
- Kaneda et al. (2017) Kaneda, H. et al. 2017, PASA, 34, e059
- Kaneda et al. (2018) Kaneda, H. et al. 2018, Proceedings of the SPIE, Volume 10698, id. 106980C
- Le Floc’h et al. (2005) Le Floc’h, E. et al. 2005, ApJ, 632, 169
- Madau & Dickinson (2014) Madau, P. & Dickinson, M. 2014, ARA&A, 52, 415
- Mullaney et al. (2011) Mullaney, J. R. et al. 2011, MNRAS, 414, 1082
- Onodera et al. (2016) Onodera, M. et al. 2016, ApJ, 822, 42
- Roelfsema et al. (2018) Roelfsema, P. R. et al. 2018, PASA, 35, e030
- Spinoglio & Malkan (1992) Spinoglio, L. & Malkan, M.A. 1992, ApJ, 399, 504
- Spinoglio et al. (2017) Spinoglio, L. et al. 2017, PASA, 34, e057