Neutron-neutron quasifree scattering in neutron-deuteron breakup at 10 MeV
Abstract
New measurements of the neutron-neutron quasifree scattering cross section in neutron-deuteron breakup at an incident neutron energy of 10.0 MeV are reported. The experiment setup was optimized to evaluate the technique for determining the integrated beam-target luminosity in neutron-neutron coincidence cross-section measurements in neutron-deuteron breakup. The measurements were carried out with a systematic uncertainty of . Our data are in agreement with theoretical calculations performed using the CD-Bonn nucleon-nucleon potential in the Faddeev formalism. The measured integrated cross section over the quasifree peak is in comparison with the theory prediction of 20.1 mb/sr2. These results validate our technique for determining the beam-target luminosity in neutron-deuteron breakup measurements.
I Introduction
The neutron-deuteron (nd) system is a robust platform for testing models of nucleon interactions. Current calculations using ab-initio methods with state-of-the-art nucleon-nucleon (NN) potentials accurately predict most three-nucleon () scattering observables Glöckle et al. (1996). However, some discrepancies between theory and data remain, such as for the neutron-neutron quasifree scattering (nn QFS) cross section in nd breakup Siepe et al. (2002); Ruan et al. (2007); Lübcke (1992); Witała and Glöckle (2011).
Neutron-neutron QFS in nd breakup is the kinematic configuration in which the proton remains at rest in the laboratory frame during the scattering process. That is, the proton may be considered as a spectator to the interaction between the two neutrons. Ab-initio calculations illustrate that the nn QFS cross section is sensitive to the details of the nn interaction, even at low energies where the de Broglie wavelength of the incident neutron is comparable in size to the deuteron. This cross section depends on the nn effective range parameter () in the low-momentum expansion of the -wave scattering amplitude Witała and Glöckle (2011). However, early measurements did not determine with high enough precision to examine the validity of charge symmetry in the NN interaction Slaus et al. (1971); Bovet et al. (1978); Soukup et al. (1979); Guratzsch et al. (1980); von Witsch et al. (1980).
The situation is significantly changed by recent cross-section measurements of nn QFS in nd breakup at incident neutron energies of 26 and 25 MeV. Rigorous nd breakup calculations underpredict these data by 18% and 16%, respectively Siepe et al. (2002); Ruan et al. (2007). A third and earlier experiment measured a similar discrepancy of 12% at 10.3 MeV Lübcke (1992). A detailed analysis of the 26-MeV nn QFS data Siepe et al. (2002) using rigorous nd breakup calculations demonstrated that forces cannot account for the discrepancy between data and theory Witała and Glöckle (2011). Also, the analysis showed that theory can be brought into agreement with data by scaling the magnitude of the nn interaction by a factor of 1.08. However, this remedy suggests substantial charge symmetry breaking in the NN interaction manifested as either: changes to the nn scattering length () to the extent of nearly creating a bound dineutron state, a significant deviation of from the accepted value of the NN effective range parameter, or a combination of changes to the nominal values of and Witała and Glöckle (2011). Possible explanations for the nn QFS discrepancy include: (1) the NN system violates charge symmetry at a level larger than generally accepted, (2) current force models do not properly account for all force components that contribute to the reaction dynamics, and/or (3) the systematic uncertainties were underestimated in the reported measurements.
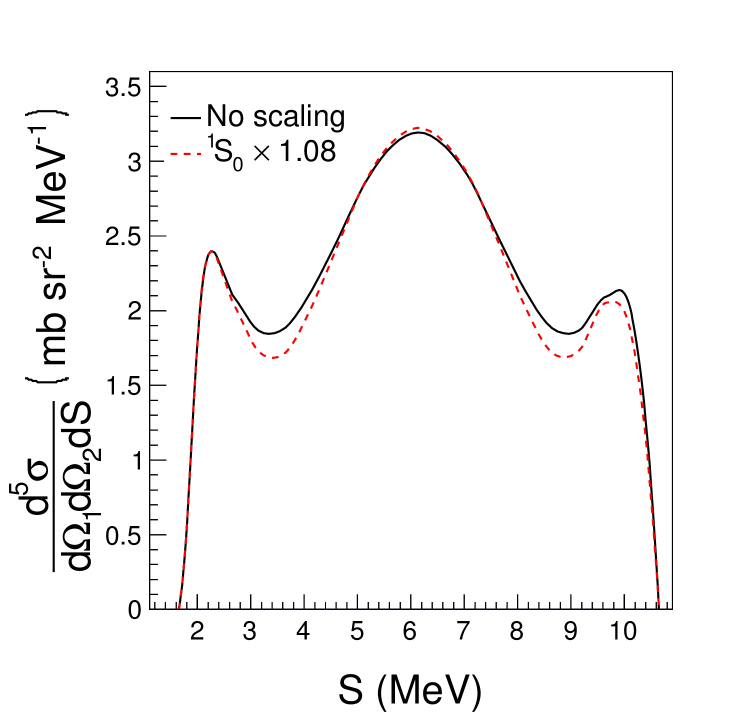
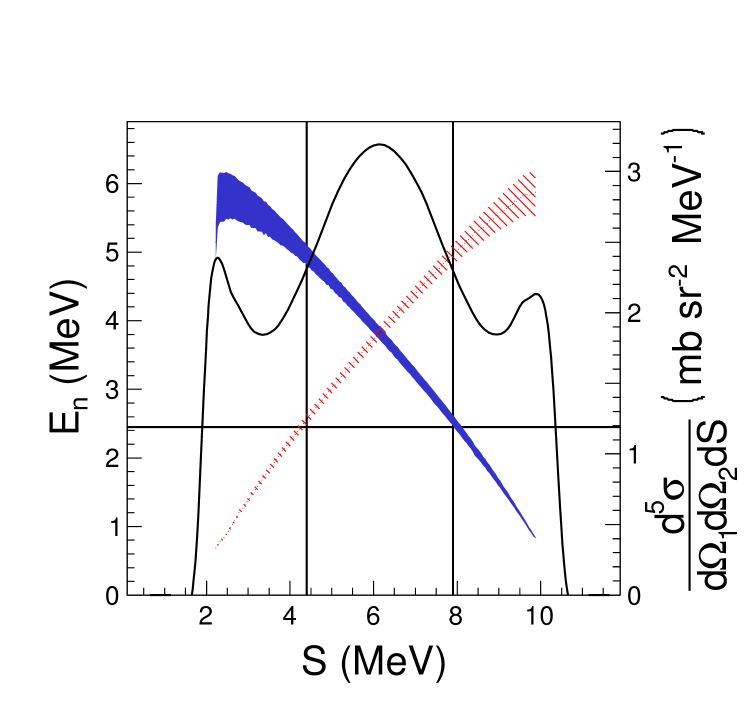
A common feature of the comparisons of theory to data is that calculations describe the shape of the cross-section distribution along the kinematic locus well but fail to predict the absolute magnitude of the data. This type of discrepancy is suggestive that the systematic uncertainty in the factors used to normalize the cross-section measurements might be underestimated. That is, an uncertainty of in the beam-target luminosity would bring measurements and theory into agreement within one standard deviation. In this paper, we report new nn QFS cross-section measurements in nd breakup. Our experiment method differs from previous measurements Siepe et al. (2002); Ruan et al. (2007); Lübcke (1992) in that the setup was optimized to evaluate the technique for measuring the absolute nn QFS cross section in nd breakup rather than for sensitivity studies of the strength of the nn interaction. Another important difference is the method used to determine the integrated beam-target luminosity. In our experiment, the beam-target luminosity is determined from in-situ measurements of the yields for nd elastic scattering rather than from neutron-proton (np) scattering. This technique significantly reduces systematic error in the breakup cross section in comparison to previous nn QFS measurements. Our measurement was conducted at a neutron beam energy of 10.0 MeV, where theory predicts that the nn QFS cross section measured in the geometry of our experiment has only modest sensitivity to the nn interaction. That sensitivity is shown in Fig. 1 where the theoretical cross section averaged over the finite geometry of our experiment is shown for calculations with and without scaling the nn interaction by 1.08. The difference in the predicted cross section at the location of the QFS peak (S = 6 MeV) is only 1%. Additionally, a concurrent measurement of the integrated neutron beam flux was made using np scattering to assess the systematic error in determining the luminosity via nd elastic scattering.
II Details of the Experiment
The measurements were conducted at the tandem accelerator facility of the Triangle Universities Nuclear Laboratory (TUNL) using standard neutron time-of-flight (TOF) techniques. The neutron beam was produced via the reaction with a pulsed deuteron beam (period ns, FWHM ns) incident on a 3.16-cm-long gas cell filled with deuterium to a pressure of 5 atm. The resulting neutron beam had a central energy of 10.0 MeV with a spread of 330 keV (full width) due to energy loss by the deuterons in the deuterium gas. The deuteron beam current on target was adjusted to optimize the ratio of the true nn coincidence rate to the accidental coincidence background rate.
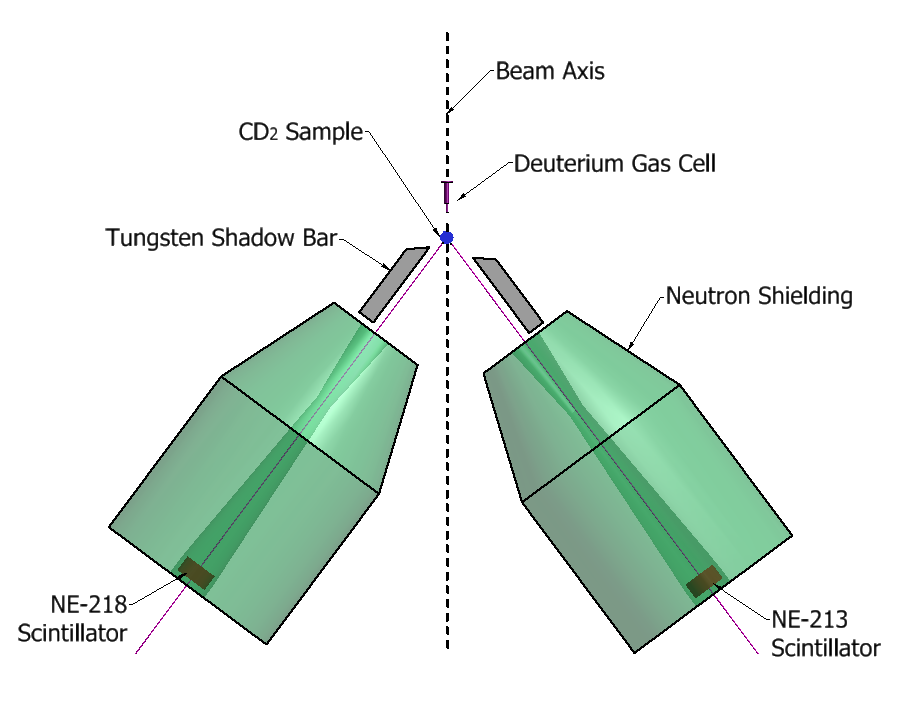
The experiment setup is shown in Fig. 2. A cylindrical scattering sample was mounted 12.1 cm from the center of the gas cell with its axis vertical and centered in the beam at the location of the pivot point about which the detectors rotate. Scattered neutrons were detected by two heavily shielded liquid scintillators positioned on opposite sides of the beam axis at equal angles of 36.7°. The left and right detectors are 5.08 cm long cylinders with diameters of 12.7 cm and 8.89 cm filled with NE-213 and NE-218 liquid scintillator fluid, respectively. Each detector was housed inside a cylindrical shielding enclosure of lithium-doped paraffin with a double-truncated conical copper collimator Glasgow et al. (1974). Tungsten shadow bars were positioned to shield the detectors from directly viewing the neutron production cell. The distance from the center of the sample to the center of each detector was 264.9 cm for the left detector and 264.3 cm for the right detector. The neutron beam flux was monitored using two liquid scintillators not shown in Fig. 2. One monitor detector (5.08 cm diameter 5.08 cm long) was suspended from the ceiling in a copper shield and collimator and viewed the neutron production cell at an angle of approximately 60° with respect to the beam axis. The other detector (3.81 cm diameter 3.81 cm long) was unshielded and positioned approximately three meters downstream from the neutron production gas cell at an angle of about 3° relative to the beam axis.
Data were collected over the course of three runs for a total of 577 hours of beam on target. The integrated beam-target luminosity was determined from the nd elastic scattering yields, which were measured simultaneously with the data for the breakup reaction. The integrated incident beam flux was also measured using np scattering to check the systematic uncertainty in our determination of the beam-target luminosity.
All scattering samples used in these measurements were right cylinders. The mass and dimensions of each sample are given in Table 1. The deuterium sample was composed of 98.4% isotopically enriched deuterated polyethylene, CD2, where “D” denotes “2H” (Cambridge Isotope Laboratories, Inc., DLM-220-0). The np scattering measurements were performed using the polyethylene (CH2) sample listed in Table 1. The large and small graphite samples were used to measure the background from neutron scattering on carbon in the CD2 and CH2 samples, respectively. In addition to the samples listed in Table 1, empty target holders were used to measure backgrounds from air scattering.
| Sample | Mass (g) | Diameter (mm) | Height (mm) |
|---|---|---|---|
| CD2 | 25.172 | 28.3 | 36.4 |
| Large graphite | 42.055 | 28.6 | 38.0 |
| CH2 | 3.389 | 14.2 | 22.7 |
| Small graphite | 2.924 | 9.4 | 23.6 |
The energies of the detected neutrons were determined from TOF measurements. The incident neutron beam was pulsed at a repetition rate of 2.5 MHz, and the width of each neutron bunch incident on the scatterer was about 2 ns FWHM. The arrival of the deuteron beam pulse on the neutron production gas cell was sensed with a capacitive beam pickoff unit. A delayed signal derived from the beam pickoff unit was used as the time reference for measuring the TOF of each detected neutron. Pulse-shape discrimination techniques were used to reduce backgrounds from gamma rays. A detector pulse-height threshold of 238.5 keVee (Cs Compton edge) was applied, where “keVee” denotes “keV electron equivalent”.
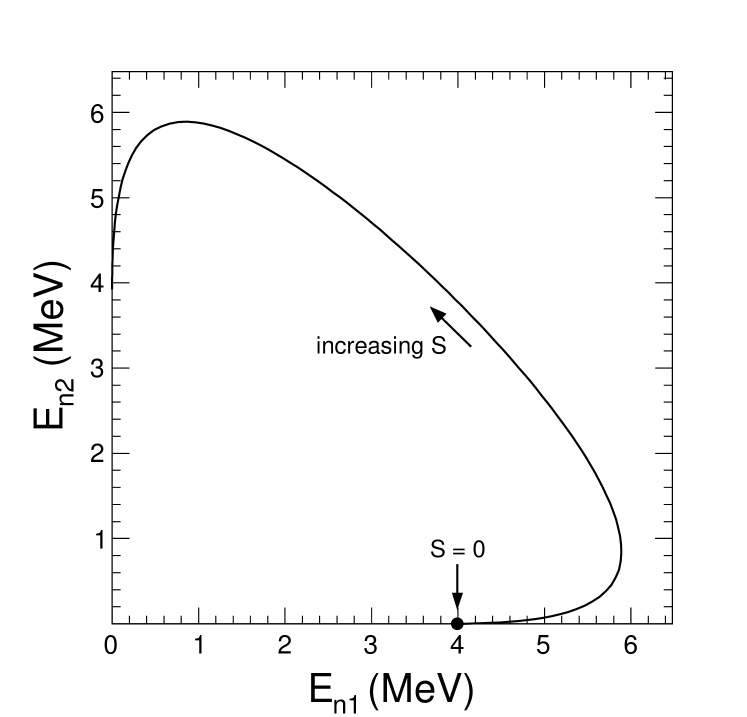
For the neutron elastic scattering measurements, a TOF histogram was accumulated for the neutrons that were independently detected in each of the two shielded detectors. Events from the nd breakup reaction were identified by the coincidence detection of neutrons in the two shielded detectors. The nd breakup events were accumulated in a two-dimensional histogram of the TOF of the neutrons detected in the left detector (D1) versus the TOF of those detected in the right detector (D2). The events corresponding to the nd breakup reaction lie along a contour defined by the reaction kinematics, i.e., the kinematic locus of the reaction or the S curve, as shown in Fig. 3. Arc length along the kinematic locus is denoted by the variable S and measured in the counterclockwise direction starting at the point where the energy of the second neutron is a minimum Glöckle et al. (1996).
A 100 ns wide time window was used to form the coincidences between the signals from the two neutron detectors. The accidental coincidence background was measured by forming coincidences between detector signals caused by neutrons in two consecutive beam pulses. This was achieved by delaying the signal from one detector by 400 ns, which is one beam pulse period. With this technique, we detected and accumulated TOF spectra for two categories of events: (1) an admixture of nd-breakup events and accidental-coincidence events, and (2) purely accidental-coincidence events.
III Data Analysis
The differential cross section along the S curve for the nd breakup reaction averaged over the kinematic acceptance of our experiment setup was determined from the measured nn coincidence yields by Eq. 1:
| (1) |
The parameters in Eq. 1 are: the net number of detected nn coincidence events (); the efficiencies of the neutron detectors (, ); the transmission of the incident neutrons to the center of the CD2 sample (); the transmission of the emitted neutrons through the CD2 sample and air to the face of each neutron detector (, ); the number of neutrons incident on the CD2 sample (); the nuclear areal density of the deuterium sample ( in nuclei/cm2); the solid angles of the neutron detectors (, ); and the bin width along the S curve (). The scattering angles and are defined by the line that connects the center of the CD2 scatterer to the center of each neutron detector, D1 and D2, respectively, shown in Fig. 2. The azimuthal opening angle is defined by the planes containing the centers of D1 and D2 and the incident neutron beam axis. Detector solid angles were calculated from the detector radii and distances from the sample to the detectors, assuming a point geometry. The Monte-Carlo simulation confirmed this assumption is accurate to within 0.2%.
III.1 Determination of Breakup Yields
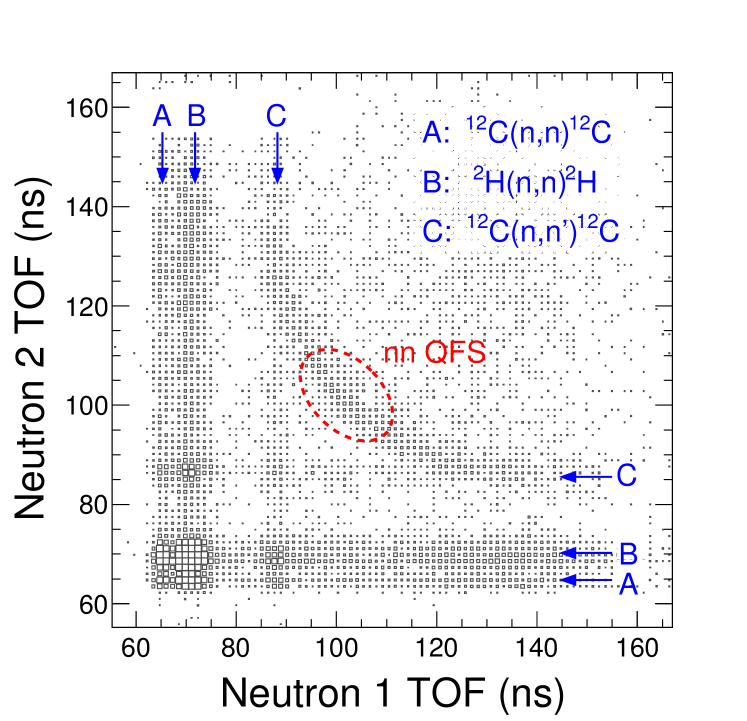
A raw two-dimensional coincidence neutron TOF spectrum is shown in Fig. 4. The kinematic locus is clearly visible, and the nn QFS region at the center of the locus (enclosed by the red dashed ellipse) is well separated from backgrounds. Accidental coincidences due to elastic scattering from deuterium and carbon and inelastic scattering from the first excited state in carbon form bands parallel to the TOF axes; these are identified by the labels A, B and C in Fig. 4. The accidental coincidences above and to the right of the kinematic locus are due to coincidences between neutrons from nd breakup events in which only one neutron is detected and the elastic scattering of the continuum of neutrons produced via deuteron breakup reactions in the neutron production cell.
Events in a band around the ideal point-geometry kinematic locus (S curve) defined by the central scattering angles of the experiment and were projected into bins along the locus. The width of the band was determined by the energy spread and angular acceptance of the experiment. Events were projected using the method of Finckh et al. Finckh et al. (1987). The S curve was discretized in steps of 50 keV and each event was projected to the closest point on the locus. Every event can be represented by a point () in the momentum plane, where is the momentum of a neutron in the laboratory frame. Also, any point along the S curve can be represented in momentum space as (). For each event, the squared distance in momentum space between the event and every point on the S curve was calculated:
| (2) |
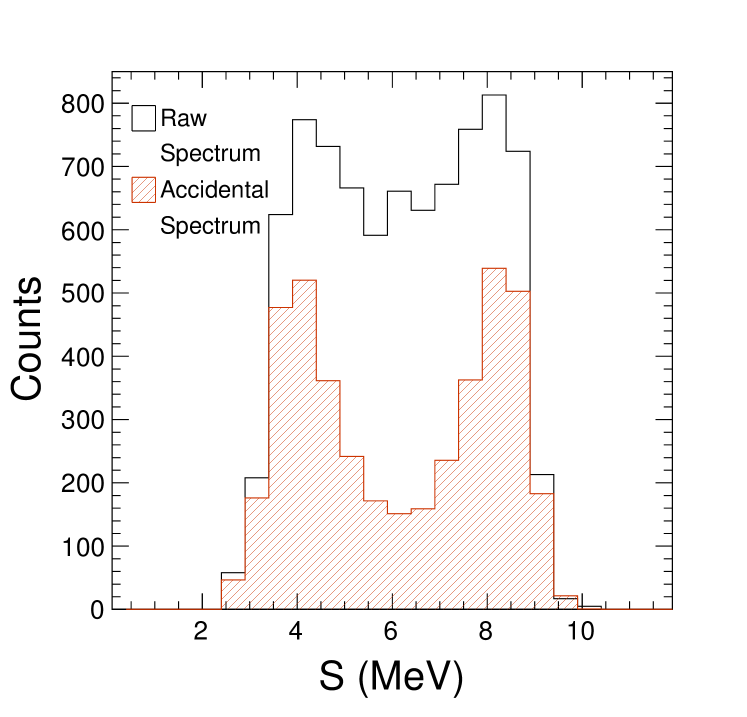
For each event, the bin on the S curve corresponding to the minimum value of was incremented by one count. After projecting onto the S curve the yields were rebinned in 0.5-MeV-wide bins. The accidental coincidence data were analyzed in the same way as the data that included the true detector coincidences due to nd breakup. The net nd breakup yields were computed bin-by-bin along the S curve by subtracting the accidental coincidence counts from the raw spectrum in each bin, see Fig. 5. The cross section was determined from the net coincidence yields in each bin along the S curve.
III.2 Detector Efficiency Measurements
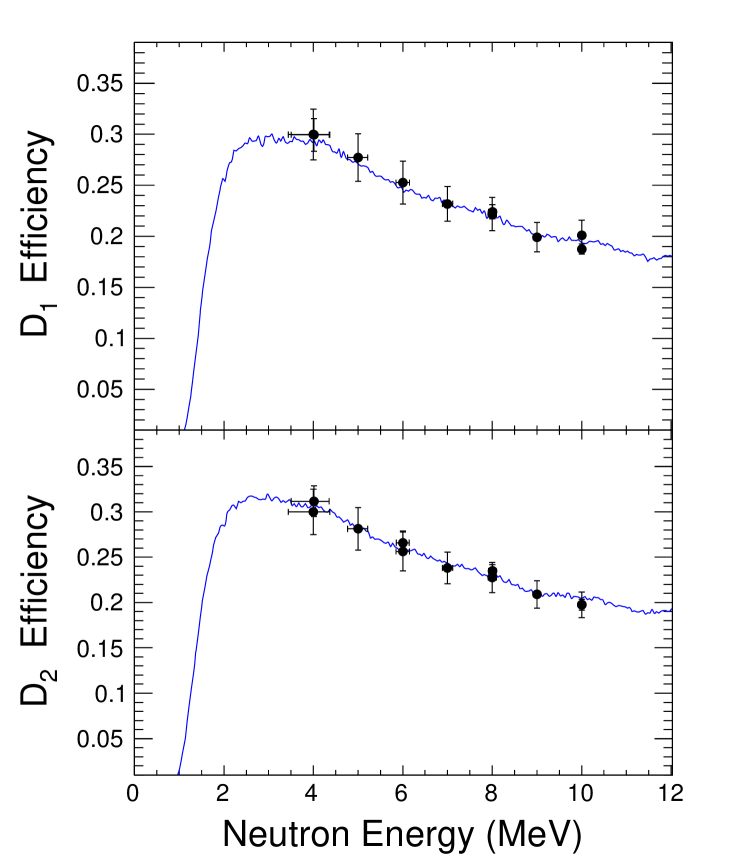
Detector efficiencies were determined in a separate experiment by measuring the neutron yield from the reaction at zero degrees Drosg and Otuka (2015). Measurements were taken for neutron energies between 4 and 10 MeV in 1 MeV steps. The detector efficiency curves were simulated using the code neff7 Dietze and Klein (1982) between neutron energies of 0 and 20 MeV in 50 keV steps. The results of the neff7 simulation were scaled to fit the measured efficiencies, as shown in Fig. 6. The simulated efficiencies agreed well with the data; the efficiency curves for and were scaled up by 0.9% and 0.5%, respectively, to fit the measured efficiencies. The scaled efficiency curves were used in the Monte-Carlo simulation (see Sec. III.3).
At each end of the S curve in the nn QFS configuration, one of the breakup neutrons has a very low energy. The simulated energy of each neutron as a function of S is plotted in Fig. 7 for our experiment setup. The bands represent the energy spread of neutrons projected into each bin along the S curve (one standard deviation). As shown in Fig. 6, the efficiency curves of the neutron detectors rise sharply from the threshold energy of about 1 MeV up to about 2.3 MeV where the slope of the efficiency curve starts to flatten as a function of neutron energy. Because the uncertainty in the detector efficiency is greater than near the threshold energy, events that have a neutron with an energy of less than 2.45 MeV were rejected. The energy threshold cut is indicated by the horizontal line in Fig. 7. This cut selects the S-curve region from 4.4 to 7.9 MeV for reporting cross-section data, as indicated by the vertical lines in Fig. 7.
III.3 Monte-Carlo Simulation
A Monte-Carlo (MC) simulation of the experiment was developed for four purposes: (1) to allow for direct comparisons between the experiment and theory by averaging the theoretical point-geometry cross sections over the finite geometry and energy resolution of the experiment; (2) to determine the average neutron transmission factors and detector efficiencies used to convert the measured coincidence yields into a cross section (see Eq. 1); (3) to determine quantitatively the effects of multiple scattering of neutrons in the target; and (4) to quantify sources of background relevant to extracting the nd elastic yields.
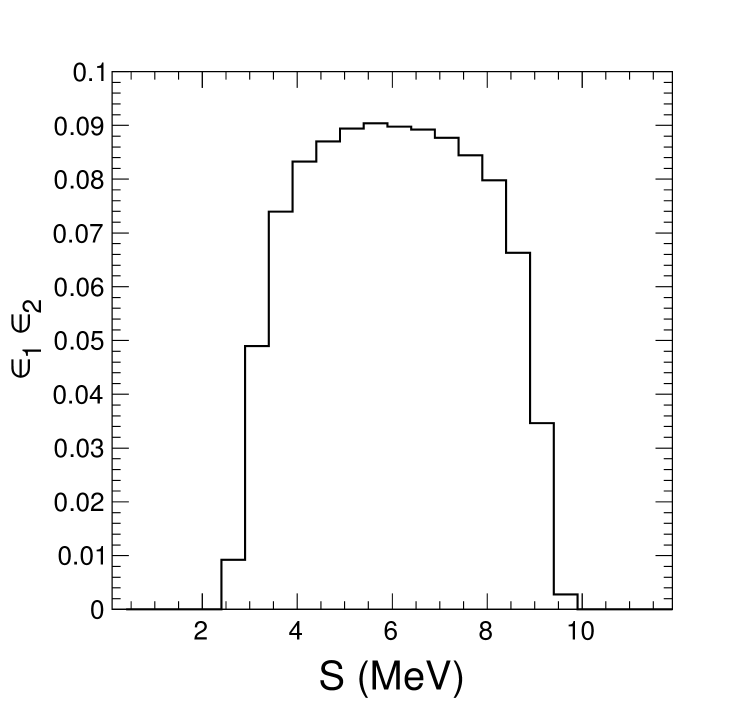
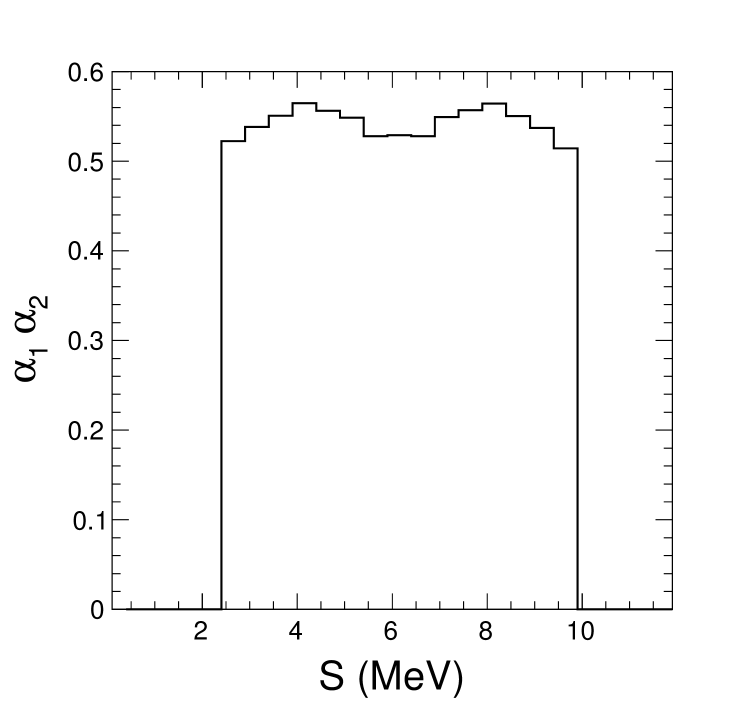
The MC simulation was used to average the breakup cross section over the finite geometry of the experiment and to determine the average detector efficiencies and transmission factors in Eq. 1. Scattering events were simulated by tracing individual neutrons from their origin in the gas cell to the detection of one or two neutrons in the liquid scintillators. A forced scattering routine was used for computational efficiency. Details of the MC simulation are described in the Appendix. Theoretical point-geometry nd breakup cross sections used in the simulation were calculated by solving the three-body Faddeev equations Faddeev (1961) with the CD-Bonn NN potential Machleidt et al. (1996) using the technique described by Glöckle et al. Glöckle et al. (1996). Neutron detector efficiencies were determined using the efficiency curves calculated with the code neff7 as discussed in Sec. III.2. Finite-geometry averaged values for the product of detector efficiencies as a function of S are shown in Fig. 8. Neutron transmission factors were calculated using total neutron scattering cross sections from the ENDF/B-VII.1 database Chadwick et al. (2011). Finite-geometry averaged values for the product of neutron transmission factors as a function of S are shown in Fig. 9.
Elastic scattering processes were also simulated for all four scattering samples (see Table 1). The elastic scattering simulation used the same input data as the nd breakup simulation for detector efficiencies and neutron transmission calculations. Cross sections for nd elastic scattering were calculated using the CD-Bonn NN potential. Cross sections for np scattering were obtained from the program said using the Bonn potential SAID Database . Cross sections for elastic and inelastic neutron scattering from carbon were taken from Refs. Glasgow et al. (1976); Chadwick et al. (2011).
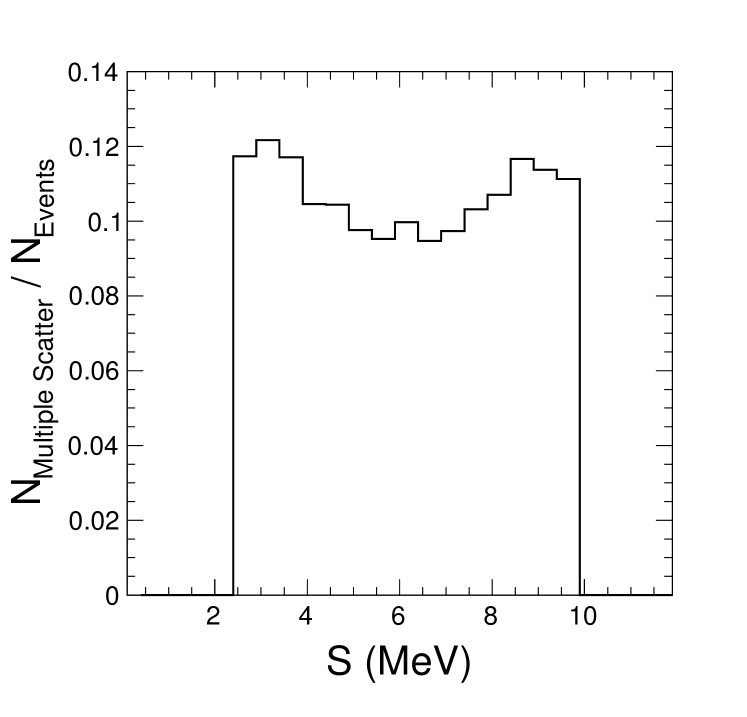
The simulation was also used to study the effect of multiple scattering of neutrons in the target on the extraction of nd breakup and elastic scattering yields from the measured neutron TOF spectra. It was found that multiple scattering accounts for about 9.9% of the breakup yields near the QFS peak (see Fig. 10) and only 5.0% of the total yields in the nd elastic scattering peak (see Fig. 11). In both cases, the measured yields were corrected to account for multiple scattering.
Significant background was due to reactions induced with neutrons produced by the reaction on deuterons implanted in the tantalum beam stop at the end of the neutron production gas cell. Simulations revealed neutrons produced in the beam stop make up less than 0.1% of the nn coincidence yields and about 2.7% of the counts in the nd elastic scattering peak, as shown in Fig. 11.
As shown in Fig. 11, there is a small background in the region of the nd elastic TOF peak due to neutron scattering from protons in the approximately 1.6% CH2 contaminant in the CD2 sample. Because of the mass difference in hydrogen and deuterium, less than half of these events fall within the window of the nd elastic TOF peak. Overall, the simulations indicate that the np scattering events contribue 0.8% of the total yields in the nd elastic scattering window.
Another background quantified by the MC simulation was nd breakup events for which only one neutron was detected. As shown in Fig. 11, the energy reach of neutrons from the non-coincident breakup events is insufficient to contribute to the yields in the window for the elastic TOF peak. These events do contribute significantly to the background at long times in the TOF spectra measured with the CD2 sample. However, no such events are present in TOF spectra measured with the graphite sample. This must be carefully understood to ensure proper normalization of TOF spectra for the graphite sample (see Sec. III.4).
III.4 Luminosity Determination
The product of and in Eq. 1 was determined from the yields for nd elastic scattering, which were measured concurrently with the nd breakup nn coincidence yields. The integrated beam-target luminosity is given by:
| (3) |
The parameters in Eq. 3 are: the net yields for nd elastic scattering (); the efficiency of the neutron detector at the energy of neutrons from nd elastic scattering (); the transmission of the incident neutrons to the center of the sample (); the transmission of the scattered neutrons through the sample and air to the face of the neutron detector (); the differential scattering cross section for nd elastic scattering (); and the solid angle of the neutron detector ().
An accurate extraction of the nd elastic scattering yields requires a detailed understanding of the backgrounds in the region of the nd elastic scattering peak in the neutron TOF spectrum as shown in Fig. 11. Two major sources of background were neutrons scattering from air and neutrons scattering elastically from carbon. Scattering from air was measured using an empty target holder and the background due to carbon was measured using a graphite sample. The TOF spectra measured with the various samples were normalized to each other using the integrated beam current, the data acquisition system live time, and the gas pressure in the neutron production cell. The empty sample TOF spectrum was subtracted from the spectra measured with the CD2 and carbon samples.
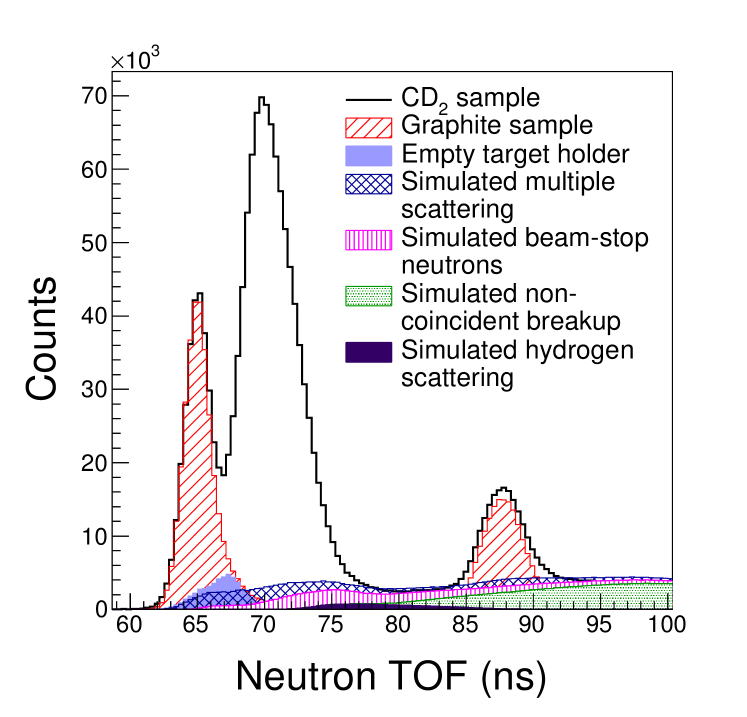
The yields in the inelastic carbon scattering peak were used to finely adjust the normalization factor of the spectrum obtained with the graphite sample to the spectrum measured with the CD2 sample. The backgrounds due to neutron multiple scattering in the CD2 sample, non-coincident nd breakup events, neutrons scattering from hydrogen in the CD2 sample, and neutrons produced via the reaction on deuterons implanted in the beam stop were calculated using the MC simulation and subtracted from the measured spectra.
We measured an integrated beam-target luminosity of cm-2 in the left detector and cm-2 in the right detector. The average of these values was used in Eq. 1 to calculate the breakup cross section:
| (4) |
A geometric mean was chosen to better cancel systematic uncertainties in the final result. The value of used to calculate the breakup cross section was cm-2.
Sources of systematic uncertainty in the luminosity determination are listed in Table 2. Uncertainties in the yields for nd scattering are mainly due to background subtraction errors. Uncertainty in the absolute detector efficiencies is due primarily to the uncertainties in the number of deuterium nuclei in the gas cell and the background subtraction in the efficiency measurements, as well as the uncertainties in the evaluated reaction cross sections used to calculate the efficiencies Drosg and Otuka (2015); Drosg and Schwerer (1987). The uncertainty in the relative detector efficiency is based on the variance between the simulated detector efficiency curves and measured efficiencies (see Fig. 6). A significant contribution to the uncertainty in the detector efficiency is due to drifts in the detector threshold (or gain) over time. Uncertainties in neutron transmission are due to uncertainties in the total cross section data Chadwick et al. (2011). The uncertainty in the cross section for nd scattering comes from the differences in the values given by different NN potentials Skibiński et al. (2018). The uncertainty in the solid angle is mainly due to measurement errors in the distances from the sample to the detectors. The uncertainties for the neutron transmission factors and the uncertainties for the absolute detector efficiencies are correlated. They must be summed before adding in quadrature with the other uncorrelated uncertainties. This is accounted for in Table 2.
| Source | Magnitude (%) |
|---|---|
| Yields in nd elastic peak | 2.3 |
| Absolute detector efficiency | 3.9 |
| Relative detector efficiency | 1.1 |
| Detector gain drift | 0.5 |
| Neutron transmission | 1.1 |
| Cross section for nd elastic scattering | 1.5 |
| Solid angle | 0.4 |
| Total | 5.1 |
As a benchmark on our method for determining the beam-target luminosity, the nd elastic scattering cross section was determined relative to the np scattering cross section at 32° in the lab. This angle was chosen to kinematically separate neutrons scattering on hydrogen from neutrons scattering on carbon. The np scattering yields were extracted from TOF spectra in the same way as the nd elastic scattering yields. The np scattering cross sections used in this work were obtained from Ref. SAID Database .
We measured an nd elastic scattering cross-section value of in the left detector and in the right detector. This is in agreement with the value of 205.0 mb/sr predicted by the finite-geometry theoretical calculations using the CD-Bonn NN potential.
| Source | Magnitude (%) |
|---|---|
| Yields in nd elastic peak | 3.2 |
| Yields in np peak | 1.4 |
| Finite geometry correction | 2.2 |
| Relative detector efficiency | 2.1 |
| Detector gain drift | 1.4 |
| Number of deuterium nuclei | 1.0 |
| Number of hydrogen nuclei | 0.4 |
| Neutron transmission | 0.8 |
| Cross section for np scattering | 0.4 |
| Live time correction | 0.6 |
| Total | 5.1 |
The sources of systematic errors in our measurement of the nd elastic scattering cross section are listed in Table 3. Uncertainties in the yields for np scattering are due to background subtraction errors. There is substantial uncertainty in the finite-geometry correction used to account for the difference in the average flux seen by the CD2 and CH2 samples because of their sizes relative to their distance from the neutron production gas cell. Drifts in the detector bias over time change the detector efficiencies, resulting in a significant uncertainty. The uncertainty in the number of nuclei in the CD2 sample is due to the unknown chemical purity of the sample, which is listed as . We have assumed the chemical purity is with an error of . There is little uncertainty in the isotopic enrichment, measured by Cambridge Isotope Laboratories to be . The uncertainty in the number of hydrogen nuclei in the CH2 sample is mainly due to the uncertainty in the measured mass of that sample. The uncertainty in the cross section for np scattering is the difference in the values given by different NN potentials and partial-wave analyses SAID Database . The data acquisition system live time was measured in two ways: (1) the number of event triggers passing the data acquisition system (DAQ) veto were compared to the total number of event triggers, and (2) the number of pulses from a 60 Hz clock passing the DAQ veto were compared to the total number of clock pulses. The DAQ veto was the logical or of the analog-to-digital converter busy signal, time-to-digital converter busy signal, and DAQ computer readout signals. The live time measured by the triggers was used to compute the nd elastic cross section, and the associated uncertainty is the difference between the live times determined by the two methods. All errors are uncorrelated and added in quadrature.
IV Results
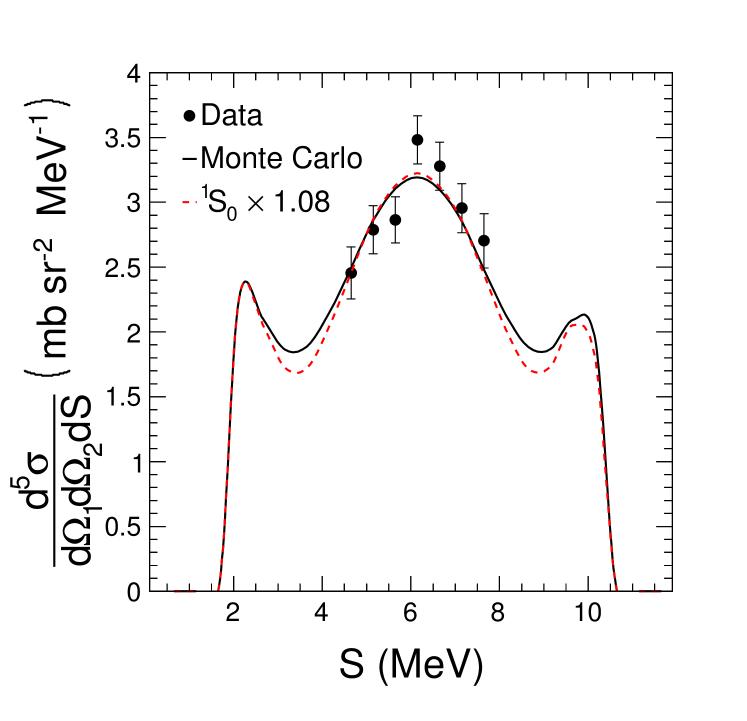
Our cross-section data for nn QFS in nd breakup at 10.0 MeV are plotted as a function of S in Fig. 12. The curves are predictions of rigorous calculations based on the CD-Bonn potential that have been averaged over the finite geometry and energy resolution of the experiment using the MC simulation. The error bars on the data points represent only statistical uncertainties; there is also a systematic uncertainty of 5.6%. The sources of systematic uncertainty are listed in Table 4 and summarized below.
The error in the coincidence yields is due to the uncertainty in the correction for multiple scattering of neutrons in the sample. The uncertainty due to detector gain drift is determined by the percent change in the ratio of efficiencies at the energies for nd elastic scattering and nn QFS breakup for small drifts in the gain. All other sources of uncertainty are the same as those discussed in Sec. III.4 for the determination of the integrated beam-target luminosity. Combining Eqs. 4, 3, and 1 leads to a reduction of several uncertainties. Specifically, the neutron transmission factors for the incident neutron cancel, resulting in elimination of that uncertainty. Uncertainties in the neutron transmission factors and the absolute detector efficiencies for each detector are correlated and must be added linearly with opposite signs for factors in the numerator and denominator. The square root in Eq. 4 results in a factor of multiplying uncertainties associated with the luminosity. Summing all uncertainties in quadrature with the appropriate factors (accounted for in Table 4) gives a total systematic uncertainty of .
| Source | Magnitude (%) |
| Coincidence yields | 1.0 |
| Absolute detector efficiency | 3.9 |
| Relative detector efficiency | 2.4 |
| Detector gain drift | 1.1 |
| Neutron transmission | 0.8 |
| Yields in nd elastic peak | 2.3 |
| Cross section for nd elastic scattering | 1.5 |
| Solid angle | 0.4 |
| Total | 5.6 |
The data are in good agreement with the theoretical prediction ( per datum = 0.97). Integrating the cross section from S = 4.4 MeV to 7.9 MeV gives an integrated measured cross section of mb/sr2, which is consistent with the simulated value of 20.1 mb/sr2. Scaling the nn interaction by a factor of slightly increases the chi-squared value of the comparison between data and theory ( per datum = 0.98); however, this change is not significant.
V Conclusions
We have measured the nn QFS cross section in nd breakup at an incident neutron beam energy of 10.0 MeV using standard neutron TOF techniques. Our setup used a pulsed beam with an open neutron source and heavily shielded neutron detectors. This was the first measurement of this quantity using this detector and source arrangement. The theoretical prediction agrees well with the data within the uncertainty of the experiment. The good agreement between our data and the calculations indicates that the technique of using nd elastic scattering to determine the beam-target luminosity works well for this type of measurement. With this method we were able to determine the beam-target luminosity to an accuracy of . As expected, we are unable to rule out the validity of the observed discrepancies between previously reported data Siepe et al. (2002); Ruan et al. (2007); Lübcke (1992) and theory for the cross section for nn QFS in nd breakup. The nn QFS dilemma remains unresolved, suggesting the possibility of significant charge-symmetry breaking in the NN system. New measurements of nn QFS in nd breakup should be performed at higher energies using a collimated neutron beam for maximum sensitivity to the nn interaction and using nd elastic scattering to determine the beam-target luminosity, a technique validated in this work. The measurements should be carried out with a systematic uncertainty less than 4%.
Acknowledgements.
The authors thank the TUNL technical staff for their contributions. The authors appreciate the use of the supercomputer cluster of the JSC in Jülich, Germany, where part of the numerical calculations were performed. This work is supported in part by the U.S. Department of Energy under grant Nos. DE-FG02-97ER41033 and DE-SC005367 and by the Polish National Science Center under grant No. DEC-2016/22/M/ST2/00173.*
Appendix A
Here we discuss the details of the nd breakup MC simulation and note that the elastic scattering simulation follows a similar procedure. The steps for simulating a single nd breakup history are outlined below.
-
1.
A point was randomly selected in each: the neutron production cell, the scattering sample, and both detectors. These points fix the scattering angles and for the event. The incident neutron energy was calculated from the incident deuteron energy and the kinematics of the reaction. The deuteron energy in the gas cell was approximated as a linear function of distance along the axis of the gas cell due to the energy loss in the gas by the deuterons.
-
2.
An intensity factor for the incident neutrons, , was calculated from the reaction cross section Drosg and Otuka (2015) and neutron transmission from the production point in the gas cell to the breakup point in the CD2 sample.
-
3.
The breakup cross section was determined in steps of 50 keV along the S curve using a multiparameter interpolation over a library of theoretical point-geometry cross sections. The incident neutron energy , the scattering angles , and the position along the S curve were used as interpolation parameters.
-
4.
The product of detector efficiencies and neutron transmission factors were calculated for points at 50 keV intervals along the S curve of the simulated event.
-
5.
A weight factor used to calculate the average breakup cross section was tabulated. The weight factor for each breakup event is:
(5) -
6.
The TOF of each neutron was computed at each point along the S curve. The simulated TOF was used with the center-to-center distance from the sample to detector to calculate the energy of each breakup neutron in the same way as the experiment:
(6) -
7.
The energies of the two breakup neutrons were used to project each simulated event onto the point-geometry kinematic locus in the same way as the experimental data (see Eq. 2). For each simulated event, the weight factor, the values of the breakup cross section, the detector efficiencies, and the neutron transmission factors were stored in bins along the point-geometry S curve.
After simulating a sufficient number of histories (), the finite-geometry averaged values of the breakup cross section, detector efficiencies, and neutron transmission factors as a function of S-curve length were calculated using the weight factors from step 5 above. The formula for calculating the average breakup cross section is given by:
| (7) |
where is the breakup cross section, are given by Eq. 5, and the index runs over events. The average product of detector efficiencies and neutron transmission factors are calculated similarly.
Theoretical point-geometry cross sections in the interpolation library were calculated with the CD-Bonn NN potential Machleidt et al. (1996). The library was a five-dimensional array indexed by the incoming neutron energy , the scattering angles , and , and the position along the S curve. The range of the library indices spanned all possible scattering configurations for the geometry of our experiment and the step size in each dimension was chosen to minimize the variance between points on the grid while keeping the library to a reasonable size ( points).
Some modifications to the simulation procedure outlined above are necessary to simulate various backgrounds. To simulate multiple scattering, a second point was randomly chosen within the scattering volume. Processes with more than two neutron scattering sites were not considered. The simulation process was otherwise the same as described above. In the case of elastic scattering, all permutations of scattering from two nuclei in the sample were simulated. For nd breakup, two cases were simulated: (1) elastic scattering followed by nd breakup, and (2) nd breakup followed by elastic scattering of one of the breakup neutrons. A second breakup cross section library spanning all kinematically allowed breakup configurations was generated for the simulation of multiple scattering.
In the case of non-coincident nd breakup events, a random direction was chosen for one of the two breakup neutrons rather than a point in a detector. Since the undetected neutron can be emitted in any kinematically allowed direction, the same breakup cross section library used for simulating multiple scattering was used to simulate non-coincident breakup. Weight factors were calculated using only the neutron transmission factor and detector efficiency for the detected neutron.
To simulate neutrons produced via the on deuterons implanted in the beam stop, the neutron production point was chosen inside the tantalum beam stop. All scattering processes were then simulated in the normal way. The distribution of deuterons implanted in the beam stop was assumed to be uniform. Deuteron energy loss in the tantalum was simulated using srim Ziegler et al. (2010). The ratio of deuterons in the beam stop to deuterons in the gas was determined by comparing simulated and measured TOF spectra for the monitor detector positioned at 3° with no sample present. The number of deuterons in the beam stop was determined to be 6.9% of the number of deuterons in the gas.
References
- Glöckle et al. (1996) W. Glöckle, H. Witała, D. Hüber, H. Kamada, and J. Golak, Phys. Rep. 274, 107 (1996).
- Siepe et al. (2002) A. Siepe, J. Deng, V. Huhn, L. Wätzold, C. Weber, W. von Witsch, H. Witała, and W. Glöckle, Phys. Rev. C 65, 034010 (2002).
- Ruan et al. (2007) X. C. Ruan, Z. Y. Zhou, X. Li, J. Jiang, H. X. Huang, Q. P. Zhong, H. Q. Tang, B. J. Qi, J. Bao, B. Xin, W. von Witsch, and H. Witała, Phys. Rev. C 75, 057001 (2007).
- Lübcke (1992) W. Lübcke, Ph.D. thesis, University of Bochum (1992), unpublished.
- Witała and Glöckle (2011) H. Witała and W. Glöckle, Phys. Rev. C 83, 034004 (2011).
- Slaus et al. (1971) I. Slaus, J. W. Sunier, G. Thompson, J. C. Young, J. W. Verba, D. J. Margaziotis, P. Doherty, and R. T. Cahill, Phys. Rev. Lett. 26, 789 (1971).
- Bovet et al. (1978) E. Bovet, F. Foroughi, and J. Rossel, Nucl. Phys. A 304, 29 (1978).
- Soukup et al. (1979) J. Soukup, J. M. Cameron, H. W. Fielding, A. H. Hussein, S. T. Lam, and G. C. Neilson, Nucl. Phys. A 322, 109 (1979).
- Guratzsch et al. (1980) H. Guratzsch, B. Kühn, H. Kumpf, J. Mösner, W. Neubert, W. Pilz, G. Schmidt, and S. Tesch, Nucl. Phys. A 342, 239 (1980).
- von Witsch et al. (1980) W. von Witsch, B. Gómez Moreno, W. Rosenstock, R. Franke, and B. Steinheuer, Phys. Lett. 91B, 342 (1980).
- Glasgow et al. (1974) D. W. Glasgow, D. E. Velkley, J. D. Brandenberger, M. T. McEllistrem, H. J. Hennecke, and D. V. Breitenbecher, Nucl. Instr. Methods 114, 521 (1974).
- Finckh et al. (1987) E. Finckh, K. Geissdörfer, R. Lin, S. Schindler, and J. Strate, Nucl. Instr. Methods Phys. Res. A 262, 441 (1987).
- Drosg and Otuka (2015) M. Drosg and N. Otuka, Tech. Rep. INDC(AUS)-0019 (IAEA Nuclear Data Section, Vienna, Austria, 2015).
- Dietze and Klein (1982) G. Dietze and H. Klein, Tech. Rep. PTB-ND-22 (Physikalisch-Technische Bundesanstalt, Braunschweig, Germany, 1982).
- Faddeev (1961) L. D. Faddeev, Soviet Physics JETP 12, 1014 (1961).
- Machleidt et al. (1996) R. Machleidt, F. Sammarruca, and Y. Song, Phys. Rev. C 53, R1483 (1996).
- Chadwick et al. (2011) M. Chadwick, M. Herman, P. Obložinský, et al., Nucl. Data Sheets 112, 2887 (2011), special Issue on ENDF/B-VII.1 Library.
- (18) SAID Database, “SAID partial wave analysis,” http://gwdac.phys.gwu.edu/, accessed 2017-03-07.
- Glasgow et al. (1976) D. W. Glasgow, F. O. Purser, H. Hogue, J. C. Clement, K. Stelzer, G. Mack, J. R. Boyce, D. H. Epperson, S. G. Buccino, P. W. Lisowski, S. G. Glendinning, E. G. Bilpuch, H. W. Newson, and C. R. Gould, Nucl. Sci. and Eng. 61, 521 (1976).
- Drosg and Schwerer (1987) M. Drosg and O. Schwerer, in Handbook on Nuclear Acitivation Data, IAEA Tech. Rep. Ser. No. 273, edited by K. Okamoto (Vienna, Austria, 1987).
- Skibiński et al. (2018) R. Skibiński, Y. Volkotrub, J. Golak, K. Topolnicki, and H. Witała, Phys. Rev. C 98, 014001 (2018).
- Ziegler et al. (2010) J. F. Ziegler, M. Ziegler, and J. Biersack, Nucl. Instr. Methods Phys. Res. B 268, 1818 (2010), 19th International Conference on Ion Beam Analysis.