Comment on “Observation of annual modulation by rays from (,) reactions at the Soudan Underground Laboratory”
Abstract
Tiwari et al. have identified an annual modulation of the -ray flux at the Soudan Underground Laboratory which is strongly correlated to the radon concentration. The -ray flux results from (,) reactions which are induced by the activity of radon and its daughters. Unfortunately, the quantitative analysis of the -ray flux is based on unrealistic (,) cross sections, and thus the calculated -ray fluxes are not reliable.
In a recent study, Tiwari, Zhang, Mei, and Cushman (TZMC) Tiw17 have studied -ray fluxes which result from (,) reactions on 16O, 27Al, and 28Si which are the most abundant components of rock at the Soudan Underground Laboratory (SUL). The particles are provided by decay of 220Rn and 222Rn and all daughter nuclides (see Table I in Tiw17 ). A correlation between the annual modulation of the radon concentration at SUL and the (,) flux is found by TZMC. This is an important result which may affect the interpretation of low-background experiments like the search for dark matter, neutrionoless double- decay, or weakly interacting massive particles Tiw17 . Whereas the temporal correlation between the radon concentration and the -ray flux is well established, the quantitative analysis suffers from unrealistic cross sections of the (,) reactions under study by TZMC.
The highest energy in the 220Rn chain is keV from the decay of 212Po; for 222Rn one finds keV from the decay of 214Po. (Note that Table I of TZMC with the energies has been updated Tiw17 ).
TZMC use the TALYS code TALYS ; TALYS2 to estimate the (,) capture cross sections. The application of a statistical model code like TALYS for light nuclei, in particular for the doubly-magic 16O with its low level density, requires special care because the statistical model provides average cross sections whereas in reality the (,) cross section is governed by individual resonances. Limits of the applicability of the statistical model in this mass range have recently been discussed in Mohr17 , and the isospin suppression of (,) cross sections in nuclei was analyzed in Rau00b .
For simplicity, the following discussion mainly focuses on 16O and the 16O(,)20Ne reaction. The same arguments are also valid for 27Al and 28Si.
As a first step, TZMC use the TALYS code to calculate the cross section for -ray emission at a given energy MeV (Fig. 5 in TZMC). A continuous -ray spectrum is found with energies from about 1 MeV up to more than 14 MeV. Obviously, two conspiciuties result from the application of the TALYS code and the chosen parameters: () The maximum -ray energy in the 16O(,)20Ne reaction is limited to keV = 7930 keV for MeV. This strict physical limit is at least 6 MeV below the highest -ray energies shown in Fig. 5 of TZMC. () The -ray spectrum in Fig. 5 should be discrete with primary lines at 7930 keV for (,), 6296 keV for (,) to the state at 1634 keV, 3682 keV for (,) to the state at 4248 keV, 2963 keV for (, to the state at 4967 keV, etc. Secondary -rays appear at 1634 keV (), 2614 keV (), and 3333 keV (); most of the higher-lying states in 20Ne preferentially decay by -emission with negligible secondary -rays.
For completeness, I also provide the maximum -ray energies for MeV in the 27Al(,)31P and 28Si(,)32S reactions which are 13.15 MeV for 27Al and 10.45 MeV for 28Si. In both cases TZMC show -ray energies up to above 20 MeV in their Fig. 5.
From the discussion during the review process of this Comment, it became clear that the -ray energies above in Fig. 5 of TZMC result from the TALYS parameter “elwidth” which is the Gaussian spreading width for outgoing particles. The intention of “elwidth” is a simple comparison of the theoretical TALYS spectrum (with infinite energy resolution) to experimental spectra (with finite energy resolution). By default, “elwidth” is set to 0.5 MeV in TALYS, leading to a parabolic high-energy tail in the logarithmic plot in Fig. 5 of TZMC.
Next, TZMC use the calculated -ray spectra at different energies to calculate the -ray yield according to their Eq. (1). In the case of 16O, this leads to Fig. 8 of TZMC with a continuous -ray spectrum up to MeV. Again, the highest energies can only be reached because of the above discussed “elwidth” parameter, as the highest keV from the 212Po decay leads to keV. Note that also for the low-abundant 17,18O with their larger -values remains below 16854 keV.
For a smooth excitation function of the 16O(,)20Ne reaction, the energy loss of the particles in the rock at SUL would indeed finally lead to a continuous -ray spectrum for the primary -rays. (The secondary -rays appear as discrete lines in any case and are missing in Fig. 8 of TZMC). However, the excitation function of the 16O(,)20Ne reaction is not smooth, but governed by individual resonances (see e.g. Figs. 3 and 4 of Pea64 in the relevant energy range of the present study) which are superimposed over a small non-resonant contribution (e.g., Cos10 ; Hag11 ; Hag12 ; Mohr05 ). Thus, -rays with discrete energies from about 15 resonances with their individual branchings should be visible in the -ray flux in Fig. 8 of TZMC. This holds even for the heavier targets under study by TZMC, as can e.g. be seen in the -ray spectrum of a thick-target experiment of the 28Si(,)32S reaction at MeV (see Fig. 1 of Bab02 ).
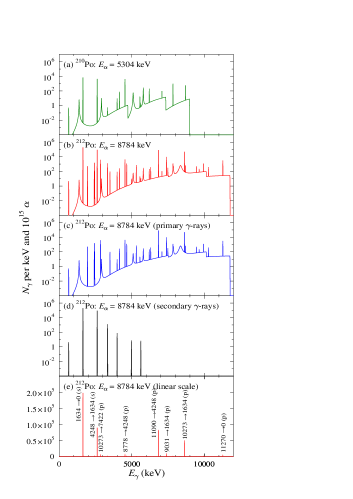
As an illustration of the expected discrete -ray spectra, Fig. 1 shows the calculated thick-target -ray yields from the 16O(,)20Ne reaction for the energies keV and 8784 keV, corresponding to the -decay energies of 210Po and 212Po; these are the highest and lowest energies under study in TZMC. The calculated spectra in Fig. 1 are based on experimental resonance properties (as adopted in Til98 ) and complemented by a small non-resonant direct capture contribution (taken from the calculations in Mohr05 , in good agreement with experiment at MeV Hag12 ). The -ray yield is dominated by very few strong resonances at higher energies and two secondary -ray lines below 4 MeV; this becomes nicely visible in the linear plot (e) of Fig. 1. All -ray spectra in Fig. 1 are shown for a resolution of 5 keV.
Similar spectra for the 27Al(,)31P and 28Si(,)32S reactions cannot be calculated because the resonance properties are not completely known for the relevant energy range. However, a measurement of these spectra seems feasible: the -ray spectra for the 16O(,)20Ne reaction in Fig. 1 are shown for -particles which corresponds to a few minutes of a 1 A beam.
Finally, it should be noted that Eq. (1) of TZMC differs from the calculations in Heaton et al. Hea89 (Ref. in TZMC): As usual, in Hea89 (p. 534) the yield results from an integral over (with the energy-dependent stopping power in the integrand) whereas Eq. (1) of TZMC only contains the stopping power at the initial energy ( in TZMC) outside the integral.
At the very end, TZMC provide integrated -ray fluxes in the broad energy interval from 4 to 10 MeV (Table II in Tiw17 ). This energy interval roughly excludes their non-physical results where the calculated is above the maximum energy , and it integrates over the discrete resonances which should have appeared in Figs. of TZMC. Most secondary -ray lines show lower energies than 4 MeV and do not affect the MeV energy window of TZMC. Thus, in conclusion I point out that the final -ray fluxes of TZMC may have the correct order of magnitude although the quantitative analysis of TZMC is inconsistent. Because of the importance of the results for the understanding of the background at SUL, an improved analysis should be performed.
This work was supported by NKFIH (K108459 and K120666).
References
- (1) Ashok Tiwari, C. Zhang, D.-M. Mei, and P. Cushman, Phys. Rev. C 96, 044609 (2017); Phys. Rev. C 98, 019901(E) (2018).
- (2) A. J. Koning, S. Hilaire, S. Goriely, computer code TALYS, http://www.talys.eu.
- (3) A. J. Koning, S. Hilaire, and M. C. Duijvestijn, AIP Conf. Proc. 769, 1154 (2005).
- (4) P. Mohr, Phys. Rev. C 96, 045808 (2017).
- (5) T. Rauscher, F.-K. Thielemann, J. Görres, M. Wiescher, Nucl. Phys. A675, 695 (2000).
- (6) J. D. Pearson and R. H. Spear, Nucl. Phys. 54, 434 (1964).
- (7) H. Costantini et al., Phys. Rev. C 82, 035802 (2010).
- (8) U. Hager et al., Phys. Rev. C 84, 022801(R) (2011).
- (9) U. Hager et al., Phys. Rev. C 86, 055802 (2012).
- (10) P. Mohr, Phys. Rev. C 72, 035803 (2005).
- (11) M. Babilon et al., Phys. Rev. C 66, 028801 (2002).
- (12) D. R. Tilley et al., Nucl. Phys. A636, 237 (1998).
- (13) R. Heaton, H. Lee, P. Skensved, and B. C. Robertson, Nucl. Inst. Meth. Phys. Res. A 276, 529 (1989).