Discovery of the black hole X-ray binary transient MAXI J1348630
Abstract
We report the first half-year monitoring of the new Galactic black hole candidate MAXI J1348–630, discovered on 2019 January 26 with the Gas Slit Camera (GSC) on-board MAXI. During the monitoring period, the source exhibited two outburst peaks, where the first peak flux (at =14 day from the discovery of =0) was 4 Crab (2–20 keV) and the second one (at =132 day) was 0.4 Crab (2–20 keV). The source exhibited distinct spectral transitions between the high/soft and low/hard states and an apparent “q”-shape curve on the hardness–intensity diagram, both of which are well-known characteristics of black hole binaries. Compared to other bright black hole transients, MAXI J1348–630 is characterized by its low disk-temperature (0.75 keV at the maximum) and high peak flux in the high/soft state. The low peak-temperature leads to a large innermost radius that is identified as the Innermost Stable Circular Orbit (ISCO), determined by the black hole mass and spin. Assuming the empirical relation between the soft-to-hard transition luminosity () and the Eddington luminosity (), , and a face-on disk around a non-spinning black hole, the source distance and the black hole mass are estimated to be kpc and 7, respectively. The black hole is more massive if the disk is inclined and the black hole is spinning. These results suggest that MAXI J1348–630 may host a relatively massive black hole among the known black hole binaries in our Galaxy.
1 Introduction
Black hole binaries (BHBs), those consisting of a stellar mass black hole and a main-sequence star, are known to exhibit two distinct X-ray spectral states; the “low/hard” state and the “high/soft” state (e.g., Remillard & McClintock, 2006; Belloni, 2009; McClintock & Remillard, 2009). The low/hard state is observed when the mass accretion rate is relatively low, where the optically-thick/geometry-thin standard disk is likely to be truncated before reaching the Innermost Stable Circular Orbit (ISCO), and the inner-disk becomes a radiatively inefficient hot accretion flow. When the accretion rate becomes higher than a certain threshold, the inner-disk switches its nature from the optically-thin/geometrically-thick state to the standard disk, where the innermost radius will reach to the ISCO.
One of the most efficient ways to discover such BHBs and study their state transitions is to continuously monitor the entire sky in X-rays, because most BHBs are transients and exhibit unpredictable X-ray outbursts. The Monitor of All-sky X-ray Image (; Matsuoka et al. 2009), which is operated on the International Space Station (ISS) and surveying 85 of the sky every 92 minutes (corresponding to the ISS orbital period, where each strip of the sky is exposed for a duration of 40–100 sec), is an ideal instruments for that purpose. In fact, since 2009, MAXI discovered 13 new BHB transients and monitored their state transitions extensively (Negoro, 2019; Negoro et al., 2019a).
In this letter, we report the discovery of MAXI J1348630 on 2019 January 26 by MAXI (Yatabe et al., 2019) and the results of continuous monitoring of the source till 2019 August 3 (176 days after the discovery) including two outbursts (see also Jana et al. 2020 for the first outburst). Since its discovery, the source was subsequently observed with other X-ray telescopes, /X-ray Telescope (Kennea & Negoro, 2019), INTEGRAL (Lepingwell et al., 2019), and NICER (Sanna et al., 2019). We also analyze data to supplement the energy bands above 15 keV and below 2.0 keV, where MAXI is not sensitive.
Optical counterpart was detected by iTelescope.Net T31 0.51-m telescope in Siding Spring (Denisenko et al., 2019), Swift/UVOT (Kennea & Negoro, 2019), and Las Cumbres Observatory network 2-m and 1-m telescopes (Russell et al., 2019b). The radio counterpart was detected by Australia Telescope Compact Array (Russell et al., 2019c) with a flat spectrum consistent with a compact jet.
2 Observation and Data Reduction
2.1 MAXI
MAXI J1348630 was detected with the Gas Slit Camera (GSC; Mihara et al., 2011; Sugizaki et al., 2011) through the MAXI nova alert system (Negoro et al., 2016) at 03:16 UT on 2019 Jan 26 (MJD 58509, =0; hereafter, is defined as -58509), where the X-ray flux was 47 mCrab (4–10 keV) (Yatabe et al., 2019). We analyzed the long term data of MAXI J1348–630 from the discovery to 2019 Aug 3 using the MAXI/GSC on-demand web interface 111http://maxi.riken.jp/mxondem (Nakahira et al., 2013). The source events were extracted within a circular region of radius around the source position (Kennea & Negoro, 2019). The background region was set to a concentric ring with the outer-radius of . We used only the GSC counters with minimum damages, GSC #2 and #7 operated at the high voltage of 1550 V, and #4 and #5 at 1660 V.
2.2 Swift
The Burst Alert Telescope (BAT) on-board Swift searches all-sky for Gamma-ray bursts, and also provides light curves of major sources in 15-50 keV. We used the public BAT light curves available on the BAT Transition Monitor website (Krimm et al., 2013) 222https://swift.gsfc.nasa.gov/results/transients/. We also used the pointing observation data of the X-Ray Telescope (XRT) (Burrows et al., 2005). We used the on-demand web interface (Evans et al., 2009)333https://www.swift.ac.uk/user_objects/ to reduce the XRT data, whose observation IDs are 00011107024, 00011107029, and 0001110702. In the spectral analysis, we adopted the response matrix file provided via the HEASARC calibration database444https://heasarc.gsfc.nasa.gov/FTP/caldb/data/swift/xrt/cpf/rmf/.
3 Results
3.1 MAXI/GSC
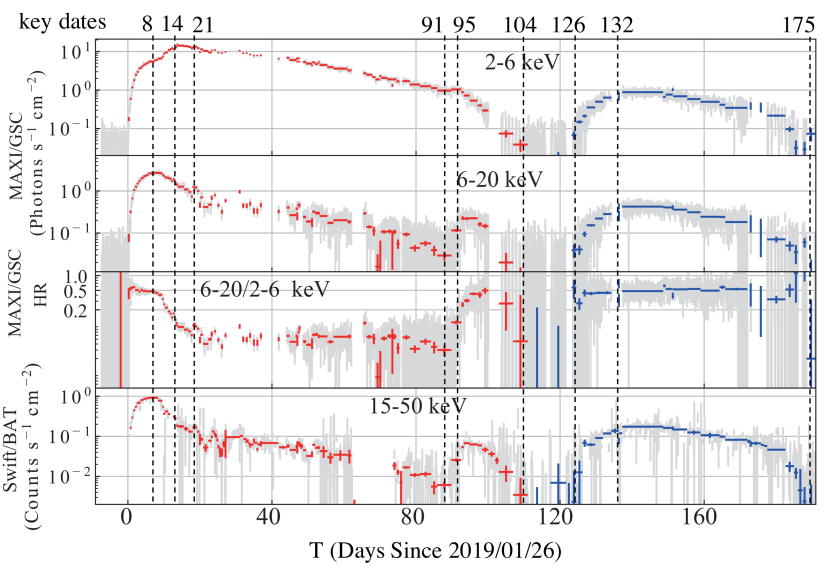
Figure 1 shows the X-ray light curves of MAXI J1348630 in 2–6 keV (soft) and 6–20 keV (hard) bands, and their hardness ratio, as well as the light curve in 15–50 keV obtained with Swift/BAT. Because the Crew Dragon Spacecraft launched by SpaceX was located on the line of sight during =36–41, we do not use the data during this period.
After the discovery on 2019 January 26 (MJD 58509, =0), the hard band flux rapidly increased and reached the peak on =8. The source spectra showed a distinct hard-to-soft transition between =8 and =21 (Nakahira et al., 2019; Cangemi et al., 2019; Bassi et al., 2019). The source was initially in the hard state, where the hardness ratio was almost constant at around 0.5 until the hard-band peak (=8). After that, the hard band flux rapidly dropped until , then slowly declined throughout the following 70 days. On the other hand, the soft band flux further increased after the hard band peak, then reached its peak on Feb 9 (=14) at 1.1101 photons cm-2 s-1 (2–6keV). The flux observed with MAXI/GSC (2–20keV) declined steadily during =21–91 by keeping the constant hardness ratio at around 0.05. Near the end of the first outburst (=91–95), the source went back to the hard state with the hardness ratio 0.5. After =95, the source gradually faded, and finally reached below the detection limit of MAXI/GSC at =104.
On 2019 May 31 (MJD 58634, =126), the source brightened again and reached the peak flux 1.0 photons cm-2 s-1 (2–20 keV) on =132 (Russell et al., 2019a; Negoro et al., 2019b), which is about 10 of the first peak, followed by steady decline. The hardness ratio during the re-brightening phase was almost constant at 0.5, thus the source was in the hard state throughout the second outburst. After =175, the source got down below the detection limit again.

The hardness-intensity diagram (HID) in Figure 2 shows a clear “q”-curve (e.g. Nakahira et al., 2019). According to the time-history of the hardness ratio, we classified the entire observation period into the three spectral states; the low/hard state of =0–8 and 107–191, the transition state of =8–21 and 91–106, and the high/soft state of =21–91.
Both the distinct spectral transitions and the “q”-shaped HID are common properties of BHBs (e.g., Homan & Belloni, 2005). Therefore, we fitted the observed spectra with a standard BHB spectral model. We used version 12.10.0c for spectral model fitting. Because daily MAXI/GSC data do not have enough photon statistics for model fitting, we adaptively accumulated data for several days using the Bayesian block representations with the normalization constant (Scargle et al., 2013). In the high/soft state, we adopt the optically thick Multi-Color-Disk blackbody model (Mitsuda et al., 1984) and its inverse-Compton scattering approximated by (Steiner et al., 2009). We applied the interstellar absorption of Tuebingen-Boulder model with the Solar abundance given by Wilms et al. (2000). We fixed the neutral hydrogen column density at cm-2 obtained from Swift/XRT data (see Section 3.2). The model is described as where free parameters are scattering fraction of , innermost temperature and normalization () of . The photon index is assumed to be constant at the canonical value =2.5 since the hard-tail in the high/soft state is so weak that the index is hardly constrained (e.g. McClintock & Remillard, 2009). Here, we confirmed that the disk temperature is only slightly increased or decreased by 0.03 keV when is changed to 2.0 or 3.0 even when the hard-tail was the strongest (=23). In the low/hard state, the model is described by where free parameters are photon index and normalization of . In the transition states, we applied the same model as in the high/soft state, but was treated as a free parameter. After the phenomenological spectral fittings, we estimate a more realistic innermost disk radius as follows: Definition of the diskbb normalization is
| (1) |
where is the source distance, is the disk inclination angle, and is an apparent disk radius. We estimate as
| (2) |
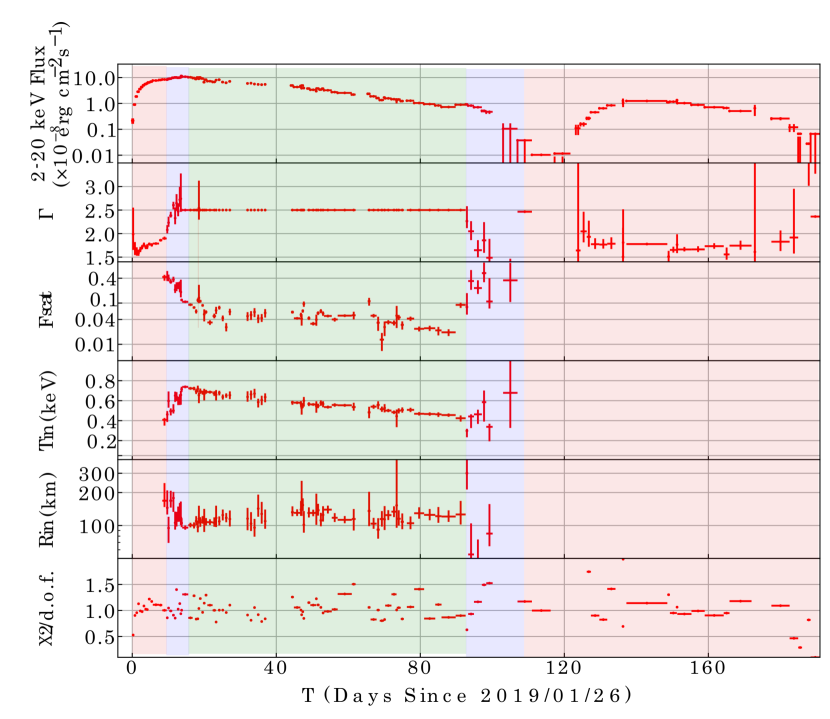
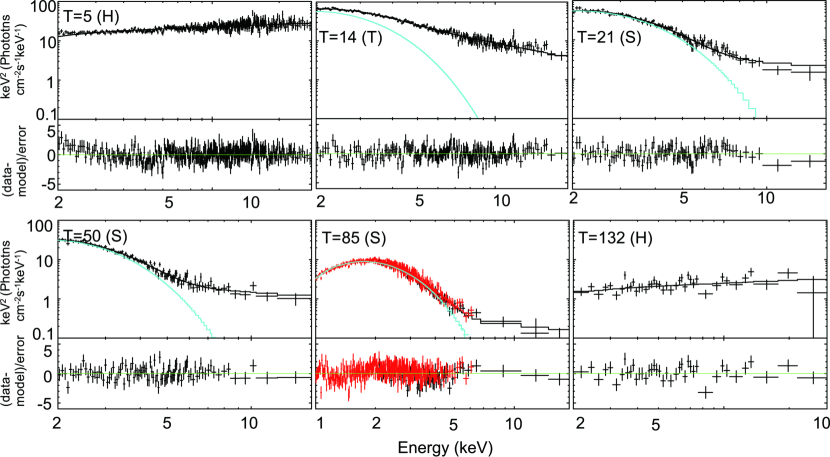
where 0.41 is a correction factor for the inner boundary condition (Kubota et al., 1998), 1.7 is the color hardening factor (Shimura & Takahara, 1995). Figure 3 shows a time-history of the spectral fitting parameters (with errors of 90% confidence limits of statistical uncertainties), where is calculated assuming the most plausible distance =4 kpc (see the Discussion below) and =0. Figure 4 shows the results of model fittings on several key dates.
3.2 Swift/XRT
Because the MAXI/GSC data with the energy band above 2 keV cannot precisely determine of the interstellar absorption, we analyzed the data obtained with Swift/XRT, which is more sensitive in the lower energy range (1–10 keV). We chose the data of =56, 65, and 85 in the high/soft state, and fitted these spectra with the same spectral model. The obtained value was 8.6 cm-2 at =85, which we adopt throughout this paper, and those values in the other dates were agreed within 2.0 cm-2.
Also, we conducted joint spectral fitting of Swift/XRT and MAXI/GSC data taken on =56, 65 and 85. Result on =85 is shown in the bottom-center of Figure 4. When was made independently fitted to each instrument, MAXI GSC gives 0.46 keV, and Swift/XRT gives 0.52 keV. We found Swift/XRT always give slightly higher values than MAXI/GSC during the high/soft state. This is probably due to presence of the significant hard-tail, which is hardly constrained by Swif/XRT below 7 keV but clearly recognized by MAXI.
4 Discussion
We discuss nature of the new X-ray transient MAXI J1348–630 from the results of the data analysis above. The source exhibited clear spectral transitions (Figure 1) and a q-shaped track on the HID (Figure 2), both of which are well-known characteristics of BHBs. Furthermore, we successfully fitted energy spectra in the three spectral states with their typical spectral models. (Figure 3). These facts strongly suggest that MAXI J1348–630 is a new BHB.
Here, we point out that the maximum disk temperature is as low as 0.75 keV even at the high/soft state luminosity peak (=14). This is remarkably lower compared to other luminous black hole transients, where the maximum disk temperature almost always exceeds 1 keV. The low disk temperature and the high luminosity lead to the large innermost radius because the disk luminosity is proportional to . The large innermost radius suggests that MAXI J1348–630 harbors a relatively massive black hole compared to other black hole.
In particular, the innermost radius of the accretion disk () is nearly constant during the high/soft state, while the 2–20 keV flux and the disk temperature were significantly variable (Figure 3). This is a remarkable property in the high/soft state BHBs, such that the constant radius corresponds to the Innermost Stable Circular Orbit (ISCO; e.g., Tanaka, 1989; Ebisawa et al., 1993; Steiner et al., 2010), which is determined by black hole mass and spin.
In the case of non-rotating black holes, ISCO is equal to three times the Schwarzschild radius. Thus, from the average innermost radius of the disk, km, the black hole mass is estimated to be
| (3) |
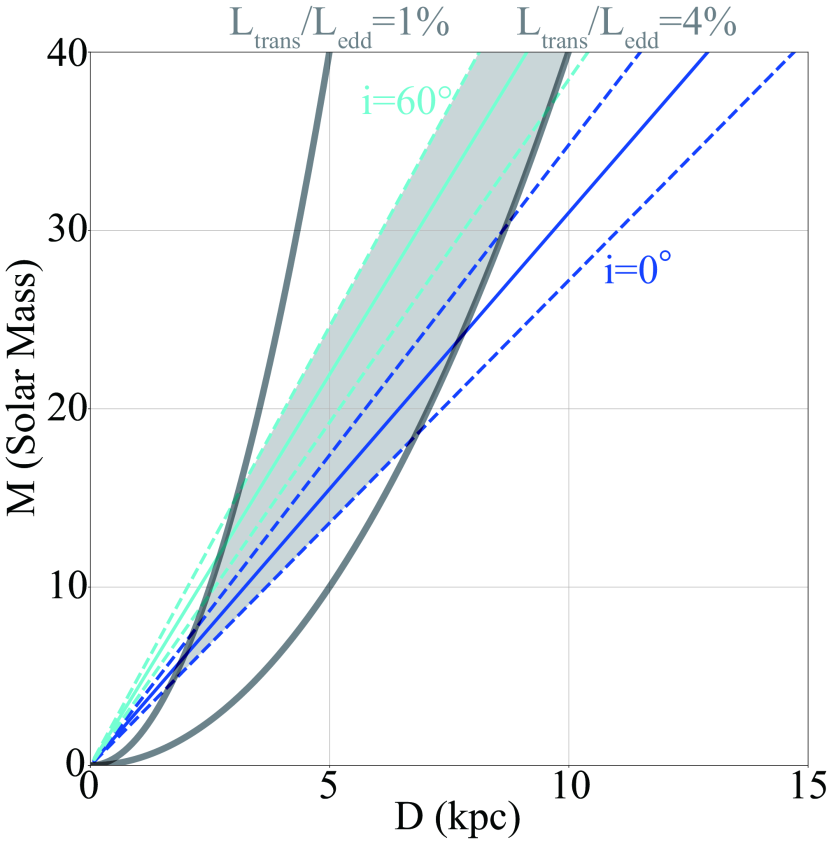
The expected distance-mass relation in and are shown in Figure 5.
In addition, BHBs are known to show similar luminosity dependence of the spectral states. For instance, in the current case of MAXI J1348–630, the flux at the soft-to-hard transition (=91) is 10 % of the peak flux in the high/soft state (=14); this value is consistent with those of other BHBs discovered by MAXI, such as MAXI J1820+070 (12 %; Shidatsu et al. 2019) and MAXI J1910-057 (10–15 %; Nakahira et al. 2014). Furthermore, it was pointed out that the soft-to-hard transition typically occurs at 1–4% of the Eddington luminosity () (Maccarone, 2003). Namely, the bolometric luminosity soon after the soft-to-hard transition is expected to be 0.01 to 0.04 . The grey curves in Figure 5 give the distance-mass relation of 0.01 and 0.04, where we employed the bolometric flux at the soft-to-hard transition erg s-1 cm-2 on 96 and erg s-1.
Next, we try to constrain the source distance. The galactic coordinate of the source is , which is tangential to the Galactic Scutum-Centaurus arm. If MAXI J1348630 locates in the Scutum-Centaurus arm, the distance is estimated to be 4–8 kpc (e.g., Xu et al., 2018). However, the value of cm-2 implies that the source is located in front of the arm at 3–4 kpc. If we adopt the most likely index 0.02 (Vahdat Motlagh et al., 2019), the distance becomes 3.8 kpc for the face-on disk. It is consistent with the estimates from optical observations (Russell et al., 2019b; Charles et al., 2019).
In order to estimate the black hole mass more precisely taking account of the relativistic effects, we tried the model insted of the model(Li et al., 2005). The model gives relations among the spinning parameter , inclination angle and black hole mass under a given source distance, mass accretion rate, and spectral hardening factor ( in Equation 2). We carried out a joint fit to the MAXI/GSC and Swift/XRT spectra at =85 fixing =4 kpc and for several discrete and values, only allowing the black hole mass and mass accretion rate to be free. Consequently, the values of were 7.0 (=0, =), 14 (=0, =), 18 (, =), and 76 (, =). Hence, we have reached a robust conclusion that MAX J1348–630 hosts a relatively massive black hole. Jana et al. (2020) also suggests a black hole mass of 9 based on an independent accretion disk spectral model.
The binarity of MAXI J1348–63 has never been confirmed from observations of the dynamical motion. Follow-up detailed optical/infrared spectroscopic observations are strongly encouraged to constrain the black hole mass as well as the source distance more precisely.
This research has made use of the MAXI data provided by RIKEN, JAXA and the MAXI team, and the Swift data and analysis software provided by the High Energy Astrophysics Science Archive Research Center (HEASARC), which is a service of the Astrophysics Science Division at NASA/GSFC.
References
- Bassi et al. (2019) Bassi, T., Del Santo, M., D’Ai, A., et al. 2019, The Astronomer’s Telegram, 12477, 1
- Belloni (2009) Belloni, T. M. 2009, Lecture Notes in Physics, 794, 53
- Burrows et al. (2005) Burrows, D. N., Hill, J. E., Nousek, J. A., et al. 2005, Space Science Reviews, 120, 165
- Cangemi et al. (2019) Cangemi, F., Belloni, T., & Rodriguez, J. 2019, The Astronomer’s Telegram, 12471, 1
- Charles et al. (2019) Charles, P. A., Buckley, D. A. H., Kotze, E., et al. 2019, The Astronomer’s Telegram, 12480, 1
- Denisenko et al. (2019) Denisenko, D., Denisenko, I., Evtushenko, M., et al. 2019, The Astronomer’s Telegram, 12430, 1
- Ebisawa et al. (1993) Ebisawa, K., Makino, F., Mitsuda, K., et al. 1993, ApJ, 403, 684
- Evans et al. (2009) Evans, P. A., Beardmore, A. P., Page, K. L., et al. 2009, MNRAS, 397, 1177
- Homan & Belloni (2005) Homan, J., & Belloni, T. 2005, Ap&SS, 300, 107
- Jana et al. (2020) Jana, A., Debnath, D., Chatterjee, D., et al. 2020, arXiv e-prints, arXiv:2004.03792
- Kennea & Negoro (2019) Kennea, J. A., & Negoro, H. 2019, The Astronomer’s Telegram, 12434, 1
- Krimm et al. (2013) Krimm, H. A., Holland, S. T., Corbet, R. H. D., et al. 2013, ApJS, 209, 14
- Kubota et al. (1998) Kubota, A., Tanaka, Y., Makishima, K., et al. 1998, PASJ, 50, 667
- Lepingwell et al. (2019) Lepingwell, A. V., Fiocchi, M., Bird, A. J., et al. 2019, The Astronomer’s Telegram, 12441, 1
- Li et al. (2005) Li, L.-X., Zimmerman, E. R., Narayan, R., & McClintock, J. E. 2005, ApJS, 157, 335
- Maccarone (2003) Maccarone, T. J. 2003, A&A, 409, 697
- Matsuoka et al. (2009) Matsuoka, M., Kawasaki, K., Ueno, S., et al. 2009, PASJ, 61, 999
- McClintock & Remillard (2009) McClintock, J. E., & Remillard, R. A. 2009, in Compact Stellar X-ray Sources (Cambridge University Press), 157–214
- Mihara et al. (2011) Mihara, T., Nakajima, M., Sugizaki, M., et al. 2011, PASJ, 63, S623
- Mitsuda et al. (1984) Mitsuda, K., Inoue, H., Koyama, K., et al. 1984, PASJ, 36, 741
- Nakahira et al. (2014) Nakahira, S., Negoro, H., Shidatsu, M., et al. 2014, PASJ, 66, 84
- Nakahira et al. (2013) Nakahira, S., Ebisawa, K., Negoro, H., et al. 2013, Journal of Space Science Informatics, 2, 29. http://repository.tksc.jaxa.jp/pl/dr/AA0061914004
- Nakahira et al. (2019) Nakahira, S., Kawai, N., Negoro, H., et al. 2019, The Astronomer’s Telegram, 12469, 1
- Negoro (2019) Negoro, H. 2019, Astronomical Herald, 112, 627. http://www.asj.or.jp/geppou/archive_open/2019_112_09/112-9_627.pdf
- Negoro et al. (2016) Negoro, H., Kohama, M., Serino, M., et al. 2016, PASJ, 68, S1
- Negoro et al. (2019a) Negoro, H., Miike, K., Nakajima, M., et al. 2019a, The Astronomer’s Telegram, 13256, 1
- Negoro et al. (2019b) Negoro, H., Mihara, T., Nakajima, M., et al. 2019b, The Astronomer’s Telegram, 12838, 1
- Remillard & McClintock (2006) Remillard, R. A., & McClintock, J. E. 2006, ARA&A, 44, 49
- Russell et al. (2019a) Russell, D. M., Al Yazeedi, A., Bramich, D. M., Baglio, M. C., & Lewis, F. 2019a, The Astronomer’s Telegram, 12829, 1
- Russell et al. (2019b) Russell, D. M., Baglio, C. M., & Lewis, F. 2019b, The Astronomer’s Telegram, 12439, 1
- Russell et al. (2019c) Russell, T., Anderson, G., Miller-Jones, J., et al. 2019c, The Astronomer’s Telegram, 12456, 1
- Sanna et al. (2019) Sanna, A., Uttley, P., Altamirano, D., et al. 2019, The Astronomer’s Telegram, 12447, 1
- Scargle et al. (2013) Scargle, J. D., Norris, J. P., Jackson, B., & Chiang, J. 2013, ApJ, 764, 167
- Shidatsu et al. (2019) Shidatsu, M., Nakahira, S., Murata, K. L., et al. 2019, ApJ, 874, 183
- Shimura & Takahara (1995) Shimura, T., & Takahara, F. 1995, ApJ, 445, 780
- Steiner et al. (2010) Steiner, J. F., McClintock, J. E., Remillard, R. A., et al. 2010, ApJ, 718, L117
- Steiner et al. (2009) Steiner, J. F., Narayan, R., McClintock, J. E., & Ebisawa, K. 2009, PASP, 121, 1279
- Sugizaki et al. (2011) Sugizaki, M., Mihara, T., Serino, M., et al. 2011, PASJ, 63, S635
- Tanaka (1989) Tanaka, Y. 1989, in ESA Special Publication, Vol. 1, Two Topics in X-Ray Astronomy, Volume 1: X Ray Binaries. Volume 2: AGN and the X Ray Background, ed. J. Hunt & B. Battrick, 3
- Vahdat Motlagh et al. (2019) Vahdat Motlagh, A., Kalemci, E., & Maccarone, T. J. 2019, MNRAS, 485, 2744
- Wilms et al. (2000) Wilms, J., Allen, A., & McCray, R. 2000, ApJ, 542, 914
- Xu et al. (2018) Xu, Y., Hou, L.-G., & Wu, Y.-W. 2018, Research in Astronomy and Astrophysics, 18, 146
- Yatabe et al. (2019) Yatabe, F., Negoro, H., Nakajima, M., et al. 2019, The Astronomer’s Telegram, 12425, 1