H2 content of galaxies inside and around intermediate redshift clusters
Abstract
Dense environments have an impact on the star formation rate of galaxies. As stars form from molecular gas, looking at the cold molecular gas content of a galaxy gives useful insights on its efficiency in forming stars. However, most galaxies observed in CO (a proxy for the cold molecular gas content) at intermediate redshifts, are field galaxies. Only a handful of studies focused on cluster galaxies. I present new results on the environment of one medium mass cluster from the EDisCS survey at . 27 star-forming galaxies were selected to evenly sample the range of densities encountered inside and around the cluster. We cover a region extending as far as 8 virial radii from the cluster center. Indeed there is ample evidence that star formation quenching starts already beyond 3 cluster virial radii. I discuss our CO(3-2) ALMA observations, which unveil a large fraction of galaxies with low gas-to-stellar mass ratios.
keywords:
galaxies: evolution – galaxies: clusters: general – submillimeter: galaxies1 SEEDisCS
We initiated the first systematic study of galaxy properties along the large scale structures (LSS) feeding galaxy clusters, so called Spatially Extended EDisCS (SEEDisCS). It focuses on 2 clusters from the ESO Distant Cluster Survey (EDisCS, [White et al. (2005), White et al. 2005]): CL1301.71139 and CL1411.11148. They are located at redshifts and 0.5195 and have velocity dispersions of and 710 km/s, respectively. Deep and images were gathered with CFHT/MEGACAM and WIRCam. They cover a region that extends up to around 10 times the cluster virial radius, . This survey is divided into 3 main steps. The first one consists of the identification of the large scale structures around the clusters thanks to accurate photometric redshifts. The second is a spectroscopic follow-up of these large scale structures to study the properties of the galaxy stellar populations. The last step is made up of ALMA programs to study the cold molecular gas reservoir status of galaxies. Here, we focus on one cluster : CL1411.11148, since analysis is still underway for the other one.
2 ALMA Sample
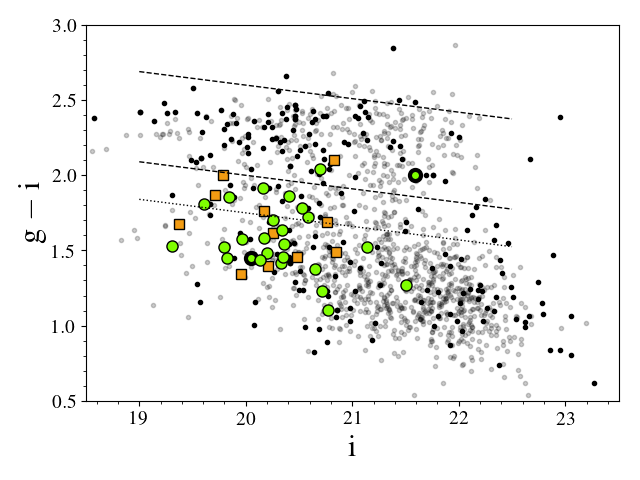
We selected 27 star-forming galaxies from the spectroscopic sample within of CL1411.11148 to be observed with ALMA. This is the largest sample of galaxies with direct cold gas measurements at intermediate redshift and the only one of galaxies in interconnected cosmic structures around a galaxy cluster. Those galaxies were selected to have similar colours as the PHIBSS2 field main-sequence star-forming galaxies sample ([Freundlich et al. (2019), Freundlich et al. 2019]) with redshift between and 0.6. Figure 1 shows the position of our targets in the vs diagram with respect to the other cluster galaxies and the PHIBSS2/COSMOS sample. Those 27 targets also sample the range of densities encountered inside and around the cluster. They were observed at 226 GHz to detect the COJ=3→2 transition. We benefited from 23h of observations during Cycle 3 and 5, and reported 27 detections.
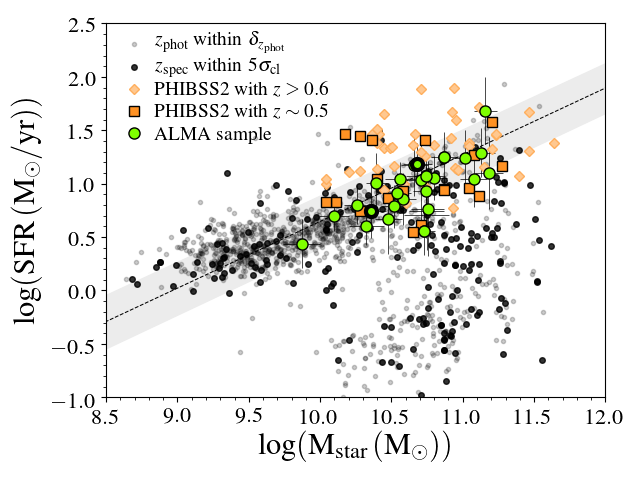
The star formation rates (SFR) and stellar masses (Mstar) were derived using MAGPHYS ([da Cunha et al. (2008), da Cunha et al. 2008]) for our targets and all the galaxies within the cluster redshift limits. Figure 2 shows the SFR-Mstar diagram with the position of our ALMA sample, circles, compared to the position of the PHIBSS2 sample, squares and diamonds. The limits in Mstar and SFR are similar for both samples, as expected from our colour-based selection. Hence, our galaxies are located on the main-sequence or slightly below. Our sample is also evenly sampling the main-sequence between .
From the ALMA observations, the CO luminosities were derived following the [Solomon & Vanden Bout(2005), Solomon & Vanden Bout (2005)] recipe. To derive the cold molecular gas masses, M, we used
| (1) |
where is the conversion factor from the third rotational transition of CO to the first ([Genzel et al. (2015), Genzel et al. 2015]; [Chapman et al. (2015), Chapman et al. 2015]; [Carleton et al. (2017), Carleton et al. 2017] and [Tacconi et al. (2018), Tacconi et al. 2018]), and is the CO(1-0) luminosity-to-molecular-gas-mass conversion factor, considering a 36% correction to account for interstellar helium ([Leroy et al. (2011), Leroy et al. 2011]; [Bolatto et al. (2013), Bolatto et al. 2013]; [Carleton et al. (2017), Carleton et al. 2017]).
3 Results
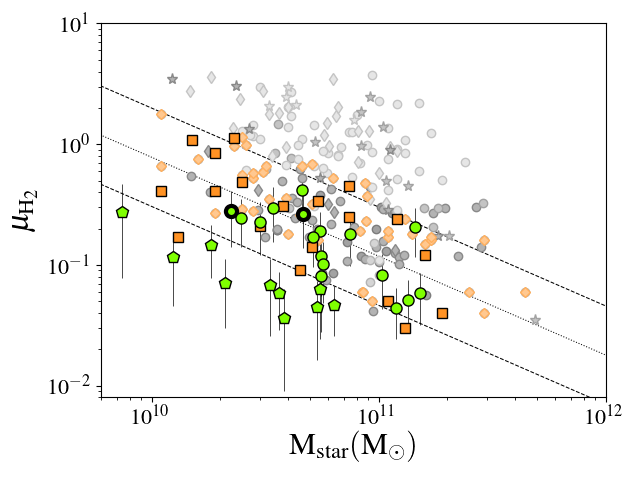
In order to compare our results to the literature and the PHIBSS2 sample, we used the cold molecular gas-to-stellar mass ratio: . Figure 3 shows the cold molecular gas-to-stellar mass ratio as a function of the stellar mass for our galaxies and comparison samples. One can see that while 67% of our targeted galaxies have comparable gas fractions as their field counterparts at the same redshift, 33% are populating a new area of low . They are represented by pentagons in Fig. 3. They fall below the dispersion of the relation between and Mstar, which was derived using the PHIBSS2 sample at . Their large number indicates they are not simply part of the tail of the distribution of the field galaxies but rather a new, different population, which implies a different relation between and Mstar, specifically in the mass range.
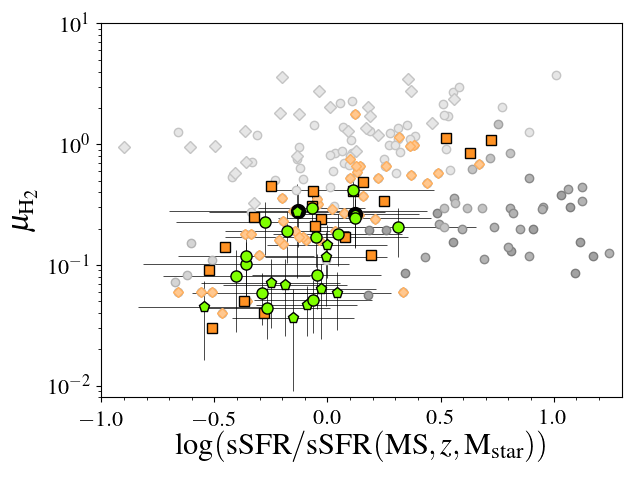
Figure 4 shows how the cold gas ratio scales with the specific SFR (sSFR), normalized to the one of the main-sequence, of galaxies at different redshifts. At , a trend can be noticed. Most of our targets follow it, but here again, some of them are populating a new area, which corresponds to galaxies lying within or very close to the main-sequence but depleted in cold molecular gas.
A question we can ask is whether the values chosen for the different factors used to derive M can have an influence on our .
: we chose to use the same coefficient as for the Milky-Way, whereas, in PHIBSS2, [Freundlich et al. (2019), Freundlich et al. (2019)] are using a coefficient based on the mass-metallicity relation derived by [Genzel et al. (2015), Genzel et al. (2015)]. If we were to use this recipe, we would have , which would lower our already low .
: We took the same value as Genzel et al. (2015). But [Dumke et al. (2001), Dumke et al. (2001)], by looking at local spirals, showed that could vary within a spiral galaxy. Indeed, it would be closer to 0.8 in the center of those galaxies, which would lower our ratios by 38%. This coefficient can be closer to 0.4 in the outer parts of the disk of spiral galaxies, which would lead to increase our ratios by 25%, but this is not enough to put our low back into the ”normal” sequence.
Moreover, those low gas fraction galaxies have narrower CO line widths compared to their PHIBSS2 counterparts. Therefore, the former potentially have more extended morphologies ( Mass/Radius) than the normal and field galaxies. This could be a signature of environmental effects at play in the interconnected structures surrounding the cluster.
4 Summary
We report the first large sample of galaxies with direct cold molecular gas measurements within the same cluster environment at intermediate redshift. Those 27 galaxies were selected to have the same colours as the PHIBSS2 galaxies. No prior selection on SFR was applied as it is usually the case for such surveys and larger. A large portion, 67%, of our targets have similar gas content as other field galaxies (PHIBSS2) at . The rest of them, 33%, have low cold gas to stellar mass ratio despite being main-sequence star-forming galaxies. The latter have lower CO line widths than their field counterparts, which is an indication of more extended morphologies. To summarize, we unveiled a new population of low gas content star-forming galaxies, using a different selection criterion, and located in the different environments encountered around a cluster.
References
- [Bolatto et al. (2013)] Bolatto, A. D., Wolfire, M., & Leroy, A. K. 2013, ARAA, 51, 207
- [Carleton et al. (2017)] Carleton, T., Cooper, M. C., Bolatto, A. D. et al. 2017, MNRAS, 467, 4886
- [Chapman et al. (2015)] Chapman, S. C., Bertoldi, F., Smail, I., et al. 2015, MNRAS Lett., 449, L68
- [da Cunha et al. (2008)] da Cunha, E., Charlot, S., & Elbaz, D. 2008, MNRAS, 388, 1595
- [De Lucia et al. (2007)] De Lucia, G., Poggianti, B. M., Aragòn-Salamanca, A., et al. 2007, MNRAS, 374, 809
- [Dumke et al. (2001)] Dumke, M., Nieten, C., Thuma, G. et al. 2001, A&A, 373, 853
- [Freundlich et al. (2019)] Freundlich, J., Combes, F., Tacconi, L. J., et al. 2019, A&A, 622, A105
- [Genzel et al. (2015)] Genzel, R., Tacconi, L. J., Lutz, D. et al. 2015, ApJ, 800, 20
- [Leroy et al. (2011)] Leroy, A. K., Bolatto, A., Gordon, K., et al. 2011, AJ, 136, 2782
- [Solomon & Vanden Bout(2005)] Solomon, P., & Vanden Bout, P. 2005, ARAA, 43, 677
- [Speagle et al. (2014)] Speagle, J. S., Steinhardt, C. L., Radford, S. J. E., & Silverman, J. D. 2014, ApJS, 214, 15
- [Tacconi et al. (2018)] Tacconi, L. J., Genzel, R., Saintonge, A., et al. 2018, ApJ, 853, 179
- [White et al. (2005)] White, S. D., Clowe, D. I., Simard, L., et al. 2005, A&A, 444, 365