Molecular modeling of aqueous electrolytes at interfaces: effects of long-range dispersion forces and of ionic charge rescaling
Abstract
Molecular dynamics simulations of aqueous electrolytes generally rely on empirical force fields, combining dispersion interactions – described by a truncated Lennard-Jones (LJ) potential – and electrostatic interactions – described by a Coulomb potential computed with a long-range solver. Recently, force fields using rescaled ionic charges (electronic continuum correction, ECC), possibly complemented with rescaling of LJ parameters (electronic continuum correction rescaled, ECCR), have shown promising results in bulk, but their performance at interfaces has been less explored. Here we started by exploring the impact of the LJ potential truncation on the surface tension of a sodium chloride aqueous solution. We show a discrepancy between the numerical predictions for truncated LJ interactions with a large cutoff and for untruncated LJ interactions computed with a long-range solver, which can bias comparison of force field predictions with experiments. Using a long-range solver for LJ interactions, we then show that an ionic charge rescaling factor chosen to correct long-range electrostatic interactions in bulk also describes accurately image charge repulsion at the liquid-vapor interface, and that the rescaling of LJ parameters in ECCR models – aimed at capturing local ion-ion and ion-water interactions in bulk – also describes well the formation of an ionic double layer at the liquid-vapor interface. Overall, these results suggest that the molecular modeling of aqueous electrolytes at interfaces would benefit from using long-range solvers for dispersion forces, and from using ECCR models, where the charge rescaling factor should be chosen to correct long-range electrostatic interactions.
I Introduction
Molecular dynamics (MD) is a very powerful tool to explore the structure and dynamics of aqueous electrolytes at the atomic scale. To simulate large systems over long times, empirical interaction potentials (force fields) are widely used. Liquid water is commonly described with rigid non-polarizable models Vega and Abascal (2011); Vega (2015), and some of them perform quite well. For instance, the SPC/E model Berendsen, Grigera, and Straatsma (1987) is rather good at reproducing the dielectric properties of water Rami Reddy and Berkowitz (1989); Bonthuis, Gekle, and Netz (2011); Schlaich, Knapp, and Netz (2016), and the TIP4P/2005 model Abascal and Vega (2005) reproduces accurately the structure and dynamics of water over a wide range of temperatures and pressures Vega, Abascal, and Nezbeda (2006); Pi et al. (2009); Rozmanov and Kusalik (2012); Russo and Tanaka (2014); Biddle et al. (2017); Guillaud et al. (2017); Montero de Hijes et al. (2018). However, non-polarizable models for ions in water are less successful at predicting the thermodynamics and dynamics of aqueous solutions Moučka, Nezbeda, and Smith (2013a, b); Nezbeda, Moučka, and Smith (2016). For instance, most non-polarizable models cannot reproduce even qualitatively the impact some salts have on water self-diffusion Kim et al. (2012); Ding, Hassanali, and Parrinello (2014), while explicit inclusion of polarizability and/or charge transfer can improve the predictions Yao, Kanai, and Berkowitz (2014); Yao, Berkowitz, and Kanai (2015); Nguyen and Rick (2018).
In that context, new non-polarizable models have been developed based on a rescaling of the ionic charges Leontyev et al. (2003); Leontyev and Stuchebrukhov (2009, 2011); Pegado et al. (2012); Kann and Skinner (2014); Kohagen, Mason, and Jungwirth (2014, 2016); Benavides et al. (2017); Kroutil, Předota, and Kabeláč (2017); Martinek et al. (2018); Bruce and van der Vegt (2018); Yue and Panagiotopoulos (2019); Zeron, Abascal, and Vega (2019); Jorge and Lue (2019), an approach often referred to as electronic continuum correction (ECC). Originally, the rescaling aims at implicitly describing electronic polarization, to improve the description of local ion-water and ion-ion interactions Leontyev and Stuchebrukhov (2011). But the rescaling can also compensate for the underestimated permittivity of water models Kann and Skinner (2014), and recover the correct long-range Coulombic interactions. Both motivations suggest different charge rescaling factors, i.e. (with the electronic permittivity of the solvent) for the local argument Leontyev and Stuchebrukhov (2011), and (with the permittivity of the water model and the experimental value) for the long-range argument Kann and Skinner (2014). In practice, various rescaling factors have been chosen Leontyev et al. (2003); Leontyev and Stuchebrukhov (2009, 2011); Pegado et al. (2012); Kann and Skinner (2014); Kohagen, Mason, and Jungwirth (2014, 2016); Benavides et al. (2017); Kroutil, Předota, and Kabeláč (2017); Martinek et al. (2018); Bruce and van der Vegt (2018); Yue and Panagiotopoulos (2019); Zeron, Abascal, and Vega (2019); Jorge and Lue (2019), based on the expressions above or simply tuned to optimize the performance of the model. Bare ECC, or ECC complemented with rescaling of the Lennard-Jones (LJ) parameters Kohagen, Mason, and Jungwirth (2014); Kroutil, Předota, and Kabeláč (2017) – referred to as ECCR for ’electronic continuum correction rescaled’, indeed provide improved predictions for the structure, dielectric permittivity and dynamics of bulk aqueous solutions Kann and Skinner (2014); Renou et al. (2014); Kohagen, Mason, and Jungwirth (2014, 2016); Benavides et al. (2017); Bruce and van der Vegt (2018); Zeron, Abascal, and Vega (2019); Yue and Panagiotopoulos (2019); Laage and Stirnemann (2019).
However, ECC models have been less studied at interfaces Vazdar et al. (2012); Neyt et al. (2014); Biriukov, Kroutil, and Předota (2018). At the water-air interface, the ECC increases the surface affinity of ions and can create an ionic double layer Vazdar et al. (2012); Neyt et al. (2014), in line with the predictions of polarizable force fields Vrbka et al. (2004); D’Auria and Tobias (2009); Neyt et al. (2013). Yet the bare ECC overestimates the anionic surface affinity, an effect attributed to the abrupt change in the electronic part of the relative permittivity across the interface Vazdar et al. (2012). Moreover, the experimentally observed linear increase of surface tension with respect to ionic concentration is not always recovered Neyt et al. (2014). ECC models can also be applied to liquid-solid interfaces, by rescaling the surface charges consistently with those of the electrolyte Biriukov, Kroutil, and Předota (2018).
A crucial test of the force field performance at interfaces is to compare its prediction for the surface tension with experimental results Paul and Chandra (2003); dos Santos, Muller-Plathe, and Weiss (2008); Alejandre and Chapela (2010a); Isele-Holder, Mitchell, and Ismail (2012); Netz and Horinek (2012); Vazdar et al. (2012); Neyt et al. (2014); Ghoufi, Malfreyt, and Tildesley (2016); Benavides et al. (2017); Obeidat and Badarneh (2019); Ghoufi and Malfreyt (2019). With that regard, previous work has shown that the standard truncation of the Lennard-Jones (LJ) interaction potential can lead to large quantitative differences in the surface tension Sega and Dellago (2017), or even to qualitatively different behaviors of liquids at interfaces Trokhymchuk and Alejandre (1999); Valeriani, Wang, and Frenkel (2007); Caupin, Sasaki, and Balibar (2008); Alejandre and Chapela (2010b); Evans, Stewart, and Wilding (2016); Fitzner et al. (2017). Analytical tail corrections are commonly used for the surface tension Ghoufi, Malfreyt, and Tildesley (2016), but their implementation can be complex – especially for electrolyte solutions, and there is no guarantee that the structure and dynamics of the interface are correctly predicted by truncated potentials. Alternatively, methods commonly used to compute untruncated Coulomb interactions by calculating the long-range part of the interaction in the Fourier space Deserno and Holm (1998) can also be applied to LJ interactions Isele-Holder, Mitchell, and Ismail (2012); Isele-Holder et al. (2013). In particular, these approaches successfully predict liquid-vapor surface tension, without requiring a posteriori corrections Isele-Holder, Mitchell, and Ismail (2012); Isele-Holder et al. (2013).
In that context, here we will investigate sequentially two important issues for the description of aqueous electrolytes at the liquid-vapor interface, focusing on sodium chloride. First, we will explore the impact of LJ potential truncation on the liquid-vapor surface tension, and show the interest of using a long-range solver for LJ interactions. We will then use such a solver to explore the impact of charge rescaling, and identify the best choices to describe accurately the interfacial structure and surface tension of aqueous electrolytes.
II Systems and methods
We will use the ECCR model by Benavides et al. (2017), referred to as the Madrid model from the authors group’s location. This model is based on TIP4P/2005 water; the charge rescaling factor of is closer to the value suggested by the long-range argument () than by the local argument ().
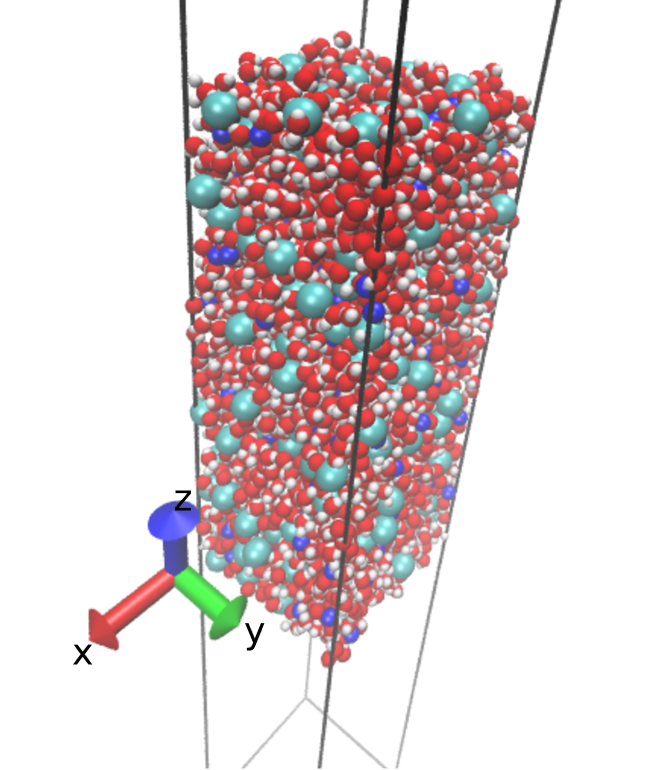
We simulated a liquid film (along the plane) illustrated in Fig. 1, composed of 3500 water molecules. The initial systems were built by using MOLTEMPLATE Jewett, Zhuang, and Shea (2013), and we used LAMMPS Plimpton (1995) to run the simulations. The tested NaCl concentrations were 0.1, 0.8, 1.6, 3.2 and 4.2 mol/L. The total box size was Å3, and the extension of the liquid phase in the direction was about Å. Periodic boundary conditions were used along the 3 directions. The vacuum gap in the -direction was large enough to effectively remove interactions between the system and its periodic images in the direction. These simulation box values have been widely used in the literature and have been shown to be sufficient to prevent finite size effects Alejandre and Chapela (2010b); Vega and de Miguel (2007). We also tested finite size effects, as detailed in the supplemental material (SM). We integrated the equations of motion using the velocity-Verlet algorithm, with a time step of 2 fs. Long-range Coulombic interactions were treated with the particle-particle–particle-mesh (PPPM) method, a point-grid based Ewald method. Water molecules were held rigid using the SHAKE algorithm.
The system was equilibrated during ca. 3 ns, and the production run lasted for 100 ns. We calculated the surface tension from the difference of normal and tangential pressure, as detailed in the SM:
| (1) |
where is the average pressure along direction , and is the total box size along the direction normal to the two interfaces. Experimentally, the surface tension increases linearly with respect to the ionic bulk concentration; the surface tension gain between 0.1 mol/L and 4.2 mol/L is around 7 mN/m for NaCl at room temperature Washburn and West (1928); Allen et al. (2009).
III Effect of long-range dispersion interactions
As discussed in the introduction, the standard procedure of truncating LJ interactions at a distance of ca. 1 nm, and possibly applying analytical tail corrections, has been challenged recently for heterogeneous systems Sega and Dellago (2017); Trokhymchuk and Alejandre (1999); Valeriani, Wang, and Frenkel (2007); Alejandre and Chapela (2010b); Fitzner et al. (2017). Therefore, we have tested here the impact of the truncation procedure. First, we have computed the surface tension of pure SPC/E and TIP4P/2005 water using various cutoffs (note that we used a simple cutoff scheme without any smoothing) and an Ewald based method – PPPM, presented in Refs. 48; 61 – to treat the LJ interaction. As detailed in the SM, for truncated LJ interactions, the surface tension seems to converge at high cutoff value. For pure water, the interfacial density profile is well approximated by an hyperbolic tangent shape, for which analytical tail corrections can be derived Chapela et al. (1977); Blokhuis et al. (1995), providing satisfying results since the corrected surface tension reaches a plateau. For both SPC/E and TIP4P/2005 water, using the PPPM method fixes the LJ cutoff dependence. Moreover, for the pure water system, results obtained using PPPM and using cutoffs with tail corrections matched quantitatively. Still, the surface tensions obtained with the PPPM method are ca. 2 mN/m larger than the ones obtained using the largest cutoff (17 Å) without tail correction. This highlights the fact that the long range part of the LJ potential – naturally taken into account through the PPPM method – has a significant impact and even a large cutoff misses some relevant interaction for this heterogeneous system.
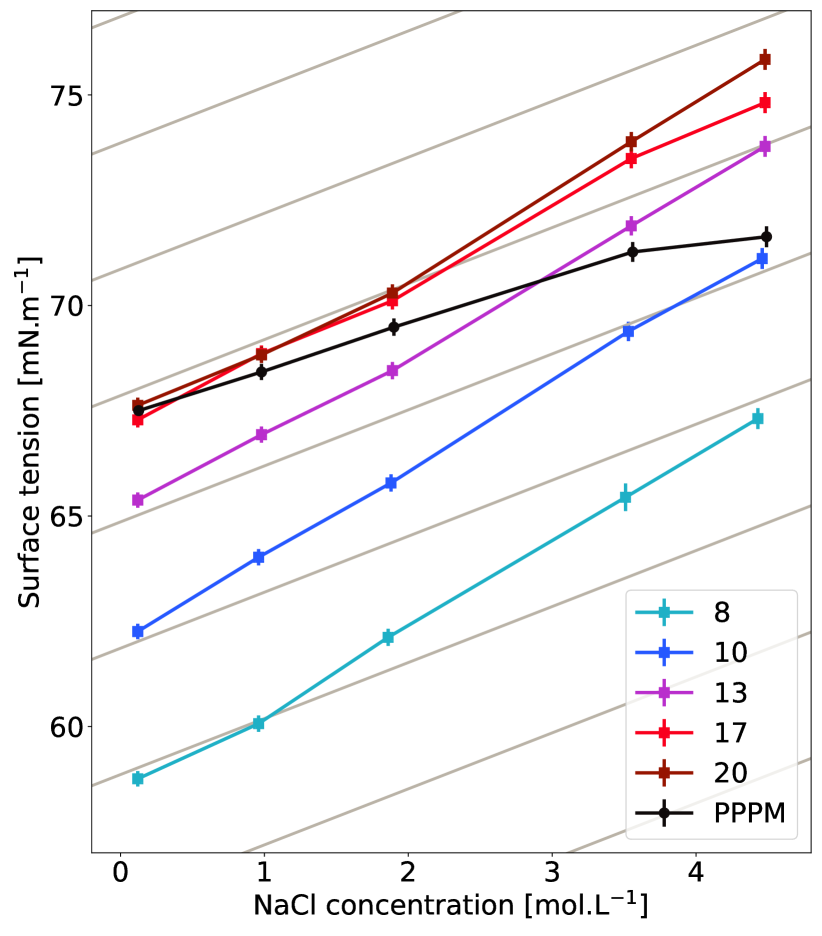
We then tested the effect of the long-range part of dispersion interactions in the presence of salt, by comparing the results obtained with the cutoff and the PPPM methods, using the Madrid model of NaCl in water. Note that for an aqueous electrolyte solution, no simple tail correction can be written due to the complex ion distribution at the interface, so that here we only considered the raw simulation results. At low salt concentration, the surface tension obtained with the cutoff method is smaller than the one using the PPPM method, see Fig. 2. This is consistent with the results obtained for pure water, see Fig. 1 of the SM. As shown by the force field developers Benavides et al. (2017), the surface tension increases smoothly with the salt concentration, in contrast with previous results obtained with another ECC model Neyt et al. (2014). Surprisingly, when the salt concentration increases, the increase in surface tension is higher with the cutoff method than with the PPPM method, see Fig. 2. Importantly, this effect could bias comparisons of the surface tension dependency on salt concentration with experiments, which are commonly used as a test of the quality of aqueous electrolyte force fields. Here for instance, cutoff simulations predict higher increases of the surface tension with respect to experiments while PPPM predicts lower one, so that the model could be validated or not depending on how long-range LJ interactions are treated. The PPPM method has the advantage to be consistent for any system and does not require any post-processing treatment. Therefore, this approach will be used in the following.
IV Effect of charge rescaling
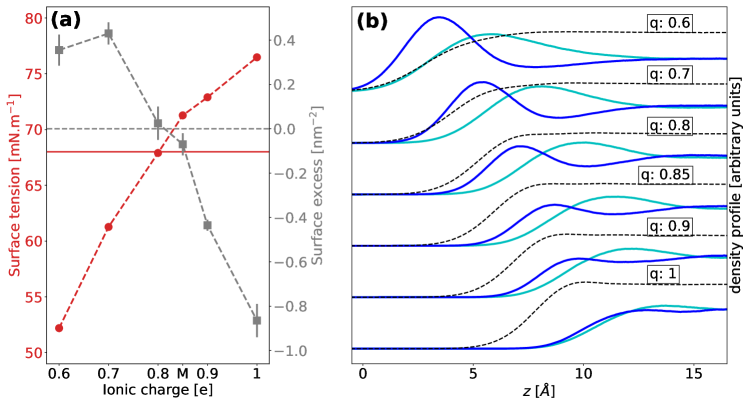
A good starting point to explore the effect of charge rescaling at an interface is to fix the LJ parameters (here we are using those of the Madrid model), and modify only the charges at a given concentration, 3.2 mol/L. The resulting surface tensions, surface excess (SE) and density profiles are shown in Fig. 3, which highlights the dramatic impact of ionic charge. For a charge, Cl- and Na+ are identically depleted from the interface and fully solvated, see bottom part of Figure 3b. These observations are consistent with other non-polarisable MD simulations using fully charged ions Bhatt et al. (2004); Huang et al. (2008). When the charge is decreased, the ions increasingly adsorb at the interface, with adsorption peaks growing and moving toward the surface. The ions also organize in a ’double layer’, where the Cl- adsorption peak is closer to the surface than the Na+ peak. This ionic double layer is an expected feature of the NaCl water-air system, which is retrieved using QMMM simulations Jungwirth and Tobias (2001) or polarizable classical MD Vrbka et al. (2004); D’Auria and Tobias (2009); Neyt et al. (2013).
In order to quantify this structural behavior, we have computed the surface excess (SE), denoted , for the different charge rescaling (see the SM for more details), which is plotted in Fig. 3a. The SE is related to the evolution of the surface tension with respect to the solute activity through Gibbs’ thermodynamic theory of interfaces:
| (2) |
with the gas constant and the temperature. For NaCl, increases with the salt concentration, so that is negative, with an experimental value on the order of nm-2, see Ref. 43.
Classical polarizable models D’Auria and Tobias (2009); Vazdar et al. (2012); Ishiyama and Morita (2007) provide correct SE values, while standard non-polarizable ones predict too negative values D’Auria and Tobias (2009). In Ref. 39, an ECC approach with a ionic charge (chosen based on short range arguments), predicts a positive SE of 0.06 nm-2 for a concentration of ca. 0.8 mol/L, and thus a negative surface tension gain with respect to ionic concentration. Our results are fully consistent with the previous ones: for a ionic charge of 0.6-0.8, the SE is positive and the surface tension gain is negative, while for a charge the SE is very negative and leads to the highest surface tension gain.
The original Madrid force field, with a ionic charge of , predicts values very close to the experimental ones. Of course one can attribute this success to the additional work done for the VdW parametrization since the Madrid model belongs to the ECCR class. As pointed out in Ref. 41, rescaling the VdW parameters helps obtaining better results also at interfaces. But, for these kind of systems, we would like to argue that the rescaling factor should be chosen based on the long-range argument (i.e., correcting long-range Coulomb interactions), as is the case for the Madrid model, and not on the short-range one. To that aim, we will use a simple mean field model inspired by Ref. 70. Ionic density profiles at the liquid-vapor interface follow a Boltzmann distribution: , where is the bulk ionic density, , and the potential felt by the ion. This potential can be decomposed as follows: , where is the electrostatic potential, represents the interaction with the solvent, and is an image charge potential acting on ions near the dielectric interface located at , as described by Onsager-Samaras theory Onsager and Samaras (1934):
| (3) |
with the vacuum permittivity, the solvant relative permittivity, the ionic charge, and the Debye length. Here it is important to note that the solvant relative permittivity involved is the bulk value far from the interface. This potential identically pushes both cations and anions inside water. From Eq. (3), it is clear that choosing the rescaled ionic charge to correct for the permittivity of the water model in bulk, i.e., , will also adequately correct the image potential. Indeed, because water (and water models) have a very large , the error induced by the water model in the prefactor – not corrected by the rescaling procedure – is minimal. For instance, for TIP4P/2005 water at room temperature, while , corresponding to an error in the prefactor of around 1 % only. This explains why a rescaling of for the TIP4P/2005 water model provides a structure – and in particular a SE – close to the expected one at the interface, while this rescaling has been originally designed for bulk systems. In contrast, when no rescaling is appplied, the image potential is too strong, which lead to very negative SE, and with a rescaling of , the image potential is too weak, letting the ions go too far toward the vapor side – leading to too positive SE.
Beyond the image potential, the detailed ion distribution will be controlled by the other terms in the potential felt by the ions, . With that regard, our simulations show that using an ECCR approach, as done for the Madrid FF, captures correctly the distribution predicted by polarized FFs – and in particular the formation of a double layer. To understand this result, one should note that in practice, charges and LJ interaction parameters in ECCR models are tuned empirically to accurately describe the local environment of ions, i.e. first neighbor ion-ion and ion-water interactions. While the parametrization is performed in bulk, one can expect that the first neighbor interactions should also be fairly described at interfaces, even though the ion hydration shells are different.
V Conclusions
We have shown that similar surface tensions are found using the cutoff and the PPPM method for pure water and dilute salts – reaching quantitative agreement when adding tail corrections. In contrast, at high salt concentration, where no simple tail correction can be written due to the complex ion distribution at the interface, the cutoff method leads to a larger surface tension increase than the one obtained using the PPPM method. Hence, we recommend to give a special attention to this aspect for heterogeneous systems, because it may lead to a qualitative difference in the interfacial structure, which cannot be corrected by any post-simulation routine, and because it may bias comparison of force field predictions with experiments. Currently, many MD softwares provide a long-range implementation of dispersion interactions, which does not involve a large computational cost or can even speed up the calculation Isele-Holder et al. (2013). Therefore, we suggest here to use an Ewald based method for the long-range dispersion term when dealing with electrolyte solutions at liquid-gas interfaces.
Using such a long-range solver, we reconsidered the impact of the ionic charge rescaling procedure implemented in recent non-polarizable force fields of aqueous electrolytes on surface tension and liquid-vapor interfacial structure. With an ECCR force field, we obtained a linear gain of surface tension with respect to ionic concentration, close to the experimental value. We then showed that the charge rescaling factor has a dramatic impact on the local structure in this saline water interfacial system. In particular, we found that a charge rescaling based on short-range arguments () lead to a positive surface excess while a negative value is expected. We explained that the long-range-motivated charge rescaling factor () should be preferred for heterogenous systems since this correction apply also to the image charge potential acting on the ions at interfaces with a dielectric contrast. Finally, we showed that the rescaling of LJ parameters in the ECCR approach, while originally tuned to capture local first neighbor ion-water and ion-ion interactions in bulk, also fairly predicted the formation of an ionic double layer, consistently with polarizable force field results.
We hope that more ECCR models with a charge rescaling factor based on the long-range argument will be established: even if extra work is needed regarding the Van der Waals parameters, significant gains for both homogenous and heterogenous systems can be expected compared to usual non-polarizable force field, and at a computational cost lower than the one of polarizable force fields. With that regard, it would be quite interesting to explore in future work how the results obtained here for a NaCl solution would extend to other salts Zeron, Abascal, and Vega (2019), in order to assess further the importance of long-range LJ interactions and the applicability of ECCR models to interfaces.
Supplemental material
See the supplemental material for details on: computation of the surface tension of pure water with truncated and untruncated Lennard-Jones interactions; box size convergence; surface tension calculation; surface dividing altitude and surface excess measurement.
Data Availability Statement
The data that support the findings of this study are available from the corresponding author upon reasonable request.
Acknowledgements.
LJ acknowledges interesting exchanges with the Madrid group about their model, and fruitful discussions with E. Guillaud and A. Ghoufi. This work is supported by the ANR, project ANR-16-CE06-0004-01 NECtAR. LJ is supported by the Institut Universitaire de France. This work used the HPC resources from the PSMN mesocenter in Lyon.References
- Vega and Abascal (2011) C. Vega and J. L. F. Abascal, Physical Chemistry Chemical Physics 13, 19663 (2011).
- Vega (2015) C. Vega, Molecular Physics 113, 1145 (2015).
- Berendsen, Grigera, and Straatsma (1987) H. Berendsen, J. Grigera, and T. Straatsma, Journal of Physical Chemistry 91, 6269 (1987).
- Rami Reddy and Berkowitz (1989) M. Rami Reddy and M. Berkowitz, Chemical Physics Letters 155, 173 (1989).
- Bonthuis, Gekle, and Netz (2011) D. Bonthuis, S. Gekle, and R. Netz, Physical Review Letters 107, 1 (2011).
- Schlaich, Knapp, and Netz (2016) A. Schlaich, E. W. Knapp, and R. R. Netz, Physical Review Letters 117, 1 (2016).
- Abascal and Vega (2005) J. L. Abascal and C. Vega, The Journal of chemical physics 123, 234505 (2005).
- Vega, Abascal, and Nezbeda (2006) C. Vega, J. L. F. Abascal, and I. Nezbeda, The Journal of Chemical Physics 125, 034503 (2006).
- Pi et al. (2009) H. L. Pi, J. L. Aragones, C. Vega, E. G. Noya, J. L. Abascal, M. A. Gonzalez, and C. McBride, Molecular Physics 107, 365 (2009).
- Rozmanov and Kusalik (2012) D. Rozmanov and P. G. Kusalik, The Journal of Chemical Physics 136, 044507 (2012).
- Russo and Tanaka (2014) J. Russo and H. Tanaka, Nature Communications 5, 3556 (2014).
- Biddle et al. (2017) J. W. Biddle, R. S. Singh, E. M. Sparano, F. Ricci, M. A. González, C. Valeriani, J. L. F. Abascal, P. G. Debenedetti, M. A. Anisimov, and F. Caupin, The Journal of Chemical Physics 146, 034502 (2017).
- Guillaud et al. (2017) E. Guillaud, S. Merabia, D. de Ligny, and L. Joly, Physical Chemistry Chemical Physics 19, 2124 (2017).
- Montero de Hijes et al. (2018) P. Montero de Hijes, E. Sanz, L. Joly, C. Valeriani, and F. Caupin, The Journal of Chemical Physics 149, 094503 (2018).
- Moučka, Nezbeda, and Smith (2013a) F. Moučka, I. Nezbeda, and W. R. Smith, The Journal of Chemical Physics 138, 154102 (2013a).
- Moučka, Nezbeda, and Smith (2013b) F. Moučka, I. Nezbeda, and W. R. Smith, Journal of Chemical Theory and Computation 9, 5076 (2013b).
- Nezbeda, Moučka, and Smith (2016) I. Nezbeda, F. Moučka, and W. R. Smith, Molecular Physics 114, 1665 (2016).
- Kim et al. (2012) J. S. Kim, Z. Wu, A. R. Morrow, A. Yethiraj, and A. Yethiraj, The Journal of Physical Chemistry B 116, 12007 (2012).
- Ding, Hassanali, and Parrinello (2014) Y. Ding, A. a. Hassanali, and M. Parrinello, Proceedings of the National Academy of Sciences of the United States of America 111, 3310 (2014).
- Yao, Kanai, and Berkowitz (2014) Y. Yao, Y. Kanai, and M. L. Berkowitz, The Journal of Physical Chemistry Letters 5, 2711 (2014).
- Yao, Berkowitz, and Kanai (2015) Y. Yao, M. L. Berkowitz, and Y. Kanai, The Journal of Chemical Physics 143, 241101 (2015).
- Nguyen and Rick (2018) M. Nguyen and S. W. Rick, Journal of Chemical Physics 148 (2018).
- Leontyev et al. (2003) I. V. Leontyev, M. V. Vener, I. V. Rostov, M. V. Basilevsky, and M. D. Newton, The Journal of Chemical Physics 119, 8024 (2003).
- Leontyev and Stuchebrukhov (2009) I. V. Leontyev and A. A. Stuchebrukhov, The Journal of Chemical Physics 130, 085102 (2009).
- Leontyev and Stuchebrukhov (2011) I. Leontyev and A. Stuchebrukhov, Physical Chemistry Chemical Physics 13, 2613 (2011).
- Pegado et al. (2012) L. Pegado, O. Marsalek, P. Jungwirth, and E. Wernersson, Physical Chemistry Chemical Physics 14, 10248 (2012).
- Kann and Skinner (2014) Z. R. Kann and J. L. Skinner, The Journal of Chemical Physics 141, 104507 (2014).
- Kohagen, Mason, and Jungwirth (2014) M. Kohagen, P. E. Mason, and P. Jungwirth, The Journal of Physical Chemistry B 118, 7902 (2014).
- Kohagen, Mason, and Jungwirth (2016) M. Kohagen, P. E. Mason, and P. Jungwirth, The Journal of Physical Chemistry B 120, 1454 (2016).
- Benavides et al. (2017) A. L. Benavides, M. A. Portillo, V. C. Chamorro, J. R. Espinosa, J. L. F. Abascal, and C. Vega, The Journal of Chemical Physics 147, 104501 (2017).
- Kroutil, Předota, and Kabeláč (2017) O. Kroutil, M. Předota, and M. Kabeláč, Journal of Molecular Modeling 23, 327 (2017).
- Martinek et al. (2018) T. Martinek, E. Duboué-Dijon, A. Timr, P. E. Mason, K. Baxová, H. E. Fischer, B. Schmidt, E. Pluhařová, and P. Jungwirth, The Journal of Chemical Physics 148, 222813 (2018).
- Bruce and van der Vegt (2018) E. E. Bruce and N. F. A. van der Vegt, The Journal of Chemical Physics 148, 222816 (2018).
- Yue and Panagiotopoulos (2019) S. Yue and A. Z. Panagiotopoulos, Molecular Physics 117, 3538 (2019).
- Zeron, Abascal, and Vega (2019) I. M. Zeron, J. L. F. Abascal, and C. Vega, The Journal of Chemical Physics 151, 134504 (2019).
- Jorge and Lue (2019) M. Jorge and L. Lue, The Journal of Chemical Physics 150, 084108 (2019).
- Renou et al. (2014) R. Renou, M. Ding, H. Zhu, A. Szymczyk, P. Malfreyt, and A. Ghoufi, The Journal of Physical Chemistry B 118, 3931 (2014).
- Laage and Stirnemann (2019) D. Laage and G. Stirnemann, The Journal of Physical Chemistry B 123, 3312 (2019).
- Vazdar et al. (2012) M. Vazdar, E. Pluhařová, P. E. Mason, R. Vácha, and P. Jungwirth, Journal of Physical Chemistry Letters 3, 2087 (2012).
- Neyt et al. (2014) J. C. Neyt, A. Wender, V. Lachet, A. Szymczyk, A. Ghoufi, and P. Malfreyt, Chemical Physics Letters 595-596, 209 (2014).
- Biriukov, Kroutil, and Předota (2018) D. Biriukov, O. Kroutil, and M. Předota, Physical Chemistry Chemical Physics 20, 23954 (2018).
- Vrbka et al. (2004) L. Vrbka, M. Mucha, B. Minofar, P. Jungwirth, E. C. Brown, and D. J. Tobias, Current opinion in colloid & interface science 9, 67 (2004).
- D’Auria and Tobias (2009) R. D’Auria and D. J. Tobias, Journal of Physical Chemistry A 113, 7286 (2009).
- Neyt et al. (2013) J. C. Neyt, A. Wender, V. Lachet, A. Ghoufi, and P. Malfreyt, Physical Chemistry Chemical Physics 15, 11679 (2013).
- Paul and Chandra (2003) S. Paul and A. Chandra, Chemical physics letters 373, 87 (2003).
- dos Santos, Muller-Plathe, and Weiss (2008) D. J. dos Santos, F. Muller-Plathe, and V. C. Weiss, The Journal of Physical Chemistry C 112, 19431 (2008).
- Alejandre and Chapela (2010a) J. Alejandre and G. A. Chapela, The Journal of chemical physics 132, 014701 (2010a).
- Isele-Holder, Mitchell, and Ismail (2012) R. E. Isele-Holder, W. Mitchell, and A. E. Ismail, The Journal of chemical physics 137, 174107 (2012).
- Netz and Horinek (2012) R. R. Netz and D. Horinek, Annual Review of Physical Chemistry 63, 401 (2012).
- Ghoufi, Malfreyt, and Tildesley (2016) A. Ghoufi, P. Malfreyt, and D. J. Tildesley, Chemical Society Reviews 45, 1387 (2016).
- Obeidat and Badarneh (2019) A. Obeidat and M. Badarneh, Journal of Molecular Liquids 287, 110952 (2019).
- Ghoufi and Malfreyt (2019) A. Ghoufi and P. Malfreyt, Molecular Simulation 45, 295 (2019).
- Sega and Dellago (2017) M. Sega and C. Dellago, The Journal of Physical Chemistry B 121, 3798 (2017).
- Trokhymchuk and Alejandre (1999) A. Trokhymchuk and J. Alejandre, The Journal of Chemical Physics 111, 8510 (1999).
- Valeriani, Wang, and Frenkel (2007) C. Valeriani, Z.-J. Wang, and D. Frenkel, Molecular Simulation 33, 1023 (2007).
- Caupin, Sasaki, and Balibar (2008) F. Caupin, S. Sasaki, and S. Balibar, Journal of Physics: Condensed Matter 20, 494228 (2008).
- Alejandre and Chapela (2010b) J. Alejandre and G. A. Chapela, The Journal of Chemical Physics 132, 014701 (2010b).
- Evans, Stewart, and Wilding (2016) R. Evans, M. C. Stewart, and N. B. Wilding, Physical Review Letters 117, 176102 (2016).
- Fitzner et al. (2017) M. Fitzner, L. Joly, M. Ma, G. C. Sosso, A. Zen, and A. Michaelides, The Journal of Chemical Physics 147, 121102 (2017).
- Deserno and Holm (1998) M. Deserno and C. Holm, The Journal of chemical physics 109, 7678 (1998).
- Isele-Holder et al. (2013) R. E. Isele-Holder, W. Mitchell, J. R. Hammond, A. Kohlmeyer, and A. E. Ismail, Journal of chemical theory and computation 9, 5412 (2013).
- Jewett, Zhuang, and Shea (2013) A. I. Jewett, Z. Zhuang, and J.-E. Shea, Biophysical Journal 104, 169a (2013).
- Plimpton (1995) S. Plimpton, Journal of Computational Physics 117, 1 (1995).
- Vega and de Miguel (2007) C. Vega and E. de Miguel, The Journal of Chemical Physics 126, 154707 (2007).
- Washburn and West (1928) E. W. Washburn and C. J. West, International critical tables of numerical data, physics, chemistry and technology, Vol. 4 (National Academies, 1928).
- Allen et al. (2009) H. C. Allen, N. N. Casillas-Ituarte, M. R. Sierra-Hernandez, X. Chen, and C. Y. Tang, Physical Chemistry Chemical Physics 11, 5538 (2009).
- Chapela et al. (1977) G. A. Chapela, G. Saville, S. M. Thompson, and J. S. Rowlinson, J. Chem. Soc., Faraday Trans. 2 73, 1133 (1977).
- Blokhuis et al. (1995) E. Blokhuis, D. Bedeaux, C. Holcomb, and J. Zollweg, Molecular Physics 85, 665 (1995).
- Bhatt et al. (2004) D. Bhatt, R. Chee, J. Newman, and C. Radke, Current Opinion in Colloid & Interface Science 9, 145 (2004).
- Huang et al. (2008) D. M. Huang, C. Cottin-Bizonne, C. Ybert, and L. Bocquet, Langmuir 24, 1442 (2008).
- Jungwirth and Tobias (2001) P. Jungwirth and D. J. Tobias, The Journal of Physical Chemistry B 105, 10468 (2001).
- Ishiyama and Morita (2007) T. Ishiyama and A. Morita, The Journal of Physical Chemistry C 111, 721 (2007).
- Onsager and Samaras (1934) L. Onsager and N. N. Samaras, The Journal of chemical physics 2, 528 (1934).