Theodore Tsesmelis, OSRAM Licht AG Innovation & Innoventures, Vision Lab, Parkring 33, 85748 Garching, DE.
An integrated light management system with real-time light measurement and human perception
Abstract
Illumination is important for well-being, productivity and safety across several environments, including offices, retail shops and industrial warehouses. Current techniques for setting up lighting require extensive and expert support and need to be repeated if the scene changes. Here we propose the first fully-automated light management system (LMS) which measures lighting in real-time, leveraging an RGBD sensor and a radiosity-based light propagation model. Thanks to the integration of light distribution and perception curves into the radiosity, we outperform a commercial software (Relux) on a newly introduced dataset. Furthermore, our proposed LMS is the first to estimate both the presence and the attention of the people in the environment, as well as their light perception. Our new LMS adapts therefore lighting to the scene and human activity and it is capable of saving up to 66%, as we experimentally quantify, without compromising the lighting quality.
keywords:
Machine vision, light modeling, radiosity, illumination map, light management system, human-centric lighting1 Introduction
Light is indispensable in our perception of the world and it affects our emotional and physiological responses Partonen and Lönnqvist (2000); Küller and Wetterberg (1993). Well-lit workplaces provide visual comfort and improve productivity Kralikova et al. (2016); Boyce (2004). However, lighting may reach 15% of the overall building electricity consumption, with peaks above 25% Kralikova et al. (2015). To save energy, a light management system (LMS) would need to measure lighting and to reason on the human perception of it in real-time, e.g. to dim down lighting where none sees it.
Current LMSs cannot automatically obtain dense measures of the spatial illumination in real-time. The former task is either accomplished manually with luxmeters (point-to-point measurements) or via offline CAD-based simulations. These require an operator to visit the scene and perform the measurements, or a detailed CAD model of the 3D scene, respectively. Both approaches need to be repeated upon any scene change and are impractical in the flexible open-plan spaces of modern offices, designed to adapt to the daily work plan.
Modern LMSs cannot either estimate the human perception of light. Current implementations rely on daylight harvesting and occupancy sensing. The first adjusts the luminaires to maximize the use of daylight, when available Kaminska and Ożadowicz (2018). The second leverages thermal- or radar-based motion detectors Guo et al. (2010) to switch on/off all luminaires in the room when people enter/leave, no matter the size of the (open-plan) office De Bakker et al. (2017).
Here we introduce a new LMS which estimates both the scene lighting and the human perception of it, to optimize lighting and its quality while saving energy. Light estimation leverages an RGBD camera and a radiosity model for light propagation, and distinguishes the scene 3D structure, the object reflectance and light positions. For human light perception, we locate people in the environment, estimate their visual frustum of attention (VFOA) and the incident light onto their VFOA, depending on their position and gaze. We also introduce a new labelled dataset, featuring a number of lit rooms, with and without human activity. We provide RGBD images and 3D meshes, labelled with material reflectance properties; luminaire positions, characteristics and dimming level; person locations and VFOA. Light intensity and human perception are ground-truthed by luxmeters, placed in the scene or worn by people respectively.
Finally, we introduce a new end-to-end system architecture and implement the autonomous system that we call the “invisible light switch” (ILS). ILS encompasses an RGBD camera, a processor, a light controller, a communication bus and the luminaires. Since ILS estimates how much light each person receives, it may switch off or dim those luminaires which are not visible, e.g. on the other side of large open spaces or behind cubicle panels. This removes the need for manual switches and provides a boost in energy efficiency, saving up to 66% without compromising the light quality.
Our main contributions are: i. we propose a real-time light estimation from an RGBD sensor as well as its perception by the scene occupants; ii. we collect a new benchmark for quantitative evaluation; iii. we propose an end-to-end autonomous LMS, to control lighting and save energy. This manuscript brings together two previous conference publications on the topics of light estimation and control Tsesmelis et al. (2019a, b), and extends the work with a) novel dataset and annotations, b) more experiments, and c) the definition and implementation of the overall end-to-end system architecture.
We present the system and modelling in Section 3; We discuss the dataset and experiments in Section 4; Finally, Section 5 concludes the manuscript. Next we review related work.
2 Related Work
Light measurement and management encompass different fields in science and engineering, which we review here.
Light Measurement
According to Cuttle et al. Cuttle (2010) the current status of lighting profession and lighting evaluation is on luminance based light assessing procedures, i.e. estimating the light arriving at the eyes of a virtual observer. However, in most previous work light measurement and modelling refer mainly to research in image and visual computing. As we review in Tsesmelis et al. (2019b), previous research regarded image spatio-temporal and pixel-like approaches Cai (2016); Hiscocks and Eng (2014), and the creation of photorealistic renderings Marschner and Shirley (2015), not the actual spatial lighting measurement. By contrast, commercial light modelling software, e.g. Relux, DIALux, AGi32, focuses on measuring light. They mainly target offline measurements and the evaluation of lighting solutions in a simulated environment. We build our work on Tsesmelis et al. (2019b), adopting computer vision techniques to measure lighting in real-time by means of a camera.
Light Management Systems (LMSs)
LMSs play a crucial role in reducing energy consumption in offices Ul Haq et al. (2014) and prior work mainly addressed daylight harvesting Kaminska and Ożadowicz (2018) and occupancy sensing systems (OSS) Guo et al. (2010); Pandharipande and Caicedo (2012). In particular, Ul Haq et al. (2014) emphasized the potential of OSSs for energy saving, surveying available technology and the performance compromise; Guo et al. (2010) additionally focused on the implementation of occupancy sensors; Pandharipande and Caicedo (2012) specifically considered an OSS based on ultrasonic and proposed improvements in user localization based on time-difference-of-arrival and transmission over multiple time slots. However, none of the above addressed energy saving, nor distinguished among private, single-user and open-plan offices as one would intuitively argue for.
Among related work considering open-plan offices, Kim and De Dear (2013) determined three layout categories: (a) cubicle layout with high partitions (1.5m or higher), (b) cubicle layout with low partitions (up to 1.5m) and (c) open layout with no or limited partitions. Wang et al. (2012) and Pandharipande and Caicedo (2013) proposed and demonstrated by simulation an optimization algorithm to compromise energy efficiency and user-comfort, by considering user presence and daylight conditions. They did not address any occupancy sensing algorithm, nor a real-time light propagation model, which we propose here for a real end-to-end light management system. Finally, the lack of a proper review study on LMSs in open-plan offices has been recently stressed by De Bakker et al. (2017). They envisioned modern LMSs, capable of dimming light according to how much of it is perceived by each person in the scene, by means of their visual frustum of attention. We realize this vision here with our “invisible light switch”.
3 Proposed End-to-end System
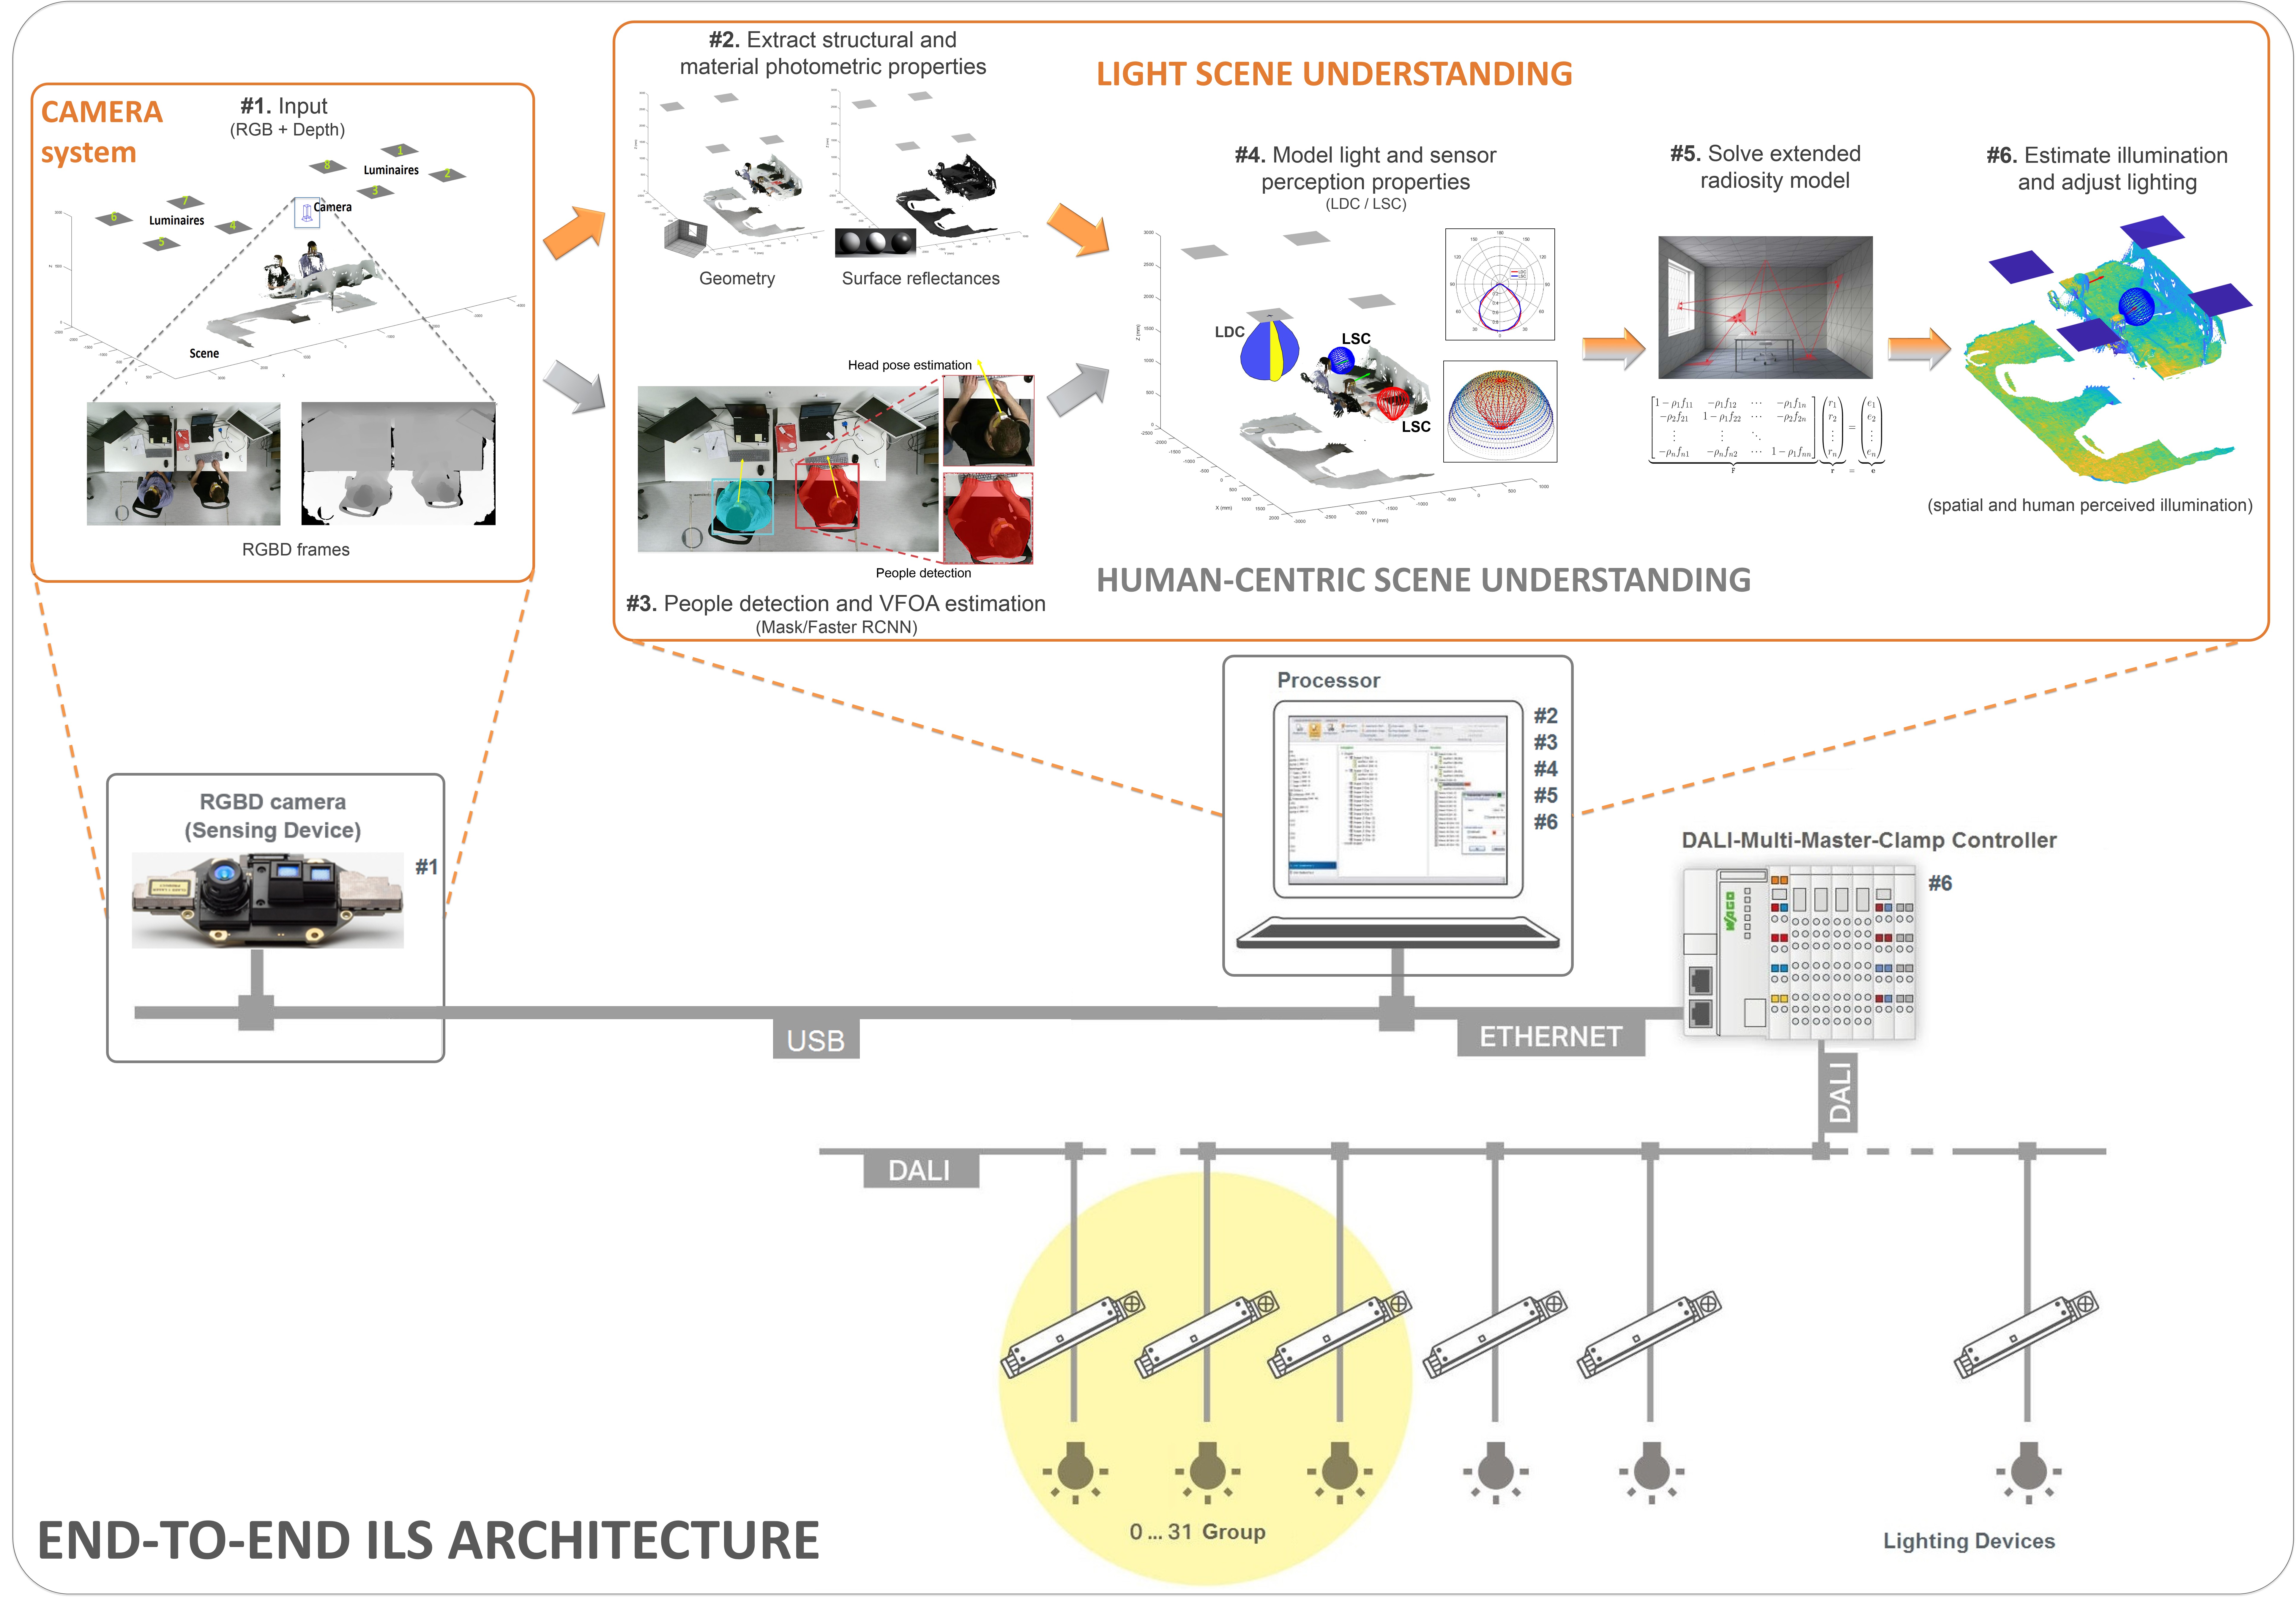
The proposed end-to-end system encompasses three functional tasks: the light-centric scene understanding, the human-centric scene understanding, and the light management. These are depicted in Fig. 1.
Light-centric scene understanding is responsible to estimate the scene 3D geometry and the light propagation within the scene. For the light propagation, we adopt and extend the radiosity model to additionally model the actual light source (office luminaires) as well as the receiving sensor (luxmeters or viewing people).
Human-centric scene understanding stands for detecting the people in the scene and estimating their view frustum of attention (VFOA). We use the VFOA to quantify how much light a single person perceives from each light source.
Both the light-centric and human-centric scene understanding modules are necessary when it comes to open-plan offices, where multiple light sources create complex light patterns which act on moving employees. Finally, light management stands for automatically adjusting lighting in response to the people position and attention. This includes dimming or switching the luminaires off when people do not see them, as in our ILS system. The first two are sensing tasks, performed in first place by the sole use of an RGBD camera. The third task is about light control and leverages an established light-communication BUS (DALI), to read statuses and send commands.
Light-centric Scene Understanding
ILS targets the estimation of the scene 6-DoF illumination, i.e. anywhere in the 3D space and from any 3D direction, by the sole use of RGBD images. Towards this goal, we define a procedure to retrieve the scene 3D surface from the point cloud, as well as the surface reflectance. We then use and extend radiosity to model the light interaction among 3D scene parts by introducing the distribution characteristics of the actual lights (luminaires) and sensing elements (the luxmeters or the people in the scene) c.f. illustration in Fig. 1.
From RGBD images to surface and reflectance. Light propagation requires a scene described by patches, i.e. 3D facets characterized by a surface and an orientation. But an RGBD camera only provides a sparse and noisy point cloud.
We set to recover the scene surfaces by first denoising (weighted median and bilateral filtering) the point cloud by means of the color and depth image pairs. Then we reconstruct the surface as a 3D mesh of multiple scattered patches by using the Open3D library. Given the surface normals, ILS estimates the albedo of each surface element by the first-order spherical-harmonics method same to the one adapted in Tsesmelis et al. (2019b). This requires multiple images of each surface patch under different illumination conditions (e.g. alternating the lights from each of the scene luminaires). We attain the image-set by time-lapse recordings and by selecting/synthesizing single-light-source-lit images with the method in Tsesmelis et al. (2017).
The Radiosity Model. Given the scene 3D surface and the corresponding reflectance, ILS estimates the illuminance of each surface patch with the radiosity model. Radiosity is adopted by most commercial light simulation software (Relux, DIALux, AGi32) because it describes the physical light propagation phenomenon and provides light estimations which are close to those measured by luxmeters, in lux.
Radiosity is a simple linear model but it has two main limitations: it only models point light sources and it disregards the sensor sensitivity characteristics (c.f. Fig. 1(Step 3): light is emitted/absorbed differently depending on the incident angle). The second aspect affects all current commercial light planning software. We address both aspects by introducing into an extended radiosity model the Light Distribution Curve (LDC) (to address the non-ideal non-point-light-source luminaires) and the Luxmeter Sensitivity Curve (LSC) (to model the light observer/sensor). As detailed in Tsesmelis et al. (2019b), the extended radiosity encodes the LDC and LSC non-linearities into the scene form factors, thus preserving the model linearity and minimally affecting computation.
Human-centric Scene Understanding
The main human features of a light management system are the localization of people, the estimation of their visual attention and the consequent estimation of their lighting perception in the scene.
We cast the localization of people as a human detection task from top-view imagery based on the state-of-the-art Mask R-CNN model with the ResNet-101 backbone.
We denote the visual attention of people by their visual frustum of attention (VFOA), which we estimate with the model of Hasan et al. (2017). This consists of a Faster R-CNN architecture with VGG16 backbone, extended by a VFOA branch for gaze estimation, taking as input the detected person bounding-box. As noted in Hasan et al. (2017), the whole-person bounding box provides an important contextual cue, to complement the tiny heads from the top-view imagery.
The VFOA is cast as classifying the person viewing angle into quantized direction bins. We experimented with 4-quantized viewing directions (North, West, South, East), as well as with 8 (yielding a granularity of . Moreover, attempting to estimate the VFOA by regression, under-performed the classification approach, based on the fact that it is easier to estimate a class label than the exact angle. Once we extract the detected 2D people positions and viewing angles, we map them onto the 3D space by means of depth to 3D mapping.
Finally, we model the light perceived by the people as the illumination reaching the person’s field-of-view, as described by the 6-DoF head position and VFOA orientation in the scene. Each field-of-view is assumed to be a conic reception field. The arriving light follows the radiosity model of Sec. Light-centric Scene Understanding, the ray-casting simulation as described for the light sensitivity curve (LSC) in Tsesmelis et al. (2019a), and the consequent integration across the human field-of-view. Overall, each person’s light perception is approximated as a light sensor alike the luxmeter, positioned between the eyes.
Light Management System
ILS is a camera-aided smart LMS to control lighting in response to the currently spatial and human perceived estimated light as well as the people position and attention. The ILS reads the luminaire status and switches them on and off based on the people presence. Additionally it dims luminaires down when partially visible by the people, therefore saving energy “in the invisible”, while maintaining the desirable scene illumination.
As illustrated in Fig. 1, the proposed LMS consists of the sensing RGBD camera, a computing device to estimate the light and human factors in the scene (c.f. Secs. Light-centric Scene Understanding), Human-centric Scene Understanding, a Master Light Controller to communicate commands to luminaires, and the luminaires themselves, interconnected via a suitable protocol BUS. ILS is implemented as a computer program running on the computing device, based on the people presence and attention, and on the luminaire status readouts. Overall, the proposed LMS system is autonomous, end-to-end and real-time.
We have adopted and report results on images acquired via a Kinect v2 RGBD camera. The computing device is a laptop, running the sensing algorithms of Secs. Light-centric Scene Understanding, Human-centric Scene Understanding and the controlling invisible light switch program. The Kinect v2 is connected to a laptop via a USB2 port.
The Master Light Controller interfaces the computer with the luminaires, by forwarding switching and dimming commands and reporting the luminaire statuses (on, off, dimming level, etc.). We adopt the WAGO-I/O-SYSTEM 750 through a DALI (Digital Addressable Lighting Interface) Multi-Master Module 753-647 WAGO (2019b). As with most such controllers, it connects to the computer via Ethernet TCP/IP, enabling therefore IoT and cloud-based intelligence. The connection is accommodated via proprietary software, i.e. the WAGO DALI Configurator WAGO (2019a) running on the computer. The WAGO DALI Configurator allows easy commissioning of the devices connected on the DALI network. This includes the offline configuration of the entire DALI network, including the electromagnetic control gears (ECGs), the sensors and the saving/repeating device configurations.
As communication BUS between the Master Light Controller and the luminaires ILS adopts the established DALI BUS. DALI is one of the simplest duplex-communication protocols, which allows to flexibly connect up to 64 devices in series, grouping them into up to 16 clusters.
4 Experiments
Here we evaluate the performance of the LMS system and its parts on a novel benchmark.
(d)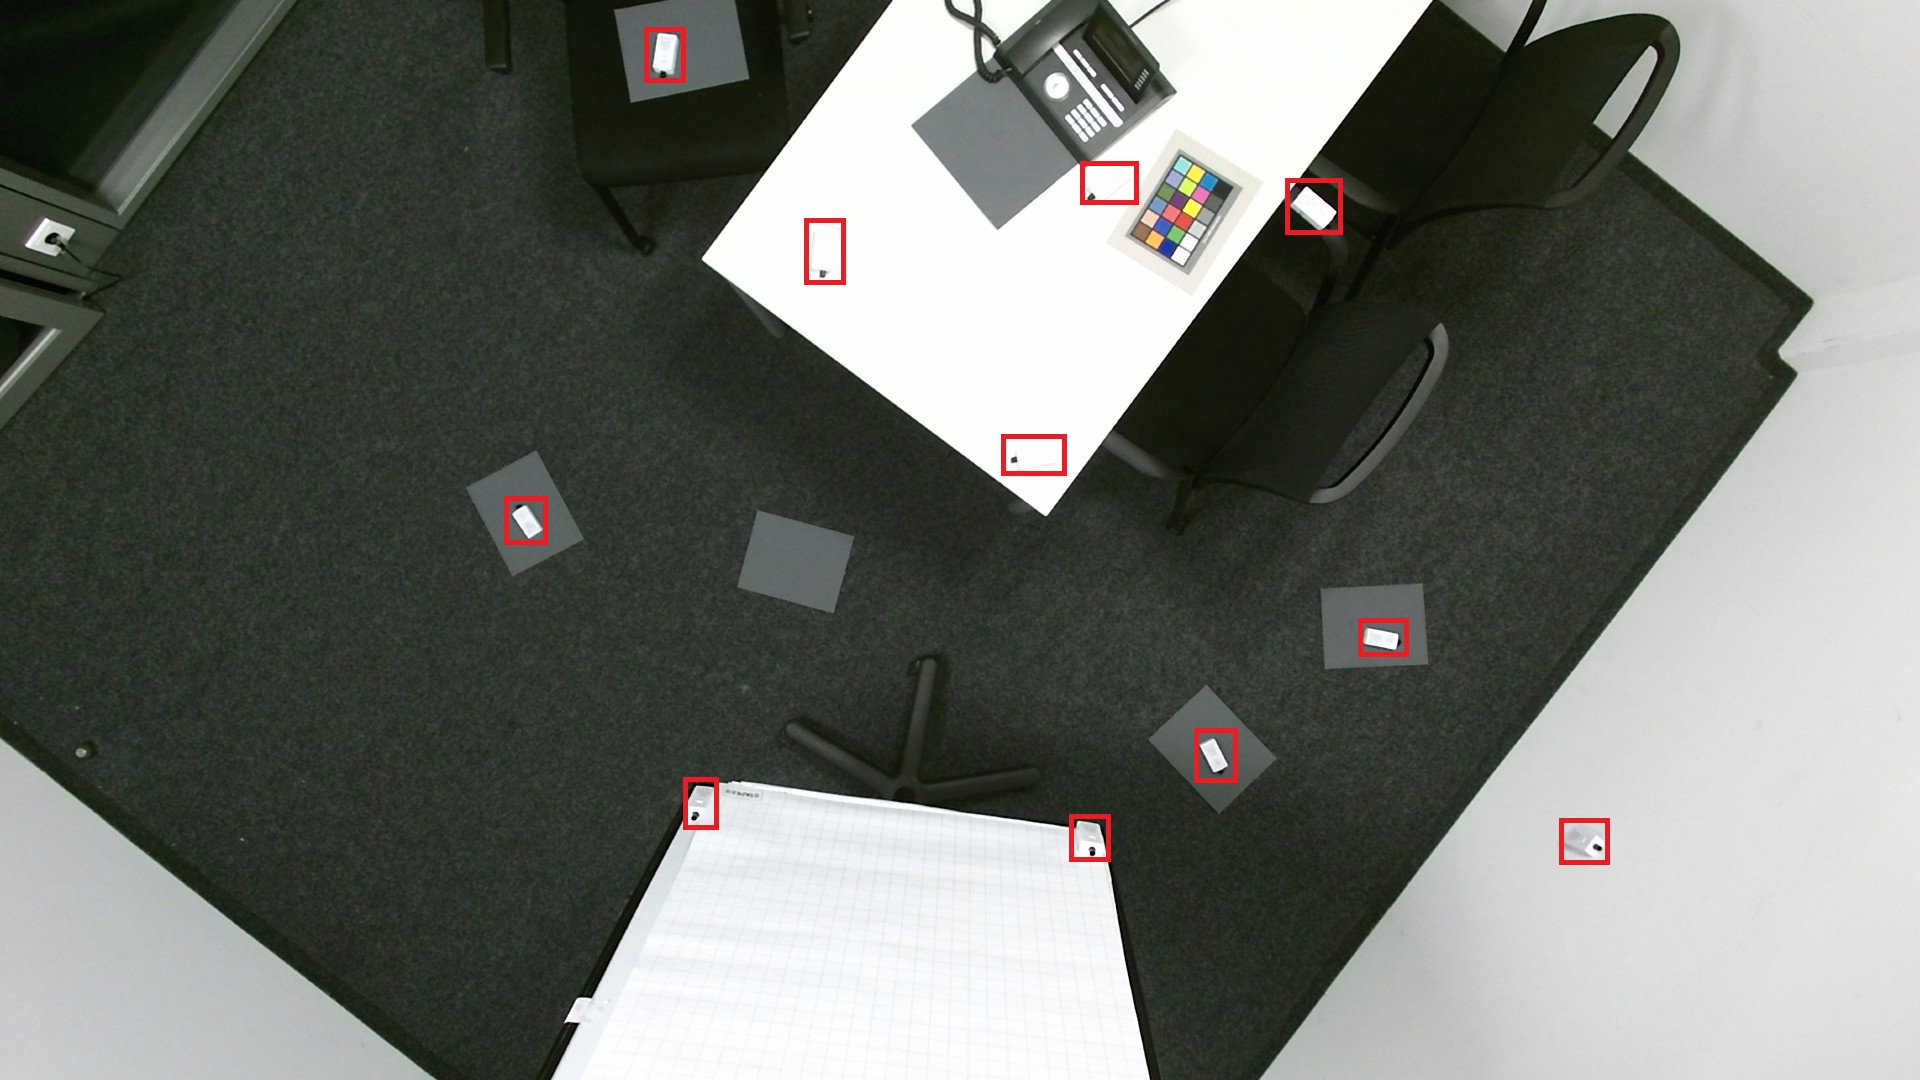 37pt70pt
(e)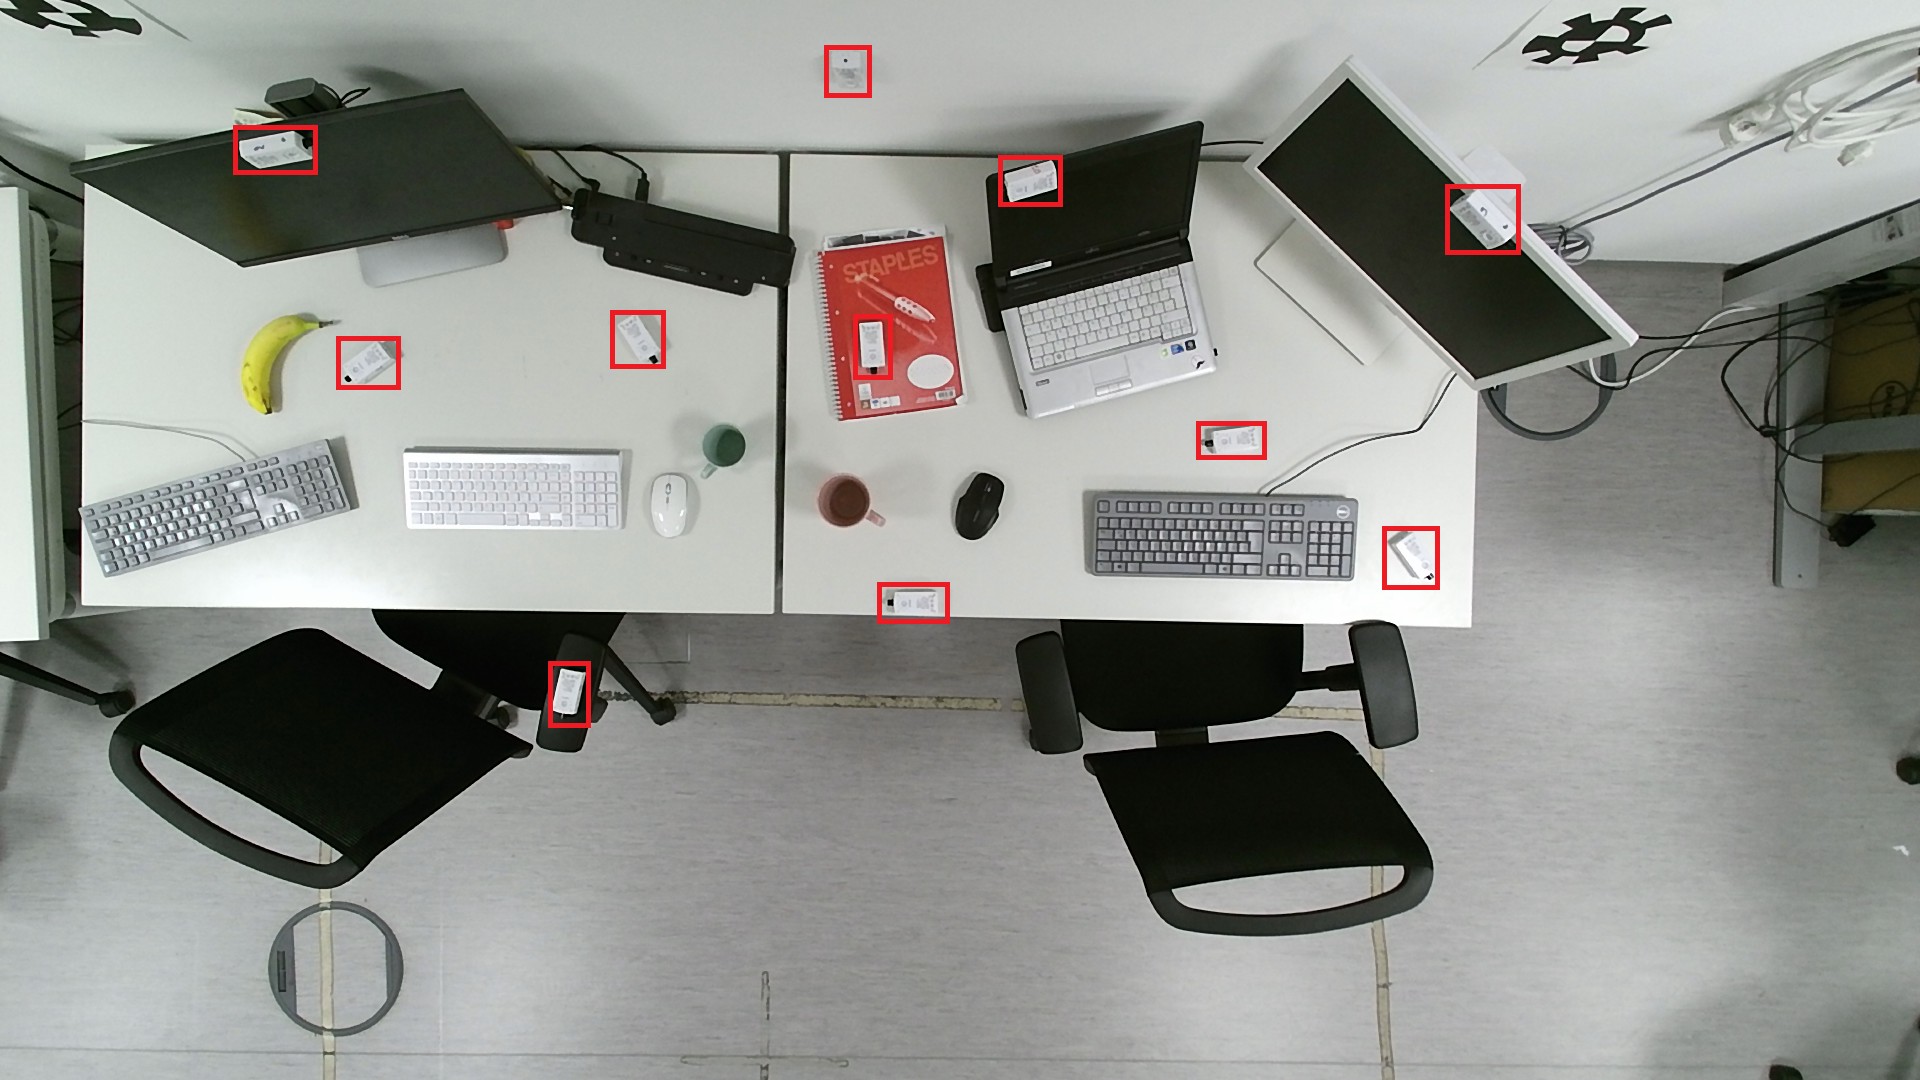 37pt70pt
(f)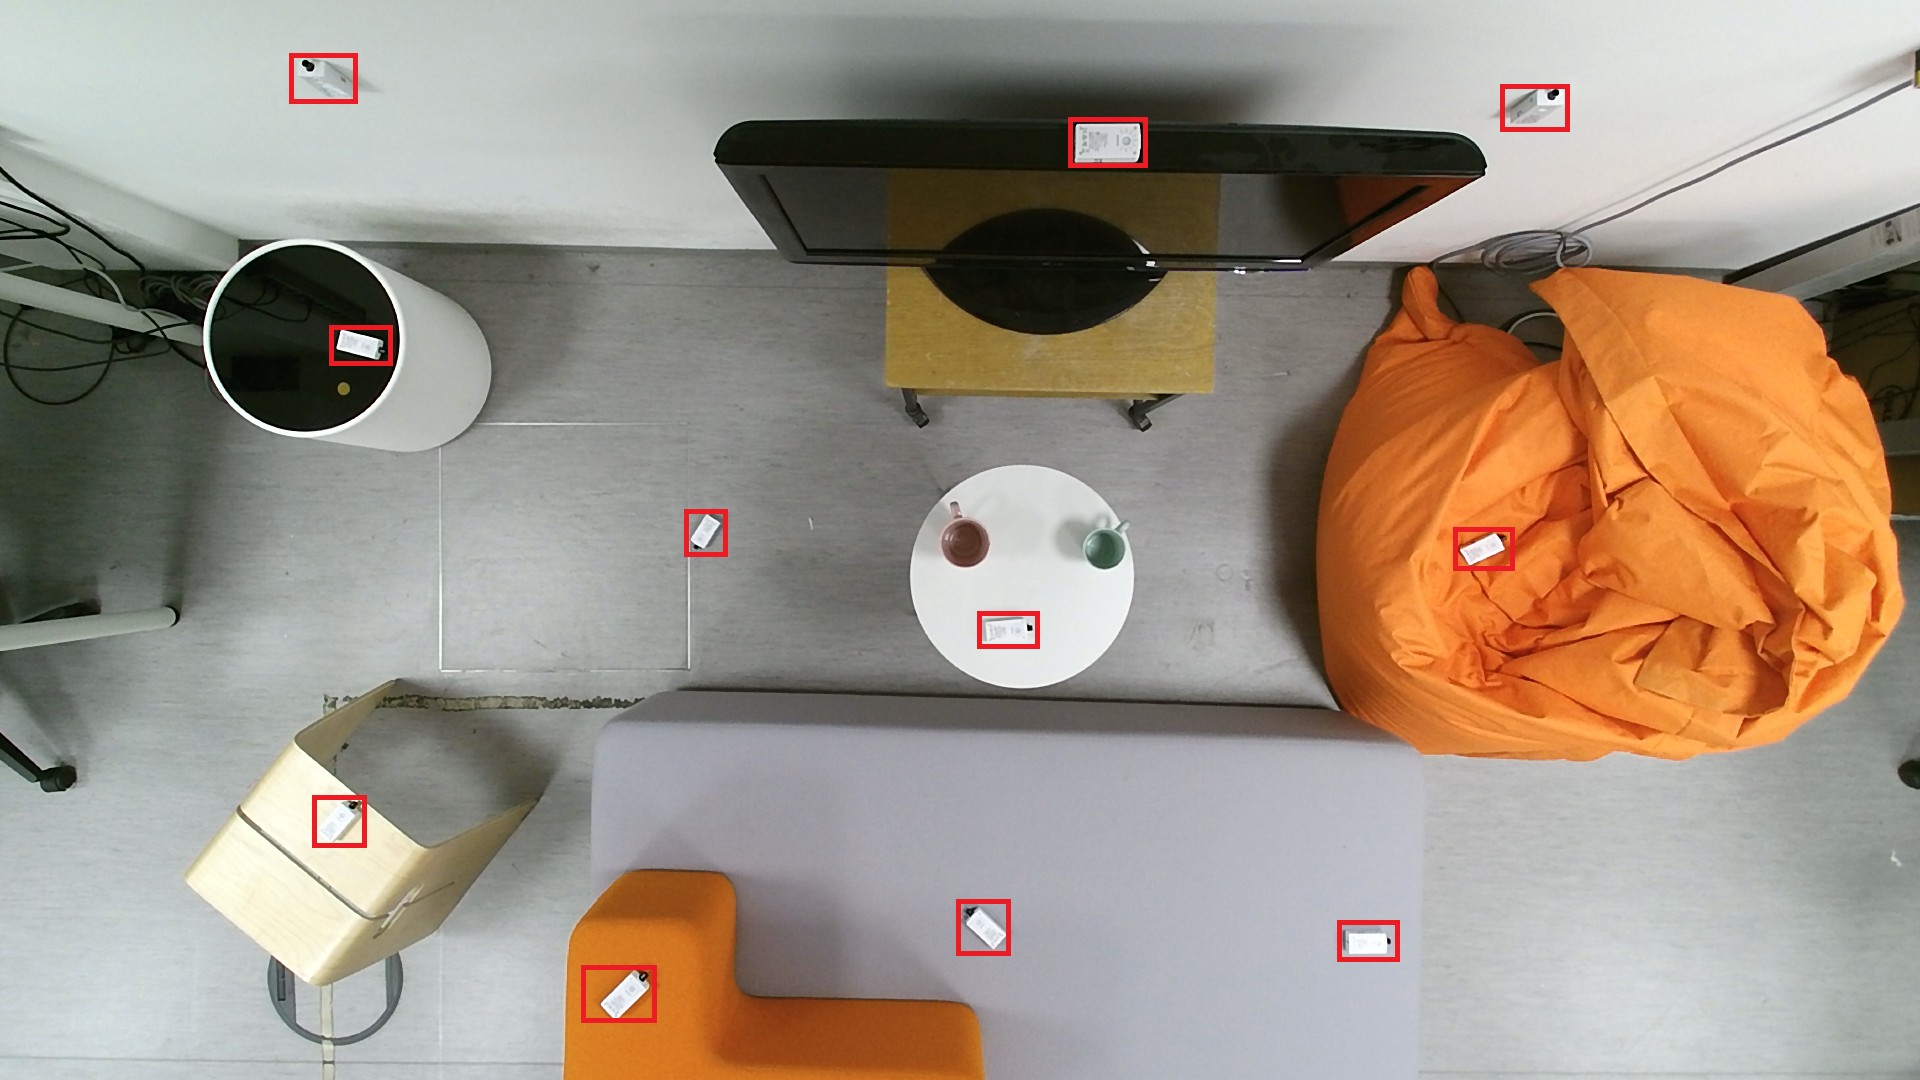 37pt70pt
(g) 61pt113pt
(h) 61pt113pt
Dataset and Metrics
|
|
|||||||||||||||||||||||||||
| Luxmeters | Luxmeters | |||||||||||||||||||||||||||
| 1 | 2 | 3 | 4 | 5 | 6 | 7 | 8 |
|
|
1 | 2 | 3 | 4 | 5 | 6 | 7 | 8 |
|
|
|||||||||
|
167 | 96 | 27 | 26 | 43 | 10 | 96 | 39 |
|
|
206 | 97 | 27 | 80 | 97 | 49 | 73 | 44 |
|
|
||||||||
|
69 | 24 | 22 | 38 | 28 | 28 | 38 | 41 |
|
|
70 | 57 | 76 | 106 | 75 | 69 | 55 | 53 |
|
|
||||||||
|
188 | 150 | 33 | 45 | 43 | 34 | 91 | 65 |
|
|
207 | 114 | 99 | 148 | 105 | 117 | 93 | 81 |
|
|
||||||||
|
199 | 152 | 29 | 41 | 40 | 33 | 95 | 57 |
|
|
213 | 117 | 82 | 125 | 97 | 97 | 86 | 63 |
|
|
||||||||
|
73 | 45 | 24 | 32 | 40 | 34 | 46 | 52 |
|
|
69 | 80 | 98 | 136 | 70 | 84 | 56 | 62 |
|
|
||||||||
|
- | 64 | 28 | 20 | 17 | 22 | 52 | - | - |
|
- | 54 | 36 | 59 | 101 | 69 | 54 | - | - |
|
||||||||
|
- | 53 | 41 | 67 | 68 | 40 | 98 | - | - |
|
- | 98 | 90 | 85 | 136 | 108 | 77 | - | - |
|
||||||||
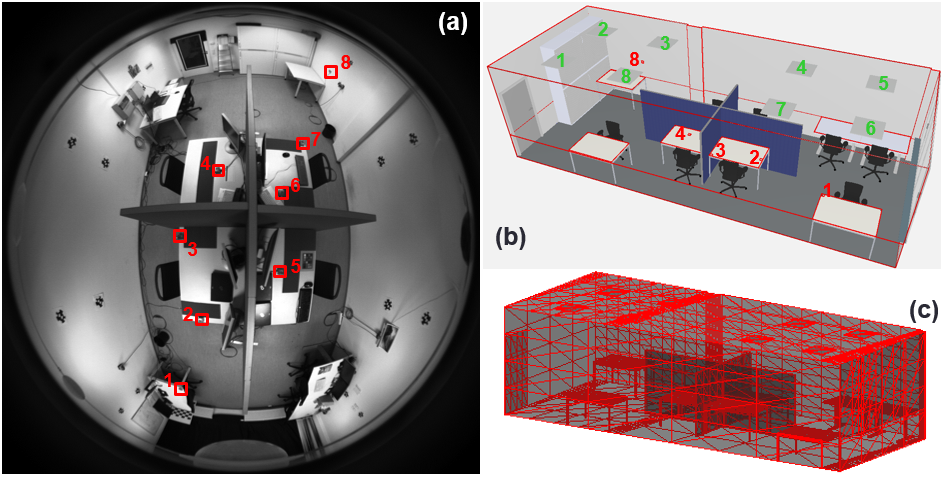
In addition to the data of Tsesmelis et al. (2019a, b) we provide a dataset with RGBD images and light measurements for 3 new and diverse scenes with various new illumination scenarios (combinations of on/off light sources for each scene). The new dataset includes offices, meeting rooms and resting areas as depicted in Fig. 2. For two of the scenes (c.f. Figs. 2b,c) detailed 3D CAD models are available, as well as an accurate labelling of the object textures and reflectivities. This allows the comparison to ReLux, a state-of-the-art commercial software for light modelling. Moreover, for two other scenes, we provide annotated human activity (watching TV, working at the desk, chatting, etc.), detailing the people position and their visual frustum of attention (VFOA) – c.f. Figs. 2g,h – as well as the illumination reaching their sight (i.e. within in their VFOA). This allows benchmarking lighting efficiency, in relation to human perception.
For each frame, the illumination maps are ground-truthed by a number (8-11) of synchronized luxmeters (depicted in Fig. 2 as red boxes), to measure the light intensity reaching the specific spot, in lux. We set to measure the light estimation quality by the absolute error in lux, compared to the corresponding luxmeter readings.
To assess the quality of the human-centric system, we benchmark people detection and (quantized) pose estimation accuracy by the established metrics of mean average precision (mAP) and classification accuracy. Both measures are quantified on the external larger dataset of Demirkus et al. (2017) where people and their head pose are labelled. On the other hand, we assess the accuracy in estimating the perceived illumination by each person with additional luxmeters, worn by the users on their forehead (see green boxes in Figs. 2g,h). This is also quantified by the absolute errors in lux.
Ambient Light Estimation
Table 1, first compares our proposed light estimation approach (“Ours w/o CAD”) to the commercial software Relux, within the scenes of Rooms 1 and 2. Given the CAD model, our method (“Ours w/ CAD”) outperforms the Relux software (“Relux w/ CAD”) on both rooms. We achieve an average error of and lux for Rooms 1 and 2 across the installed luxmeter sensors (“Avg. 1-8”), vs. the Relux errors of and lux respectively. Note also that these errors are to be intended over an illumination range of [0,2000] lux. In both cases, these are good estimates for commissioning, since errors below 200 lux are generally acceptable in the lighting industry.
Table 1 also contains ablation studies “w/ CAD”, given by removing the LSC and LDC distribution curves (“no_LDC_LSC”, “no_LDC”, “no_LSC”). Results confirm that both LDC and LSC are key features to best performance. It is of interest that LSC yields a larger error reduction than the LDC for both rooms. In our view, this happens because LSC properly considers the angle of impacting rays, especially down-weighting the rays coming to the sensor from the side, reflecting the sensor absorption characteristic.
When only using the RGBD image (i.e. “Ours w/o CAD”), we may only estimate light propagation to those scene parts which are within the camera field-of-view (FOV). Since the camera is placed around the room center, we leave luxmeters 1 and 8 at the scene corners out (c.f. Fig. 2a), and only provide the average errors for luxmeters 2-7 (61 and 99 lux for room 1 and 2 respectively). This case is clearly more challenging, partly because of the camera FOV, and partly because the room reconstruction is effectively a noisy 2.5D. The camera FOV only covers 40% of the actual scene, as it misses the ceiling and most of the walls. Moreover, the camera-based scene reconstruction only allows a noisy estimation of those surfaces which are visible from the camera viewpoint. We set to discern which factor matters the most by the ablation method “Ours w/ CAD (within camera FOV)”, which considers a manual input CAD, cropped according to the camera FOV. As shown in Table 1, this performs closely to “Ours w/ CAD” (the slightly lower error for room 2 seems due to the challenging scene with entangled lights, where removing walls reduces some of the possibly misestimated light rays). We conclude that most of the added challenge comes from the noise in the point-cloud and in the effective 2.5D estimate, resulting in a geometry with holes. However, in contrast to all other techniques, the proposed “Ours w/o CAD” is the sole fully-automatic.
The left section of Table 2 illustrates similar performance of our full automatic technique on the rooms 3, 4 and 5, depicted in Fig. 2. Additionally, we introduce two sets of dynamic experiments in rooms 4 and 5. By dynamic we mean the inclusion of people activities with different VFOAs and interactions within the scenes. As it can be seen results are in line with previous experiments.
| Avg. Spatial Light Estimation Error in lux | Avg. Human Light Perception Error in lux | ||||||||||||||||
| Luxmeters |
|
||||||||||||||||
| 1 | 2 | 3 | 4 | 5 | 6 | 7 | 8 | 9 | 10 | 11 | Avg. | 1 | 2 | Avg. | |||
| Static scene | Room 3 | 70 | 93 | 69 | 23 | 25 | 28 | 59 | 28 | 49 | 71 | 82 | 54 | - | - | - | - |
| Room 4 | 18 | 23 | 41 | 26 | 76 | 23 | 35 | 34 | 40 | 69 | 31 | 38 | - | - | - | - | |
| Room 5 | 35 | 38 | 23 | 27 | 29 | 49 | 23 | 40 | 33 | 25 | 34 | 32 | - | - | - | - | |
| Dynamic scene | Room 4 (dynamic) | 62 | 26 | 68 | 65 | 48 | 57 | 44 | 30 | 28 | - | - | 48 | Est. head pose | 216 | 166 | 191 |
| Oracle head pose | 98 | 92 | 95 | ||||||||||||||
| Room 5 (dynamic) | 35 | 34 | 44 | 20 | 32 | 40 | 24 | 28 | 27 | - | - | 31 | Est. head pose | 55 | 152 | 104 | |
| Oracle head pose | 42 | 69 | 55 | ||||||||||||||
People Detection and Head-pose Estimation
We attain best person detection performance by pre-training the detector on the large MS-COCO dataset(80k training + 35k validation images) and then fine-tuning on a selection of diverse top-view images from Demirkus et al. (2017). Following Demirkus et al. (2017), we select diverse frames by sampling one every 20 frames, which yields 4459 training + 1736 test images. On this test set, we achieve 98% mAP (IoU=0.5).
For estimating the VFOA, we train the tiny head-pose estimator of Hasan et al. (2017) on the above-named selection of training images from Demirkus et al. (2017), after having labelled all dataset. We test on head-pose angles quantized into 4 and 8 classes and obtained accuracy of 70.7% and 43.2% respectively on our test set. The degraded performance in the 8-class case is justified due to adjacent viewing angle confusion. This can be further explained by the tiny head region of people in the images, of just pixels. Thus, we considered the 4-quantized-angle head pose estimator.
Human-centric Light Estimation
On the right part of Table 2, we illustrate the error of our method in estimating the amount of illumination arriving at the people sight. We assume as ground truth the illumination estimation of a luxmeter which the occupants wear on their forehead. Average errors for rooms 4 and 5 are 191 and 104 lux respectively. The figures are relatively large, compared to the average light estimation errors reported for the spatial light estimation. We justify this due to challenges in the light propagation as well as due to the error in the head pose estimation. We set therefore to estimate errors when the head pose is given by an oracle.
Light estimation errors for the case of oracle head-pose are also reported in the same section of Table 2 and are significantly lower (). This shows that there is much progress needed in head pose estimation. Still, the residual error remains larger in average, compared to the scene illumination estimates (95 vs. 48 lux for Room 4; 55 vs. 31 lux for Room 5). We explain the discrepancy by two main factors: a) the reconstructed 3D mesh is less accurate for the people heads than on desks; and b) the light estimation arriving at the people suffers from the limited FOV of the depth sensor, since it excludes parts of walls, an important factor for the head-worn luxmeter facing them.
Human-centric Light Management System
Table 3 evaluates whether we can effectively adopt our proposed end-to-end system, i.e. ILS, for light management, implementing the “invisible light switch” principle. The table reports experiments for rooms 4 and 5, whereby occupants engage in activities, while we change the room illumination and switch off some of the 8 luminaires (setup 12345678 refers to “full-lit” where all luminaires are on, while 34 means keeping only luminaires 3 and 4 on. Fig. 3 illustrates the setup of room 4 and the resulting illumination maps, under different lighting setups.
The main performance measure in Table 3 is , which quantifies how much power can be saved when turning some luminaires off. For example, when keeping only luminaires 3 and 4 on (setup 34), one may save up to 580.8 watt. Over a full working day (8 hours), this setup allows to save up to 99 KWh (including the power consumption of the processing unit), meaning 66% of energy efficiency.
| Room 4 (dynamic) | Room 5 (dynamic) | ||||||||||
|
3478 | 2345 | 34 | 123456 | 2345 | 1346 | 34 | ||||
|
387.2 | 387.2 | 580.8 | 193.6 | 387.2 | 387.2 | 580.8 | ||||
| Luxmeters (head-worn) | 1 |
|
116.15 | 123.77 | 189.01 | 106.52 | 148.12 | 157.07 | 191.15 | ||
|
167.2 | 144.09 | 102.73 | 22.94 | 12.97 | 13.59 | 25.69 | ||||
| 2 |
|
97.68 | 125.15 | 169.72 | 99.17 | 154.28 | 167.93 | 194.85 | |||
|
194.63 | 171.74 | 131.55 | 9.4 | 241.12 | 2.81 | 203.69 | ||||
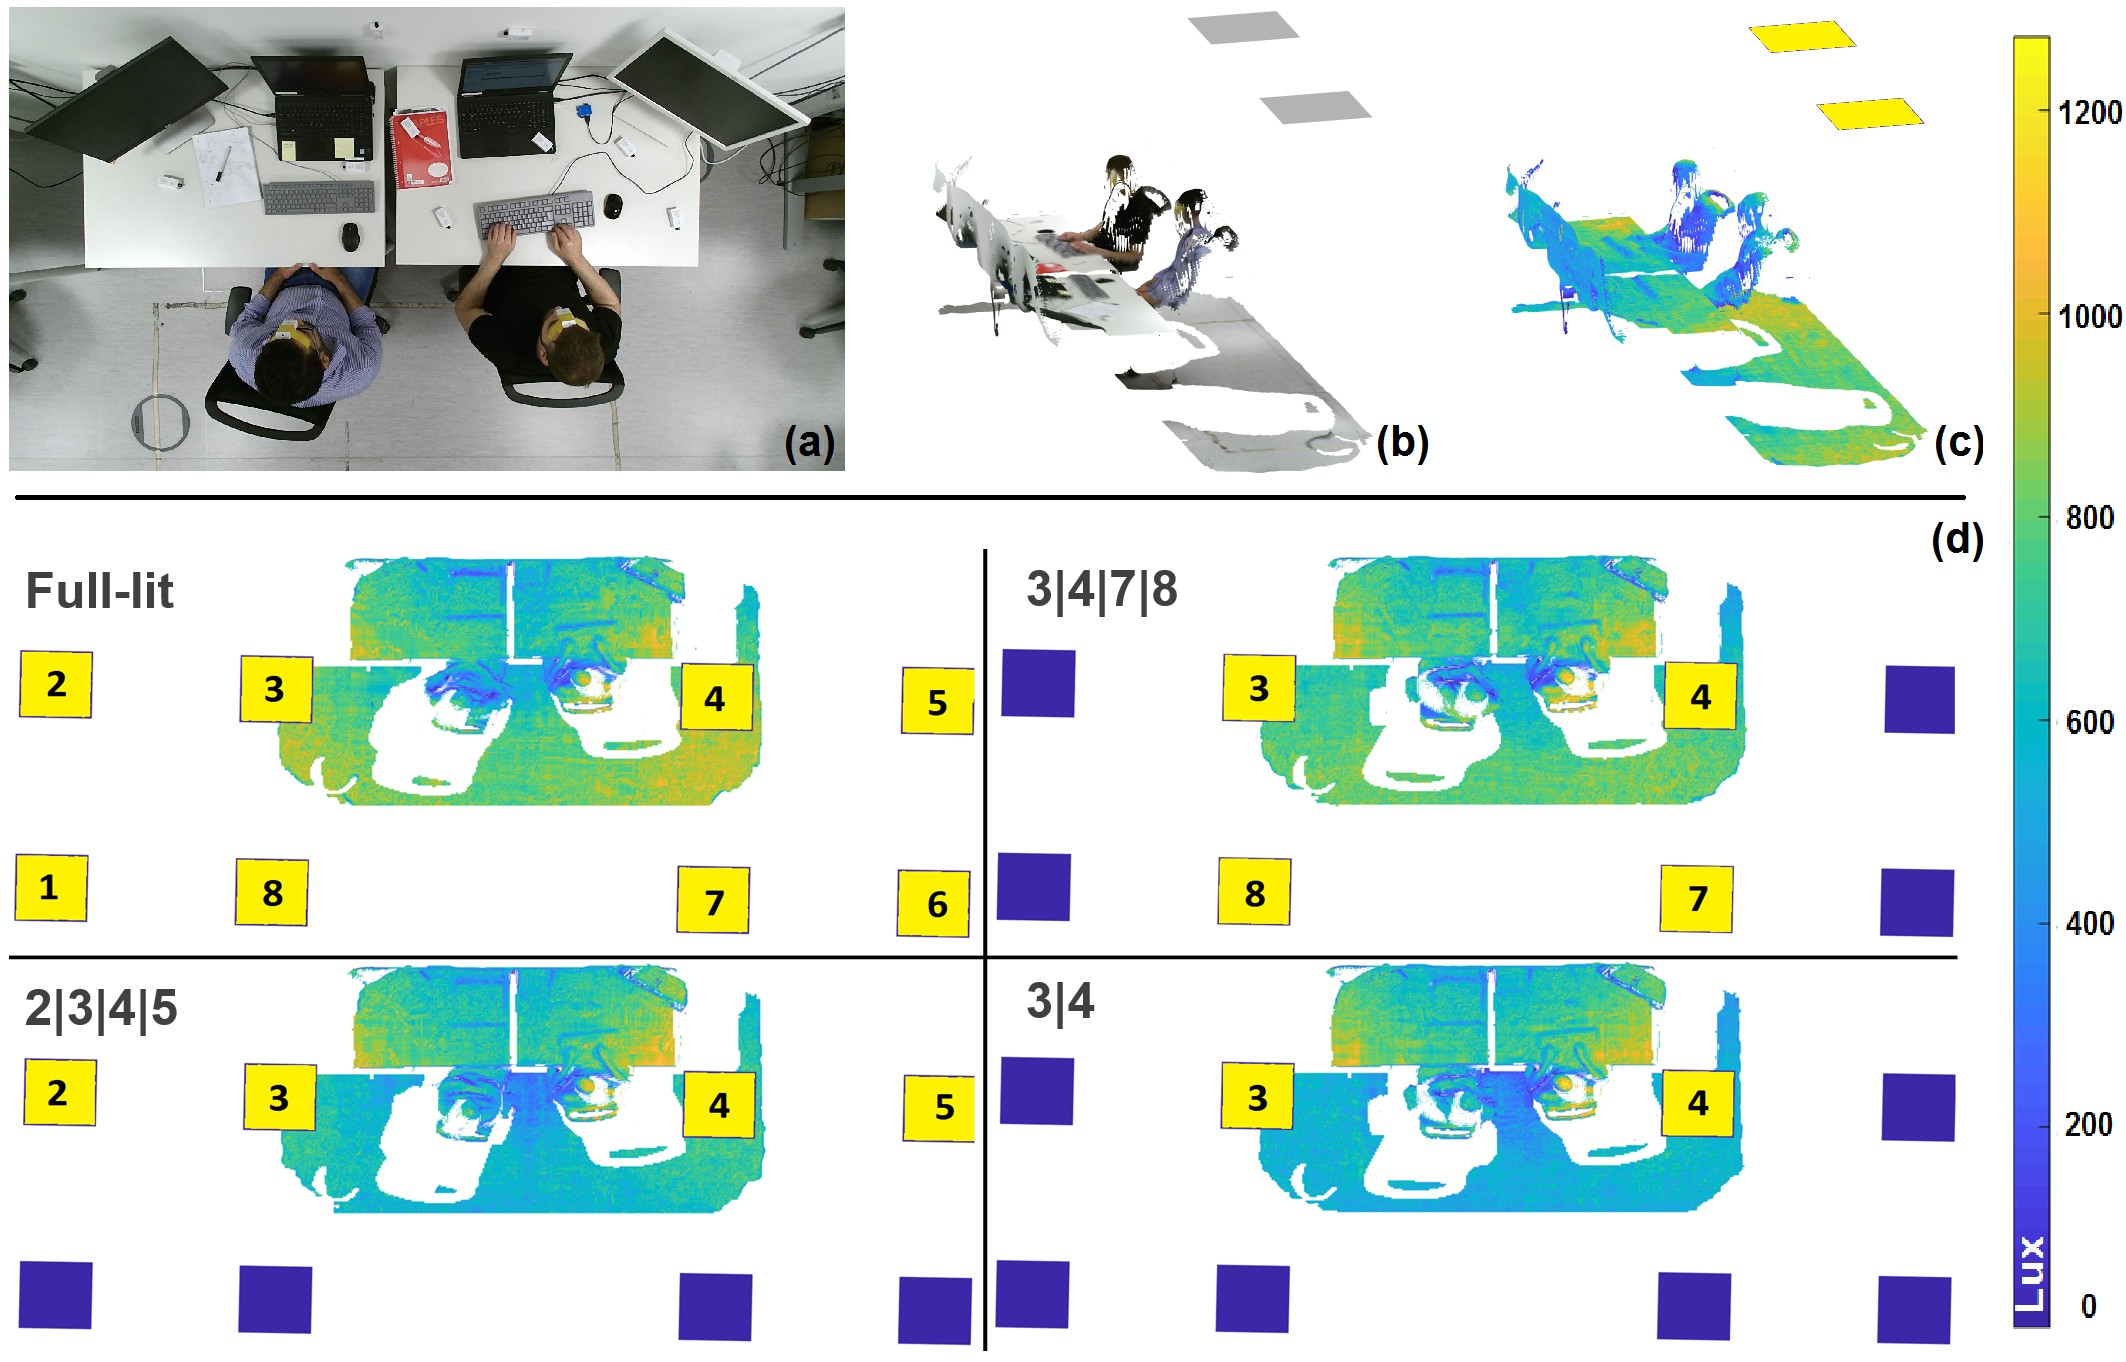
The second important measure in the table is , which quantifies how much the illumination in sight changes. We measure this by means of luxmeters which the occupants wear on their forehead, as also previously described in Sec. 4. For example, in room 4 and setup 34, the person on the right (c.f. Fig. 3) wearing the head-worn luxmeter 1 perceives a difference of 189.01 lux (over the ambient lighting of 1200 lux), the largest in the most-energy saving scenario.
Finally, we report the light estimation error. In the above example (room 4, occupant 1, setup 34) the error is 102.73 lux. This remains comparable to the actual light variation . Fig. 3 supports the results qualitatively.
5 Conclusion
We have motivated, introduced and benchmarked the first real-time, end-to-end and human-centric light management system. ILS is based on models for estimating the scene lighting as well as the illumination in sight of the scene occupants. Based on these, we have defined an invisible light switch light management algorithm, to switch off or dim luminaires which are partially visible. Key aspects of this proposition are the relatively small light estimation errors, compared to lighting industry standards, which support the proposed “invisible light switch”.
This project has received funding from the European Union’s Horizon 2020 research and innovation programme under the Marie Sklodowska-Curie Grant Agreement No. 676455 and has been partially supported by the project of the Italian Ministry of Education, Universities and Research (MIUR) ”Dipartimenti di Eccellenza 2018-2022”.
References
- Boyce (2004) Boyce PR (2004) Lighting research for interiors: the beginning of the end or the end of the beginning. Lighting Research & Technology .
- Cai (2016) Cai H (2016) Luminance gradient for evaluating lighting. Lighting Research & Technology .
- Cuttle (2010) Cuttle C (2010) Towards the third stage of the lighting profession. Lighting Research & Technology .
- De Bakker et al. (2017) De Bakker C, Aries M, Kort H and Rosemann A (2017) Occupancy-based lighting control in open-plan office spaces: A state-of-the-art review. Building and Environment .
- Demirkus et al. (2017) Demirkus M, Wang L, Eschey M, Kaestle H and Galasso F (2017) People detection in fish-eye top-views. In: VISAPP.
- Guo et al. (2010) Guo X, Tiller D, Henze G and Waters C (2010) The performance of occupancy-based lighting control systems: A review. Lighting Research & Technology .
- Hasan et al. (2017) Hasan I, Tsesmelis T, Galasso F, Del Bue A and Cristani M (2017) Tiny head pose classification by bodily cues. In: ICIP.
- Hiscocks and Eng (2014) Hiscocks PD and Eng P (2014) Measuring luminance with a digital camera. Technical report, Syscomp Electronic Design Limited.
- Kaminska and Ożadowicz (2018) Kaminska A and Ożadowicz A (2018) Lighting control including daylight and energy efficiency improvements analysis. Energies .
- Kim and De Dear (2013) Kim J and De Dear R (2013) Workspace satisfaction: The privacy-communication trade-off in open-plan offices. J. of Environmental Psychology .
- Kralikova et al. (2015) Kralikova R, Andrejiova M and Wessely E (2015) Energy saving techniques and strategies for illumination in industry. Procedia Engineering .
- Kralikova et al. (2016) Kralikova R, Pinosova M and Hricova B (2016) Lighting quality and its effects on productivity and human healts. Int. J. Interdiscip. Theory Pract .
- Küller and Wetterberg (1993) Küller R and Wetterberg L (1993) Melatonin, cortisol, eeg, ecg and subjective comfort in healthy humans: impact of two fluorescent lamp types at two light intensities. Lighting Research and Technology 25(2): 71–80.
- Marschner and Shirley (2015) Marschner S and Shirley P (2015) Fundamentals of computer graphics. CRC Press.
- Pandharipande and Caicedo (2012) Pandharipande A and Caicedo D (2012) User localization using ultrasonic presence sensing systems. In: SMC.
- Pandharipande and Caicedo (2013) Pandharipande A and Caicedo D (2013) Adaptive illumination rendering in led lighting systems. SMC .
- Partonen and Lönnqvist (2000) Partonen T and Lönnqvist J (2000) Bright light improves vitality and alleviates distress in healthy people. J. of Affective Disorders .
- Tsesmelis et al. (2017) Tsesmelis T, Hasan I, Cristani M, Del Bue A and Galasso F (2017) LIT: A system and benchmark for light understanding. In: ICCVW.
- Tsesmelis et al. (2019a) Tsesmelis T, Hasan I, Cristani M, Del Bue A and Galasso F (2019a) Human-centric light sensing and estimation from rgbd images: The invisible light switch. WACV .
- Tsesmelis et al. (2019b) Tsesmelis T, Hasan I, Cristani M, Galasso F and Del Bue A (2019b) RGBD2lux: dense light intensity estimation with an rgbd sensor. WACV .
- Ul Haq et al. (2014) Ul Haq MA, Hassan MY, Abdullah H, Rahman HA, Abdullah MP, Hussin F and Said DM (2014) A review on lighting control technologies in commercial buildings, their performance and affecting factors. Renewable and Sustainable Energy Reviews .
- WAGO (2019a) WAGO (2019a) Wago dali configurator. https://www.wago.com/de/dali.
- WAGO (2019b) WAGO (2019b) Wago dali module. https://www.wago.com/us/controllers-bus-couplers-i-o/dali-multi-master/p/753-647.
- Wang et al. (2012) Wang H, Pandharipande A, Caicedo D and v d Bosch PPJ (2012) Distributed lighting control of locally intelligent luminaire systems. In: SMC.