The Bulge Radial Velocity Assay for RR Lyrae stars (BRAVA-RR) DR2: a Bimodal Bulge?
Abstract
Radial velocities of 2768 fundamental mode RR Lyrae stars (RRLs) toward the Southern Galactic bulge are presented, spanning the southern bulge from and . Distances derived from the pulsation properties of the RRLs are combined with Gaia proper motions to give constraints on the orbital motions of 1389 RRLs. The majority (75%) of the bulge RRLs have orbits consistent with these stars being permanently bound to 3.5 kpc from the Galactic Center, similar to the bar. However, unlike the bulge giants, the RRLs exhibit slower rotation and a higher velocity dispersion. The higher velocity dispersion arises almost exclusively from halo interlopers passing through the inner Galaxy. We present 82 stars with space velocities 500 km s-1 and find that the majority of these high-velocity stars are halo interlopers; it is unclear if a sub-sample of these stars with similar space velocities have a common origin. Once the 25% of the sample represented by halo interlopers is cleaned, we can clearly discern two populations of bulge RRLs in the inner Galaxy. One population of RRLs is not as tightly bound to the Galaxy (but is still confined to the inner 3.5 kpc), and is both spatially and kinematically consistent with the barred bulge. The second population is more centrally concentrated and does not trace the bar. One possible interpretation is that this population was born prior to bar formation, as their spatial location, kinematics and pulsation properties suggest, possibly from an accretion event at high redshift.
Subject headings:
editorials, notices — miscellaneous — catalogs — surveys1. Introduction
The Milky Way, like most spiral galaxies, has a central bulge that appears to be a slightly flattened spheroid (Weiland et al., 1994), and stellar tracers, such as red clump (RC) stars and Mira variables have revealed the three-dimensional distribution of a bar in the Galactic bulge (e.g., Stanek et al., 1997; Wegg & Gerhard, 2013; Catchpole et al., 2016). In our Milky Way, the bulge/bar comprises about 15% of the total luminosity and has a stellar mass of 2 (Cao et al., 2013; Portail et al., 2015a; Valenti et al., 2016). There is much evidence of several populations coexisting within the bulge/bar, with these populations having different star formation histories (e.g., Babusiaux et al., 2010; Ness et al., 2013; Rich et al., 2013; Rojas-Arriagada et al., 2019).
One striking example of this is the kinematically distinct rotation curves exhibited by the more metal-rich stars, such as the red clump (RC) stars, and the more metal-poor stars, such as the RR Lyrae stars (RRLs). From radial velocities of a large sample of giants toward the Galactic bulge from the Bulge Radial Velocity Assay (BRAVA), the bulge was shown to be undergoing cylindrical rotation (Rich et al., 2007; Howard et al., 2009; Kunder et al., 2012), and Shen et al. (2010) argued this could be explained by most of the mass being in the bar. Both the Abundances and Radial velocity Galactic Origins Survey (ARGOS; Freeman et al., 2013) as well as the GIRAFFE Inner Bulge Survey (GIBS; Zoccali et al., 2014) targeted RC stars across the bulge and confirmed cylindrical rotation of this population. In contrast, the Bulge Radial Velocity Assay for RR Lyrae stars, BRAVA-RR survey (Kunder et al., 2016, hereafter BRR-DR1), targeted RRLs across the inner bulge and found this population exhibited much slower rotation, as well as a higher velocity dispersion. A slower rotation curve was also found for the metal-poor stars in Arentsen et al. (2020). Using hundreds of metal-poor inner Galaxy stars (1 dex), they showed that the signature of rotation decreases in magnitude with decreasing , until it disappears for the most metal-poor stars (2 dex).
Both RRLs and RC stars are core helium-burning stars widely used as stellar tracers of old stars to piece together the build-up of the Milky Way(e.g., Kunder et al., 2018a). However, RC stars evolve from stars with a wide range of ages (1 Gyr to 10 Gyr) and are a more metal-rich bulge component (), while RRLs are older ( Gyr) and are on average a more metal-poor population (1.2, Walker & Terndrup, 1991).
In contrast to ages, stellar metallicities (e.g., ) can be measured using relatively well established techniques from stellar spectra. The metallicity distribution function (MDF) is a fundamental characteristic of any stellar system and stars located in the bulge have been differentiated by their mean as well as by their metallicity dispersion. The metal-rich bulge stars are clearly part of the bulge/bar structure; they show cylindrical rotation, a clear vertex deviation111The vertex deviation quantifies the misalignment between tangential and radial motions. A stationary, axisymmetric disc will have no vertex deviation, whereas a triaxial bar necessarily introduces a vertex deviation (Binney & Tremaine 2008)., and their velocity dispersion profile decreases steeply with latitude. In contrast, the metal-poor stars show signs of behaving different, taking on a more axisymmetric spatial distribution and having lower, non-cylindrical rotation. This difference in metal-rich and metal-poor stars has been reported from stellar abundances of the stars from GIBS (e.g., Zoccali et al., 2017), the Gaia-ESO Survey (e.g., Rojas-Arriagada et al., 2017), from APOGEE abundances (e.g., Queiroz et al., 2020) among others (see the review by Barbuy, Chiappini & Gerhard, 2018). Therefore, in agreement with what is seen with the old RRLs in the inner Galaxy, other stellar populations show evidence for a metal-poor spheroid in the bulge, too. It is still not clear, however, if the inner Galaxy RRLs trace the same spheroidal component as the bulge stars with 0, or if these RRLs, which are 10x more metal-poor, are yet a different population co-existing in the bulge region of the Galaxy.
By and large, the surveys of the bulge mentioned above have lacked accurate proper motions, allowing an exploration of the bulge in only one velocity component. Samples of stars with measured proper motions have also indicated that the bulge harbors diverse stellar components. Clarkson et al. (2018) showed that the velocity ellipsoid of metal-rich stars is different from the subsolar stars, and Soto et al. (2007) finds that the metal-rich bulge stars have a vertex deviation in the radial versus transverse velocity, consistent with the bar supporting orbits. However, using proper motions of the entire Galactic bulge region from VIRAC and Gaia, Clarke et al. (2019) show that the inner bulge stars have correlated proper motions and no clear separation of different bulge components were detected.
Given this stellar potpourri, the speculation has arisen that the more metal-poor stars in the direction of the bulge are not actually of the bulge, but are part of the halo, as the halo of the Milky Way obviously is also present in the inner Galaxy (Johnson et al., 2012; Kunder et al., 2015; Koch et al., 2016). These stars would be inner halo stars on orbits that make them pass through the central regions. They could also be the inner-extension of the halo confined to the inner Galaxy (Pérez-Villegas et al., 2017a) these stars are metal-poor halo stars with orbits that confine them to the inner 5 kpc of the Galaxy. The majority of these stars would not follow the bar/X-shaped structure and would show a slow mean radial velocity with a velocity dispersion of 120 km s-1. The dearth of 6D phase space information for bulge stars has made it difficult to explore the dynamics of large sample of bulge stars, however. For the small stellar samples with 6D information, it is seen that at least some of the metal-poor bulge stars are confined to the bulge (Howes et al., 2015).
Here, we refine the radial velocity of the inner Galaxy RRL stars presented in BRR-DR1 and present new radial velocities for RRLs in six bulge fields located in the outer bulge in §2. Our sample consists of 2768 RRLs, 2.5 times larger than in BRR-DR1, and the radial velocities are presented in §3. The fastest moving stars are discussed in §4. In §5, we focus on the 50% of these stars with Gaia astrometry (Gaia DR2). We use the 3D velocities (and orbits) to study halo or bulge membership of our inner Galaxy RRL sample. Our findings, that there are two different spatial distributions of RRLs in the bulge, are put into context in §6.
2. Data
2.1. Radial velocities
The OGLE-IV catalog of bulge RRLs (Pietrukowicz et al., 2015) was used to select the RRLs. As in BRR-DR1, the wavelength covered was 8300Å to 8800Å at a resolution of R10,000 using the AAOmega multi-fiber spectrograph on the Anglo-Australian Telescope (AAT). Exposure times were between 0.33 to 3 hours, and in general we collected between 1 - 4 epochs for each RRL, the multiple observations required to measure systemic velocities for each star. Observations were taken from June 16 - June 21, 2017222NOAO PropID 2017A-0196 and OPTICON 51. Reductions were carried out in an identical manner as BRR-DR1, and radial velocities were found using iraf’s xcsao routine. The xcsao cross-correlatation was carried out using spectra taken of the APOGEE star 2M18264551-1747096 and adopting the velocity of this star to be 69.2 km s-1 (Alam et al., 2015). The spectrum of this star was acquired using the same set-up with AAOmega that was used with our RRLs. The individual uncertainties from xcsao typically ranged from 1 km s-1 to 4 km s-1.
The radial velocity measurements were phased by the stars’ known OGLE period, and over-plotted with the radial velocity template from Liu (1991). The template is scaled using
| (1) |
where is the -band amplitude, to account for the correlation between the amplitudes of velocity curves and light curve (Liu, 1991). To be consistent with BRR-DR1, we adopt = 1.37, the so-called “projection factor”, to relate our observed radial velocities to the pulsation radial velocities (see also Sesar, 2012). Because OGLE samples the -band much more frequently than the -band, we used the following relation for the -amplitude:
| (2) |
(see e.g., Table 3 in Kunder et al., 2013).
In BRR-DR1, we found that the uncertainty in the center-of-mass radial velocity measurement due to having a small (between 1-4) number of epochs to be between 2-5 km s-1. Adding in quadrature both the individual uncertainty on each velocity measurement as reported from xcsao as well as that from having a small number of epochs for center-of-mass radial velocity determination, the total center-of-mass radial velocity uncertainties are 5-10 km s-1.
Although we made every effort to observe RRLs that were free of a companion within a 2 arc second radius, we did notice evidence of blending in a small fraction of our RRL stellar spectra (1%). For some spectra, not one, but two distinct dips in intensity around the calcium triplet(CaT) was seen. These two distinct CaT lines represent the CaT lines of two different stars: the RRL as well as a close neighbor. The most likely reason for this blending is that the typical seeing during our observing runs was between 1.5 - 2.5 arc seconds. We discarded the spectra with two distinct CaT lines, as we could not be sure which CaT line belonged to the RRL and which one belonged to the neighbor. There may be other stars that have blends but that we were not able to identify due to low SNR, a small difference in radial velocity between the RRL and the neighboring star and/or too many spectral lines near the CaT lines from e.g., shock waves (Chadid, Vernin & Gillet, 2008; Yang et al., 2014) or the star having a hot temperature where Hydrogen Paschen lines dominate as compared to the CaT signature.
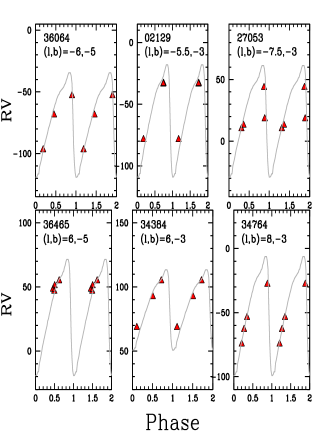
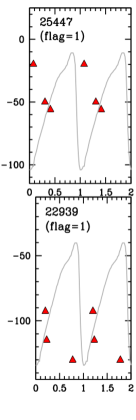
For 98% of our sample, we had more than one epoch of observations. Therefore, we visually checked each radial velocity curve and made sure it matched that from Liu (1991) using the zero-point in phase fixed using the OGLE-IV time of maximum brightness. Stars with large scatter in their radial velocity curves are flagged with flag=1, where large scatter means that at least one observation deviates by 20 km s-1 or more from the Liu (1991) template. Two typical stars with flag=1 are shown in Figure 1.
Some of the stars with scatter may be attributed to stellar blending that went undetected by our visual examinations of stellar spectra. Blends are less likely to be detected if a particular observation is taken when an RRL is at a high temperature during its pulsation cycle, as this is where the Hydrogen Paschen lines become significant and the CaT lines are less prominent. We do not believe that stars with flag=0 are blends, as otherwise the individual radial velocities would not follow the Liu (1991) template (see Figure 1). Note that the phase of the observation is fixed using the times of minimum brightness given by OGLE, and the Liu (1991) template is shifted only up or down to fit the individual radial velocity measurements. We can not be certain that stars with one epoch of observations are not affected by undetected blends.
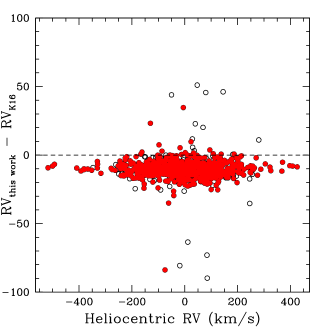
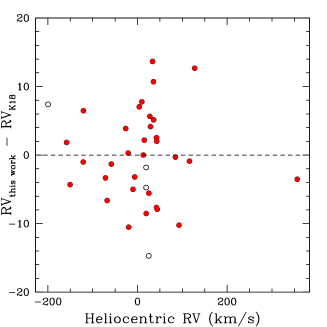
Figure 2 shows a comparison between the radial velocities presented here and those from both BRR-DR1 and from Kunder et al. (2018b). A striking 10 km s-1 offset is found from the radial velocities here as compared to BRR-DR1, and no meaningful offset is found from the radial velocities here as compared to Kunder et al. (2018b). The difference in the BRR-DR1 velocities stems from the standard star used for the radial velocity zero-point. In contrast to BRR-DR1, where a star from the BRAVA survey was used as a radial velocity standard, here we set the radial velocity zero point to the APOGEE star 2M18264551-1747096. The radial velocity of this star is better determined than the one used by BRR-DR1, and therefore the velocities presented here should supersede those from BRR-DR1. In Kunder et al. (2018b), the center of the three CaT lines were measured directly by hand, so the agreement between these radial velocities and the ones presented here indicates that our zero-point is much improved from BRR-DR1.
Examples of RRL radial velocity curves are shown in Figure 1, where we show those stars with the largest space velocities, which are discussed further in §5. All radial velocity measurements are presented in Table 1. Table 1 gives the OGLE-ID (1), the RA (2) and Dec (3) as provided by OGLE, the star’s time-average velocity (4), the number of epochs used for the star’s time-average velocity (5), the radial velocity flag (where stars with well-fit radial velocity curves have flag=0 and stars with large scatter around their radial velocity curves are flagged with flag=1) (6), the period of the star (7), -band magnitude (8), the -band magnitude (9) and the -band amplitude (10) as calculated by OGLE, and lastly the distance (see §2.3) adopted for the orbital integration (11).
2.2. Proper motions
With the Gaia DR2 data release (Gaia Collaboration et al. 2018 ), we now have in hand millions of proper motions. These have (for example) the precision to separate bulge RRLs from those RRLs residing in the Sagittarius dwarf galaxy (Sgr) (e.g., Kunder et al., 2019) that otherwise complicate the study of the bulge.
Proper motions of the RRLs are obtained from cross-matching with the Gaia DR2 catalog. To ensure that the cross-match for each RRL is correct in the crowded bulge region of the sky, only the matches with the Gaia flag phot_variable_flag = VARIABLE were kept. We further limited our cross-matches to those stars with the recommended astrometric quality indicators such as the unit weight error (UWE) and the renormalised unit weight error (RUWE), as described by Lindegren (2018). Specifically, only stars with a RUWE 1.4 were kept, where the RUWE of a star was calculated using
| (3) |
Here, is a normalization factor obtained from interpolating the (G) and color of the stars on the table on the ESA DR2 known issues page. The UWE can be calculated using the equation
| (4) |
where is given by the parameter and N is given by the parameter. Our final sample of RRLs with Gaia DR2 astrometry contains 1389 stars out of the 2768 RRLs presented here.
2.3. Distances
One advantage of using RRLs as stellar tracers is that they are relatively well-understood standard candles. Distances for each RRL are calculated using the identical procedure as in Pietrukowicz et al. (2015). First, the photometric metallicities of the stars were found using the following relation from Smolec (2005):
| (5) |
where P is the pulsation periods of the stars and is a Fourier phase combination for the cosine decomposition for the -band light curves of the stars. The photometric metallicities indicate a sharply peaked RRL metallicity distribution at = 1.02 dex, with a dispersion of 0.25 dex (Pietrukowicz et al., 2012, 2015). These photometric metallicities were then used to find their absolute magnitudes, and , using theoretical relations from Catelan et al. (2004):
| (6) |
| (7) |
where
| (8) |
Because we use instead of , we are not taking into account any effect of an enhancement in -capture elements with respect to a solar-scaled mixture. This is because there are no studies that have been carried concerning the -abundances of bulge field RRLs (note that the study by Hansen et al. 2016 concerned one RRL in the direction of the bulge that is thought to be a halo interloper and not a bonafide bulge field RRL star). Also, even assuming the bulge RRL are considerably enhanced with =0.6, this would change our log by 0.5, resulting in a distance change of 2%. A more modest enhancement of =0.2 would change our log by 0.15, resulting in a distance change of 0.5%.
The reddening along the line of sight of the star is obtained using the following relation from Nataf et al. (2013):
| (9) |
where and are the OGLE mean magnitudes of the RRL in the and passbands, respectively, and is the reddening from Gonzalez et al. (2012). Lastly, the distance can be found using
| (10) |
Assuming for all RRLs changes the individual distances by 1.5%. Assuming for all RRLs changes the individual distances by 5%, and the distances to smaller/closer values. Assuming for all RRLs changes the individual distances by 8%, shifting the distances to further/larger values. The 10% uncertainty in distance, as assumed throughout this paper, is not dominated by the uncertainties in metallicity, but rather the uncertainties in reddening and in the theoretical and relations. In this paper, the RRL distances are used mainly to compare the RRLs to each other ( those RRLs with distances closest to the Galactic center and those with distances farther from the Galactic center). Relative distances are not as independent on the exact zero-point used in .
From the RRLs studied here, we find a median distance of 8.48 kpc, with a standard deviation of 1.6 kpc. It has been shown by Pietrukowicz et al. (2015) that when projecting the individual distances using this method onto the Galactic plane (by cos ) and scaling the distribution by d-2 to compensate for the “cone effect” (, where more objects are seen at larger distances inside a solid angle), a distance to the Galactic center of 8.27 kpc0.008(stat)0.40(sys) kpc is obtained. They also show that using other absolute magnitude relations, e.g., Marconi et al. (2015); Bono et al. (2007), do not affect the distance determinations significantly.
3. Orbits
For the orbital analysis, we employed a non-axisymmetric model for the Galactic gravitational potential. The model has an axisymmetric background made by an exponential disk built from the superposition of three Miyamoto-Nagai potentials (Miyamoto & Nagai, 1975) following the recipe by Smith et al. (2015), and a Navarro-Frenk-White density profile (Navarro et al., 1997) to model the dark matter halo, which has a circular velocity km s-1 at kpc (Bland-Hawthorn & Gerhard, 2016). A triaxial Ferrer’s bar potential is superimposed on the axisymmetric background. The total bar mass is , an angle of with the Sun-major axis of the bar, a pattern speed of the bar of km s-1 kpc (Portail et al., 2017; Pérez-Villegas et al., 2017b), and a major axis extension of 3.5 kpc.
As the bar mass is still under debate, the adopted bar mass () comes from the dynamical models by (Portail et al., 2015b). These models reproduce the kinematics from the BRAVA survey (Rich et al., 2007; Kunder et al., 2012). The angle of 25∘ with the Sun-major axis of the bar is based on OGLE-II red clump giant stars (Rattenbury et al., 2007), this value is in good agreement with the measurement obtained from VVV red clump stars (Wegg & Gerhard, 2013). The viral mass of our DM halo is , which is the mass contained within 302 kpc (Pérez-Villegas et al., 2020). This corresponds to a density of 200 times the critical density, in agreement with Abadi et al. (2009) and Irrgang et al. (2013).
Of course, an orbital analysis is not without limitations. The steady potential we adopted includes a triaxial bar, an exponential disk, and a spherical dark matter halo. As a steady model does not evolve with time, we are not able to study secular evolution in the Galaxy and there are no migratory processes that modify the potential. We also do not consider the dynamical contribution due to spiral arms because within 4 kpc from the Galactic center, their effects are negligible. This is because the mass of the spiral arms (5% of the disk mass) is small compared with the bar mass (15-20% of the disk mass). Also, it has been shown that the spiral arms have important dynamical effects between 3-10 kpc, the radii they dominate (e.g., Allen et al., 2008; Antoja et al., 2011).
Some fraction of the inner bulge could be due to accretion events of satellite galaxies. If the accretions happened before bar formation, the distribution and dynamics of the accreted material will be gravitationally affected by the bar formation and could be trapped by the bar to give it orbital support. With an existing bar component, stars that reach the bulge/bar region because of a disrupting satellite galaxy due to dynamical friction, will still keep their dynamical memory from their origin, but that memory could be deleted by secular evolution with time. With the model we use, we cannot take such processes into account.
The greatest limitation of our steady potential is that we cannot follow the secular evolution of structure formation within the Milky Way. Therefore, there is little difference in the orbital parameters when integrating forward or backward in time. In an attempt to mitigate the effects of a changing potential, we integrated the orbits for 5 Gyr. Cosmological simulations of Milky-Way-like galaxies (e.g., Buck et al., 2018) and analysis of field stars (e.g., Bovy et al., 2019) show that the Galactic bar likely formed about Gyr ago. This is when the Galactic potential would have had the most significant change, and our orbital integrations avoid this time period. Some Galactic regions may have had chaotic behavior even after bar formation. In these regions, forward and backward integration would not be same. This is beyond the scope of our study.
The velocity components of the Sun with respect to the local standard of rest are = (11.1, 12.24, 7.25) km s-1 (Schönrich et al., 2010), where U, V, W, are positive in the direction of the Galactic center, Galactic rotation, and North Galactic Pole, respectively. To estimate the effect of the uncertainties associated to the observational data, we generate a set of 100 initial conditions for each RRL, using a Monte Carlo method, where we take into account an uncertainty of 10% for the distance determination, an uncertainty of 10 km s-1 for the heliocentric radial velocity, and an uncertainty of absolute proper motion in both components that includes the average of the systematic error of mas yr-1 reported by the Gaia Collaboration et al. (2018). We integrate these initial conditions forward for 5 Gyr.
For each orbit, we calculate the perigalactic distance, apogalactic distance, the maximum vertical excursion from the Galactic plane , and the eccentricity defined by .
4. Rotation Curve
BRR-DR1 was the first to show that the inner Galaxy RRLs do not rotate like the bulge giants that trace out the bar/bulge, and that they also exhibit larger velocity dispersions. Because of the old age of RRLs, they attributed this to the inner Galaxy RRL sample as having formed before the bar/bulge. Since then, the rotation curve of hundreds of metal-poor stars located toward the direction of the bulge confirmed that metal-poor stars have slower rotation and larger velocity dispersions than the bar/bulge giants (Arentsen et al., 2020).
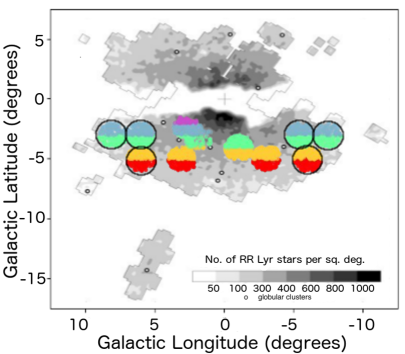
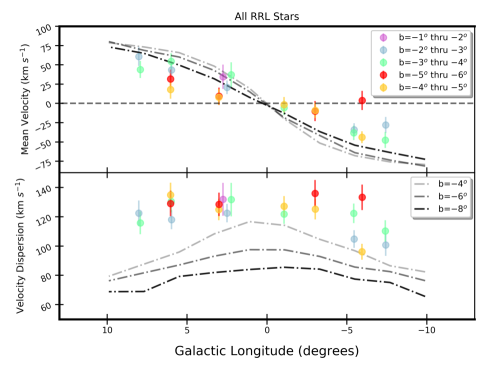
Figure 1 shows the spatial location of the studied RRLs; the new BRAVA-RR fields extend to a Galactic longitude of 5. The rotation curve of these stars is also shown in Figure 1. Here, the heliocentric velocities are corrected to galactocentric velocity, GRV, taking into the solar reflex motion by
| (11) |
where is the mean RRL heliocentric velocity. The bulge model from Shen et al. (2010) is over-plotted on the RRL rotation curve. The Shen et al. (2010) model shows what it is expected for a bulge being formed from the disk and undergoing cylindrical rotation, and is consistent with observations of bulge giants (Kunder et al., 2012; Ness et al., 2016; Zoccali et al., 2014).
In agreement with what was found in BRR-DR1, the inner Galaxy RRLs are not rotating in the same manner as the giants. The cylindrical rotation seen in bar/bulge stars, in a sense that the mean velocity does not change as a function of Galactic latitude, is absent in the bulge RRLs. Instead, the mean velocity decreases as a function of latitude, which would be expected if the RRLs are rotating in a spherical-like manner, or alternatively, if the rotation curve is being contaminated with stars in the thin/thick disk or halo with increasing distance from the plane. In §6 we use proper motions to clean our sample from interlopers to investigate the rotation curve of a purer bulge RRL sample.
5. The Highest Velocity Stars
Since the discovery of hypervelocity stars (Brown et al., 2005), as well as the increase of several large spectroscopic and astrometric surveys, the exploration of stars moving with high velocities within our Galaxy has received growing attention (e.g., Boubert et al., 2018; Hawkins & Wyse, 2018). The RRL radial velocities presented here have a larger velocity dispersion than seen in the previously studied bulge populations (see e.g., Figure 1) making this sample ideal for studying stars with large space velocities.
We turn to those RRLs with full 3D kinematic information (see §3). The space velocity is calculated using:
| (12) |
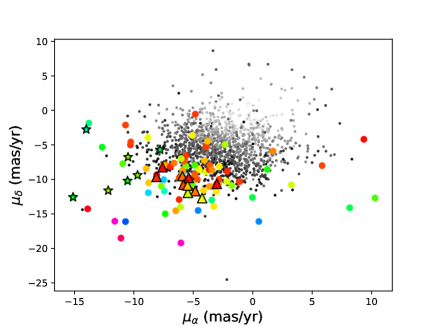
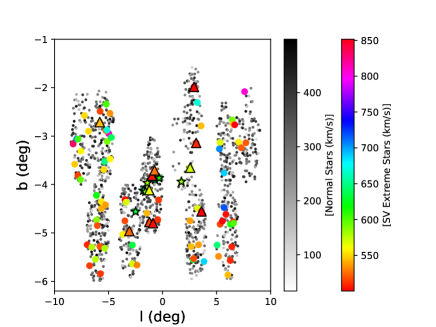
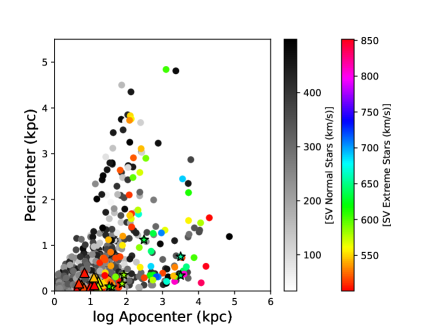
We focus on those stars with space velocities greater than 2.5 from the mean of the distribution. These encompass 7% of the population of RRLs. We tentatively identify two groups of RRLs with similar space velocities and proper motions, but it is difficult to discern if these groups are meaningful. One group of 7 RRL have space velocities of 620 km s-1, proper motions of 10 mas yr-1 and 10 mas yr-1), and also appear to be somewhat spatially aligned (see Fig. 4, right panel). The second group of 11 RRLs stand out because they have apocenters that indicate they may be confined to the bulge (i.e., apocenters less than 3.5 kpc). These stars have space velocities of 500 km s-1 and proper motions of 7 mas yr-1 and 10 mas yr-1). Neither of these two groups of RRLs clump in radial velocity or period, and we do not have sufficient metallicity precision with photometric metallicities to check if they are chemically similar (e.g., Hansen et al., 2016).
Figure 5 shows the apocenters of the RRLs with high space velocities (see §3). Because of the wide range of apocenter distances for our sample, we plot the log of the apocenter distance on the x-axis. In general, the high velocity RRLs are not confined to the inner 3.5 kpc of the Galaxy and are therefore likely not bulge RRLs at all, but belong to the halo. Follow-up spectroscopy of the high velocity stars for detailed abundances would be useful to see if any of these stars have a common origin.
6. Multiple bulge RRL populations
6.1. Bulge Characterization
As was shown by Kunder et al. (2015), not all RRLs in the direction of the Galactic bulge are actually confined to the bulge. This is the case for other metal-poor stars located toward the Galactic bulge as well (e.g., Howes et al., 2015). The stellar density of the bulge, halo and disk populations are all considerable and overlap in the vicinity of the Galactic center. Therefore, obtaining a “pure” sample of bulge stars based on photometry/distance and spatial position alone, which is the usual approach when selecting bulge targets, is not statistically probable. With Gaia DR2 and taking advantage of RRLs being standard candles, we are in position to use an orbital analysis to probe which RRLs are confined to the inner Galaxy, and which ones are interlopers.
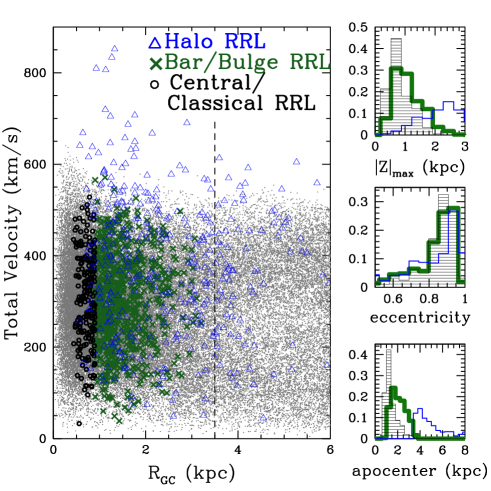
Figure 6 (left panel) shows the galactocentric distances of the RRLs in our sample, overlaid on particles from the R1 Milky Way Galaxy simulation333http://uclandata.uclan.ac.uk/167/, where a bar/bulge forms via the disk undergoing the usual buckling instability (Gardner et al., 2014). This model was designed to understand bulge formation mechanisms by tracing kinematic and spatial characteristics of individual particles/stars (e.g., Debattista et al., 2005), so is therefore not fully cosmological; it is a collisionless simulation with no gas, and the dark matter halo is a rigid potential. This model developed a strong peanut structure (Debattista et al., 2005) and can be used to explore the nature of the X-shape of the Milky Way bulge (e.g., Gardner et al., 2014). We scale the model with respect to the Local Standard of Rest and for the RRLs, we assume a Sun-Galactic Centre distance of 8.2 kpc (Bland-Hawthorn & Gerhard, 2016). Stars designated as halo stars have apocenter distances which are greater than 3.5 kpc, and stars that belong to the bulge have apocenter distances which are smaller than 3.5 kpc (see §3).
It has already been shown that a break in the mean density distribution at a distance of 0.5 kpc from the center is evident in the bulge RRLs (Pietrukowicz et al., 2012), and this suggests there may be a difference between the RRLs closest to the Galactic center and those further out. We separate the RRLs into those spatially closest to the center of the Galaxy (black circles, , and those farther out (crosses, . The division between centrally concentrated RRLs and bar/bulge RRLs was made in order to obtain a sample of RRLs that is as centrally confined as possible but with still enough stars to carry out a statistical analysis of spatial and kinematic properties. Ideally, we would use a division at kpc, but our BRAVA-RR sample does not have a statistical sample of stars with kpc. OGLE-IV avoids the plane of the Galaxy, so the OGLE-IV RRL sample contains essentially no stars with kpc, and peaks at 1 kpc (Pietrukowicz et al., 2015).
The RRLs that are more centrally concentrated ( kpc) have different orbital properties than those that are not ( kpc): the more centrally concentrated RRL have smaller vertical excursions, distances and have apo- and pericenter distances that indicate their orbits are tightly bound. Both populations of RRLs have very few RRLs with eccentricities smaller than 0.5, As we show below, these two populations, both which are of the bulge in a sense that they are confined within the central 3.5 kpc of the Milky Way, represent distinct Galactic components that overlap in the inner Galaxy.
Our division between bar/bulge RRLs and central/classical bulge RRLs almost certainly does not cleanly separate these two components; some RRLs at greater distances from the Galactic center could still belong to the classical bulge component. A cleaner separation may be possible with inclusion of metallicity information.
6.2. Spatial and Kinematic Distribution
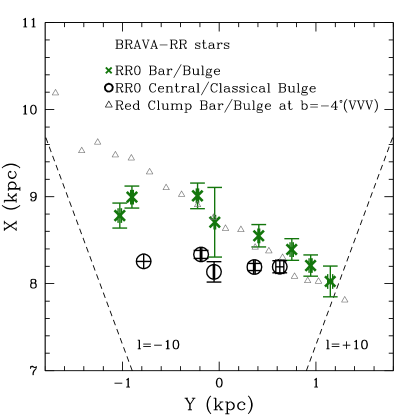
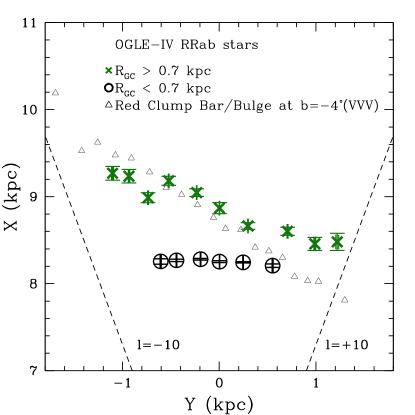
The spatial distribution of the two bulge stellar populations are shown in Fig. 7, and the bar as traced from VVV red clump stars (taken from Gonzalez et al., 2012) is also shown. The top panel shows the spatial distribution of the 1389 RRLs we have space velocities for, as we can clean halo interlopers from this sample. In the bottom panel we can increase the statistics by a factor of 20 by using the full OGLE-IV bulge RRL sample (although 10% of the stars in this sample are halo interlopers). The results are the same–the bar/bulge RRLs trace an inclined prominent bar, similar to the distribution of red-clump giants in the bulge (see also, e.g., Stanek et al., 1997; Cao et al., 2013). In contrast, the central/classical bulge RRLs do not. That there are two populations of bulge RRLs, one that has a bar-shaped spatial distribution and one that does not could resolve disagreement for the axisymmetric RRL geometry seen using near-infrared VVV observations(Dékány et al., 2013), and the view provided from optical OGLE photometry, in which the RRLs do appear to follow the elongated spatial distribution of the bar (Pietrukowicz et al., 2015).
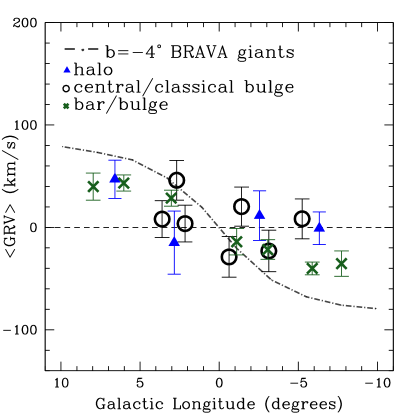
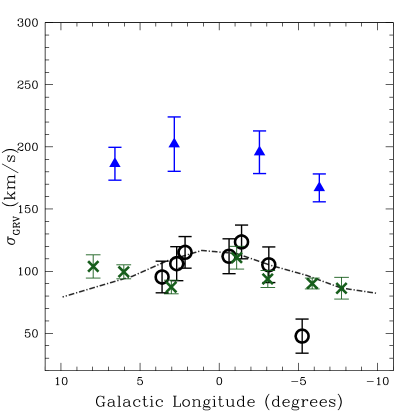
In Figure 8, the rotation curve of the central/classical bulge RRLs and the bar/bulge RRLs is shown. The bar/bulge RRLs rotate in a similar fashion to the giants (Ness et al., 2013; Kunder et al., 2012; Zoccali et al., 2014; Ness et al., 2016), whereas the central/classical bulge RRLs deviate slightly from this curve. The central/classical bulge rotates more similar to the halo stars passing through the inner Galaxy, although they have a considerably lower velocity dispersion. The velocity dispersion of the halo found in the inner Galaxy agrees with models that suggest an exponentially increasing velocity dispersion with decreasing distance from the center of the Galaxy (Battaglia et al., 2005).
Both bulge RRL populations have similar velocity dispersions of 100 km s-1. This is important when considering if kinematic fractionation (Debattista et al., 2017) is the explanation for the two different RRL populations. In this scenario, all stars originate from the disk but, due to having different ages (difference of 1.5-2 Gyr) and initial velocity distributions, are manifest differently into the box/peanut bulge. For example, kinematic fractionation could give rise to a weakly barred spatial distribution for a hotter and older initial population and a barred spatial distribution for a cooler and younger population. We do not observe that the central RRLs have a larger velocity dispersion as compared to the bar/bulge RRLs, although our velocity dispersions are subject to the exact selection criteria of the two populations, and this is not perfect.
It is also not believed that the age spread of the inner Galaxy RRL population is 2 Gyr. This is because the horizontal branch morphology changes as a function of metallicity and this correspondingly changes the frequency of stars that will fall on the instability strip. Age differences of a few billion years produce dramatic changes in the morphology of the HB (see e.g., Lee, 1992, Fig. 6) and because the metallicity distribution of the bulge RRL is strongly peaked at 1.0 dex with a dispersion of 0.3 dex (Walker & Terndrup, 1991; Kunder et al., 2008; Pietrukowicz et al., 2015), this can be reproduced with these RRLs having a small age spread of 1 Gyr or less (Lee, 1992; Lee & Jang, 2016). An age spread larger than this would cause a wider spread of in the bulge RRLs than what is currently observed. It may be that kinematic fractionation does occur with a smaller age range than 1.5-2 Gyr (Debattista, private comm.) which would then alleviate this tension. Further and more detailed simulations of kinematic fractionation may prove successful in reproducing the RRL results presented here.
The high velocity dispersion of the inner Galaxy RRLs first reported in data release 1 (DR1) of BRAVA-RR (Kunder et al., 2016) arose from halo interlopers passing through the inner Galaxy, that now, with Gaia, we are able to isolate. It is likely that similarly high velocity dispersions seen from samples of very metal-poor stars (1.5 dex) toward in the bulge by e.g., Arentsen et al. (2020) are also caused by a large fraction of halo interlopers that were not able to be cleaned from the sample do to uncertainties in finding distances to these stars. The Gaia DR2 distances from parallaxes (e.g., Bailer-Jones et al., 2018) have typical uncertainties that are 40% or larger for stars at distances of the bulge. Further, bonafide bulge stars have been shown to have parallax distances peaking at a distance of 5 kpc instead of at 8 kpc (Kunder et al., 2019; Arentsen et al., 2020).
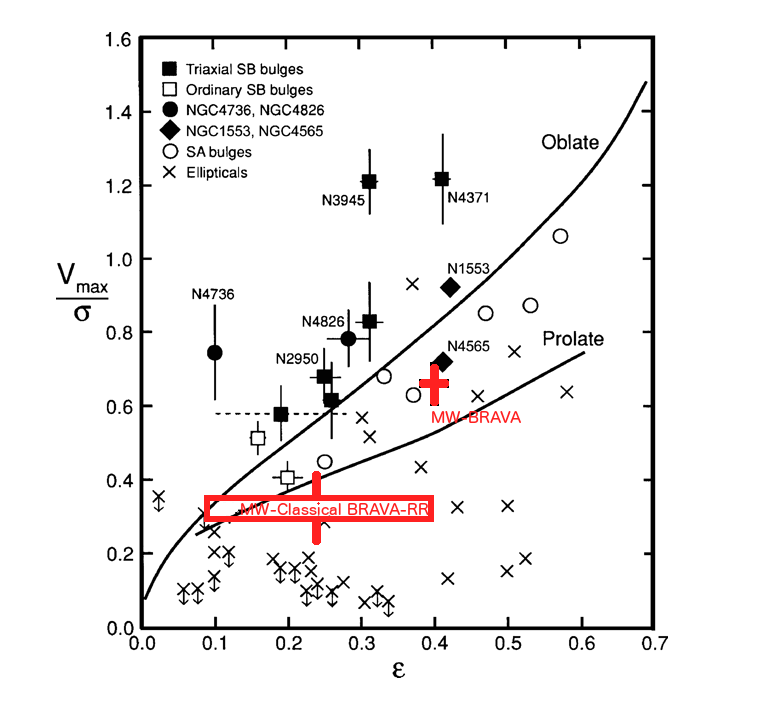
One method commonly used to categorize bulges into classical and pseudobulges is to use the parameter (Kormendy & Kennicutt, 2004). This can be plotted against , the apparent flattening of the bulge, to be used to classify the nature of bulge systems (see Fig. 9). Pseudobulges, i.e., bulges formed via secular processes, have in general , whereas those that are formed via mergers, like classical bulges or ellipticals, have (Kormendy & Kennicutt, 2004).
The BRAVA survey showed that the bar/bulge that dominates the mass of the inner Galaxy has a (Howard et al., 2008). Given the agreement of both the BRAVA radial velocities and radial velocity dispersions to the ARGOS, GIBS and APOGEE surveys, the uncertainty in this value is likely smaller than this. Adopting the Weiland et al. (1994) minor-to-major axis ratio of 0.6 for , our Milky Way pseudobulge is similar to that of NGC 4565, a well-known edge-on spiral with a peanut-shaped bulge. This value is below the most rapidly rotating bars and pseudobulges due to its minor-to-major axis ratio (see Fig. 9). We do not attempt to find a new parameter using the bar/bulge RRLs presented here for the following reasons: (1) our BRAVA-RR sample is more than an order of magnitude smaller than the BRAVA sample so we don’t have the statistics of other radial velocity surveys, (2) our selection between bar/bulge RRLs and central/classical bulge RRLs is almost certainly not exact, so our bar/bulge RRL sample is likely contaminated and (3) the ARGOS, GIBS and APOGEE surveys find almost identical radial velocities and radial velocity dispersions, so the from all large radial velocity surveys agree with that found from BRAVA.
To probe the properties of the central/classical bulge using the parameter, we adopt =100-120 km s-1 for the velocity dispersion and 20-40 km s-1 for the rotation speed of the central bulge. Therefore the central bulge component has . The minor-to-major axis ratio of the central bulge component has not been measured, but as is thought to be more spherical than the bar/bulge, is likely less than 0.4. We have checked the Auriga simulations (e.g., Fragkoudi et al., 2019; Blázquez-Calero et al., 2020) for an indication on the minor-to-major axis ratio for a classical/accreted population of stars in boxy/peanut bulge. These simulations do indicate that an accreted population of stars should also exist in boxy/peanut bulges, and that the fraction of accreted stars in the boxy/peanut region can be between 13% to 80% for stars with metallicities of 1 dex (similar to the RRLs), and between 0.2%-10% for stars with all metallicities. Unfortunately, a specific value of minor-to-major axis ratio for the accreted part of the bulge is not evident from these simulations, so the uncertainty on is substantial. Therefore, the of the central/classical bulge is in good agreement with ellipticals and a prolate stellar distribution. A quantitative measurement of for the spheroidal part of the bulge would be useful.
6.3. Pulsation properties
It has been shown that there are two sequences of RRLs manifest on the period-amplitude diagram (Pietrukowicz et al., 2015). A Kolmogorov-Smirnov (K-S) goodness-of-fit test was carried out to establish whether one can reject the null hypothesis that the periods of the inner ( 0.9 kpc) and outer (3.5 kpc 1.5 kpc ) RRLs come from the same distribution. The KS test on the full OGLE-IV sample of RRL returns a probability of 0.0004, below the default threshold 0.05 below which one rejects the null hypothesis. Changing the distance of the outer RRLs to 0.9 kpc (instead of 1.5 kpc) results in KS test probability of 0.02. Therefore, the pulsation properties of the central/classical RRLs appear to be different than the bar/bulge RRLs. In particular, a visual inspection shows that the bar/bulge RRL population exhibits more of a continuum of periods, whereas the central/classical RRLs exhibits a stronger double sequence in the period amplitude diagram.
The double-sequence in the period-amplitude diagram was recently interpreted to indicate that the bulge RRLs are an accreted population that formed from primordial building blocks in a hierarchical merging paradigm (Pietrukowicz et al., 2015; Lee & Jang, 2016). This is because such a double-sequence was linked to the same process of the multiple population phenomena seen in globular clusters (Romano et al., 2010; Tenorio-Tagle et al., 2015). So one period-amplitude sequence would be formed from the pristine gas in these building blocks that was globally enriched by supernovae. The second sequence would be formed as the stars were enriched by the helium-rich winds of the first-generation of massive stars(Romano et al., 2010; Tenorio-Tagle et al., 2015). One test of this controversial interpretation would be to find globular cluster origin signatures, such as Na-O anticorrelations, in the bulge RRLs accreted in the early merger.
There are few RRLs in bulge globular clusters (GCs), since bulge GCs are more metal-rich than GCs in the halo or disk, and RRLs preferentially form in metal-poor systems. The bulge GCs with the most RRLs are NGC 6441 and NGC 6388; these GCs are unusual in a sense that they not only have a large number of RRLs for their high metallicity (each of these GCs has 30 RRL; Clement et al., 2001), but because the periods of these RRLs are longer than seen else where in the Galaxy (Pritzl et al., 2001, 2003). Very few field bulge RRLs have periods and amplitudes similar to those seen in NGC 6441 and NGC 6388 (e.g., Pietrukowicz et al., 2015; Kunder et al., 2018b), and it is unclear how NGC 6441 and NGC 6388 fit into the formation scenario of the MW (e.g., Bellini et al., 2013).
There are 35 RRLs in the OGLE-IV dataset in the bulge GCs NGC 6401, NGC 6553, NGC 6642, NGC 6304, NGC 6522, NGC 6453 and NGC 6569. With such small numbers, it is not easy to come to conclusions on the similarity of the bulge GC RRLs to the field bulge RRLs based on periods and amplitudes alone.
Distinct period-amplitude sequences, such as seen in the bulge field RRL and the GC RRLs, have not been reported within the field RRLs in the MW (e.g., Fabrizio et al., 2019). This is likely because the metallicity distribution of RRLs in the MW field spans a larger range in than that of both the MW bulge RRL population and the MW GC RRL population (e.g., Fabrizio et al., 2019)
High amplitude short period (HASP) RRLs are signatures of massive systems with rapid metal enrichment (e.g., Fiorentino et al., 2015). The fraction of HASP RRLs, , for the OGLE-IV RRL with both 0.9 kpc and for the RRL with 3.5 kpc 0.9 kpc is =15%. This is larger than the =11% found for the halo RRLs at a distance of 5 kpc from the Galactic center (Belokurov et al., 2018). Limiting ourselves to only those RRL in the BRAVA-RR sample, which has the advantage that halo RRLs are cleaned from the sample, the fraction of HASP in the central/classical RRL is =19% compared to =15% for the bar/bulge RRL. These high fractions suggests that both the inner and the outer bulge RRLs had early chemical enrichment histories, and were formed in a dissimilar manner to the surviving Galactic dwarf spheroidals (which have 6% or smaller). Both the bar/bulge and any potential centrally located classical bulge must have been made primarily from progenitor galaxies larger than those that survived to become today’s dwarf spheroidals.
7. Discussion and Conclusions
Within the RRL population, we find evidence for two separate components with distinct spatial distributions and marginally different kinematics. One explanation for these components is that they formed from disk buckling and ended up with different spatial distributions due to having slightly different ages and initial velocity distributions, kinematic fractionation (Debattista et al., 2017). Our observations that may conflict with this explanation is that the velocity dispersions of our two components are similar, and the age spread in the bulge RRLs is thought to be 1 Gyr or less (Lee, 1992), whereas the age spread in kinematic fractionation is thought to be twice this. Still, at early times in the formation of the Galaxy, heating is very rapid, so it may be that an age difference less than 2 Gyr is sufficient for kinematic fractionation to give rise to two different spatial distributions of inner Galaxy stars. The observational constraints presented here on the RRL velocity dispersion and age range will be valuable in determining the plausibility of producing a compact bulge component from a pure disk simulation under the kinematic fractionation framework.
Another explanation is that the barred RRL component rotating in a similar manner to the red clump and red giant branch stars formed with these stars, when the disk buckled to form the bar/bulge (in situ formation). The more axisymmetric component, which is more centrally concentrated, is then antecedent to the formation of the bar. In this case, the more central RRLs trace an older, more spheroidal component that can be identified with an accreted component formed in the early universe.
Our results from the RRLs are similar in some respects to those recently reported by Grady et al. (2019), who find that the Mira population toward the inner Galaxy can also be separated into two components. The young/metal-rich Miras (5-8 Gyr) exhibit a boxy/peanut like morphology with a characteristic X-shape, whereas the old Miras (9-10 Gyr) are constricted radially, with little evidence for them being part of a bar-like structure. They interpret this to the bar/bulge having buckled 8-9 Gyr ago, and therefore the younger Miras are part of the bar and the older Miras are not. From a stellar evolution view point, the age spread of the inner Galaxy RRLs is not nearly as large as that of the Miras. It is striking that we see two populations of RRLs despite their much smaller spread of ages, and it is difficult to reconcile this with a bar formation and buckling taking place 8-9 Gyr ago. This is because we see here ( Fig 7) that a large fraction of the bulge RRLs also belong to the bar/bulge, and RRLs are only formed in systems older than 10 Gyr (Walker, 1992; Lee, 1992).
Although RRLs represent only 1% of the Galactic bulge population (Pietrukowicz et al., 2012; Nataf et al., 2013) it need not mean that the classical bulge is a trace component. There may be other stars with low metallicities that trace these kinematics but that do not evolve through the RR Lyrae phase and that are difficult to disentangle from the other stars of those metallicities in the bulge. With the bulge RRLs, we can sample old, metal-poor stars in an efficient manner and use a sample for which good distances to trace ancient populations in the bulge, but these stars may not the only constituents of the classical bulge. Using proper motions of 40 million predominantly red giant branch and red clump stars in the bulge, Clarke et al. (2019) find no evidence for a separate, more axisymmetric, classical bulge component dominating in the central parts of the bulge. This could be because the kinematic signature of the axisymmetric/classical bulge RRLs and the bar/bulge RRLs is more subtle than their spatial signatures so it went unnoticed in Clarke et al. (2019) ( the kinematics presented in Fig 8 is not as distinct as the spatial distribution presented in Fig. 7). Alternatively, it may be that the axisymmetric/classical bulge is a trace component in the bulge.
At face value, our observations do not agree with the modern bulge models which include an initial classical bulge such as in , Gardner et al. (2014), their models B2 and B3. In particular, these models do not predict that a classical bulge would be as prominent in the central part of the Galaxy as what we are seeing within the bulge RRL population (see also Pietrukowicz et al., 2012). However, the RRLs trace the oldest and metal-poor stars and these models are composed of stars of all ages and metallicities; we do not have the ability to separate the stars in these models by ages (or metallicities).
In the cosmological hydrodynamical simulation of Buck et al. (2018), in which stars are separated by ages, we also don’t easily find agreement with the observations presented here. The simulation by Buck et al. (2018) indicates that all stars with ages 10 Gyr form a roughly spheroidal and non-barred distribution of stars in the central few kpc of the Galaxy; only stars with ages 8 Gyr or younger contribute to the bar. All of the bulge RRLs must be older than 10 Gyr (e.g., Lee, 1992), but as we have shown, they are not all part of a spherical/unbarred bulge. Instead, it appears that within the oldest (10 Gyr) populations of stars in the bulge, there are at least two groups with different spatial distributions and kinematics.
The existing model that perhaps fits our observations best is from Saha et al. (2016). These authors have shown that a massive classical bulge can gain some angular momentum from the bar. The induced rotation is small in the center, but is significant beyond 2 bulge half mass radii. Because the centrally concentrated RRL do show some rotation at the larger longitudes, this could be interpreted as these stars belonging to a relatively massive classical bulge. Low-mass classical bulges would follow the cylindrical rotation even at the center (Saha et al., 2012). We do not attempt to estimate the mass of the classical bulge here; we leave this for future studies, that may take into account a variety of bulge formation models and their evolution through time, incorporating the newly available Gaia proper motion observations of most of the bulge stars.
| OGLE ID | R.A. (J2000.0) | Decl. (J2000.0) | (km s-1) | # Epochs | Flag | Period (d) | distance (kpc) | |||
| 01743 | 17 43 38.31 | 34 28 23.30 | 85 | 3 | 0 | 0.5314405 | 18.19 | 16.55 | 0.687 | 12.4 |
| 01773 | 17 43 49.26 | 34 24 13.40 | 147 | 3 | 0 | 0.4375252 | 18.35 | 16.78 | 0.781 | 9.9 |
| 01806 | 17 44 0.89 | 34 27 30.40 | 24 | 1 | 0 | 0.5615170 | 17.93 | 16.26 | 0.535 | 8.3 |
| 01860 | 17 44 18.85 | 34 28 13.70 | 62 | 1 | 0 | 0.5062415 | 18.13 | 16.71 | 0.765 | 10.7 |
| 01862 | 17 44 19.49 | 34 19 38.60 | 171 | 1 | 0 | 0.4645364 | 18.72 | 17.08 | 0.761 | 11.2 |
| 01873 | 17 44 22.58 | 34 19 6.10 | 61 | 3 | 0 | 0.4239042 | 18.56 | 16.84 | 0.827 | 9.2 |
| 01938 | 17 44 46.95 | 34 23 58.00 | 22 | 3 | 0 | 0.5459384 | 18.58 | 16.97 | 0.573 | 11.6 |
| 01983 | 17 45 1.83 | 34 11 27.70 | 32 | 2 | 0 | 0.4759508 | 18.05 | 16.37 | 0.544 | 7.9 |
| 02000 | 17 45 5.33 | 35 50 53.20 | 12 | 2 | 0 | 0.4803552 | 17.98 | 16.53 | 0.859 | 9.8 |
| 02016 | 17 45 7.56 | 35 21 22.90 | 65 | 2 | 0 | 0.5553001 | 17.35 | 15.81 | 0.472 | 7.2 |
References
- Abadi et al. (2009) Abadi, M. G., Navarro, J. F., & Steinmetz, M. 2009, ApJ, 691, L63
- Alam et al. (2015) Alam, S., Albareti, F.D., Allende Prieto, C. et al. 2015, ApJS, 219, 12
- Alcock et al. (1998) Alcock, C., et al. 1998, ApJ, 492, 190
- Allen et al. (2008) Allen, C., Moreno, E., & Pichardo, B. 2008, ApJ, 674, 237
- Antoja et al. (2011) Antoja, T., Figueras, F., Romero-Gómez, M., et al. 2011, MNRAS, 418, 1423
- Arentsen et al. (2020) Arentsen, A., Starkenburg, E., Martin, N.F., Hill, V., Ibata, R., Kunder, A. et al. 2020, MNRAS, 491, 11
- Babusiaux et al. (2010) Babusiaux, C., Gómez, A., & Hill, V. et al. 2010, A&A, 519, A77
- Bailer-Jones et al. (2018) . Bailer-Jones, C. A. L., Rybizki, J., Fouesneau, M., Mantelet, G. & Andrae, R. 2018, AJ, 156, 58
- Barbuy, Chiappini & Gerhard (2018) Barbuy, B., Chiappini, C., & Gerhard, O. 2018, ARA&A, 56, 223
- Battaglia et al. (2005) Battaglia, G., et al. 2005, MNRAS, 364, 433
- Bellini et al. (2013) Bellini, A., Piotto, G. Milone, A.P. et al. 2013, ApJ, 765, 32
- Belokurov et al. (2018) Belokurov, V., Erkal, D., Evans, N. W., Koposov, S. E. & Deason, A. J. 2018, MNRAS, 478, 611
- Binney & Tremaine (2008) Binney, J., & Tremaine, S. 2008, Galactic Dynamics: Second Edition (Galactic Dynamics: Second Edition, by James Binney and Scott Tremaine. ISBN 978-0-691- 13026-2 (HB). Published by Princeton University Press, Princeton, NJ USA, 2008.)
- Bland-Hawthorn & Gerhard (2016) Bland-Hawthorn J., Gerhard O., 2016, ARA&A, 54, 529
- Blázquez-Calero et al. (2020) Blázquez-Calero, G., Florido, E., Pérez, I. et al. 2020, MNRAS, 491, 1800
- Bobylev & Bajkova (2017) Bobylev, V.V. & Bajkova, A.T., 2017, ARep, 61, 551
- Bono et al. (2007) Bono, G., Caputo, F., & di Criscienzo, M. 2007, A&A, 476, 779
- Bovy et al. (2012) Bovy, J., Allende Prieto, C., Beers, T. C. et al. I 2012, ApJ, 759, 131
- Bovy (2015) Bovy, J. 2015, ApJS, 216, 29
- Bovy et al. (2019) Bovy, J., Leung, H. W., Hunt, J. A. S., et al. 2019, MNRAS, 490, 4740
- Boubert et al. (2018) Boubert, D., Guillochon, J., Hawkins, K., Ginsburg, I., Evans, N. W. & Strader, J. 2018, MNRAS, 479, 2789
- Brown et al. (2005) Brown W. R., Geller M. J., Kenyon S. J., Kurtz M. J., 2005, ApJ, 622, L33
- Buck et al. (2018) Buck, T., Ness, M., Maccio, A. Obreja, A., Dutton, A. A. 2018, ApJ, 861, 88
- Cao et al. (2013) Cao, L., Mao, S., Nataf, D., Rattenbury, N. J., Gould, A. 2013, MNRAS, 434, 595
- Carollo et al. (2007) Carollo, D., Beers, T. C., Lee, Y. S., et al. 2007, Nature, 450, 1020
- Casey & Schlaufman (2015) Casey, A.C. & Schlaufman, K.C. 2015, ApJ, 809, 110
- Catchpole et al. (2016) Catchpole, R.M., Whitelock, P.A., Feast, M.W., Hughes, S.M.G., Irwin, M. & Alard, C., 2016, MNRAS, 462, 3765
- Catelan et al. (2004) Catelan, M., Pritzl, B. J., & Smith, H. A. 2004, ApJS, 154, 633
- Chadid, Vernin & Gillet (2008) Chadid, M., Vernin, J., & Gillet, D. 2008, A&A, 491, 537
- Clarke et al. (2019) Clarke, J. P., Wegg, C., Gerhard, O., Smith, L.C., Lucas, P.W., Wylie, S.M. 2019, MNRAS, 489, 3519
- Clarkson et al. (2018) Clarkson, W. I., Calamida, A., Sahu, K. C. et al. 2018, ApJ, 858, 46
- Clement et al. (2001) Clement, C.M., Muzzin, A., Dufton, Q. et al., 2001, AJ, 122, 2587
- Debattista et al. (2005) Debattista, V.P, Carolloa, C.M., Mayer, L. & Moore, B., 2005, ApJ, 628, 678
- Debattista et al. (2017) Debattista, V.P, Ness, M., Gonzalez, O.A., Freeman, K. Zoccali, M. & Minniti, D., 2017, MNRAS, 469, 1587
- Dehnen (2000) Dehnen W., 2000, AJ, 119, 800
- Dékány et al. (2013) Dékány, I., Minniti, D., Catelan, M., Zoccali, M., Saito, R. K., Hempel, M., Gonzalez, O. A. 2013, ApJL, 776, L19
- Dékány et al. (2018) Dékány, I., Hajdu, G., Grebel, E. K. et al. 2018, astro-ph: 1804.01457
- Eggen & Sandage (1959) Eggen, O.J., & Sandage, A.R. 1959, MNRAS, 119, 255
- Fabrizio et al. (2019) Fabrizio, M., Bono, G., Braga, V. F. et al. 2019, ApJ, 882, 169
- Fiorentino et al. (2015) Fiorentino, G., Bono, G., Monelli, M. et al. (2015), ApJ, 798, 12
- Fragkoudi et al. (2019) Fragkoudi, F., Grand, R. J. J., Pakmor, R. et al. 2020, arXiv:1911.06826
- Freeman et al. (2013) Freeman, K., Ness, M., Wylie-de-Boer, E., Athanassoula, E., Bland-Hawthorn, J., Asplund, M., Lewis, G., Yong, D., Lane, R., Kiss, L. & Ibata, R. 2013, MNRAS, 428, 3660
- Gaia Collaboration et al. (2018) Brown, A. G. A., Vallenari, A., et al. 2018, arXiv:1804.09365
- García Pérez et al. (2013) García Pérez, A. E., Cunha, K., Shetrone, M.,2013, ApJL, 767, 7
- Gardner et al. (2014) Gardner, E. Debattista, V.P., Robin, A.C., Vasquez, S. & Zoccali, M. 2014, MNRAS, 438, 3275
- Gonzalez et al. (2012) Gonzalez, O. A., Rejkuba, M., Zoccali, M., Valenti, E., Minniti, D., Schultheis, M., Tobar, R. & Chen, B. 2012, A&A, 543, 13
- Grady et al. (2019) Grady, J., Belokurov, V. Evans, N.W. 2019: arXiv:1912.02816v1
- Hansen et al. (2016) . Hansen, C.J., Rich, R.M., Koch, A., Xu, S. Kunder, A. & Ludwig, H.-G. 2016, A&A, 590, 39
- Hawkins & Wyse (2018) Hawkins, K. & Wyse, R.F.G. 2018, MNRAS, 481, 102
- Helmi et al. (2018) Helmi, A., Babusiaux, C., Koppelman, H. H., Massari, D., Veljanoski, J., Brown, A. G. A. 2018, Natur, 563, 85
- Howard et al. (2008) Howard, C. D., et al. 2008, ApJ, 688, 1060
- Howard et al. (2009) Howard, C.D., Rich, R.M., Clarkson, W. et al. 2009, ApJ, 702, 153
- Howes et al. (2014) Howes, L. M., Asplund, M., Casey, A, R., et al. 2014, MNRAS, 445, 4241
- Howes et al. (2015) Howes, L.M., Casey, A.R., Asplund, M., et al. 2015, Nature, 527, 484
- Howes et al. (2016) Howes, Louise M., Asplund, Martin, Keller, Stefan C. Monthly Notices of the Royal Astronomical Society, 460, 884
- Irrgang et al. (2013) Irrgang, A., Wilcox, B., Tucker, E., et al. 2013, A&A, 549, A137
- Johnson et al. (2012) Johnson, C.I., Rich, R. M., Kobayashi, C. & Fulbright, J. P. 2012, ApJ, 749, 175
- Johnson & Soderblom (1987) Johnson D. R. H., Soderblom D. R., 1987, AJ, 93, 864
- Jurcsik & Kovács (1996) Jurcsik, J. & Kovács, G. 1996, A&A, 312, 111
- Kinman et al. (2012) Kinman, T. D., Cacciari, C., Bragaglia, A., Smart, R. & Spagna, A. 2012, MNRAS, 422, 2116
- Koch et al. (2016) Koch, A., McWilliam, A., Preston, G.W. & Thompson, I. B. 2016, A&A, 587, 124
- Kormendy & Kennicutt (2004) Kormendy, J., & Kennicutt, R. C., 2004, ARAA, 42, 603
- Kunder et al. (2008) Kunder, A. & Chaboyer, B.C. 2008, AJ, 136, 2441
- Kunder et al. (2012) Kunder, A., Koch, A., Rich, R. M., et al. 2012, AJ, 143, 57
- Kunder et al. (2013) Kunder, A., Stetson, P., Cassisi, S., et al. 2013, AJ, 146, 119
- Kunder et al. (2015) Kunder, A., Rich, R. M., Hawkins, K. et al. 2015, ApJ, 808, 12
- Kunder et al. (2016) Kunder, A., Rich, R. M., Koch, A. et al. 2016, ApJ, 821, 25
- Kunder et al. (2018a) Kunder, A., Valentini, E., Dall’Ora, M. et al. 2018a, Space Science Reviews, Volume 214, #5
- Kunder et al. (2018b) Kunder, A., Mills, A., Edgecomb, J. et al. 2018b, AJ, 155, 171
- Kunder et al. (2019) Kunder, A., Tilton, A., Maertens, D. et al. 2019, 877,17
- Lamb et al. (2017) Lamb, M., Venn, K., Andersen, D. et al. 2017, MNRAS, 465, 3536
- Layden et al. (1996) Layden, Andrew C., Hanson, Robert B., Hawley, Suzanne L., Astronomical Journal, 112, 2110
- Lee (1992) Lee, Y.W. 1992, AJ, 104, 1780
- Lee & Jang (2016) Lee, Y.W. & Jang. S. 2016, ApJ, 833, 2
- Lindegren (2018) Lindegren L., 2018, technical note GAIA-C3-TN-LU-LL-124-01
- Liu (1991) Liu, T. 1991, PASP, 103, 205
- Maintz & de Boer (2005) Maintz, G. & de Boer, K.S. 2005, A&A, 442, 229
- Majewski et al. (1994) Majewski, S.R., Munn, J.A. & Hawley, S.L. 2012, ApJ, 427, 37
- Majewski et al. (2012) Majewski, S.R., Nidever, D.L., Smith, V.V. et al. 2012, ApJ, 747, 37
- Marconi et al. (2018) Marconi, M., Bono, G., Pietrinferni, A., Braga, V. F., Castellani, M. & Stellingwerf, R. F. 2018, ApJ, 864, 13
- Marconi et al. (2015) Marconi, M., Coppola, G., Bono, G., et al. 2015, ApJ, 808, 50
- Marconi & Minniti (2018) Marconi, M. & Minniti, D. 2018, ApJ, 853, 20
-
Mateu et al. (2018)
Mateu, C., Read, J.I. & Kawata, D. 2018, MNRAS, 474, 4112
- Miyamoto & Nagai (1975) Miyamoto, M. & Nagai, R. 1975, PASJ, 27, 533
- Nataf et al. (2013) Nataf, D.M., Gould, A., Fouqué, P. et al. 2013, ApJ, 769, 88
- Navarro et al. (1997) Navarro, J. F., Frenk, C. S., & White, S. D. M. 1997, ApJ, 490, 493
- Ness et al. (2013) Ness, M., Freeman, K., Athanassoula, E., et al. 2013, MNRAS, 432, 2092
- Ness et al. (2016) Ness, M., Zasowski, G., Johnson, J. A. et al. 2016, ApJ, 819, 16
- Nissen & Schuster (2010) Nissen, P. E. & Schuster, W. J. 2010, A&A, 511, L10
- Pérez-Villegas et al. (2017a) Pérez-Villegas, A., Portail, M. & Gerhard, O. 2017a, MNRAS, 464, 80
- Pérez-Villegas et al. (2017b) Pérez-Villegas, A., Portail, M., Wegg, C., & Gerhard, O. 2017, ApJ, 840, L2
- Pérez-Villegas et al. (2020) Pérez-Villegas, A., Barbuy, B., Kerber, L. O., et al. 2020, MNRAS, 491, 3251
- Pichardo et al. (2004) Pichardo, B., Marco, M. & Moreno, E. 2004, ApJ, 609, 144
- Pietrukowicz et al. (2012) Pietrukowicz et al. 2012, ApJ, 750, 169
- Pietrukowicz et al. (2015) Pietrukowicz, P., Kozlowski, S., Skowron, J.; et al. 2015, ApJ, 811, 113
- Pawlowski et al. (2011) Pawlowski, M. S.; Kroupa, P.; de Boer, K. S. 2011, A&A, 532, 118
- Portail et al. (2015a) Portail, M., Wegg, C., Gerhard, O., Martinez-Valpuesta, I. 2015a, MNRAS, 448, 713
- Portail et al. (2015b) Portail, M. Wegg, C., & Gerhard, O. MNRAS, 450, 66
- Portail et al. (2017) Portail, M., Gerhard, O., Wegg, C., & Ness, M. 2017, MNRAS, 465, 1621
- Pritzl et al. (2001) Pritzl, B., Smith, H. A., Catelan, M. & Sweigart, A. V. 2001, AJ, 122, 2600
- Pritzl et al. (2003) Pritzl, B., Smith, H. A., Stetson, P.B. et al. 2003, AJ, 126, 1381
- Prudil et al. (2019) Prudil, Z. 2019, in prep.
- Queiroz et al. (2020) Queiroz, A. B. A., Anders, F., Chiappini, C. et al. 2020: arxiv:1912.09778
- Rattenbury et al. (2007) Rattenbury, N. J., Mao, S., Sumi, T., et al. 2007, MNRAS, 378, 1064
- Rich et al. (2007) Rich, R. M., Reitzel, D.B., Howard, C.D. & Zhao, H. 2007, ApJ, 658, 29
- Rojas-Arriagada et al. (2017) Rojas-Arriagada A., Recio-Blanco A., de Laverny, P. et al. 2017, A&A 601, 140
- Rojas-Arriagada et al. (2019) Rojas-Arriagada, A., Zoccali, M., Schultheis, M., Recio-Blanco, A., Zasowski, G., Minniti, D., Jönsson, H. & Cohen, R. E. 2019, A&A, 626, 16
- Rich et al. (2013) Rich, R. M. 2013, in Planets, Stars, and Stellar Systems, Volume 5, ed. T. D. Oswalt & G. Gilmore (New York: Springer), 271
- Romano et al. (2010) Romano, D., Karakas, A. I., Tosi, M., & Matteucci, F. 2010, A&A, 522, 32
- Ruchti et al. (2010) Ruchti, G.R., Fulbright, J.P., Wyse, R.F.G. et al. 2010, ApJL 721, 2
- Saha et al. (2012) Saha, K., Martinez-Valpuesta, I. & Gerhard, O. 2012, MNRAS, 421, 333
- Saha & Gerhard (2013) Saha, K. & Gerhard, O. 2013, MNRAS, 430, 2039
- Saha et al. (2016) Saha, K. Gerhard, O. & Martinez-Valpuesta, I., 2016, A&A, 588, 42
- Sanders & Das (2018) Sanders, J. L. & Das, P. 2018, MNRAS, 481, 4093
- Schönrich et al. (2010) Schönrich, R., Binney, J., & Dehnen, W. 2010, MNRAS, 403, 1829
- Schönrich et al. (2014) Schönrich, R., Asplund, M., Casagrande, L. 2014, ApJ, 786, 7
- Shen et al. (2010) Shen, J., Rich, R. M., Kormendy, J., et al. 2010, ApJ, 720, L72
- Sesar (2012) Sesar, B. 2012, AJ, 144, 114
- Sesar et al. (2013) Sesar, B., Ivezic, Z., Start, J.S., et al. 2013, AJ, 146, 21
- Smith et al. (2015) Smith, R., Flynn, C., Candlish, G. N., Fellhauer, M., & Gibson, B. K. 2015, MNRAS, 448, 2934
- Smolec (2005) Smolec, R. 2005, AcA, 55, 59
- Soto et al. (2007) Soto M., Rich R. M., Kuijken K., 2007, ApJL, 665, L31
- Stanek et al. (1997) Stanek, K.Z., Udalski, A. Szymanski, M., Kaluzny, J., Kubiak, Z.M., Mateo, M., Krzeminski, W. 1997, ApJ, 477, 163
- Tenorio-Tagle et al. (2015) Tenorio-Tagle, G., Muñpz-Tuñón, C., Silich, S., & Cassisi, S. 2015, ApJ, 814, 8
- Valenti et al. (2016) Valenti, E., Zoccali, M., Gonzalez, O. A., Minniti, D., Alonso-García, J., Marchetti, E., Hempel, M., Renzini, A., Rejkuba, M. 2016, A&A, 587, L6
- Yang et al. (2014) Yang, F., Deng, L. Liu, C. et al. 2014, NewA, 26, 72
- Walker & Terndrup (1991) Walker, A.R. & Terndrup, D.M. 1991, ApJ, 378, 119
- Walker (1992) Walker, A.R. 1992, ApJ, 390, 84
- Wegg & Gerhard (2013) Wegg, C. & Gerhard, O. 2013, MNRAS, 435, 1874
- Weiland et al. (1994) Weiland, J. L., Arendt, R. G., Berriman, G. B., Dwek, E., Freudenreich, H. T., Hauser, M. G., Kelsall, T., Lisse, C. M., Mitra, M., Moseley, S. H., Odegard, N. P., Silverberg, R. F., Sodroski, T. J., Spiesman, W. J., Stemwedel, S. W. 1994, ApJL, 425, 81
- Zoccali et al. (2008) Zoccali, M., Hill, V., Lecureur, A., Barbuy, B., Renzini, A., Minniti, D., Gómez, A., Ortolani, S. 2008, A&A, 486,177
- Zoccali et al. (2014) Zoccali, M., Gonzalez, O. A., & Vasquez, S. et al. 2014, A&A, 562, 66
- Zoccali et al. (2017) Zoccali, M., Vasquez, S., Gonzalez, O. A. et al. 2017, A&A, 599, 12
- Zoccali et al. (2018) Zoccali, M., Valenti, E. & Gonzalez, O. A. 2018, A&A, 618, 147