Detecting Perceived Emotions in Hurricane Disasters
Abstract
Natural disasters (e.g., hurricanes) affect millions of people each year, causing widespread destruction in their wake. People have recently taken to social media websites (e.g., Twitter) to share their sentiments and feelings with the larger community. Consequently, these platforms have become instrumental in understanding and perceiving emotions at scale. In this paper, we introduce HurricaneEmo, an emotion dataset of 15,000 English tweets spanning three hurricanes: Harvey, Irma, and Maria. We present a comprehensive study of fine-grained emotions and propose classification tasks to discriminate between coarse-grained emotion groups. Our best BERT (Devlin et al., 2019) model, even after task-guided pre-training which leverages unlabeled Twitter data, achieves only 68% accuracy (averaged across all groups). HurricaneEmo serves not only as a challenging benchmark for models but also as a valuable resource for analyzing emotions in disaster-centric domains.
1 Introduction
Natural disasters cause thousands of deaths and displace hundreds of millions each year (Ritchie and Roser, 2020). These catastrophic events not only induce material destruction but also stir an integral part of being human: our emotions. Disasters adversely affect individuals’ mental states (Fritz and Marks, 1954; Kinston and Rosser, 1974), and therefore it is no surprise that many take to social media (e.g., Twitter) to share their feelings. Social media websites, as a result, have become an essential platform for understanding the expression and perception of emotions at a significantly larger scale Mohammad (2012); Wang et al. (2012); Mohammad and Kiritchenko (2015); Volkova and Bachrach (2016); Abdul-Mageed and Ungar (2017), with far reaching potential influences from academic research to public policy (Dennis et al., 2006; Fritze et al., 2008; Fraustino et al., 2012).
While natural language processing methods have been effective for emotion detection (Strapparava and Mihalcea, 2007), existing resources struggle in disaster-centric domains, in part due to distributional shifts. Emotion detection in natural disasters (e.g., hurricanes) requires implicit reasoning not available as surface-level lexical information. For example, in “of course, [we]1 still have the [storm surge]2 coming,” given the context, we can reasonably infer discontent towards the “storm surge” despite the absence of polarizing words. Therefore, distantly supervised techniques largely based on lexical units (Mohammad and Turney, 2013; Abdul-Mageed and Ungar, 2017) fail to capture this type of deeper semantic phenomena.
Our paper presents a comprehensive investigation into perceived emotions in hurricane disasters. To this end, we introduce HurricaneEmo, a dataset of 15,000 disaster-related tweets (in English) streamed during Hurricanes Harvey, Irma, and Maria, which were devastating tropical storms occurring in the 2017 Atlantic hurricane season (Belles, 2017). Our samples are annotated with fine-grained emotions derived from the Plutchik Wheel of Emotions Plutchik (2001), a well-defined ontology of emotion classes commonly used in computational social science Abdul-Mageed and Ungar (2017).111Specifically, we use Plutchik-8 and Plutchik-24 emotions. We refer readers to Plutchik (2001) for an in-depth discussion on their conception. To measure inter-annotator agreement on fine-grained emotion labels, we conceptualize the Plutchik Emotion Agreement (PEA) metric (§3). PEA is intuitively grounded; our human evaluation shows workers agree with PEA’s rankings 88% of the time. Furthermore, we perform insightful analyses on implicit and explicit emotions in hurricane tweets (§4). Quite surprisingly, we find consistencies in Plutchik-24 emotion distributions across Hurricanes Harvey, Irma, and Maria.
HurricaneEmo also serves as a challenging new benchmark for large-scale, pre-trained language models. We establish baselines for a coarser Plutchik-8 emotion detection task using BERT (Devlin et al., 2019) and RoBERTa (Liu et al., 2019) (§5). Our experiments reveal: (1) BERT only achieves 64% (averaged) accuracy; and (2) using “better” pre-trained models (e.g., RoBERTa) does not help, which is a strikingly different trend than most leaderboards (Wang et al., 2018). To better understand their pitfalls, in particular BERT, we conduct a comprehensive error analysis of 200 incorrectly predicted samples. In addition, we incorporate stronger inductive biases into BERT via pre-training on related tasks, which culminates in (averaged, absolute) +4% accuracy (§6). Finally, we propose unsupervised domain adaptation to bridge the domain gap between existing large-scale emotion datasets (e.g., EmoNet (Abdul-Mageed and Ungar, 2017)) and HurricaneEmo (§7). Our code and datasets are made publicly available.222https://github.com/shreydesai/hurricane
2 Related Work
Emotion detection has been extensively studied in news headlines Strapparava and Mihalcea (2007); Katz et al. (2007), blog posts Aman and Szpakowicz (2007), health-related posts Khanpour and Caragea (2018), and song lyrics Strapparava et al. (2012), but only recently, in social media websites (e.g., Twitter, Facebook) Mohammad (2012); Wang et al. (2012); Mohammad and Kiritchenko (2015); Volkova and Bachrach (2016); Abdul-Mageed and Ungar (2017). However, emotion detection in disaster-centric domains, despite its practical importance, is limited. Schulz et al. (2013) (singlehandedly) annotate 2,200 Hurricane Sandy tweets using Ekman-6 emotions Ekman (1992). In contrast, we introduce 15,000 annotated tweets from multiple hurricanes with (much more fine-grained) Plutchik-24 emotions. Unlike Abdul-Mageed and Ungar (2017), we focus on readers’ perceived emotions rather than writers’ intended emotions.
Furthermore, in disaster-centric domains, the lack of labeled data required to train reliable models precludes the use of supervised learning techniques. Several works propose to use labeled data from prior (source) disasters to learn classifiers for new (target) disasters (Verma et al., 2011; Nguyen et al., 2017; Imran et al., 2013, 2016; Caragea et al., 2016). However, due to the unique nature of each disaster (e.g., type, geographical location, season, cultural differences among the affected population), the source disaster may not accurately reflect the characteristics of the target disaster (Palen and Anderson, 2016; Imran et al., 2015). Domain adaptation techniques address these challenges by efficiently using large amounts of unlabeled target domain data, consequently outperforming the aforementioned supervised techniques (Alam et al., 2018; Li et al., 2017). Our work contributes to disaster-centric emotion detection in three ways by: (1) introducing a dataset large enough to train supervised classifiers; (2) exploring various forms of pre-training to instill strong inductive biases; and (3) establishing domain adaptation baselines by leveraging emotive samples obtainable via distant supervision.
3 Dataset Construction
In this section, we present HurricaneEmo, an annotated dataset of 15,000 English tweets from Hurricanes Harvey, Irma, and Maria. We detail each component, including the initial preprocessing (§3.1), annotation procedures (§3.2), and the formulation and calculation of inter-annotator agreement (§3.3).
3.1 Preprocessing
Ray Chowdhury et al. (2019) release a repository of large-scale Twitter datasets consisting of tweets streamed during the Harvey, Irma, and Maria hurricanes, which we will refer to as HurricaneExt (i.e., extended). We use their tweets as a starting point for the construction of our dataset. We perform two types of preprocessing. First, we replace usernames and links with <USER> and <URL>, respectively, then eliminate duplicate tweets. Second, we use filtering techniques to ensure the resulting tweets contain emotive content.
We assume a lexical prior over emotion tweets, that is, requiring that an emotive tweet consist of at least one word derived from EmoLex Mohammad and Turney (2013). EmoLex consists of 14,182 crowdsourced words associated with several emotion categories. Critically, these words appear in emotional contexts, but are not necessarily emotion words themselves. For example, “payback” is related to the emotion “anger,” but is also used extensively in finance. Significant past work Bravo-Marquez et al. (2014); Majumder et al. (2017); Giatsoglou et al. (2017) has used this lexicon to bootstrap their emotion datasets, since the alternatives are (1) using unlabeled tweets as-is or (2) using a model to classify emotional tweets. Initially, we started with (1) and did no emotion-related preprocessing. However, the dataset contained many spurious tweets, such as snippets of news articles, that had little to do with emotions. The level of noise rendered the data prohibitively costly to annotate. For (2), there is simply no such large-scale data to train on, and existing resources like EmoNet manifest an even stronger prior where tweets are only included if they explicitly contain an emotion hashtag (e.g., #sad, #angry, #happy).
3.2 Annotation
We randomly sample 5,000 tweets each for annotation from the filtered datasets for Harvey, Irma, and Maria; in total, this yields 15,000 annotations. We request workers on Amazon Mechanical Turk to label tweets with a list of Plutchik-24 emotions. Furthermore, to enable fine-grained emotion analysis, we do not crowdsource Plutchik-8 emotions directly. We require that workers reside in the US and have completed 500+ HITs with an acceptance rate 95%. Each HIT is completed by 5 workers.
3.3 Inter-Annotator Agreement
In this section, we elaborate on our PEA metric for computing inter-annotator agreement with fine-grained emotion labels.
Challenges.
Fine-grained emotion annotation presents several challenges for evaluating inter-annotator agreement. First, because a tweet can convey multiple emotions, we allow workers to select more than one Plutchik-24 emotion. This implies an agreement metric must support scoring sets of categorical values. Passonneau (2004) use set distance metrics for capturing agreement between coreference cluster annotations. Similarly, Wood et al. (2018) incorporate Jaccard’s similarity in Krippendorff’s alpha. However, these methods would penalize fine-grained emotions equally, which is not ideal. For the Plutchik wheel, the proximity of any two emotions represents their relatedness. For example, trust and admiration belong to the same emotion group while loathing and admiration are orthogonal to each other.
PEA Scores.
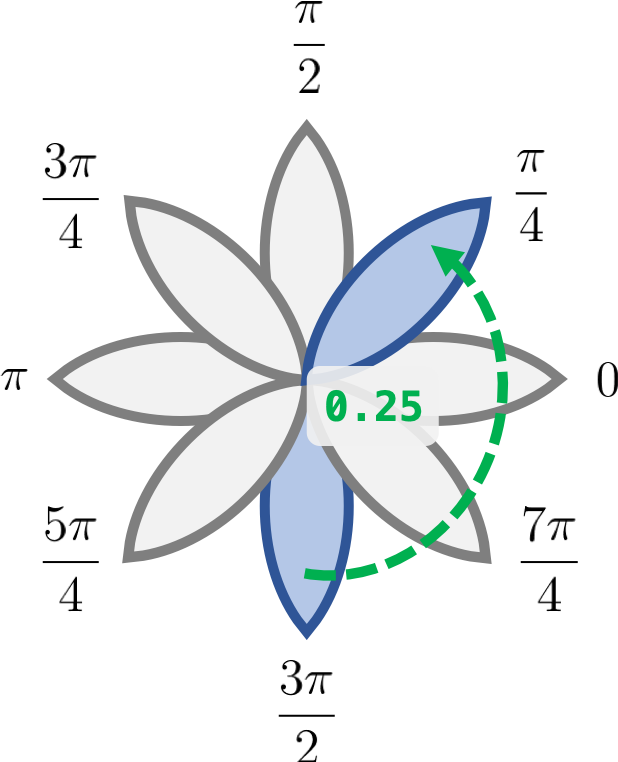
We introduce the Plutchik Emotion Agreement—hereafter referred to as PEA—to address these challenges. We superimpose a unit circle onto the Plutchik wheel, representing each Plutchik-8 emotion as a polar coordinate (e.g., disapproval ). Intuitively, the angles between Plutchik-8 emotions represent how similar or dissimilar they are. If two Plutchik-24 annotations belong to the same Plutchik-8 group, we do not penalize them (e.g., joy and ecstasy incur no penalty). Otherwise, we enforce a linear penalty based on how radially separate the annotations are (e.g., ecstasy and grief incur the highest penalty). Higher PEA scores imply more agreement.
Example.
Figure 1 visualizes our metric. In this example, two annotators select emotions with radians and , respectively. The term evaluates to . Then, it is normalized using , yielding . Finally, we subtract to obtain the agreement score: . Intuitively, this makes sense as the decisions are only slightly better than being in complete disagreement (i.e., orthogonal).
Formulation.
For clarity, we introduce notation. Let and denote workers with (categorical) annotation sets and , respectively. The pairwise agreement between the workers is computed as:
where is a normalizing constant and is a map from Plutchik-8 emotions to radians. Given a collection of workers that annotated a tweet, we obtain per-worker PEA scores by averaging over all possible pairwise agreements. For example, if workers annotated the same tweet, PEA() . For quality control, we filter annotations from workers with PEA 0.55. This threshold is determined through manual inspection of 50 workers and their annotations. The (averaged, per-worker) PEA scores for each hurricane are: Harvey (65.7), Maria (67.3), and Irma (70.3).333A reasonable interpretation of PEA scores may be as follows: 0—25 (no agreement), 25—50 (poor agreement), 50—75 (moderate agreement), 75—100 (high agreement).
Human Evaluation.
We perform a human evaluation with our proposed metric, which is absent in previous work for measuring inter-annotator agreement for emotion annotations Wood et al. (2018); Öhman et al. (2018). Crowdsourced workers are asked to determine the agreement between two annotation pairs constructed from three annotators, that is, A: and B: . They choose between three options: (1) A has higher agreement than B; (2) A and B have (roughly) the same agreement; and (3) B has higher agreement than A. 88.2% of the worker rankings match with PEA’s rankings, pointing towards strong human agreement. The workers themselves in this study also show good agreement according to Krippendorff’s alpha ( = 74.0) Artstein and Poesio (2008).444See Appendix B for details on our procedures.
4 Qualitative Analysis
4.1 Dataset Overview
| Vocabulary | Features (%) | ||||
|---|---|---|---|---|---|
| Hurricane | Orig. | Filt. | # | @ | // |
| Harvey | 20.6 K | 14.4 K | 48.1 | 27.4 | 85.3 |
| Irma | 14.6 K | 8.8 K | 41.4 | 22.5 | 81.7 |
| Maria | 21.6 K | 15.8 K | 36.5 | 30.3 | 78.3 |
| Mexico helped us during Houston, lets return the favor! | joy, admiration, pensiveness |
|---|---|
| Hurricane Irma is hitting Florida. Everyone evacuated Here I am, still in Florida bring it on Irma, bring it on. | acceptance, anticipation, vigilance |
| puerto rico should be the ONLY THING in American News. <URL> | anger, annoyance, interest |
Table 1 presents several statistics of HurricaneEmo. We make three observations. First, the vocabularies across all datasets are large considering there are only 5,000 tweets per hurricane. The vocabularies do decrease by about 30% after preprocessing, although the resulting sizes still suggest users use a myriad of words to express their emotions. Second, only about 50% of Harvey tweets and 40% of Irma/Maria tweets contain hashtags. Hashtags are a unique marker of Twitter discourse (Ritter et al., 2011), but in our dataset specifically, hashtags are used to tag particular entities, spread disaster-relief awareness, and create trending content. This phenomena alone makes our tweets different from those collected through distant supervision (Abdul-Mageed and Ungar, 2017). Third, roughly 80-85% of tweets contain links to third-party content. Users commonly use links to share news articles, resources for humanitarian aid, and other miscellaneous multimedia.
Table 2 shows three samples from HurricaneEmo. Unlike EmoNet (Abdul-Mageed and Ungar, 2017), our dataset does not have the strong assumption that only one emotion can be expressed in a tweet. For example, the first tweet lexically points towards the expression of more than one emotion. The predicate “helped us” implies the user admires Mexico for providing aid, and the exclamation mark is indicative of joy. In addition, our samples contain a mix of implicit and explicit emotions, which lexical information alone cannot resolve. In the third tweet, there are no particular words that point towards anger and annoyance, but we can infer the user is upset that the media is not prioritizing Hurricane Maria.
Finally, our emotion prediction tasks cannot be solved by simply retrofitting pre-trained word embeddings (Mikolov et al., 2013; Pennington et al., 2014) or contextualized representations (Peters et al., 2018; Devlin et al., 2019; Liu et al., 2019), which we also empirically show in our experiments (§5). These methods work best for explicit emotion detection as they largely overfit to sparse lexical features. Rather, in order to capture implicit emotions, models must carry an inductive bias that appropriately reasons over the context (e.g., what event(s) occurred?) and semantic roles (e.g., what happened to whom?) while balancing the aforementioned features.
| Plutchik-8 | Plutchik-24 | ||
|---|---|---|---|
| Emotion | Abbrv. | Emotion | Abbrv. |
| aggressiveness | agrsv | rage | rage |
| anger | anger | ||
| annoyance | anyce | ||
| optimism | optsm | vigilance | vglnc |
| anticipation | antcp | ||
| interest | inrst | ||
| love | love | ecstasy | ecsty |
| joy | joy | ||
| serenity | srnty | ||
| submission | sbmsn | admiration | admrn |
| trust | trust | ||
| acceptance | acptn | ||
| awe | awe | terror | trror |
| fear | fear | ||
| apprehension | aprhn | ||
| disapproval | dspvl | amazement | amzmt |
| surprise | srpse | ||
| distraction | dstrn | ||
| remorse | rmrse | grief | grief |
| sadness | sadns | ||
| pensiveness | psvne | ||
| contempt | cntmp | loathing | lthng |
| disgust | dsgst | ||
| boredom | brdom | ||
4.2 Fine-Grained Emotions
We begin to analyze the fine-grained emotions present in our datasets. We ask the following questions: What is the general distribution of emotions? Are certain emotion groups highlighted more than others? How does the distribution change across hurricanes?
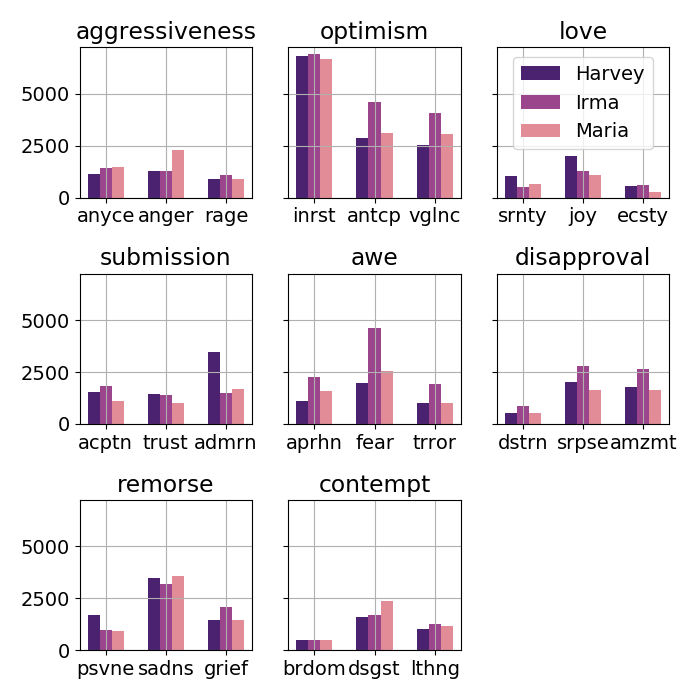
Figure 2 shows Plutchik-24 emotion distributions for Hurricanes Harvey, Irma, and Maria. From these plots, a couple of trends emerge. First, the Plutchik-24 emotion counts are within the ballpark of each other with the notable exceptions of admiration and fear. This suggests that, on average, hurricane disasters evoke a similar spread of implicit and explicit emotions among most emotion categories. Second, users tend to post more optimistic content during hurricane disasters. We hypothesize that users use Twitter as a social platform to spread awareness of the hurricanes themselves or post-disaster relief efforts, commonly using hashtags like #prayfortexas, #floridaevacuation, and #donationdrive. It is encouraging to see that although users do express natural emotions such as fear, sadness, and anger, many seek to help others in the face of adversity. Third, sharp changes in emotion counts between Harvey and Irma may be tied to their history. In the 2017 Atlantic hurricane season, Harvey materialized as a Cat-4 hurricane, and Irma followed around two weeks later as a Cat-5 hurricane.555Abbreviations for Category-. This refers to the Saffir-Simpson scale for classifying hurricanes based on sustained wind speed, which ranges from 1-5 in order of severity. Through side-by-side comparisons of both hurricanes’ tweets, we found the Irma tweets had more descriptions of destruction and its aftermath. These changes in discourse potentially explain shifts between the emotion distributions.
4.3 Emotion Co-Occurrence
Thus far, we have analyzed each Plutchik-24 emotion in isolation. In this section, we ask the following questions: How do Plutchik-8 emotion groups co-occur with one another? Do co-occurrence patterns change across hurricanes?
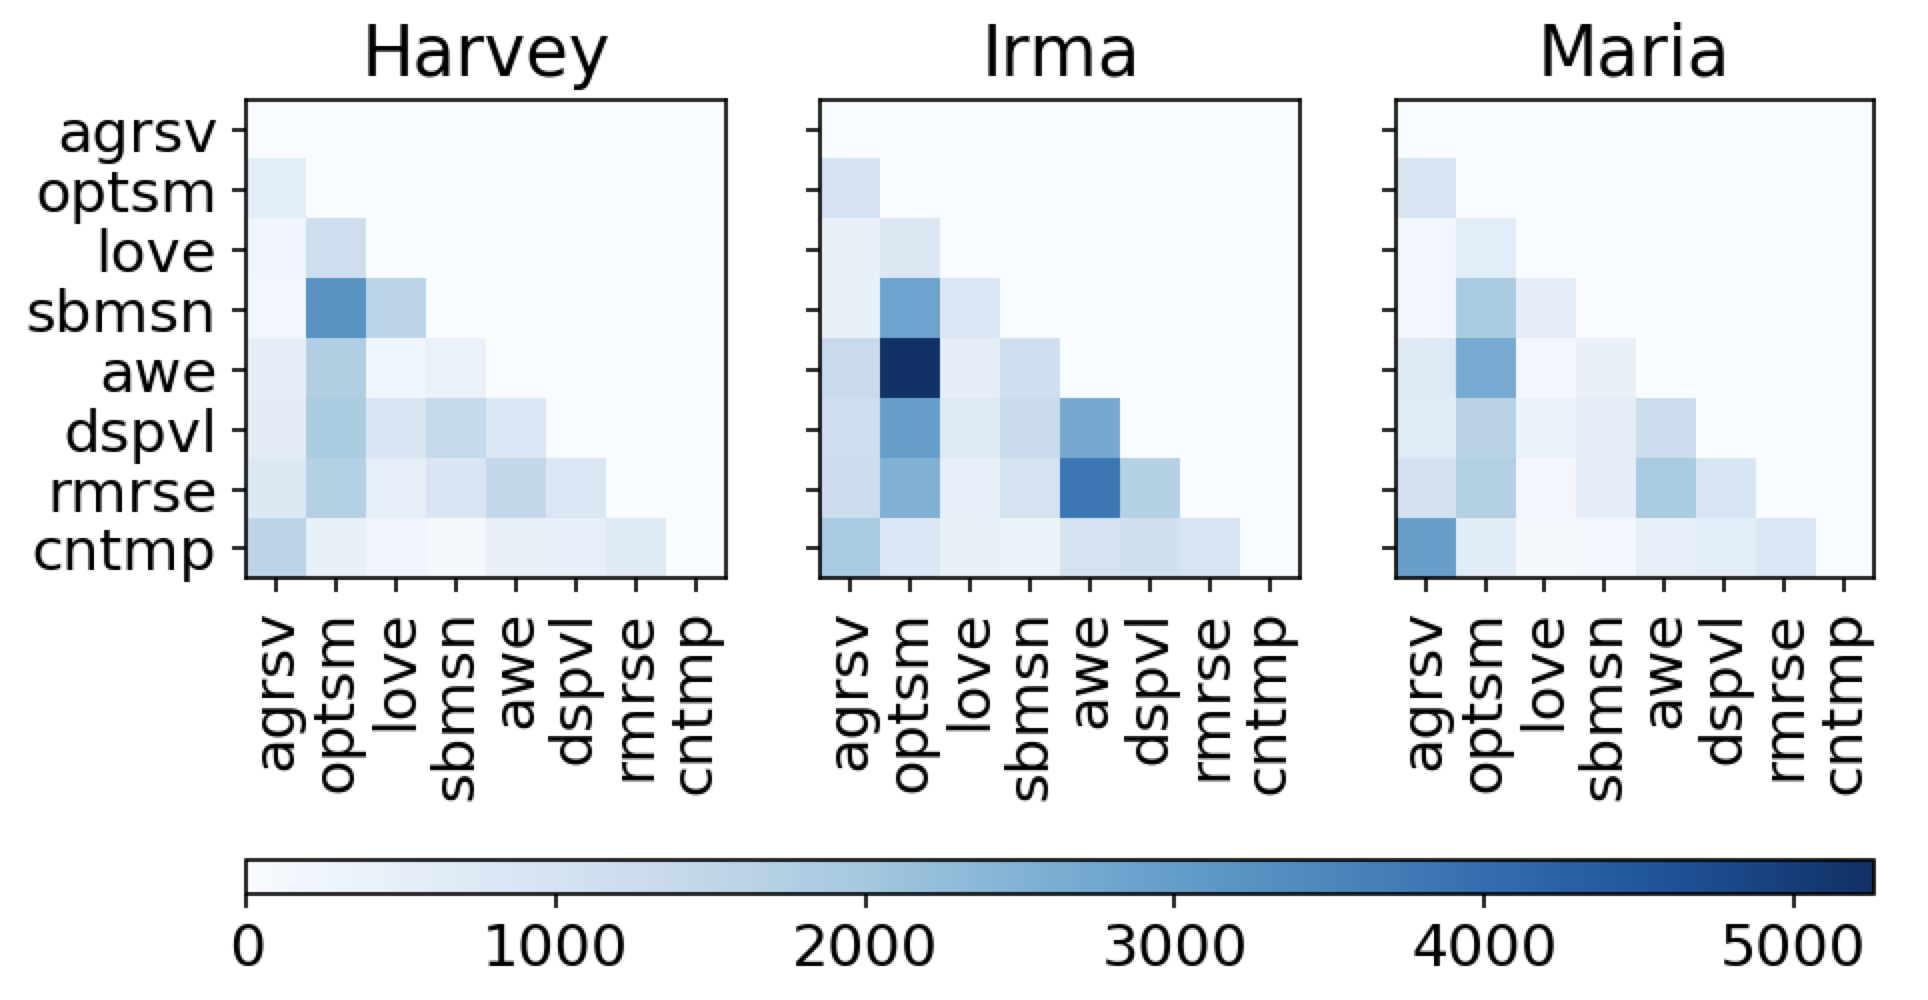
Figure 3 shows co-occurrence heatmaps for each hurricane. Intuitively, we see strong correlations between polarized emotions, that is, emotions categorized as positive and negative. For example, (love, aggressiveness) does not appear as frequently as (love, optimism) or (contempt, aggressiveness). However, this premise does not always hold; the pairs ({disapproval, remorse}, optimism) also co-occur across all hurricanes. Representative of this phenomenon is the tweet: “I’m raising money for Hurricane Maria Destroyed Everything. Click to Donate: <URL> via <USER>.” The user indicates disapproval towards the hurricane by evoking pathos, but also shows optimism by donating money to a relief effort. Finally, similar to our previous observations (§4.2), we notice an increase in co-occurrence frequencies from Harvey Irma. This increase is, somewhat surprisingly, most apparent with (awe, optimism), although ({disapproval, remorse}, awe) frequencies also exhibit a noticeable gain. Once again, we posit that users may be expressing their sadness regarding the Cat-4 Cat-5 jump, but at the same time, offering solidarity to those affected by the hurricanes.
5 Baseline Modeling
We now turn to modeling the emotions in HurricaneEmo. Because Plutchik-24 emotion counts are heavily imbalanced, we group them into Plutchik-8 emotions and consequently create 8 binary classification tasks.
| Plutchik-8 Emotion | Train | Valid | Test |
|---|---|---|---|
| Aggressiveness | 4,209 | 526 | 527 |
| Optimism | 11,902 | 1,488 | 1,488 |
| Love | 2,569 | 321 | 322 |
| Submission | 6,092 | 762 | 762 |
| Awe | 7,324 | 916 | 916 |
| Disapproval | 5,931 | 741 | 742 |
| Remorse | 7,732 | 967 | 967 |
| Contempt | 3,763 | 470 | 471 |
The tweets are assorted into their respective label buckets; because tweets may be labeled with more than one emotion, each belongs to one or more buckets. These buckets represent positive samples (i.e., tweets labeled with that emotion). To create negative samples, we sample an equal amount from other buckets. From here, we shuffle the positive and negative samples and perform an 80/10/10 split to create the train, validation, and test sets.666We also experimented with keeping all negative samples as opposed to sampling an equal amount. Each binary task had around 5-7x more negative samples; this significantly hurt model performance. Even with a class imbalance penalty, the models almost never predicted positive samples. Note that although, in aggregate, the number of positive and negative samples match, they do not necessarily match in the train, validation, and test splits. Table 4 enumerates the splits.
| AGR | OPT | LOV | SBM | AWE | DSP | RMR | CNT | AVG | |
|---|---|---|---|---|---|---|---|---|---|
| Logistic Reg. | 49.8 | 74.7 | 50.9 | 50.6 | 48.9 | 49.7 | 48.3 | 46.8 | 52.5 |
| Char CNN | 50.2 | 74.3 | 43.0 | 47.2 | 44.7 | 47.1 | 47.4 | 48.8 | 50.3 |
| Word CNN | 43.6 | 74.5 | 44.7 | 45.4 | 44.2 | 47.0 | 46.9 | 43.9 | 48.8 |
| GRU | 48.4 | 74.7 | 54.0 | 50.9 | 50.1 | 49.9 | 48.9 | 49.2 | 53.3 |
| BERT | 67.6 | 75.0 | 54.0 | 67.4 | 68.3 | 55.7 | 58.5 | 66.8 | 64.1 |
| RoBERTa | 59.7 | 74.7 | 54.0 | 62.3 | 56.0 | 50.9 | 49.7 | 56.4 | 58.0 |
5.1 Experimental Setup
We consider both traditional neural models and pre-trained language models. We implement our models in PyTorch (Paszke et al., 2019) and perform all experiments on an NVIDIA Titan V GPU. Training and optimization hyperparameters are detailed in Appendix C. We report mean performance across 10 runs, each with a different random initialization. Below, we elaborate on our models:
Traditional Neural Models.
Each is equipped with 200D GloVe embeddings pre-trained on 2B tweets (Pennington et al., 2014): (1) Logistic Regression: We average the word embeddings of each token in the sequence (Iyyer et al., 2015); (2) CNN: A word-level CNN (Kim, 2014) with 100 filters of size [3, 4, 5] obtains representations. They are max-pooled and concatenated row-wise. We also experiment with a character-level CNN with filter sizes [5, 6, 7]; (3) GRU: A one-layer, unidirectional GRU (Cho et al., 2014) with a hidden dimension of 100 obtains features, which are mean pooled. For all models, penultimate representations are projected with a weight matrix .
Pre-trained Language Models.
We fine-tune base versions of BERT (Devlin et al., 2019) and RoBERTa (Liu et al., 2019) using the HuggingFace Transformers library (Wolf et al., 2019). We use the sentence representations embedded in the [CLS] token, then project it with a weight matrix . The language model and classification parameters are jointly fine-tuned.
5.2 Results
Table 5 presents our classification results. We make the following observations:
BERT consistently outperforms other models on most emotion tasks.
BERT shows strong performance across all 8 binary tasks in comparison to traditional neural models and RoBERTa. Unlike most traditional neural models, its accuracy never falls below random chance, showing it captures at least some of the complex phenomena present in our dataset. However, our tasks remain challenging for both types of models alike. For traditional models, word embeddings alone do not provide enough representational power to model our emotional contexts. Although GRUs perform well on EmoNet (Abdul-Mageed and Ungar, 2017), we suspect that they simply memorize emotion lexicons (§4.1), which is not a notable strategy for capturing implicit emotions. Nevertheless, BERT only obtains an average accuracy of about 64%. This leaves plenty of room for future work; we perform a comprehensive error analysis as a step towards this goal (§5.3).
“Better” pre-trained models (e.g., RoBERTa) do not necessarily help performance.
Unlike popular benchmarks such as GLUE (Wang et al., 2018) where more pre-training monotonically increases performance, rather encouragingly, we do not observe the same trend. RoBERTa’s average performance is around 5% better than GRU’s, but still around 6% worse than BERT’s. We hypothesize that this drop in performance is attributed to pre-training fine-tuning domain discrepancies. That is, RoBERTa’s (additional) pre-training data (e.g., CC-News) may be too distant from Twitter data, which is known for its short contexts and unique vernacular (Ritter et al., 2011). We encourage practitioners to avoid applying state-of-the-art models without augmenting them with task-guided pre-training objectives, as we explore later (§6).
| AGR | OPT | LOV | SBM | AWE | DSP | RMR | CNT | AVG | |
| No-Pretrain | 67.6 | 75.0 | 54.0 | 67.4 | 68.3 | 55.7 | 58.5 | 66.8 | 64.1 |
| Supervised Transfer | |||||||||
| EmoNet | 73.5 | 75.2 | 55.2 | 68.8 | 67.5 | 53.1 | 60.0 | 71.7 | 65.6 |
| Sentiment | 72.8 | 75.8 | 62.7 | 71.0 | 65.6 | 53.4 | 57.0 | 67.3 | 65.7 |
| Unsupervised Transfer | |||||||||
| EmoNet | 72.1 | 75.1 | 54.0 | 61.0 | 65.1 | 54.2 | 60.7 | 69.4 | 63.9 |
| Sentiment | 69.1 | 74.9 | 53.6 | 66.2 | 67.3 | 54.3 | 57.9 | 64.4 | 63.5 |
| HurricaneExt | 73.6 | 75.4 | 69.8 | 68.9 | 69.7 | 57.9 | 60.2 | 70.2 | 68.2 |
5.3 Error Analysis
Using our BERT model, we sample 25 test errors from each of the 8 emotion tasks, yielding a total of 200 errors. We group the errors into the following categories: lexical and syntactic cues (45%), insufficient context (24%), entity mentions (15%), subjective labeling (10%), and unknown reasons (6%). The top three categories are discussed below:
Lexical and Syntactic Cues.
BERT often relies on surface-level lexical features to make predictions, as do most emotion prediction models. This bias also extends to certain syntactic features, such as punctuation. In “pls be safe everyone!!!!”, BERT associates the exclamation mark with a positive emotion, but here, the speaker is more concerned.
Insufficient Context.
Users often comment on events, public policies, or linked content that, by themselves, do not carry features for supervised learning. This type of error is not necessarily a shortcoming of BERT, but rather our dataset. For example, in “for [tracy mcgrady]1, [hall induction]2 muted by effects of [hurricane harvey]3 at home”, one use external knowledge to reason between the noun phrases and discern the latent emotions.
Entity Mentions.
BERT also makes erroneous predictions in the presence of certain entity mentions. For example, BERT classifies this tweet as aggressiveness: “nytimesworld: mexico offered aid to texas after harvey. but after an earthquake and hurricane, it says all help is needed at home.” Here, the user is merely quoting a news statement as opposed to formulating opinions regarding NY Times’ discourse. Because the sentiment towards NY Times is negative in our datasets overall (due to public backlash on its stories), BERT likely capitalizes on this mention-emotion bias.
6 Task-Guided Pre-training
To improve upon our baselines, we explore pre-training as a means of implicitly incorporating an inductive bias into our BERT model. Our hope is that these pre-training tasks will not only make BERT more robust in the Twitter domain, but also provide useful (albeit abstract) knowledge for the end emotion prediction tasks. For brevity, we chiefly focus on BERT, although our methods can be generalized to other pre-trained models.
Setup.
We explore, in isolation, supervised and unsupervised pre-training tasks. For the supervised setting, we pre-train on a multi-class emotion task (EmoNet) (Abdul-Mageed and Ungar, 2017) and binary sentiment analysis task (Sentiment) (Go et al., 2009). For the unsupervised setting, we pre-train on dynamic masked language modeling (Liu et al., 2019) on (unlabeled) samples from EmoNet, Sentiment, and HurricaneExt (§3.1). For both types of tasks, we further pre-train BERT for a fixed number of epochs, then fine-tune it on a HurricaneEmo task. We compare these results to No-Pretrain, namely the BERT results verbatim from Table 5. We report mean performance across 10 pre-training fine-tuning runs. Further training details, including samples sizes for the pre-training tasks, are available in Appendix D.
Results.
Table 6 shows the pre-training results. Supervised pre-training significantly helps with 3-4 emotions, but degrades overall performance on 2-4 emotions. We posit Sentiment aids emotions with highly predictive features. For example, “wtf” in “it’s literally the size of texas. wtf” is correlated with aggressiveness, but no such lexical cues exist in “not all heros wear capes <3 thank you stanley - homeless #hurricane evacuee grooms lost pets,” which is an awe sample.
The unsupervised pre-training results also show a couple trends. First, EmoNet largely hurts downstream performance, especially reducing submission accuracy by -6%. Second, Sentiment (in its unlabeled form) yields no noticeable benefits. This implies sentiment information is much more valuable, but of course, subject to the fact that the emotion task is heavily aligned with the original sentiment task. Third, we obtain encouraging results with HurricaneExt pre-training. The gains are most noticeable on aggressiveness and love, but this objective adds +1-2% accuracy for tasks on which supervised pre-training suffered.
| AGR | OPT | LOV | SBM | AWE | DSP | RMR | CNT | AVG | |
|---|---|---|---|---|---|---|---|---|---|
| Src-Only | 53.3 | 42.2 | 43.4 | 47.1 | 54.7 | 49.8 | 62.5 | 56.5 | 51.2 |
| Pretrain-Src | 54.8 | 43.2 | 45.1 | 47.8 | 54.4 | 50.4 | 63.3 | 57.1 | 52.0 |
| Pretrain-Trg | 55.0 | 44.2 | 46.2 | 48.0 | 55.5 | 49.9 | 63.7 | 60.5 | 52.9 |
| Pretrain-Joint | 52.7 | 44.2 | 45.5 | 47.8 | 54.8 | 49.9 | 61.6 | 56.3 | 51.6 |
| Trg-Only | 67.6 | 75.0 | 54.0 | 67.4 | 68.3 | 55.7 | 58.5 | 66.8 | 64.1 |
7 Fine-Grained Unsupervised Domain Adaptation
When new disasters emerge, it is likely we may not have emotion annotations, as alluded to previously (§2). Nevertheless, these annotations would be valuable for organizations trying to understand the emotional profile of users during a crisis Fraustino et al. (2012). In this section, we explore ways to leverage supervision from large-scale emotion datasets (e.g., EmoNet (Abdul-Mageed and Ungar, 2017)) in providing labels for our hurricane emotion datasets. We frame this problem as unsupervised domain adaptation; EmoNet is the labeled source domain and our hurricane datasets are the unlabeled target domain. Below, we elaborate on our methods.
Framework.
EmoNet was conceived as a multi-class classification task for Plutchik-8 emotions (Abdul-Mageed and Ungar, 2017). In contrast, we introduce binary classification tasks, one for each Plutchik-8 emotion. We split the EmoNet multi-class task into 8 binary tasks; this creates a one-to-one alignment between each source and target domain task. We separately perform unsupervised domain adaptation for each binary task.
Methods.
We use our BERT model (without task-guided pre-training) as the underlying classifier. Following Han and Eisenstein (2019), we chiefly focus on using strategic pre-training techniques that enable effective transfer between disparate domains. The systems for comparison are: (1) Src-Only: BERT is trained in the source domain and evaluated in the target domain; (2) Trg-Only: BERT is trained and evaluated in the target domain. These results are borrowed verbatim from Table 5; (3) Pretrain-*: BERT undergoes dynamic masked language modeling pre-training using data from domain *, is trained in the source domain, and finally evaluated in the target domain (Han and Eisenstein, 2019). Pretrain-Src only uses pre-training samples from the source domain, Pretrain-Trg only uses samples from the target domain, and Pretrain-Joint uses samples from both the source and target domains.777Pretrain-Joint is conceptually similar to AdaptaBert in Han and Eisenstein (2019), however, we dynamically generate pre-training data (Liu et al., 2019). We report mean performance across 10 pre-training fine-tuning runs.
Results.
Table 7 shows the unsupervised domain adaptation results. Overall, we do not find a significant increase in performance over the Src-Only baseline. Pre-training consistently adds +1% in average accuracy, but still leaves a large gap between Pretrain-Src and Trg-Only. Regardless, we have a few observations. First, we do not see a (relatively) large increase in performance for submission, awe, disapproval, and remorse. These emotions may need more explicit strategies to enable domain adaptation. This is also supported by our previous results (§6), where we also do not see a (relatively) large benefit from task-guided pre-training. Second, Pretrain-Joint performs worse than both Pretrain-Src and Pretrain-Trg. We posit that, for our emotion tasks, pre-training with a mixture of domains yields a noisier training signal compared to a parameter bias towards the target domain.
8 Conclusion
We present HurricaneEmo, an annotated dataset of perceived emotions spanning 15,000 tweets from multiple hurricanes. Tweets are annotated with fine-grained Plutchik-24 emotions, from which we analyze implicit and explicit emotions and construct Plutchik-8 binary classification tasks. Comprehensive experiments demonstrate our dataset is a challenging benchmark, even for large-scale pre-trained language models. We release our code and datasets as a step towards facilitating research in disaster-centric domains.
Acknowledgements
Thanks to Katrin Erk for reviewing an early version of this manuscript, Yasumasa Onoe for discussions on masked language model pre-training, and the anonymous reviewers for their helpful comments. This work was partially supported by the NSF Grants IIS-1850153, IIS-1912887, and IIS-1903963.
References
- Abdul-Mageed and Ungar (2017) Muhammad Abdul-Mageed and Lyle Ungar. 2017. EmoNet: Fine-Grained Emotion Detection with Gated Recurrent Neural Networks. In Proceedings of the 55th Annual Meeting of the Association for Computational Linguistics (Volume 1: Long Papers), pages 718–728, Vancouver, Canada. Association for Computational Linguistics.
- Alam et al. (2018) Firoj Alam, Shafiq Joty, and Muhammad Imran. 2018. Domain Adaptation with Adversarial Training and Graph Embeddings. In Proceedings of the 56th Annual Meeting of the Association for Computational Linguistics (Volume 1: Long Papers), pages 1077–1087, Melbourne, Australia. Association for Computational Linguistics.
- Aman and Szpakowicz (2007) Saima Aman and Stan Szpakowicz. 2007. Identifying Expressions of Emotion in Text". In Text, Speech and Dialogue, pages 196–205, Berlin, Heidelberg. Springer Berlin Heidelberg.
- Artstein and Poesio (2008) Ron Artstein and Massimo Poesio. 2008. Inter-coder Agreement for Computational Linguistics. Computational Linguistics, 34(4):555–596.
- Belles (2017) Jonathan Belles. 2017. 2017 Atlantic Hurricane Season Recap: 17 Moments We’ll Never Forget. Weather.com.
- Bravo-Marquez et al. (2014) Felipe Bravo-Marquez, Marcelo Mendoza, and Barbara Poblete. 2014. Meta-level Sentiment Models for Big Social Data Analysis. Knowledge-Based Systems, 69:86–99.
- Caragea et al. (2016) Cornelia Caragea, Adrian Silvescu, and Andrea H. Tapia. 2016. Identifying informative messages in disaster events using convolutional neural networks. In Proceedings of the 13th International Conference on Information Systems for Crisis Response and Management (ISCRAM).
- Cho et al. (2014) Kyunghyun Cho, Bart van Merriënboer, Caglar Gulcehre, Dzmitry Bahdanau, Fethi Bougares, Holger Schwenk, and Yoshua Bengio. 2014. Learning Phrase Representations using RNN Encoder–Decoder for Statistical Machine Translation. In Proceedings of the 2014 Conference on Empirical Methods in Natural Language Processing (EMNLP), pages 1724–1734, Doha, Qatar. Association for Computational Linguistics.
- Dennis et al. (2006) Michael Robert Dennis, Adrianne Kunkel, Gillian Woods, and Paul Schrodt. 2006. Making Sense of New Orleans Flood Trauma Recovery: Ethics, Research Design, and Policy Considerations for Future Disasters. Analyses of Social Issues and Public Policy, 6(1):191–213.
- Desai et al. (2019) Shrey Desai, Hongyuan Zhan, and Ahmed Aly. 2019. Evaluating Lottery Tickets under Distributional Shifts. In Proceedings of the 2nd Workshop on Deep Learning Approaches for Low-Resource NLP (DeepLo 2019), pages 153–162, Hong Kong, China. Association for Computational Linguistics.
- Devlin et al. (2019) Jacob Devlin, Ming-Wei Chang, Kenton Lee, and Kristina Toutanova. 2019. BERT: Pre-training of Deep Bidirectional Transformers for Language Understanding. In Proceedings of the 2019 Conference of the North American Chapter of the Association for Computational Linguistics: Human Language Technologies, Volume 1 (Long and Short Papers), pages 4171–4186, Minneapolis, Minnesota. Association for Computational Linguistics.
- Ekman (1992) Paul Ekman. 1992. An Argument for Basic Emotions. Cognition and Emotion, 6(3-4):169–200.
- Fraustino et al. (2012) Julia Daisy Fraustino, Brooke Fisher Liu, and Yan Xian Jin. 2012. Social Media Use During Disasters: A Review of the Knowledge Base and Gaps. National Consortium for the Study of Terrorism and Responses to Terrorism.
- Fritz and Marks (1954) Charles Fritz and Eli Marks. 1954. The NORC Studies of Human Behavior in Disaster. Journal of Social Issues, 10(3):26–41.
- Fritze et al. (2008) Jessica Fritze, Grant Blashki, Susie Burke, and John Wiseman. 2008. Hope, Despair and Transformation: Climate Change and the Promotion of Mental Health and Wellbeing. International Journal of Mental Health Systems, 2(1):13.
- Giatsoglou et al. (2017) Maria Giatsoglou, Manolis Vozalis, Konstantinos Diamantaras, Athena Vakali, George Sarigiannidis, and Konstantinos Chatzisavvas. 2017. Sentiment Analysis Leveraging Emotions and Word Embeddings. Expert Systems with Applications, 69:214–224.
- Go et al. (2009) Alec Go, Richa Bhayani, and Lei Huang. 2009. Twitter Sentiment Classification using Distant Supervision. Stanford University CS224N Project Report.
- Han and Eisenstein (2019) Xiaochuang Han and Jacob Eisenstein. 2019. Unsupervised Domain Adaptation of Contextualized Embeddings for Sequence Labeling. In Proceedings of the 2019 Conference on Empirical Methods in Natural Language Processing and the 9th International Joint Conference on Natural Language Processing (EMNLP-IJCNLP), pages 4237–4247, Hong Kong, China. Association for Computational Linguistics.
- Imran et al. (2015) Muhammad Imran, Carlos Castillo, Fernando Diaz, and Sarah Vieweg. 2015. Processing Social Media Messages in Mass Emergency: A Survey. Association for Computing Machinery (ACM) Computing Surveys, 47(4):67:1–67:38.
- Imran et al. (2013) Muhammad Imran, Shady Elbassuoni, Carlos Castillo, Fernando Diaz, and Patrick Meier. 2013. Practical Extraction of Disaster-relevant Information from Social Media. In Proceedings of the 22Nd International Conference on World Wide Web, WWW 2013 Companion, pages 1021–1024, New York, NY, USA. Association for Computing Machinery (ACM).
- Imran et al. (2016) Muhammad Imran, Prasenjit Mitra, and Jaideep Srivastava. 2016. Cross-Language Domain Adaptation for Classifying Crisis-Related Short Messages. In 13th Proceedings of the International Conference on Information Systems for Crisis Response and Management, Rio de Janeiro, Brasil, May 22-25, 2016.
- Iyyer et al. (2015) Mohit Iyyer, Varun Manjunatha, Jordan Boyd-Graber, and Hal Daumé III. 2015. Deep Unordered Composition Rivals Syntactic Methods for Text Classification. In Proceedings of the 53rd Annual Meeting of the Association for Computational Linguistics and the 7th International Joint Conference on Natural Language Processing (Volume 1: Long Papers), pages 1681–1691, Beijing, China. Association for Computational Linguistics.
- Katz et al. (2007) Phil Katz, Matthew Singleton, and Richard Wicentowski. 2007. SWAT-MP: The SemEval-2007 Systems for Task 5 and Task 14. In 4th International Workshop on Semantic Evaluations, pages 308–313.
- Khanpour and Caragea (2018) Hamed Khanpour and Cornelia Caragea. 2018. Fine-grained emotion detection in health-related online posts. In Proceedings of the 2018 Conference on Empirical Methods in Natural Language Processing, pages 1160–1166, Brussels, Belgium. Association for Computational Linguistics.
- Kim (2014) Yoon Kim. 2014. Convolutional Neural Networks for Sentence Classification. In Proceedings of the 2014 Conference on Empirical Methods in Natural Language Processing (EMNLP), pages 1746–1751, Doha, Qatar. Association for Computational Linguistics.
- Kinston and Rosser (1974) Warren Kinston and Rachel Rosser. 1974. Disaster: Effects on Mental and Physical State. Journal of Psychosomatic Research, 18(6):437–456.
- Li et al. (2017) Hongmin Li, Doina Caragea, and Cornelia Caragea. 2017. Towards Practical Usage of a Domain Adaptation Algorithm in the Early Hours of a Disaster. In Proceedings of the 14th International Conference on Information Systems for Crisis Response and Management (ISCRAM).
- Liu et al. (2019) Yinhan Liu, Myle Ott, Naman Goyal, Jingfei Du, Mandar Joshi, Danqi Chen, Omer Levy, Mike Lewis, Luke Zettlemoyer, and Veselin Stoyanov. 2019. RoBERTa: A Robustly Optimized BERT Pretraining Approach. arXiv preprint arXiv:1907.11692.
- Majumder et al. (2017) Navonil Majumder, Soujanya Poria, Alexander Gelbukh, and Erik Cambria. 2017. Deep Learning-Based Document Modeling for Personality Detection from Text. IEEE Intelligent Systems, 32(2):74–79.
- Mikolov et al. (2013) Tomas Mikolov, Ilya Sutskever, Kai Chen, Greg Corrado, and Jeffrey Dean. 2013. Distributed Representations of Words and Phrases and Their Compositionality. In Proceedings of the 26th International Conference on Neural Information Processing Systems - Volume 2, NIPS 2013, pages 3111–3119, USA. Curran Associates Inc.
- Mohammad (2012) Saif Mohammad. 2012. #Emotional Tweets. In *SEM 2012: The First Joint Conference on Lexical and Computational Semantics – Volume 1: Proceedings of the main conference and the shared task, and Volume 2: Proceedings of the Sixth International Workshop on Semantic Evaluation (SemEval 2012), pages 246–255, Montréal, Canada. Association for Computational Linguistics.
- Mohammad and Kiritchenko (2015) Saif Mohammad and Svetlana Kiritchenko. 2015. Using Hashtags to Capture Fine Emotion Categories from Tweets. Computational Intelligence, 31(2):301–326.
- Mohammad and Turney (2013) Saif Mohammad and Peter Turney. 2013. Crowdsourcing a Word-Emotion Association Lexicon. Computational Intelligence, 29(3):436–465.
- Nguyen et al. (2017) Dat Nguyen, Kamela Ali Al Mannai, Shafiq Joty, Hassan Sajjad, Muhammad Imran, and Prasenjit Mitra. 2017. Robust Classification of Crisis-Related Data on Social Networks Using Convolutional Neural Networks. In Proceedings of the International AAAI Conference on Web and Social Media (ICWSM 2017).
- Öhman et al. (2018) Emily Öhman, Kaisla Kajava, Jörg Tiedemann, and Timo Honkela. 2018. Creating a Dataset for Multilingual Fine-grained Emotion-detection Using Gamification-based Annotation. In Proceedings of the 9th Workshop on Computational Approaches to Subjectivity, Sentiment and Social Media Analysis, pages 24–30, Brussels, Belgium. Association for Computational Linguistics.
- Palen and Anderson (2016) Leysia Palen and Kenneth Anderson. 2016. Crisis Informatics—New Data for Extraordinary Times. Science, 353(6296):224–225.
- Passonneau (2004) Rebecca Passonneau. 2004. Computing Reliability for Coreference Annotation. In Proceedings of the Fourth International Conference on Language Resources and Evaluation (LREC 2004), Lisbon, Portugal. European Language Resources Association (ELRA).
- Paszke et al. (2019) Adam Paszke, Sam Gross, Francisco Massa, Adam Lerer, James Bradbury, Gregory Chanan, Trevor Killeen, Zeming Lin, Natalia Gimelshein, Luca Antiga, Alban Desmaison, Andreas Kopf, Edward Yang, Zachary DeVito, Martin Raison, Alykhan Tejani, Sasank Chilamkurthy, Benoit Steiner, Lu Fang, Junjie Bai, and Soumith Chintala. 2019. PyTorch: An Imperative Style, High-Performance Deep Learning Library. In H. Wallach, H. Larochelle, A. Beygelzimer, F. d Álché-Buc, E. Fox, and R. Garnett, editors, Advances in Neural Information Processing Systems 32, pages 8024–8035. Curran Associates, Inc.
- Pennington et al. (2014) Jeffrey Pennington, Richard Socher, and Christopher Manning. 2014. GloVe: Global Vectors for Word Representation. In Proceedings of the 2014 Conference on Empirical Methods in Natural Language Processing (EMNLP), pages 1532–1543, Doha, Qatar. Association for Computational Linguistics.
- Peters et al. (2018) Matthew Peters, Mark Neumann, Mohit Iyyer, Matt Gardner, Christopher Clark, Kenton Lee, and Luke Zettlemoyer. 2018. Deep Contextualized Word Representations. In Proceedings of the 2018 Conference of the North American Chapter of the Association for Computational Linguistics: Human Language Technologies, Volume 1 (Long Papers), pages 2227–2237, New Orleans, Louisiana. Association for Computational Linguistics.
- Plutchik (2001) Robert Plutchik. 2001. The Nature of Emotions: Human emotions have deep evolutionary roots, a fact that may explain their complexity and provide tools for clinical practice. American Scientist, 89(4):344–350.
- Ray Chowdhury et al. (2019) Jishnu Ray Chowdhury, Cornelia Caragea, and Doina Caragea. 2019. Keyphrase Extraction from Disaster-related Tweets. In The World Wide Web Conference, WWW 2019, pages 1555–1566, New York, NY, USA. Association for Computing Machinery (ACM).
- Ritchie and Roser (2020) Hannah Ritchie and Max Roser. 2020. Natural Disasters. Our World in Data.
- Ritter et al. (2011) Alan Ritter, Sam Clark, Mausam, and Oren Etzioni. 2011. Named Entity Recognition in Tweets: An Experimental Study. In Proceedings of the 2011 Conference on Empirical Methods in Natural Language Processing, pages 1524–1534, Edinburgh, Scotland, UK. Association for Computational Linguistics.
- Schulz et al. (2013) Axel Schulz, Tung Dang Thanh, Heiko Paulheim, and Immanuel Schweizer. 2013. A Fine-Grained Sentiment Analysis Approach for Detecting Crisis Related Microposts. In Information Systems for Crisis Response and Management (ISCRAM).
- Strapparava and Mihalcea (2007) Carlo Strapparava and Rada Mihalcea. 2007. SemEval-2007 Task 14: Affective Text. In Proceedings of the Fourth International Workshop on Semantic Evaluations (SemEval-2007), pages 70–74, Prague, Czech Republic. Association for Computational Linguistics.
- Strapparava et al. (2012) Carlo Strapparava, Rada Mihalcea, and Alberto Battocchi. 2012. A Parallel Corpus of Music and Lyrics Annotated with Emotions. In Proceedings of the Eighth International Conference on Language Resources and Evaluation (LREC 2012), pages 2343–2346, Istanbul, Turkey. European Language Resources Association (ELRA).
- Verma et al. (2011) Sudha Verma, Sarah Vieweg, William Corvey, Leysia Palen, James Martin, Martha Palmer, Aaron Schram, and Kenneth Anderson. 2011. Natural Language Processing to the Rescue? Extracting "Situational Awareness" Tweets During Mass Emergency. In Proceedings of the International AAAI Conference on Web and Social Media (ICWSM 2017).
- Volkova and Bachrach (2016) Svitlana Volkova and Yoram Bachrach. 2016. Inferring Perceived Demographics from User Emotional Tone and User-Environment Emotional Contrast. In Proceedings of the 54th Annual Meeting of the Association for Computational Linguistics (Volume 1: Long Papers), pages 1567–1578, Berlin, Germany. Association for Computational Linguistics.
- Wang et al. (2018) Alex Wang, Amanpreet Singh, Julian Michael, Felix Hill, Omer Levy, and Samuel Bowman. 2018. GLUE: A Multi-Task Benchmark and Analysis Platform for Natural Language Understanding. In Proceedings of the 2018 EMNLP Workshop BlackboxNLP: Analyzing and Interpreting Neural Networks for NLP, pages 353–355, Brussels, Belgium. Association for Computational Linguistics.
- Wang et al. (2012) Wenbo Wang, Lu Chen, Krishnaprasad Thirunarayan, and Amit Sheth. 2012. Harnessing Twitter "Big Data" for Automatic Emotion Identification. In Proceedings of the 2012 ASE/IEEE International Conference on Social Computing and 2012 ASE/IEEE International Conference on Privacy, Security, Risk and Trust, SOCIALCOM-PASSAT 2012, pages 587–592, Washington, DC, USA. IEEE Computer Society.
- Wolf et al. (2019) Thomas Wolf, Lysandre Debut, Victor Sanh, Julien Chaumond, Clement Delangue, Anthony Moi, Pierric Cistac, Tim Rault, Rémi Louf, Morgan Funtowicz, and Jamie Brew. 2019. HuggingFace’s Transformers: State-of-the-art Natural Language Processing. arXiv preprint arXiv:1910.03771.
- Wood et al. (2018) Ian Wood, John McCrae, Vladimir Andryushechkin, and Paul Buitelaar. 2018. A Comparison Of Emotion Annotation Schemes And A New Annotated Data Set. In Proceedings of the Eleventh International Conference on Language Resources and Evaluation (LREC 2018), Miyazaki, Japan. European Language Resources Association (ELRA).
Appendix A Domain Shifts
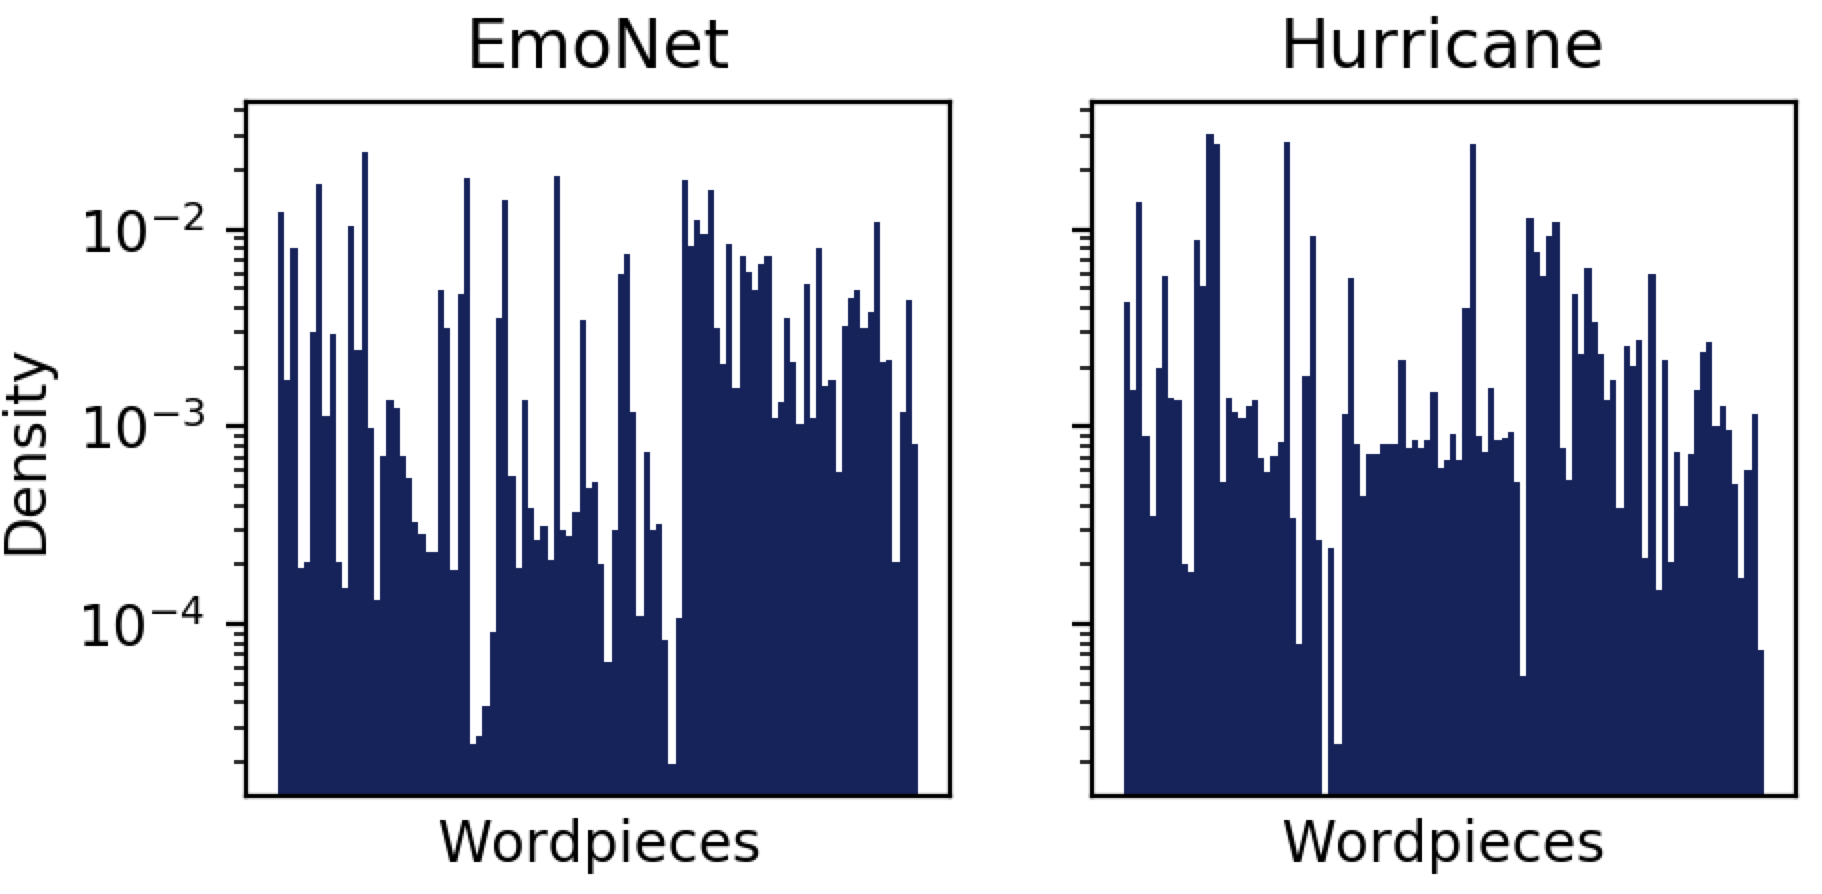
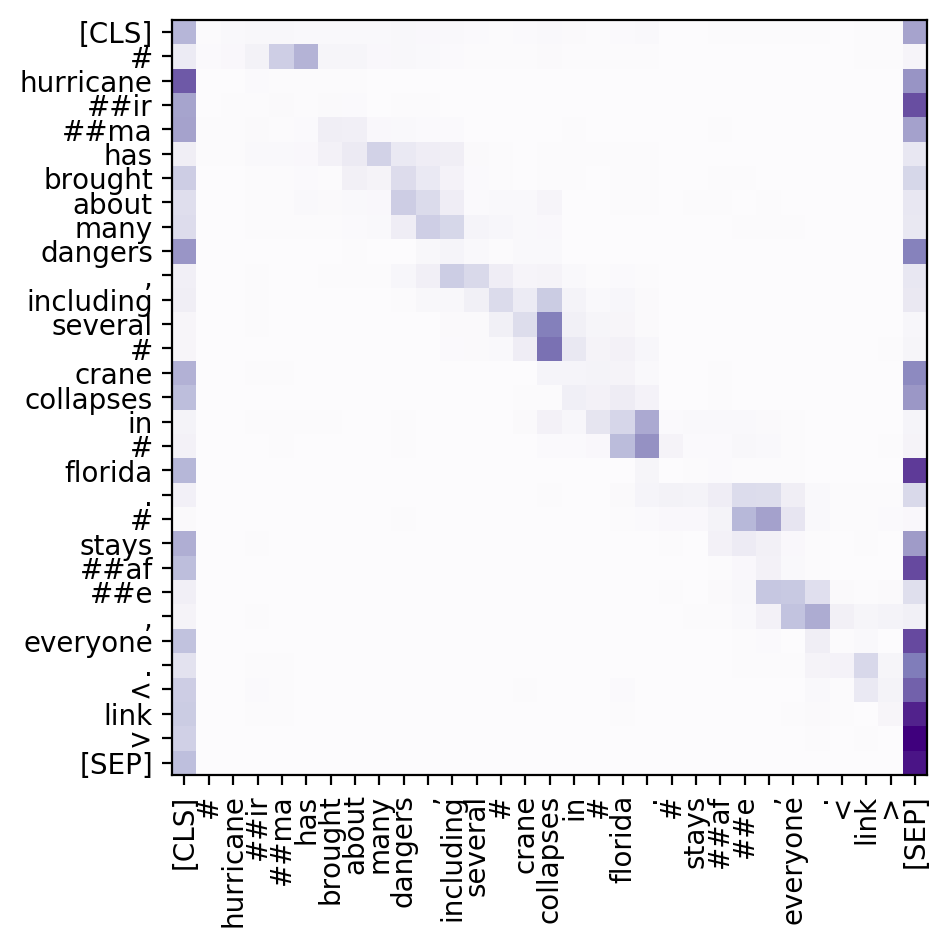
Following the methodology outlined in Desai et al. (2019), we use the Jenson-Shannon Divergence (JSD) between the vocabulary distributions in EmoNet and HurricaneEmo to quantify the domain divergence. The JSD is 0.199, approximately 1e5 larger than those reported in Desai et al. (2019). Figure 4 shows the densities of the top 1000 common wordpieces between both domains. The striking visual differences, even among common wordpieces, indicates a large discrepancy in the input distributions.
Appendix B Plutchik Emotion Agreement
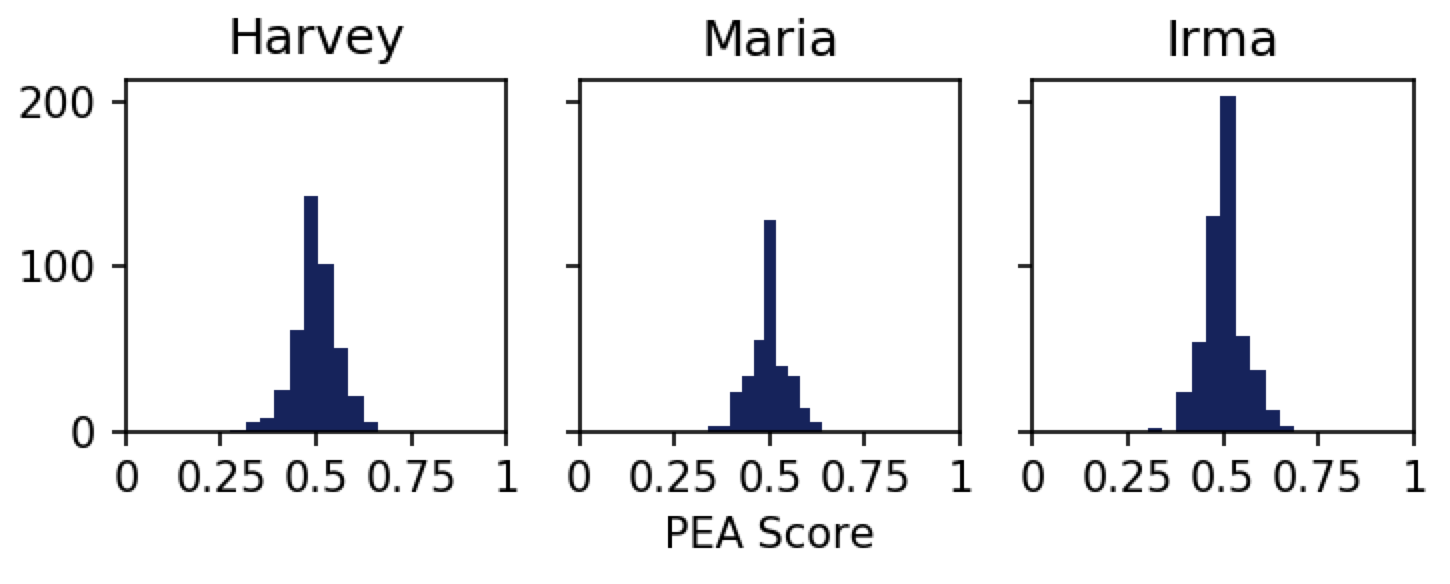
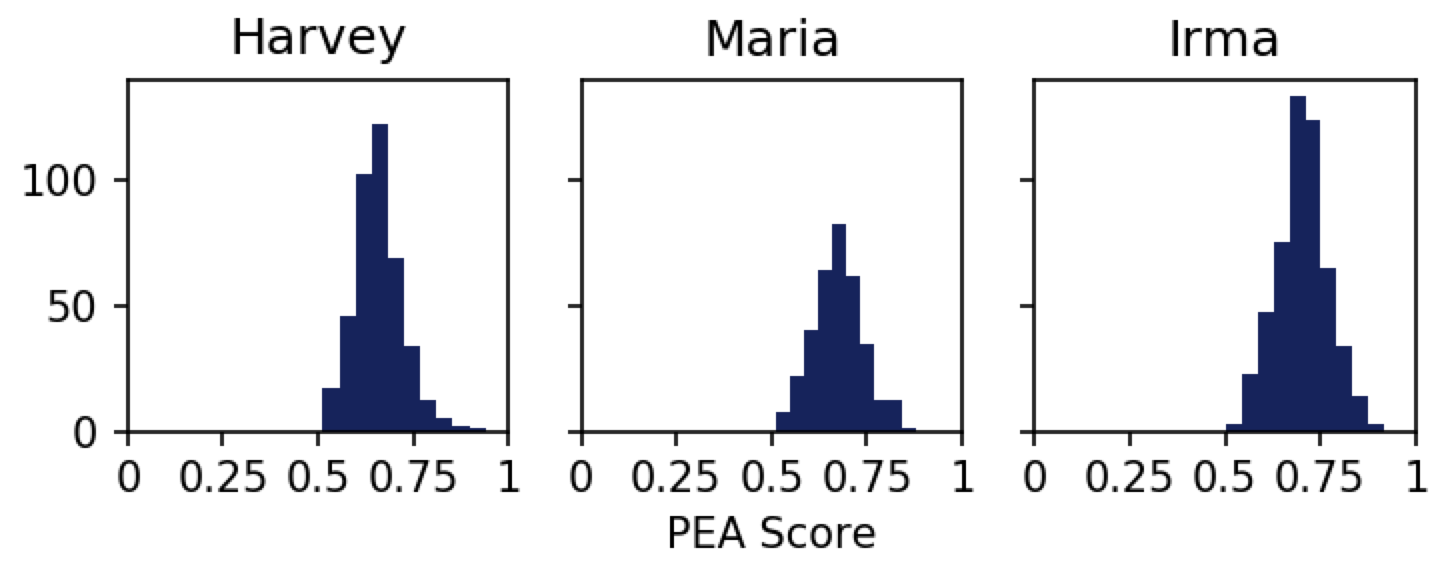
Interpretable Scale.
To assign PEA scores an interpretable scale, we compare randomly generated annotations against our obtained annotations. We detail the process to create random annotations. First, we compute the average number of emotions a worker assigns to a tweet, which evaluates to 3 for all hurricanes. Second, we sample 3 random emotions from the Plutchik-8 wheel for 5000 total annotations. Figure 5 compares the two types of annotations. The per-worker PEA scores for the random annotations collect around the mean (0.5), which is expected due to the law of large numbers. In contrast, the per-worker PEA scores for our annotations are shifted towards the right, indicating better agreement than the random baseline. Therefore, we interpret our annotations as showing “moderate agreement” under the PEA metric.
Human Evaluation.
Using our worker annotations across all three hurricanes, we create two annotation pairs for three workers, that is, A: and B: , where A and B have a shared worker . This format lends a total of 73,418 A/B total pairs. We sample 500 A/B pairs from this pool, initialize each HIT with 10 pairs, and assign 5 total workers per HIT.
Appendix C Baseline Modeling
Table 8 shows the hyperparameters. For our pre-trained models (e.g., BERT and RoBERTa), we use the default dropout rate (0.1) on the self-attention layers, but do not use additional dropout on the top linear layer. Furthermore, we use gradient accumulation to enable training with larger mini-batches.
| Logistic Reg. | Word CNN | Char CNN | GRU | BERT | RoBERTa | |
| Epochs | 5 | 5 | 5 | 5 | 3 | 3 |
| Batch Size | 64 | 64 | 64 | 64 | 16 | 16 |
| Learning Rate | 1e-4 | 1e-3 | 5e-5 | 1e-4 | 2e-5 | 2e-5 |
| Weight Decay | 0 | 0 | 0 | 0 | 0 | 1e-3 |
| Dropout | 0 | 0.5 | 0.7 | 0.7 | – | – |
Appendix D Task-Guided Pre-training
Masked Language Modeling.
Following Devlin et al. (2019), we select 15% of inputs uniformly at random (except for [CLS] and [SEP]) as prediction targets for the masked language modeling task. From the corresponding inputs, 80% are set to [MASK], 10% are set to random tokens, and 10% are set to the original tokens. However, we follow Liu et al. (2019) in creating pre-training data dynamically, rather than statically. This merely leads to slower convergence times as it becomes more difficult to fit the data. We fine-tune on the pre-training data for 10 epochs using a batch size of 16 and learning rate of 2e-5. Once pre-training concludes, we initialize a BERT model with these weights and fine-tune it on our emotion tasks using the hyperparameters in Table 8 with a learning rate of 3e-5.
Pre-training Corpus.
Our pre-training corpus is created by concatenating a collection of (shuffled) tweets together, each separated by [SEP]. The corpus is split into segments of size 512 with [CLS] prepended to each one. For clarity, each batch consisting of tokens is constructed as [CLS] [SEP] [SEP] [SEP]. We elaborate on two design decisions. First, prepending [CLS] to each batch, as opposed to each tweet, leads to better results. Second, largely due to computational reasons, we pack disparate tweets together in the same batch.
Appendix E Extended Pre-training Experiments
E.1 EmoNet Binary Task Pre-training
In Section 6, we pre-trained on a EmoNet multi-class classification task. In this section, we explore a fine-grained pre-training scheme. We create Plutchik-8 binary tasks from EmoNet, then fine-tune each emotion model separately on their respective HurricaneEmo tasks. Table 9 shows the results. EmoNet-Binary performs markedly worse than EmoNet-Multi and leads to a -2% reduction in averaged accuracy. Therefore, multi-class pre-training creates better representations for downstream evaluation, although they are still not as effective as other pre-training methods (e.g., masked language modeling).
E.2 Varying Amounts of Pre-training Data
The Sentiment and HurricaneExt datasets contain significantly more samples than currently used. In this section, we study the effects of using varying amounts of pre-training data on downstream HurricaneEmo performance. For both pre-training datasets, we use 1.6M samples. Table 10 shows the supervised Sentiment results. Tables 11 and 12 show the unsupervised Sentiment and HurricaneExt results, respectively. For both types of pre-training tasks, there is no noticeable benefit to using more pre-training data. The supervised Sentiment and unsupervised HurricaneExt results both saturate around 200K samples, which is what we report in our paper. The results for unsupervised HurricaneExt pre-training are especially compelling because they show that, without any labeled data, we can achieve strong downstream results. Finally, the unsupervised Sentiment task yields almost no gains for most emotions, showing that the type of data used for masked language modeling matters. Through side-by-side comparisons, we notice that the Sentiment samples are shorter in length and the HurricaneExt samples contain more relevant content, such as hurricane-specific hashtags.
| AGR | OPT | LOV | SBM | AWE | DSP | RMR | CNT | AVG | |
|---|---|---|---|---|---|---|---|---|---|
| No-Pretrain | 67.6 | 75.0 | 54.0 | 67.4 | 68.3 | 55.7 | 58.5 | 66.8 | 64.1 |
| Multi | 73.5 | 75.2 | 55.2 | 68.8 | 67.5 | 53.1 | 60.0 | 71.7 | 65.6 |
| Binary | 67.7 | 74.9 | 53.7 | 64.7 | 67.5 | 54.5 | 55.8 | 63.6 | 62.8 |
| AGR | OPT | LOV | SBM | AWE | DSP | RMR | CNT | AVG | |
|---|---|---|---|---|---|---|---|---|---|
| No-Pretrain | 67.6 | 75.0 | 54.0 | 67.4 | 68.3 | 55.7 | 58.5 | 66.8 | 64.1 |
| 50 K | 73.5 | 75.3 | 60.7 | 69.7 | 67.1 | 51.3 | 55.2 | 66.3 | 64.9 |
| 100 K | 72.8 | 75.8 | 62.7 | 71.0 | 65.6 | 53.4 | 57.0 | 67.3 | 65.7 |
| 200 K | 73.4 | 75.6 | 69.1 | 69.8 | 66.5 | 53.3 | 57.1 | 69.8 | 66.8 |
| 400 K | 73.1 | 75.4 | 67.2 | 70.1 | 65.7 | 53.2 | 57.2 | 67.4 | 66.2 |
| 800 K | 73.5 | 75.3 | 56.2 | 69.4 | 65.1 | 54.4 | 57.1 | 68.2 | 64.9 |
| 1600 K | 71.2 | 75.2 | 64.8 | 68.8 | 64.7 | 55.1 | 56.1 | 70.7 | 65.8 |
| AGR | OPT | LOV | SBM | AWE | DSP | RMR | CNT | AVG | |
|---|---|---|---|---|---|---|---|---|---|
| No-Pretrain | 67.6 | 75.0 | 54.0 | 67.4 | 68.3 | 55.7 | 58.5 | 66.8 | 64.1 |
| 50 K | 70.7 | 74.9 | 54.6 | 66.3 | 67.0 | 53.9 | 59.3 | 65.8 | 64.0 |
| 100 K | 71.6 | 75.0 | 54.0 | 66.3 | 68.6 | 55.1 | 57.4 | 62.3 | 63.8 |
| 200 K | 69.1 | 74.9 | 53.6 | 66.2 | 67.3 | 54.3 | 57.9 | 64.4 | 63.5 |
| 400 K | 70.0 | 74.9 | 53.8 | 69.0 | 68.8 | 54.5 | 60.1 | 64.5 | 64.5 |
| 800 K | 70.5 | 74.9 | 55.1 | 66.2 | 69.0 | 53.3 | 59.4 | 63.4 | 64.0 |
| 1600 K | 69.1 | 74.9 | 55.3 | 66.5 | 67.2 | 54.6 | 59.3 | 65.0 | 64.0 |
| AGR | OPT | LOV | SBM | AWE | DSP | RMR | CNT | AVG | |
|---|---|---|---|---|---|---|---|---|---|
| No-Pretrain | 67.6 | 75.0 | 54.0 | 67.4 | 68.3 | 55.7 | 58.5 | 66.8 | 64.1 |
| 50 K | 72.7 | 75.0 | 60.0 | 67.2 | 69.0 | 56.4 | 60.4 | 72.2 | 66.6 |
| 100 K | 71.8 | 75.1 | 57.4 | 69.1 | 70.3 | 55.2 | 62.4 | 65.3 | 65.8 |
| 200 K | 73.6 | 75.4 | 69.8 | 68.9 | 69.7 | 57.9 | 60.2 | 70.2 | 68.2 |
| 400 K | 71.4 | 75.2 | 59.7 | 69.7 | 68.8 | 55.2 | 60.7 | 63.6 | 65.5 |
| 800 K | 71.4 | 75.3 | 58.9 | 69.4 | 69.6 | 54.0 | 60.3 | 71.3 | 66.3 |
| 1600 K | 73.3 | 75.7 | 50.7 | 68.3 | 65.5 | 55.8 | 61.0 | 64.1 | 64.3 |