[orcid=0000-0003-1243-7675] \cormark[1] \cortext[cor1]Corresponding author: zengzhi@mail.tsinghua.edu.cn
In-situ gamma-ray background measurements for next generation CDEX experiment in the China Jinping Underground Laboratory
Abstract
In-situ -ray measurements were performed using a portable high purity germanium spectrometer in Hall-C at the second phase of the China Jinping Underground Laboratory (CJPL-II) to characterise the environmental radioactivity background below 3 MeV and provide ambient -ray background parameters for next generation of China Dark Matter Experiment (CDEX). The integral count rate of the spectrum was 46.8 cps in the energy range of 60 to 2700 keV. Detection efficiencies of the spectrometer corresponding to concrete walls and surrounding air were obtained from numerical calculation and Monte Carlo simulation, respectively. The radioactivity concentrations of the walls in the Hall-C were calculated to be Bq/kg for 238U, Bq/kg for 232Th, Bq/kg for 40K. Based on the measurement results, the expected background rates from these primordial radionuclides of future CDEX experiment were simulated in unit of counts per keV per ton per year (cpkty) for the energy ranges of 2 to 4 keV and around 2 MeV. The total background level from primordial radionuclides with decay products in secular equilibrium are and cpkty for energy ranges of 2 keV to 4 keV and around 2 MeV, respectively.
keywords:
In-situ -ray measurements \sepEnvironmental radioactivity \sepUnderground laboratory \sepRare event physics \sepCJPL1 Introduction
The environmental background in the underground laboratories mainly includes cosmic muons, muon induced particles, rays from rocks and concrete, and neutrons from the (, n) reaction and spontaneous fission of radionuclides in the surrounding materials. Since the cosmic rays and cosmogenic radioactivity are drastically decreased with thick rock overburden as shielding [1], these underground laboratories [2, 3, 4, 5, 6] become favorable sites for rare event searching experiments requiring ultra-low background environment. Moreover, the muon and neutron background in underground laboratories have been studied comprehensively in literatures [7, 8, 9, 10, 11].
The China Jinping Underground Laboratory (CJPL) locates in a traffic tunnel under Jinping Mountain, southwest of China [12] with about 2400 m rock overburden vertically. CJPL-I has been in normal operation and provided low background environment for two dark matter experiments, CDEX [13, 14, 15, 16, 17, 18] and PandaX [19] since Dec. 2010. The second phase of CJPL (CJPL-II) was proposed to meet the growing space demands from rare event searching experiments. The construction of CJPL-II started in 2014 and the cavern excavation was completed in Jun. 2017. For better control of background radioactivity of CJPL-II, raw materials of concrete and other construction material were screened and selected by low-background -ray high purity germanium (HPGe) spectrometer named GeTHU [20] before used.
In this paper, in-situ -ray HPGe spectrometry was applied to measure the environmental radioactivity of the walls of the Hall-C of the CJPL-II and validate the results of background control measures with GeTHU. This method is widely used in environmental -ray measurements in underground laboratories for its advantage of not requiring sample preparation [21, 22, 23]. This portable HPGe spectrometer was calibrated to obtain the angular response and its detection efficiency of walls of Hall-C based on Beck formula [24]. Since 222Rn and its daughters in the air induce main background for -ray measurement, we employed Monte Carlo simulation with GEANT4 [25] to eliminate their contributions accordingly. The next section will describe the setup of in-situ measurements in CJPL-II and the derivation of detection efficiencies in detail. The results of measured spectrum and radioactivity concentration will be presented and discussed in the third section. The last section will present the expected background level induced by the primordial radionuclide in the concrete walls for the future CDEX experimental facility.
2 Experiment and methods
2.1 In-situ Measurements
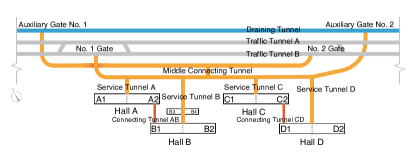
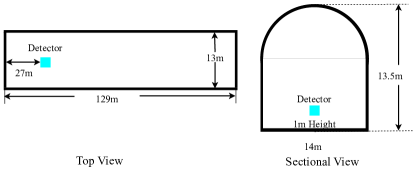
The portable coaxial HPGe detector manufactured by ORTEC was used in the in-situ -ray measurements of CJPL-II and its location under measurements in Hall-C is shown in Fig. 1. The level of radon, emanated naturally from the concrete and rocks, was measured by an AlphaGUARD radon monitor produced by Saphymo Gmbh which was placed next to the HPGe detector. The dimensions of Hall-C were obtained by a laser range finder.
The layout of CJPL-II tunnels and experimental halls are illustrated in Fig. 1. The CJPL-II has four experimental halls and each hall is divided into two sub-halls with numbers as postfix. The China Dark Matter Experiment (CDEX), with scientific goals of searching for light DM, operates germanium detector array in CJPL-I currently. Since the future CDEX experiment will be located in the Hall-C [26] and the dimensions of four experimental halls and their construction materials are almost the same. In-situ measurements in this work were carried out in Aug. 2019 in the Hall-C of CJPL-II.
2.2 Detector calibration
The relationship between the rates of -ray peaks and the radionuclide activities can be described as Eq. 1 and the numerical calculations are applied to determine the detection efficiency for different -ray peaks [24].
| (1) |
where is rate of the -ray peak and is the concentration of the radionuclide ( with the unit of Bq kg-1 for the concrete). is the coefficient representing angular response factor multiplying the effective front area and is the zenith angle between the location of radionuclides and germanium detector. is the energy of ray while is zenith angle. is the -ray flux received at detector’s location per unit concentration of nuclides. is the detector response to the incident rays at (called the effective front area) while is the detector angular response. In this work, the last two were measured in the angular calibration experiment.
As shown in Eq. 2, we integrate the detection efficiencies with the dimensions of Hall-C. i.e., the six surfaces of Hall-C and their geometry boundaries are set as upper or lower bounds in integration. To consider the penetrations of rays, the upper limits of integral related to the concrete thickness is set to be the actual thickness (0.2 m). The 0.2m-thick concrete will decrease gamma rays from the rock more than an order of magnitude, and the rock has less radioactivities compared with concrete as shown in Table 2. In this work, we ignore the penetrating gamma rays from rock. Following similar procedures described in Ref. [23], the numerical conversion factors are derived.
| (2) |
where the is the numerical conversion factor for different surfaces of the Hall-C. and are the distance between detector and calibration source, and the calibration source activity, respectively. is the concrete density while is the gamma ray intensity. and are the lower bound and upper bound of integral, which are related to the different surfaces of the Hall-C. is the coefficient representing the attenuation effect from concrete and air. The attenuation coefficients come from the NIST XCOM [27].
The angular correction factors and the effective front areas are determined through angular calibration experiment with a mixed calibration source containing 241Am, 137Cs, 60Co and 152Eu. The surface is fitted by Eq. 3. The relative biases between the fitting curve and the experimental data points are treated as the systematic uncertainties of factors.
| (3) | ||||
where represents the effective front area, and or with numerical subscripts are parameters determined by fitting.
Substituting the in the Eq. 2, one gets the numerical conversion factors for certain walls and certain -ray energy. The angular response of detector fluctuates with a relatively small range between and but decreases rapidly after , since most rays from the back of detector are shielded by the liquid nitrogen dewar and cold finger.
3 Results and discussion
3.1 Spectrum analysis
The energy spectra with the integral rate of 46.8 cps between 60 and 2700 keV was measured in experimental Hall-C with the in-situ -ray spectrometer as shown in Fig. 2. The -ray peaks from primordial radionuclides are labeled.
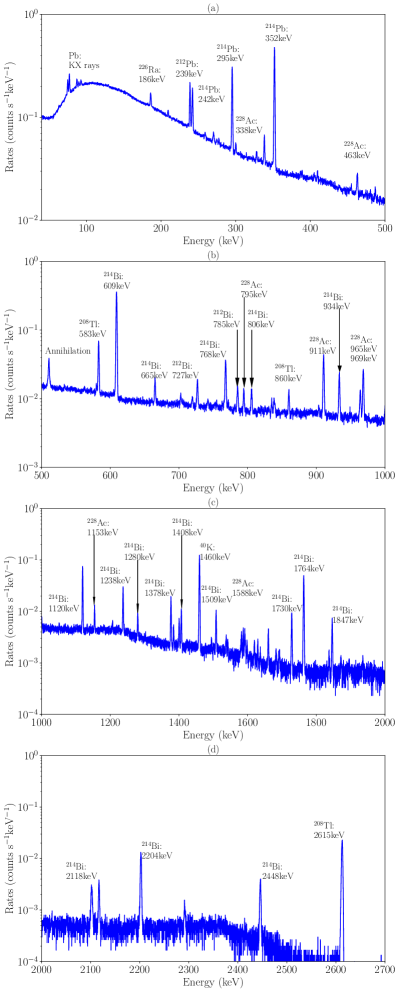
None artificial radionuclides are found in this spectrum. From Fig. 2(a), the -ray peaks (295 keV and 352 keV) are greater than the 186 keV -ray peak which is emitted by 226Ra. However, it reverses when measuring with the concrete samples, so the extra contribution in these -ray peaks should come from the 222Rn spread across the Hall-C, which is confirmed by the concentration of 222Rn measured by radon monitor. The contribution comes from 222Rn must be removed before calculating the concentrations of primordial radionuclides.
To extract the integral rates for different -ray peaks, the energy spectrum in certain energy range is fitted using a linear continuum plus a single Gaussian peak, the full width half maximum (FWHM) of which is calculated by Eq. 4. The energy resolution of these Gaussian peaks can be fitted with
| (4) |
where the is the Full Width Half Maximum of a Gaussian peak while is the energy. Both of them are in unit of keV.
The simulated detection efficiencies of the spectrometer placed in Hall-C are listed in Table 1. Without ventilation system yet in CJPL-II, the Radon concentration was measured to be Bq/m3, contributing a major background to the gamma-ray measurement. Thus, the detection efficiencies for its characteristic -ray peaks are simulated with Geant4.10.5.p01 assuming that the 222Rn together with daughters with short half-lives in equilibrium distributed in the air uniformly shown in Table 1. Since the space of Hall-C is more than 20000 m3, a simulation method was adopted to enhance statistics in this work. This method, so-called biasing sampling, increases the likelihood that particles have great contributions to improve the Monte Carlo simulation efficiency (see details in Ref. [28]).
| Energy | Concrete | Radon |
| keV | (cts/(Bq/kg)) | (cts/(Bq/m3)) |
| 295.4 | 2.29 | 2.5 |
| 351.9 | 4.37 | 4.27 |
| 609.3 | 4.76 | 3.29 |
| 1120.3 | 1.13 | 0.61 |
| 583.1 | 3.16 | - |
| 911.1 | 2.35 | - |
| 969.1 | 1.36 | - |
| 1460.8 | 0.65 | - |
3.2 Ambient radionuclide concentration
The concentrations of primordial radionuclides are calculated following the Eq. 5 and listed in Table 2 with measured results of selected concrete and rock samples for comparison. The background contributions of detector itself are not subtracted. We calculate the average of different gamma peaks related to primordal radionuclides to get their concentrations.
| (5) |
where is the concentration of certain radionuclide, and is the integral rate of a specific -ray peak. is the concentration of Rn in the Hall-C. is the volume of Hall-C while the is the simulated radon detection efficiency which is related to the -ray energies as shown in Table 1.
The uncertainties were estimated by error propagation according to Eq. 5. The uncertainties of peak area include the counting statistics and fitting uncertainties while the uncertainties of radon concentrations were directly provided by AlphaGAURD. Although the uncertainty of the experimental hall’s volume is hard to evaluate due to uneven walls of the hall, the relative uncertainty is assumed to be 10% conservatively. The uncertainties of radon detection efficiencies are ignored.
| Nuclides | Energy | In-situ | Sample measurements | |
| (keV) | measurements | Concrete | Rock | |
| (Bq/kg) | (Bq/kg) | (Bq/kg) | ||
| 238U | 295.4 | |||
| 351.9 | ||||
| 609.3 | ||||
| 1120.3 | ||||
| 232Th | 911.1 | |||
| 969.1 | ||||
| 583.1 | ||||
| 40K | 1460.8 | |||
The concentration of 232Th and 238U in CJPL-II together with the measured results in other underground laboratories are listed in Table 3 for comparison. The contamination is less than those of CJPL-I because of the stricter material screening and selection during the construction.
Comparing the in-situ measurements results with sample measurements, the concentration of 40K differs significantly from that of concrete sample. The in-situ measurements actually assess the average concentrations across the hall while the concrete samples are just pieces of the surrounding concrete walls. The measured concentrations for various concrete samples differ greatly especially for 40K (4.0 - 157.0 Bq/kg).
4 Background assessment for CDEX-100
The next phase of CDEX experiment named CDEX-100 will operate about 100 kg germanium detector array for enlarging the target mass and study background characteristics in the liquid nitrogen environment [30]. The CDEX germanium detector array will be installed in a cryotank, whose volume is about 1725 m3, immersed in the LN2 at Hall-C of CJPL-II, and the 6.5 m-thick LN2 will act as the passive shielding from ambient radioactivity.
Importing the measured concentrations of primordial radionuclides, the background simulation was conducted with a dedicated Monte Carlo framework called Simulation and Analysis of Germanium Experiment (SAGE) based on Geant4.10.5.p01 [25] for CDEX-100 experiment. The radionuclides are assumed to be uniformly distributed in the concrete wall close to the cryotank as shown in the Fig. 3. The gap between the inner and outer tanks is filled with the perlite and foam glass bricks as heat insulator.
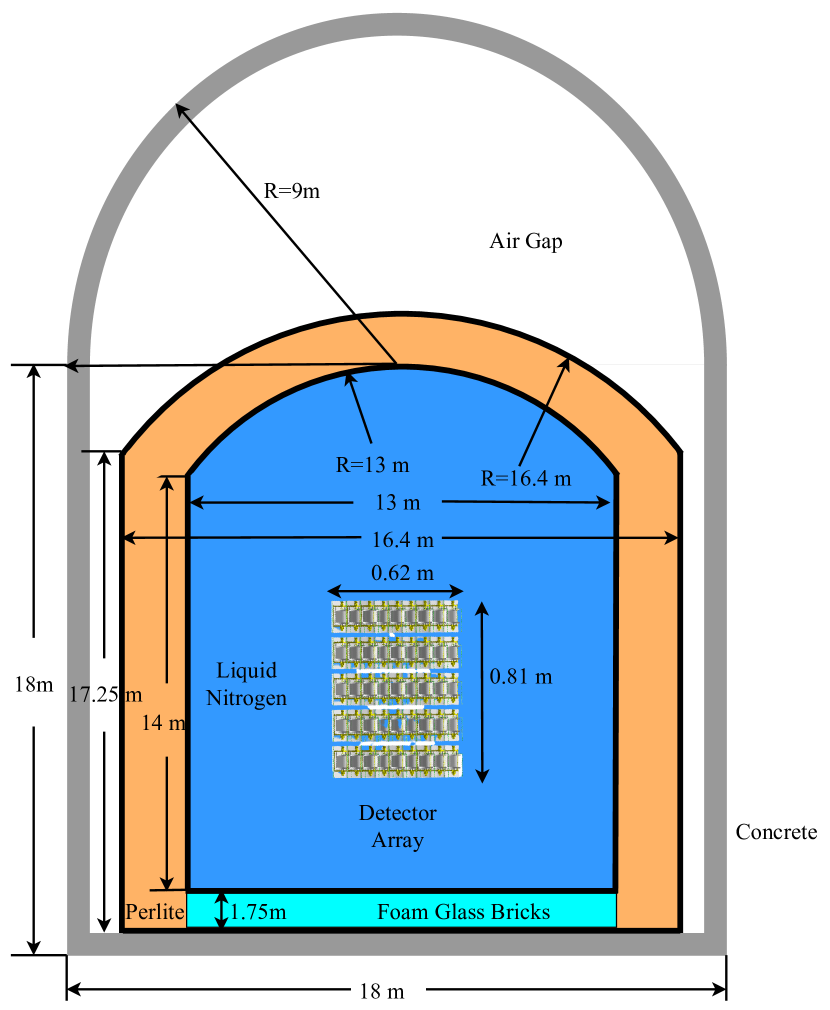
Thanks to the 6.5 m thick liquid nitrogen, gamma rays from primordial radionuclides could hardly penetrate. The uniformly distributed source for certain radionuclide at the inner surface of the concrete are assumed in the simulation rather than a volume source actually to get a higher simulation efficiency. The emitting efficiency of gamma-rays in the concrete wall was simulated separately and used to determine the surface source activity. The aforementioned biasing techniques were implemented to reduce statistic uncertainty.
The regions of interests (ROIs) in CDEX-100 are the energy ranges from 2 to 4 keV for light dark matter detection and around 2 MeV (2014 to 2064 keV for 76Ge neutrinoless double beta decay). The background rates of the two ROIs are simulated for all germanium detectors without any vetos or pulse shape discrimination. For 238U, the background rates are and cpkty for these energy ranges, while and cpkty for 232Th. Due to the lower Q value, 40K will only contribute cpkty to the range of 2 to 4 keV.
5 Conclusion
CJPL-II is a deep underground laboratory designed for future large-scale rare event searching physics experiments. We have applied in-situ -ray HPGe spectrometry to measure the -ray background in the Hall-C of CJPL-II. The numerical calculation based on the calibration of angular responses and Monte Carlo simulation were used to obtain detection efficiencies of rays from walls and surrounding air. After reduction of radon contribution, the radioactivity concentrations in the concrete are characterized as Bq/kg for 238U, Bq/kg for 232Th and Bq/kg for 40K, competitive with other underground laboratories. The background level from primordial radionuclides is simulated for the future CDEX-100 experiment. The background rates from primordial radionuclides are and cpkty in the ROIs of 2 to 4 keV and 2014 to 2064 keV, respectively. Other intrinsic backgrounds from the experimental setup will be studied in future work to get a whole background map in CDEX-100 experiment.
Acknowledgement
We gratefully acknowledge support from National Key R&D Program of China (No. 2017YFA0402201), National Natural Science Foundation of China (No. 11725522 & 11675088), and Tsinghua University Initiative Scientific Research Program (No.20197050007).
References
- [1] D. M. Mei and A. Hime. Muon-induced background study for underground laboratories. Phys. Rev. D, 73(5):053004, 2006.
- [2] L. Votano. The Gran Sasso Laboratory. Eur. Phys. J. Plus, 127(9):109, 2012.
- [3] N. J. T. Smith. The SNOLAB deep underground facility. Eur. Phys. J. Plus, 127(9):108, 2012.
- [4] D. S. Akerib et al. First Results from the Cryogenic Dark Matter Search in the Soudan Underground Laboratory. Phys. Rev. Lett., 93(21):211301, 2004.
- [5] A. Ianni. The canfranc underground laboratory: a multidisciplinary underground facility. J. Phys. Conf. Ser., 675(1):012002, 2016.
- [6] V. Gostilo et al. Characterisation of the natural gamma-ray background in the underground Callio Lab facility. Appl. Radiat. Isot., 156:108987, 2020.
- [7] V. Chazal et al. Neutron background measurements in the Underground Laboratory of Modane. Astropart. Phys., 9(2):163–172, 1998.
- [8] M. Robinson et al. Measurements of muon flux at 1070 m vertical depth in the Boulby Underground Laboratory. Nucl. Instrum. Methods Phys. Res., Sect. A, 511(3):347–353, 2003.
- [9] Y. C. Wu et al. Measurement of cosmic ray flux in the China JinPing Underground Laboratory. Chin. Phys. C, 37(8):086001, 2013.
- [10] N. Abgrall et al. Muon flux measurements at the Davis campus of the Sanford Underground Research Facility with the MAJORANA DEMONSTRATOR veto system. Astropart. Phys., 93:70–75, 2017.
- [11] Q. D. Hu et al. Neutron background measurements at China Jinping Underground Laboratory with a Bonner Multi-sphere Spectrometer. Nucl. Instrum. Methods Phys. Res., Sect. A, 859:37–40, 2017.
- [12] J. P. Cheng et al. The China Jinping Underground Laboratory and Its Early Science. Annu. Rev. Nucl. Sci., 67(1):231–251, 2017.
- [13] Q. Yue et al. Limits on light weakly interacting massive particles from the CDEX-1 experiment with a -type point-contact germanium detector at the China Jinping Underground Laboratory. Phys. Rev. D, 90:091701, 2014.
- [14] H. Jiang et al. Limits on Light Weakly Interacting Massive Particles from the First Data of the CDEX-10 Experiment. Phys. Rev. Lett., 120(24):241301, 2018.
- [15] L. T. Yang et al. Limits on light WIMPs with a 1 kg-scale germanium detector at 160 eVee physics threshold at the China Jinping Underground Laboratory. Chin. Phys. C, 42(2):023002, 2018.
- [16] L. T. Yang et al. Search for Light Weakly-Interacting-Massive-Particle Dark Matter by Annual Modulation Analysis with a Point-Contact Germanium Detector at the China Jinping Underground Laboratory. Phys. Rev. Lett., 123:221301, 2019.
- [17] Z. Z. Liu et al. Constraints on Spin-Independent Nucleus Scattering with sub-GeV Weakly Interacting Massive Particle Dark Matter from the CDEX-1B Experiment at the China Jinping Underground Laboratory. Phys. Rev. Lett., 123:161301, 2019.
- [18] Z. She et al. Direct Detection Constraints on Dark Photons with the CDEX-10 Experiment at the China Jinping Underground Laboratory. Phys. Rev. Lett., 124:111301, Mar 2020.
- [19] X. Y. Cui et al. Dark Matter Results from 54-Ton-Day Exposure of PandaX-II Experiment. Phys. Rev. Lett., 119(18):181302, 2017.
- [20] Z. Zeng et al. The characteristics of a low background germanium gamma ray spectrometer at China JinPing Underground Laboratory. Appl. Radiat. Isot., 91:165–170, 2014.
- [21] D. Malczewski et al. Gamma background measurements in the Laboratoire Souterrain de Modane. J. Radioanal. Nucl. Chem., 292(2):751–756, 2012.
- [22] D. Malczewski et al. Gamma background measurements in the Gran Sasso National Laboratory. J. Radioanal. Nucl. Chem., 295(1):749–754, 2013.
- [23] Z. Zeng et al. Environmental gamma background measurements in China Jinping Underground Laboratory. J. Radioanal. Nucl. Chem., 301(2):443–450, 2014.
- [24] H. L. Beck et al. In situ Ge (Li) and NaI (Tl) gamma-ray spectrometry. Technical Report HASL-258, New York Operat. Def. Health Safety Lab., New York, Sep 1972.
- [25] S. Agostinelli et al. Geant4—a simulation toolkit. Nucl. Instrum. Methods Phys. Res., Sect. A, 506(3):250–303, 2003.
- [26] H. Ma et al. CDEX dark matter experiment: Status and prospects. arXiv:1712.06046, 2017.
- [27] M. J. Berger et al. Xcom: Photon cross section database (version 1.5), 2010. [Online] Available: http://physics.nist.gov/xcom [2020, Jan 13].
- [28] Monte Carlo Integrations II: Improving efficiency. In Matt Pharr and Greg Humphreys, editors, Physically Based Rendering, pages 663 – 718. Morgan Kaufmann, Burlington, 2004.
- [29] D.S. Akerib et al. Measurement of the gamma ray background in the Davis cavern at the Sanford Underground Research Facility. Astropart. Phys., 116:102391, 2020.
- [30] Hao Ma, Ze She, Zhongzhi Liu, Litao Yang, Qian Yue, Zhi Zeng, and Tao Xue. Results of direct dark matter detection with CDEX experiment at CJPL. J. Phys. Conf. Ser., 1468:012070, 2020.