Linkage between scattering rates and superconductivity in doped ferropnictides
Abstract
We report an angle-resolved photoemission study of a series of hole and electron doped iron-based superconductors, their parent compound BaFe2As2, and their cousins BaCr2As2 and BaCo2As2. We focus on the inner hole pocket, which is the hot spot in these compounds. More specifically, we determine the energy (E) dependent scattering rate as a function of the count. Moreover, for the compounds K0.4Ba0.6Fe2As2 and BaCr2As2 we derive the energy dependence of the renormalization function and the imaginary part of the self-energy function . We obtain a non-Fermi-liquid-like linear in energy scattering rate , independent of the dopant concentration. The main result is that the slope , reaches its maxima near optimal doping and scales with the superconducting transition temperature. This supports the spin fluctuation model for superconductivity for these materials. In the optimally hole-doped compound, the slope of the scattering rate of the inner hole pocket is about three times bigger than the Planckian limit . This result together with the energy dependence of the renormalization function signals very incoherent charge carriers in the normal state which transform at low temperatures to a coherent unconventional superconducting state.
I I. INTRODUCTION
There is an ongoing debate about the mechanism for unconventional superconductivity in strange metals. For the iron-based superconductors (FeSCs) [1] the most popular model is connected with spin fluctuation scattering processes between hole pockets in the center and electron pockets at the border of the Brillouin zone (BZ), together with a sign change of the superconducting order parameter: the superconductivity [2, 3]. Thus it is very interesting to study the energy () dependence of the scattering rates on those sections of the Fermi surface which show the largest superconducting order parameter (hot spots). Those studies as a function of doping concentration are the main topic of the present paper. In a local approximation, the scattering rates depend on the effective Coulomb interaction , where and are the on-site Coulomb interaction and the Hund exchange interaction, respectively. Therefore, it is interesting to complement the scattering rates with results on correlation effects using other observables, e.g., the renormalization function . Moreover, the investigation of correlation effects in multi-orbital systems as such is at present one of the great unresolved problems in solid state physics [4, 5, 6, 7, 8, 9, 10].
The cuprates have just one band near the Fermi surface. In the FeSCs there are three hole and two electron pockets, and several of them have sections with different orbital character [see Fig. 1(a)]. Therefore, it is rather difficult to receive a microscopic picture for the mechanism of high- superconductivity in these materials and one needs momentum dependent results which one can obtain from Angle-Resolved Photoemission Spectroscopy (ARPES) [11, 12].
In the present contribution, we focus on the doping dependence of the strength of the scattering rates of the inner hole pocket. This pocket corresponds to a hot spot exhibiting the highest isotropic superconducting gap [13] and according to our previous studies on various FeSCs shows the highest scattering rates when compared with the other pockets [14, 15, 16, 17]. We obtain a doping dependence with a pronounced maximum near optimal hole doping for both, the superconducting transition temperature and for the slope . We therefore conclude that the scattering rates of the inner hole pockets are related to superconductivity. In this way we support the model [2, 3]. From this comparison we also derive that superconductivity is determined by a combination of correlation effects and nesting conditions. Furthermore, using our new elaborated evaluation technique for the analysis of and the renormalization function , we conclude that the charge carriers at the hot spots have non-Fermi-liquid character. Finally, from our experimental scattering rates of optimally hole doped FeSCs we conclude that in particular for the optimally hole doped compound, the hot spot charge carriers are heavily incoherent, i.e., well above the Planckian limit of [18].
II II. EXPERIMENTAL
Single crystals were grown using the self-flux technique [19, 20, 21]. ARPES measurements were conducted at the and -ARPES end stations attached to the beamline UE112 PGM at BESSY. All data presented in this contribution were taken in the normal state at temperatures between 5 and 50 K. The achieved energy and angle resolutions were between 4 and 15 meV and 0.2∘, respectively. Polarized photons were used and an attempt was made to achieve prefect alignment of the sample to select spectral weight with a specific orbital character and to avoid a contamination from other bands [22, 23]. Photon energies were varied between eV to reach values close to points in the BZ. An inner potentials of 14 eV was used to calculate the values from the photon energy.
III III: DATA ANALYSIS
Using ARPES one measures the product of the spectral function [24], with a transition matrix element, and the Fermi function. This product is convoluted with the energy and momentum resolution [11, 12]. The spectral function is given by
| (1) |
The spectral function , the scattering rate , and the renormalization function are energy, momentum (), and temperature () dependent. is related to the complex self-energy by the relation . Z is connected to the by . and are the bare particle dispersion and the renormalized dispersion, respectively [24, 11, 12]. For a Fermi liquid, , const with equal to the mass enhancement. which is related to the inverse life time of the quasi-particles, is quadratic in energy and in temperature.
Very often the description of the spectral function is extended to higher scattering rates, i.e., is comparable to the binding energy [25, 26]. For this case, there is the conjecture of a marginal Fermi liquid [27]. There the complex self-energy is given by
| (2) |
and is a cut-off energy. In this case the renormalization function is energy dependent [28]:
| (3) |
We emphasize that for , is linear in energy.
In the standard procedure for the evaluation of the scattering rates from the ARPES data, the momentum distribution curves (MDC, cuts at constant energy) are fitted by a Lorentzian and the FWHM momentum width is multiplied by the velocity yielding [26, 29, 30, 31, 32, 11, 33, 34, 35, 36]. Very often non-Lorentzian MDCs or energy distribution curves (EDC, cuts at constant k) are realized in the ARPES data. For example a strong increase of at high energies leads to long tails in the EDCs. Furthermore, large scattering rates lead to contributions from the unoccupied part of the band causing an apparent back-dispersion for in hole pockets [37] similar to dispersions in the superconducting state [see Fig. 1 (b)]. All this may lead to incorrect scattering rates when using the standard evaluation.
To derive more exact data for the scattering rates, we developed a new elaborate evaluation method. We fit the two-dimensional intensity distribution map at once, using as parameters at each energy point as well as parameters describing the dispersion of . The assumption of a parabolic dispersion gives reasonably fits. Higher orders in did not improve them. Other fit parameters describe a weakly momentum and energy dependent background which is added to the spectral function. The sum is multiplied with the Fermi function and the product is then convoluted with the energy and momentum resolution. We mention that very close to the Fermi level, the derived values are very sensitive to the exact position of the Fermi level. Normally, for the renormalization function we use two parameters describing a polynominal energy dependence. In two cases, i.e., Ba0.6K0.4Fe2As2 and BaCr2As2, we use for each energy the parameters [see Fig. 1(e)]. The error bars for the scattering rates are not statistical errors, but the errors are estimated from the deviations from a mean value of several measurements using different spectrometers and photon energies.
From the analysis of the ARPES data described above, we obtain the energy dependent total scattering rate which is the sum of the elastic scattering rate and the inelastic scattering rate . To obtain the inelastic scattering rates we have to subtract the elastic scattering rates. is usually assumed to be constant [26] which is reasonably in a semi-classical picture. For a linear dispersion, when the velocity is constant, is constant. The momentum width at the Fermi level is related to the constant inverse mean free path between scattering sites inducing elastic scattering. In the case of a parabolic dispersion, one has to subtract the energy dependent from . In a semi-classical picture, can be calculated from the data near because at small temperatures, is zero and thus . Thus we derive for the energy dependence of the elastic scattering . The velocities are taken from the measured dispersion. Because it is not clear whether the semi-classical model for the elastic scattering is really applicable for a highly correlated electron system, in this contribution, we prefer to show the full scattering rate .
IV V. RESULTS
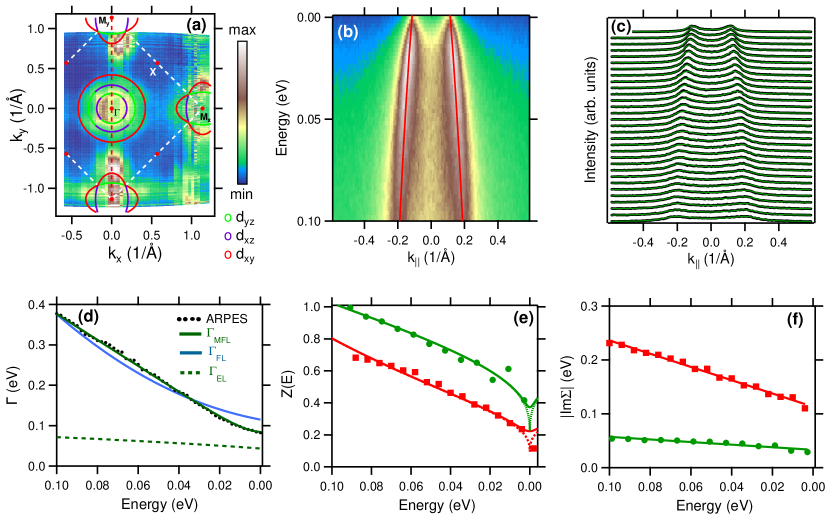
In Fig. 1 we exemplary show ARPES data of optimally hole-doped K0.4Ba0.6Fe2As2 ( K), recorded at a temperature K. Fig. 1(a) shows the measured Fermi surface, derived from the intensity close to the Fermi level. The panel also presents a schematic plot of the Fermi surface in which the predominant Fe orbital character of the sections are indicated in colors. In Fig. 1(b) we show an energy-momentum distribution map of the measured intensity measured along the high symmetry direction -My [see the red dashed line in Fig. 1(a))]. Under these experimental conditions, near the point we record the spectral weight of the inner hole pocket having predominantly Fe character [22].
A waterfall plot of MDCs together with fits is shown in Fig. 1(c) for the energy range eV. From those fits, we obtain the dispersion , the scattering rates , and the renormalization function . We emphasize that our evaluation method for is much better suited for data close to the top of bands or close to the Fermi level than the standard evaluation method.
The derived dispersion is shown as a red line in Fig. 1(b). In Fig. 1(d) we present the derived experimental together with fits. The blue line is related to a fit for a Fermi liquid [ with ]. The green line corresponds to a non-Fermi liquid fit with [see Eq. (2)]. is due to impurities or defects at the surface [11, 12]. Using a parabolic band and a constant mean free path we derive a slightly energy dependent [see the dashed green line in Fig. 1(d)].
The Fermi liquid fit does not describe the experimental results. On the other hand, the non-Fermi liquid fit with is much closer to the ARPES data. K eV and eV. The difference K eV agrees well with the contribution K corresponding to a finite temperature K equal to eV. eV together with the Fermi velocity eVÅ, corresponds to a mean free path of Å, a value which is quite common in ARPES experiments, also for not strongly correlated materials [38, 26].
In Fig. 1(e) we depict the experimental renormalization function together with a fit using Eq. (3). In that panel we compare the data of K0.4Ba0.6Fe2As2 with those of BaCr2As2, which is a less correlated material (see below). For K0.4Ba0.6Fe2As2 and BaCr2As2 we derive and 0.4 and cutoff energies equal to 0.13 eV and 0.1 eV, respectively.
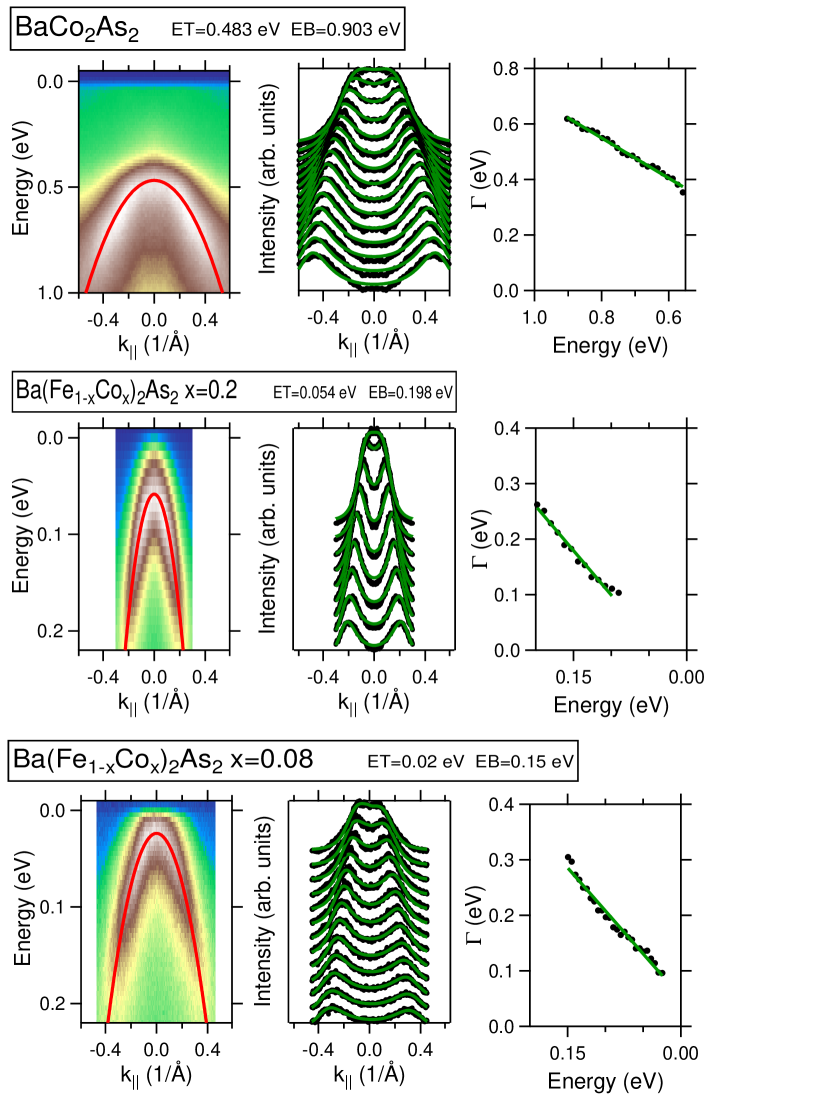
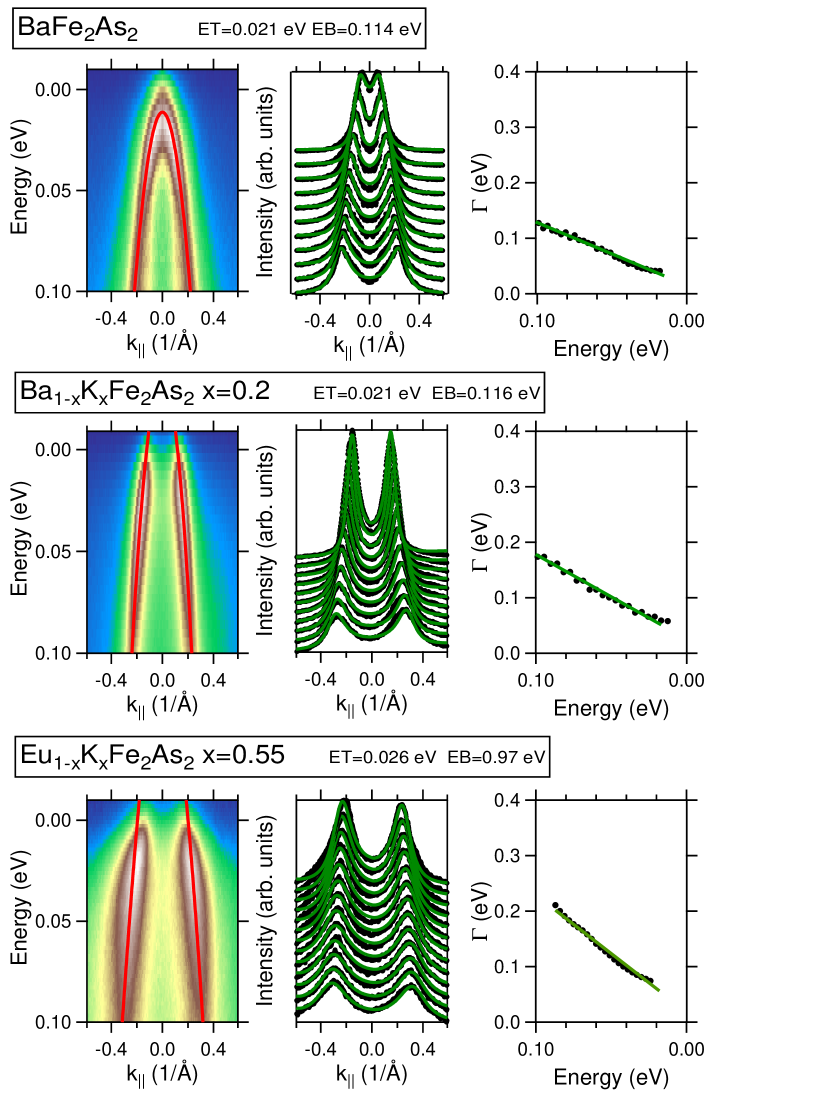
In the following we show ARPES data for various electron and hole doped FeSCs, the undoped antiferromagnetic parent compound BaFe2As2, and the cousin compounds BaCr2As2 and BaCo2As2. We depict the energy-momentum distribution maps together with fit results of the dispersion (solid red line) measured along the high symmetry direction -My, waterfall plots of the MDCs together with fit results, and energy dependent scattering rates , together with a fit using a linear energy dependence of . The energy range of the waterfall plots is listed after the chemical formula of the compounds.
In Fig. 2 we depict data of BaCo2As2 (upper row) measured with a photon energy h eV and a temperature of K. The middle row shows analogous results for Ba(Fe1-xCoAs2, (h eV, K). The lower row shows analogous results for Ba(Fe1-xCoAs2 (h eV, K).
In Fig. 3 we show data of BaFe2As2 (upper row) measured with a photon energy h eV and a temperature of K. The middle row shows results for Ba1-xKxFe2As2, (h eV, K). The lower row shows results for Eu1-xKxFe2As2, (h eV, K).
In Fig. 4 we show in the upper row data together with fit results of Ba1-xKxFe2As2 (h eV, K). The middle row shows results for KFe2As2 (h eV, K) and the lower row depicts data for BaCr2As2 (h eV, K). In the latter, a low intensity dispersion is also visible from the middle hole pocket.

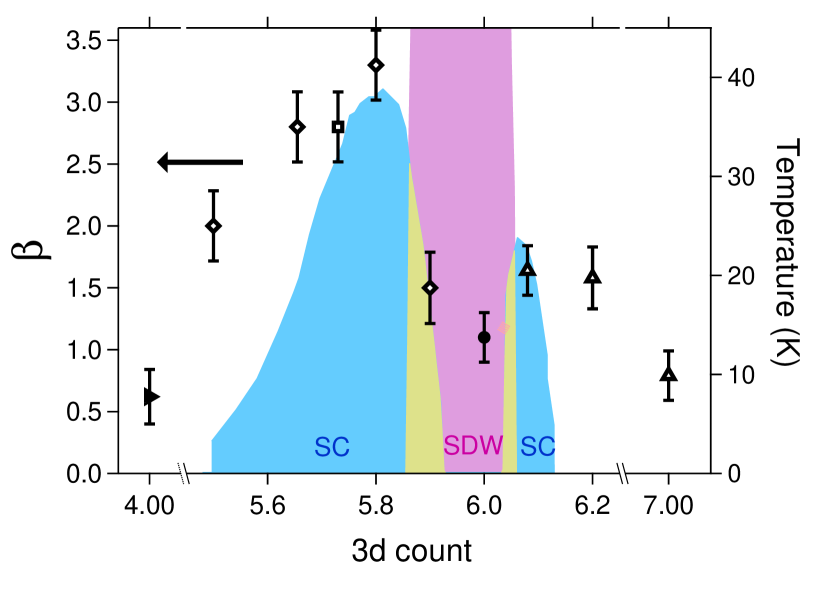
The results of together with a phase diagram [20] as a function of the count, i.e., the number of electrons derived from the chemical composition, are presented in Fig. 5.
V IV. DISCUSSION
Regions with a linear increase of the scattering rates as a function of energy or temperature have been detected in resistivity [40, 41, 42] and ARPES data [29, 31, 32, 43, 44, 36, 14, 15, 45, 17, 16, 39] in various correlated metals. In this contribution we emphasize that for the hot spot of Ba1-xKxFe2As2, both from the energy and the influence of a finite temperature, an incoherent non-Fermi-liquid behavior is observed. The linear energy dependence of in the full range of the count from 4 to 7 is different from that at the nodal point in cuprates, where for the scattering rate a continuous superposition of a linear and a quadratic energy dependence [40] or a dependence with changing from one to two was discussed [43], when moving from optimal to overdoped compounds.
It is interesting to note that the largest slope of the scattering rate occurs near the optimally hole-doped compound. For this count the scattering rate is about three times bigger than the energy and therefore well above the Planckian limit where [18, 42]. Moreover, it is also remarkable that the slope, which to our knowledge is the largest slope ever detected by ARPES, is about three times bigger than that in optimally doped cuprate superconductors along the diagonal direction [29, 32, 46, 43, 36]. It is certainly a challenge to understand how the completely incoherent hot spots in the normal state transform into a coherent superconducting state.
Looking to Fig. 5, we detect a clear linkage of the scattering rates with the superconducting transition temperatures . There is a clear maximum near optimally hole doping. This strongly supports the scenario that superconductivity is induced by spin flip interband transitions between hole pockets and electron pockets [2, 3]. The reduced scattering rates for BaCr2As2 and BaFe2As2 can be probably explained by the existence of a magnetic order.
Using Fermi’s Golden rule and a local approximation, the scattering rate is related to the on-site interaction and the charge susceptibility which determines the relaxation of the photoelectron to lower energies by an electron-hole excitations [47, 48]. According to Avigo et al. [16], the top of the inner hole pocket and the bottom of the inner electron pocket are separated in these compounds by eV. In a rigid band approximation, the Fermi level moves 0.5 eV per dopant electron/hole. Assuming that intra-band transitions would only be possible when hole and electron pockets cross the Fermi level, these transitions could only occur in a range of a count of 0.2 around the undoped sample. This is in line with the maximum of for the hole doped system but too large for the electron doped systems.
Superconductivity at higher dopant concentration could be explained by the fact that the equation for the superconducting transition temperature yields also solutions for excitations away from the Fermi level in a range of the coupling energies. If these excitations are spin fluctuations, which have an energy range between 0.01 to 0.2 eV [49, 50], we can understand that there is also a finite in the over-doped compounds. On the other hand, the decrease of can be understood by a decrease of the spin susceptibility, also detected by inelastic neutron scattering [50], because in the overdoped compounds, the electron or hole pocket has moved far above or below the Fermi level, respectively. This reduction of the scattering rate is clearly detected for strongly over-doped compounds. On the other hand, thermal properties have derived a strong enhancement of the effective mass when going to higher hole doping [20]. This indicates that the related flat bands close to the Fermi level, detected in KFe2As2 by ARPES [51] and by quantum-oscillation experiments [52], are causing a large band mass enhancement, but not superconductivity.
For a count of four (BaCr2As2 [39, 53], see Fig. 5) as well as for seven or eight (BaCo2As2 [54] or BaNi2As2 [55]), reduced scattering rates or correlation effects are detected. A reduction of correlation effects at higher electron doping was also derived from ARPES results on the mass enhancement in BaCo2As2 [54] and BaNi2As2 [55].
As explained in Ref. [15] the larger scattering rate for the hole doped systems, when compared to the electron systems, can be explained by an enhancement of in the proximity to the half-filled shell due to Hund exchange coupling [56, 57]. This means that our experimental data indicate that the on-site Coulomb interaction , the Hund exchange interaction , the band filling, and the nesting conditions determines the strength of the correlation effects in the inner hole pocket, which shows the highest superconducting gap.
As shown in our previous work on electron doped Ba(Fe1-xCox)2As2 and BaFe1-x(Co,Rh)xAs2 [14, 15], on undoped LiFeAs [17], and on hole doped Ba1-xKxFe2As2, [15], the middle hole pocket ( character) show scattering rates which are reduced by a factor of two to three when compared with the inner hole pocket ( orbital character). This tendency is also observed in some hole doped Ba1-xKxFe2As2 compounds for different from 0.4 (not shown). Moreover, also in our recent work on EuRbFe4As4 this difference in the scattering rate between the inner and the middle hole pockets was detected [58]. Because the spectral weight of the outer hole pocket ( character) is very sensitive to impurities or dopant atoms, we have data for this pocket only for BaFe1-x(Co,Rh)xAs2 [14, 15] and LiFeAs [17]. There, we also detect a reduced scattering rate of the outer hole pocket when compared with the inner hole pocket. We point out that on the middle and the outer hole pockets, also smaller superconducting gaps have been detected [13]. This supports our suggestion, that the scattering rates are related to the superconducting order parameter.
With increasing electron doping by Co, the stronger reduction of compared to the weaker decay of the scattering rates for overdoped Ba(Fe1-xCox)2As2 can be explained by a large pair-breaking by Co scatterers [20]. The observation of a finite scattering rate at high dopant concentrations can be explained by a scattering from the inner hole pocket to other bands close to the Fermi level.
The renormalization function shows a strong energy and count dependence [see Fig. 1(e)] as expected for a non-Fermi liquid [27]. The less correlated BaCr2As2 compound (smaller ) shows a smaller compared to the more correlated K0.4Ba0.6Fe2As2. The cut-off energy for the latter compound is close to the extension of the Drude peak detected by optical spectroscopy [59]. The observation of an almost equal cut-off energy for BaCr2As2 is not expected when one assumes that is related to the band renormalization. The finite value of of K0.4Ba0.6Fe2As2 may be caused by the finite temperature.
We have also calculated from the relation using our experimental values for and . The results for K0.4Ba0.6Fe2As2 and BaCr2As2 are presented in Fig. 1(f). For both compounds we obtain a linear energy dependence. The coupling constants derived from the slopes of are and 0.2 for K0.4Ba0.6Fe2As2 and BaCr2As2, respectively. It is interesting to compare the former result with semi-phenomenological calculations on the basis of a coupling of the electrons to spin fluctuations, obtained for the inner hole pocket of K0.4Ba0.6Fe2As2 in the normal state [60]: at higher energies and the slope is close to one in good agreement with our experimental results. We conclude that our ARPES results on the energy dependence and the finite temperature influence of and consistently support a charge carrier behavior close to a marginal Fermi liquid.
VI ACKNOWLEDGMENTS
J.F. thanks Luis Craco for helpful discussions. This work has been supported by the Deutsche Forschungsgemeinschaft (DFG) through the Priority Program SPP1458, through the Emmy Noether Programm in project WU595/3-3 (S.W.), through Research Training Group GRK 1621, and via Grant No. DFG AS 523/4-1 (S.A.).
References
- Kamihara et al. [2008] Y. Kamihara, T. Watanabe, M. Hirano, and H. Hosono, J. Am. Chem. Soc. 130, 3296 (2008).
- Mazin et al. [2008] I. I. Mazin, D. J. Singh, M. D. Johannes, and M. H. Du, Phys. Rev. Lett. 101, 057003 (2008).
- Kuroki et al. [2008] K. Kuroki, S. Onari, R. Arita, H. Usui, Y. Tanaka, H. Kontani, and H. Aoki, Phys. Rev. Lett. 101, 087004 (2008).
- Haule and Kotliar [2009] K. Haule and G. Kotliar, New J. Phys. 11, 025021 (2009).
- Aichhorn et al. [2009] M. Aichhorn, L. Pourovskii, V. Vildosola, M. Ferrero, O. Parcollet, T. Miyake, A. Georges, and S. Biermann, Phys. Rev. B 80, 085101 (2009).
- Aichhorn et al. [2010] M. Aichhorn, S. Biermann, T. Miyake, A. Georges, and M. Imada, Phys. Rev. B 82, 064504 (2010).
- de Medici [2011] L. de Medici, Phys. Rev. B 83, 205112 (2011).
- Werner et al. [2012] P. Werner, M. Casula, T. Miyake, F. Aryasetiawan, A. J. Millis, and S. Biermann, Nat Phys 8, 331 (2012).
- Razzoli et al. [2015] E. Razzoli, C. E. Matt, M. Kobayashi, X.-P. Wang, V. N. Strocov, A. van Roekeghem, S. Biermann, N. C. Plumb, M. Radovic, T. Schmitt, C. Capan, Z. Fisk, P. Richard, H. Ding, P. Aebi, J. Mesot, and M. Shi, Phys. Rev. B 91, 214502 (2015).
- Bascones et al. [2016] E. Bascones, B. Valenzuela, and M. J. Calderón, Comptes Rendus Physique 17, 36 (2016).
- Damascelli et al. [2003] A. Damascelli, Z. Hussain, and Z.-X. Shen, Rev. Mod. Phys. 75, 473 (2003).
- Sobota et al. [2020] J. A. Sobota, Y. He, and Z.-X. Shen, arXiv 2008.02378 (2020).
- Ding et al. [2008] H. Ding, P. Richard, K. Nakayama, K. Sugawara, T. Arakane, Y. Sekiba, A. Takayama, S. Souma, T. Sato, T. Takahashi, Z. Wang, X. Dai, Z. Fang, G. F. Chen, J. L. Luo, and N. L. Wang, EPL 83, 47001 (2008).
- Fink et al. [2015] J. Fink, A. Charnukha, E. D. L. Rienks, Z. H. Liu, S. Thirupathaiah, I. Avigo, F. Roth, H. S. Jeevan, P. Gegenwart, M. Roslova, I. Morozov, S. Wurmehl, U. Bovensiepen, S. Borisenko, M. Vojta, and B. Büchner, Phys. Rev. B 92, 201106 (2015).
- Fink et al. [2017] J. Fink, E. D. L. Rienks, S. Thirupathaiah, J. Nayak, A. van Roekeghem, S. Biermann, T. Wolf, P. Adelmann, H. S. Jeevan, P. Gegenwart, S. Wurmehl, C. Felser, and B. Büchner, Phys. Rev. B 95, 144513 (2017).
- Avigo et al. [2017] I. Avigo, S. Thirupathaiah, E. D. L. Rienks, L. Rettig, A. Charnukha, M. Ligges, R. Cortes, J. Nayak, H. S. Jeevan, T. Wolf, Y. Huang, S. Wurmehl, M. I. Sturza, P. Gegenwart, M. S. Golden, L. X. Yang, K. Rossnagel, M. Bauer, B. Büchner, M. Vojta, M. Wolf, C. Felser, J. Fink, and U. Bovensiepen, Phys. Status Solidi B 254, 1600382 (2017).
- Fink et al. [2019] J. Fink, J. Nayak, E. D. L. Rienks, J. Bannies, S. Wurmehl, S. Aswartham, I. Morozov, R. Kappenberger, M. A. ElGhazali, L. Craco, H. Rosner, C. Felser, and B. Büchner, Phys. Rev. B 99, 245156 (2019).
- Zaanen [2004] J. Zaanen, Nature 430, 512 (2004).
- Morozov et al. [2010] I. Morozov, A. Boltalin, O. Volkova, A. Vasiliev, O. Kataeva, U. Stockert, M. Abdel-Hafiez, D. Bombor, A. Bachmann, L. Harnagea, M. Fuchs, H.-J. Grafe, G. Behr, R. Klingeler, S. Borisenko, C. Hess, S. Wurmehl, and B. Büchner, Crystal Growth & Design 10, 4428 (2010).
- Hardy et al. [2016] F. Hardy, A. E. Böhmer, L. de’Medici, M. Capone, G. Giovannetti, R. Eder, L. Wang, M. He, T. Wolf, P. Schweiss, R. Heid, A. Herbig, P. Adelmann, R. A. Fisher, and C. Meingast, Phys. Rev. B 94, 205113 (2016).
- Maiwald et al. [2012] J. Maiwald, H. S. Jeevan, and P. Gegenwart, Phys. Rev. B 85, 024511 (2012).
- Fink et al. [2009] J. Fink, S. Thirupathaiah, R. Ovsyannikov, H. A. Duerr, R. Follath, Y. Huang, S. de Jong, M. S. Golden, Y.-Z. Zhang, H. O. Jeschke, R. Valenti, C. Felser, S. D. Farahani, M. Rotter, and D. Johrendt, Phys. Rev. B 79, 155118 (2009).
- Moser [2017] S. Moser, Journal of Electron Spectroscopy and Related Phenomena 214, 29 (2017).
- Mahan [2000] G. D. Mahan, Many-Particle Physics (Kluwer Academic/Plenum Publishers, New York, 2000).
- Grimvall [1981] G. Grimvall, The electron-phonon interaction in metals (North-Holland, 1981).
- Valla et al. [1999a] T. Valla, A. V. Fedorov, P. D. Johnson, and S. L. Hulbert, Phys. Rev. Lett. 83, 2085 (1999a).
- Varma et al. [1989] C. M. Varma, P. B. Littlewood, S. Schmitt-Rink, E. Abrahams, and A. E. Ruckenstein, Phys. Rev. Lett. 63, 1996 (1989).
- Varma [2020] C. M. Varma, RMP 92, 031001 (2020).
- Valla et al. [1999b] T. Valla, A. V. Fedorov, P. D. Johnson, B. O. Wells, S. L. Hulbert, Q. Li, G. D. Gu, and N. Koshizuka, Science 285, 2110 (1999b).
- LaShell et al. [2000] S. LaShell, E. Jensen, and T. Balasubramanian, PRB 61, 2371 (2000).
- Bogdanov et al. [2000] P. V. Bogdanov, A. Lanzara, S. A. Kellar, X. J. Zhou, E. D. Lu, W. J. Zheng, G. Gu, J.-I. Shimoyama, K. Kishio, H. Ikeda, R. Yoshizaki, Z. Hussain, and Z. X. Shen, Phys. Rev. Lett. 85, 2581 (2000).
- Kaminski et al. [2001] A. Kaminski, M. Randeria, J. C. Campuzano, M. R. Norman, H. Fretwell, J. Mesot, T. Sato, T. Takahashi, and K. Kadowaki, Phys. Rev. Lett. 86, 1070 (2001).
- Kordyuk et al. [2006] A. A. Kordyuk, S. V. Borisenko, V. B. Zabolotnyy, J. Geck, M. Knupfer, J. Fink, B. Büchner, C. T. Lin, B. Keimer, H. Berger, A. V. Pan, S. Komiya, and Y. Ando, Phys. Rev. Lett. 97, 017002 (2006).
- Brouet et al. [2016] V. Brouet, D. LeBoeuf, P.-H. Lin, J. Mansart, A. Taleb-Ibrahimi, P. Le Fevre, F. Bertran, A. Forget, and D. Colson, Phys. Rev. B 93, 085137 (2016).
- Cao et al. [2016] Y. Cao, Q. Wang, J. A. Waugh, T. J. Reber, H. Li, X. Zhou, S. Parham, S.-R. Park, N. C. Plumb, E. Rotenberg, A. Bostwick, J. D. Denlinger, T. Qi, M. A. Hermele, G. Cao, and D. S. Dessau, Nature Communications 7, 11367 (2016).
- Reber et al. [2019] T. J. Reber, X. Zhou, N. C. Plumb, S. Parham, J. A. Waugh, Y. Cao, Z. Sun, H. Li, Q. Wang, J. S. Wen, Z. J. Xu, G. Gu, Y. Yoshida, H. Eisaki, G. B. Arnold, and D. S. Dessau, Nature Communications 10, 5737 (2019).
- Hüfner et al. [1999] S. Hüfner, R. Claessen, F. Reinert, T. Straub, V. Strocov, and P. Steiner, Journal of Electron Spectroscopy and Related Phenomena 100, 191 (1999).
- Nicolay et al. [2006] G. Nicolay, B. Eltner, S. Hüfner, F. Reinert, U. Probst, and E. Bucher, Phys. Rev. B 73, 045116 (2006).
- Nayak et al. [2017] J. Nayak, K. Filsinger, G. H. Fecher, S. Chadov, J. Minár, E. D. L. Rienks, B. Büchner, S. P. Parkin, J. Fink, and C. Felser, Proc Natl Acad Sci USA 114, 12425 (2017).
- Hussey [2008] N. E. Hussey, Journal of Physics: Condensed Matter 20, 123201 (2008).
- Taillefer [2020] L. Taillefer, Annu. Rev. Condens. Matter Phys. 1, 51 (2020).
- Zaanen [2019] J. Zaanen, SciPost Phys. 6, 061 (2019).
- Koitzsch et al. [2004] A. Koitzsch, S. V. Borisenko, A. A. Kordyuk, T. K. Kim, M. Knupfer, J. Fink, H. Berger, and R. Follath, Phys. Rev. B 69, 140507 (2004).
- Kordyuk and Borisenko [2006] A. A. Kordyuk and S. V. Borisenko, Low Temperature Physics 32, 298 (2006).
- Sánchez-Barriga et al. [2018] J. Sánchez-Barriga, R. Ovsyannikov, and J. Fink, Phys. Rev. Lett. 121, 267201 (2018).
- Yusof et al. [2002] Z. M. Yusof, B. O. Wells, T. Valla, A. V. Fedorov, P. D. Johnson, Q. Li, C. Kendziora, S. Jian, and D. G. Hinks, Phys. Rev. Lett. 88, 167006 (2002).
- Echenique et al. [2000] P. Echenique, J. Pitarke, E. Chulkov, and A. Rubio, Chemical Physics 251, 1 (2000).
- Monney et al. [2012] C. Monney, G. Monney, P. Aebi, and H. Beck, Phys. Rev. B 85, 235150 (2012).
- Johnston [2010] D. C. Johnston, Adv. Phys. 59, 803 (2010).
- Lumsden and Christianson [2010] M. D. Lumsden and A. D. Christianson, Journal of Physics: Condensed Matter 22, 203203 (2010).
- Yoshida et al. [2014] T. Yoshida, S.-i. Ideta, I. Nishi, A. Fujimori, M. Yi, R. Moore, S.-K. Mo, D. Lu, Z.-X. Shen, Z. Hussain, K. Kihou, C. H. Lee, A. Iyo, H. Eisaki, and H. Harima, Frontiers in Physics 2, 10.3389/fphy.2014.00017 (2014).
- Terashima et al. [2009] K. Terashima, Y. Sekiba, J. H. Bowen, K. Nakayama, T. Kawahara, T. Sato, P. Richard, Y.-M. Xu, L. J. Li, G. H. Cao, Z.-A. Xu, H. Ding, and T. Takahashi, Proceedings of the National Academy of Sciences 106, 7330 (2009).
- Richard et al. [2017] P. Richard, A. van Roekeghem, B. Q. Lv, T. Qian, T. K. Kim, M. Hoesch, J.-P. Hu, A. S. Sefat, S. Biermann, and H. Ding, Phys. Rev. B 95, 184516 (2017).
- Xu et al. [2013] N. Xu, P. Richard, A. van Roekeghem, P. Zhang, H. Miao, W.-L. Zhang, T. Qian, M. Ferrero, A. S. Sefat, S. Biermann, and H. Ding, PRX 3, 011006 (2013).
- Pavlov et al. [2019] N. S. Pavlov, T. K. Kim, A. Yaresko, K.-Y. Choi, I. A. Nekrasov, and D. V. Evtushinsky, arXiv 2008.02378 (2019).
- Haule et al. [2008] K. Haule, J. H. Shim, and G. Kotliar, Phys. Rev. Lett. 100, 226402 (2008).
- de Medici [2015] L. de Medici, in Iron-Based Superconductivity, edited by P. D. Johnson, G. Xu, and W.-G. Yin (Springer International Publishing, Cham, 2015) pp. 409–441.
- Hemmida et al. [2020] M. Hemmida, N. Winterhalter-Stocker, D. Ehlers, H. A. K. von Nidda, M. Yao, J. Bannies, E. D. L. Rienks, R. Kurleto, C. Felser, B. Büchner, J. Fink, S. Gorol, T. Förster, S. Arsenijevic, V. Fritsch, and P. Gegenwart, Topological magnetic order and superconductivity in eurbfe4as4 (2020), arXiv:2010.02110 [cond-mat.supr-con] .
- Yang et al. [2009] J. Yang, D. Hüvonen, U. Nagel, T. Rõõm, N. Ni, P. C. Canfield, S. L. Bud’ko, J. P. Carbotte, and T. Timusk, Phys. Rev. Lett. 102, 187003 (2009).
- Heimes et al. [2011] A. Heimes, R. Grein, and M. Eschrig, PRL 106, 047003 (2011).