Diurnal Effect of Sub-GeV Dark Matter Boosted by Cosmic Rays
Abstract
We point out a new type of diurnal effect for the cosmic ray boosted dark matter (DM). The DM-nucleon interactions not only allow the direct detection of DM with nuclear recoils, but also allow cosmic rays to scatter with and boost the nonrelativistic DM to higher energies. If the DM-nuclei scattering cross sections are sufficiently large, the DM flux is attenuated as it propagates through the Earth, leading to a strong diurnal modulation. This diurnal modulation provides another prominent signature for the direct detection of boosted sub-GeV DM, in addition to signals with higher recoil energy.
Introduction – Overwhelming evidence from astrophysical and cosmological observations supports the existence of dark matter (DM) Young:2016ala , which is gravitationally interacting but invisible via electromagnetic interactions. However, the physical nature of DM is poorly understood: the DM identity is unknown with a possible mass spans nearly 80 orders of magnitude Gelmini:2015zpa . The DM direct detection Goodman:1984dc aims to verify the existence of DM particles and measure their interactions via the recoil of target nuclei or electrons, which is believed to be the most direct way to unveil the nature of DM particles Liu:2017drf ; Schumann:2019eaa .
Conventionally, direct detection experiments assume the existence of nonrelativistic DM confined in the Galaxy. The gravitational potential of the Galaxy results in an upper limit on the DM velocity of above which DM can escape Bozorgnia:2013pua ; Zavala:2019gpq . Because of the energy threshold, which is typically , the sensitive mass window of direct detection experiments can only extend down to GeV via the conventional nuclear recoil channel. In recent years, to enhance the sensitivity of detecting sub-GeV DM, many approaches have been explored, including expanding the nuclear recoil detection capability via a low threshold bolometer Abdelhameed:2019hmk ; Bolometer as well as via the Bremsstrahlung Kouvaris:2016afs and Migdal Ibe:2017yqa ; Baxter:2019pnz ; Essig:2019xkx ; Akerib:2018hck ; Armengaud:2019kfj ; Liu:2019kzq ; Aprile:2019jmx effects, the direct detection of DM-electron recoils eRecoil ; Emken:2019tni ; Xenon-eRecoil ; DarkSide-eRecoil ; SuperCDMS-eRecoil ; CCD , and various novel detection proposals SC ; FD ; SF ; SH ; Scintillator ; DiracMaterial ; Molecular ; Diamond ; nanoWire ; Plasmon ; magnon .
Another interesting possibility has been recently pointed out: nonrelativistic DM can be boosted by cosmic rays (CRs) Cappiello:2018hsu ; Bringmann:2018cvk or the solar reflection Kouvaris:2015nsa ; An:2017ojc ; Emken:2017hnp . As long as DM has finite interactions with matter, it is inevitable for the nonrelativistic DM to be scattered and boosted by the energetic CRs. Although the flux of the CR-boosted DM (CRDM) is a tiny fraction compared to the nonrelativistic DM, it allows explorations of a certain parameter space of sub-GeV DM that was previously inaccessible Bringmann:2018cvk ; Alvey:2019zaa ; Dent:2019krz ; Wang:2019jtk ; Plestid:2020kdm in direct detection, thus expanding the sensitive mass region. The CRDM can also produce signals in large neutrino experiments Ema:2018bih ; Cappiello:2019qsw ; Guo:2020drq .
For sub-GeV DM, the DM-nucleon scattering cross section with a contact interaction can be quite sizable, e.g., as large as (see Krnjaic:2019dzc and the references in Cappiello:2018hsu ), in contrast to the light mediator case Bondarenko:2019vrb . With this allowed interaction strength, DM particles can experience multiple scatterings and become attenuated when traveling through the Earth Starkman:1990nj ; Mack:2007xj ; Hooper:2018bfw ; Emken:2018run . If the CRDM flux is anisotropic, a diurnal flux modulation at direct detection experiments is expected diurnal ; diurnal-directional . This is different from the conventional diurnal effect that is mainly for nonrelativistic DM.
Sub-GeV Dark Matter Boosted by Cosmic Rays – The spatial and spectral distributions of the CRDM flux depend on the DM and CR distributions in the Galaxy as well as the CRDM scattering processes. Both the DM density and CR intensities vary with their locations in the Galaxy, becoming more concentrated toward the Galaxy center (GC). Therefore, CRs are much more likely to scatter with and boost the DM in the inner Galaxy region. Even for isotropic scattering, the CRDM flux is highly anisotropic over the sky.
Although the CRDM scattering also affects the CRs, the effect is important only for a very large scattering cross section ( cm2) Cappiello:2018hsu . For simplicity, we assume that the CR distribution is unaffected. The CRDM emissivity, which describes its spatial and spectrum distributions, is given by Bringmann:2018cvk
| (1) | |||||
where and are the kinetic energies of the CR species and the boosted DM with mass , is the minimum CR energy required to boost the DM kinetic energy to , and is the maximum DM kinetic energy given Bringmann:2018cvk . There are three main ingredients in Eq. (1): the DM density at location , the CR density times its velocity , and the scattering cross section . The form factor Perdrisat:2006hj is a function of the momentum transfer with MeV and MeV Angeli:2004kvy for proton and helium, respectively.
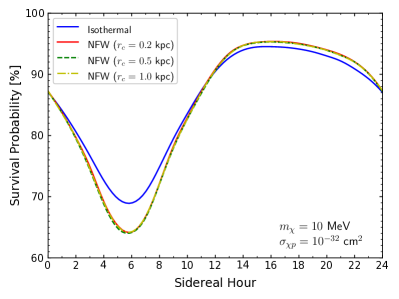
For the DM density , we adopt the Navarro-Frenk-White (NFW) Navarro:1996gj profile, with kpc and GeV cm-3, as the benchmark DM mass distribution. For comparison, a cored isothermal distribution, with kpc and GeV cm-3, is also studied. These parameters correspond to a local DM density of GeV cm-3 in our Solar System Catena:2009mf for both profiles. The difference between the two profiles and more details are given in the Supplemental Material Supplementary . The amplitudes of the diurnal modulation vary by only around for different density profiles.
For the CR contribution in Eq. (1), we employ the GALPROP Strong:1998pw code (version 54) to simulate its distribution. In this Letter, we only consider the dominating proton and helium species of CRs, and leave the rest, in particular electrons and positrons, for future discussions. For the detailed CR model parameters and the resulting CR spatial distribution, please see the Supplemental Material Supplementary .
The DM-nucleus interaction is the least known part in Eq. (1). For simplicity, we assume that the DM-nucleus cross section has a coherent enhancement,
| (2) |
where is the constant DM-nucleon cross section, while and are the proton and nuclear masses for the CR. For , the enhancement mainly comes from the factor. Extra enhancement may come from when goes beyond . The dipole hadronic form factor in Eq. (1) suppresses the interaction at large momentum transfer .
The CRDM flux arriving at the Earth along a given direction is a line-of-sight integral of all contributions along the way,
| (3) |
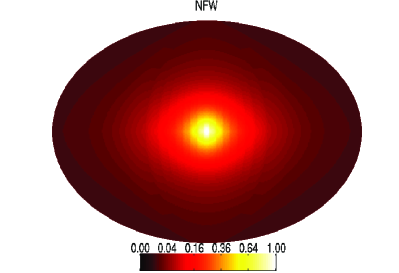
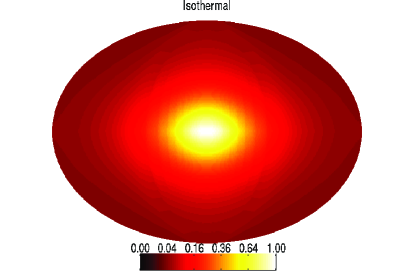
Fig. 1 shows the relative all-sky maps of the CRDM fluxes in the Galactic coordinate, a spherical coordinate with the Sun as its center, the latitude measuring the angle above/below the galactic plane, and the longitude measuring the azimuth angle from the GC. The peak value at the GC is set to 1. The top (bottom) panel presents the NFW (isothermal) profile. The CRDM fluxes are clearly anisotropic, with the maximum (the GC direction) and the minimum differing by about two orders of magnitude. To match the grid resolution of GALPROP, we set the NFW density within 0.5 kpc of the GC to . This approximation has a negligible effect on the diurnal modulation, as shown in the Supplemental Material Supplementary .
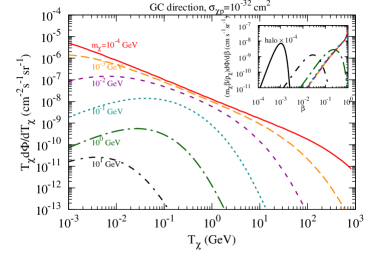
Fig. 2 shows the CRDM spectra from the GC direction for different DM masses. The number density in Eq. (1) accounts for the decrease of CRDM flux for larger DM masses. On the other hand, on average the maximum boost occurs when approaches the mass of the incident proton or helium, manifesting in the change of spectrum shape for different energies. At the high energy end, the spectra are suppressed by the form factor with . We also show the nonrelativistic DM velocity distribution predicted by the Standard DM Halo model (labeled as halo ) in Fig. 2 for comparison.
We find that the CRDM spectra depend very weakly on directions, mainly due to the similar CR spectral shapes throughout the Galaxy. For simplicity, in the following discussion we will separate the energy and angular distributions of the CRDM fluxes.
Earth Attenuation – With a large enough scattering cross section, the DM can frequently scatter with matter when traveling through the Earth Starkman:1990nj ; Mack:2007xj ; Hooper:2018bfw ; Emken:2018run ; Emken:2019tni , transferring its kinetic energy to matter nuclei. Although the decelerated DM particle may still reach the detector, the DM energy spectrum is shifted lower, leading to fewer events above the detector energy threshold. For simplicity, we use the average nucleon numbers, in the Earth mantle and in the Earth core, to approximate the matter compositions McDonough:2008zz . As a concrete example, for , the mean free path, , is around km in the Earth core/mantle omitting the form factor effects. Similar attenuation happens in the atmosphere, but due to the 3 orders lower density, the effect is only visible at much larger cross sections.
The differential CRDM flux , at the distance through the Earth, is a combination of the loss of DM particles to an energy lower than and the gain from a higher energy to . For an incoming DM particle with a higher energy , the nuclear recoil energy is evenly distributed in the range with reduced mass . Because of energy conservation, is also evenly distributed: . For a given , the DM particles with energy in the range increases the flux at . The CRDM flux evolution contains two contributions Ema:2018bih :
| (4) |
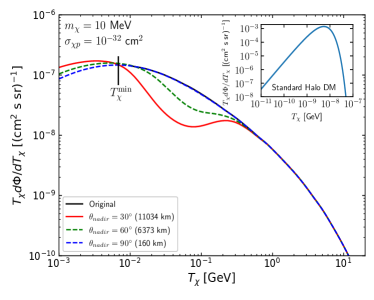
The weight factor is defined as, , and the factor in the second term comes from the differential cross section . The attenuated DM flux can be obtained by integrating Eq. (4) step by step over the traversed distance. Fig. 3 shows the attenuated CRDM fluxes with different nadir angles to the underground detector. To be realistic, we consider a detector underground. Then for , DM needs to travel before reaching the detector, corresponding to 9 mean free paths in the mantle. The CRDM flux at medium energy is largely reduced first and then goes back up at high energy. The limited attenuation at high energy is due to the highly suppressed weight factor in Eq. (4). Consequently, the CRDM is much more energetic than the nonrelativistic DM (see the inset of Fig. 3) and can produce recoil events with much higher energy. This makes direct detection experiments sensitive to sub-GeV DMs.
Boosted Diurnal Effect – The two anisotropies from the Earth and the Galaxy lead to the diurnal effect. First, the path lengths that DM particles traverse are anisotropic since the underground lab is close to the Earth surface and its depth is typically much smaller than the Earth radius. Second, the CRDM flux is strongly peaked toward the GC due to both the DM and the CR distributions. The CRDM flux is thus significantly attenuated by the Earth when the GC and the detector are on opposite sides of the Earth but much less affected if they are on the same side. To avoid confusion with the usual diurnal effect for nonrelativistic DM diurnal ; diurnal-directional , we call this the “boosted diurnal effect”.
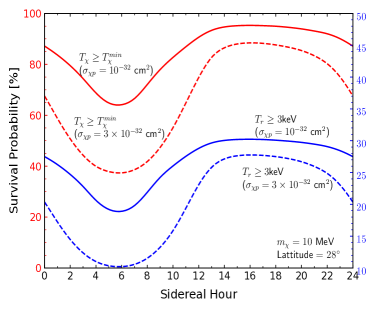
Fig. 4 shows the diurnal modulation of the CRDM at a direct detection experiment located at a latitude of N (approximate location of the China Jinping Underground Laboratory) and a depth of 2 km underground. Within one sidereal day, the underground lab rotates around the Earth axis and its position is parameterized by the sidereal hour in the range between hours. We define a survival probability as the ratio between the attenuated CRDM flux in the underground lab and the one arriving the Earth. At a cross section of cm2, we observe significant “boosted diurnal modulation” with the survival probability varying in the range of . For comparison, we also show the curves for a cross section of cm2 where a larger modulation can be observed. Given the DM energy , the nuclear recoil has a wide distribution, , and hence only a fraction, , can pass the detection threshold, leading to a reduction from the red curve to the blue one in Fig. 4.
Instead of performing numerical integration of Eq. (4), the curves in Fig. 4 are obtained by Monte Carlo simulations. Since the spectrum of the CRDM is almost independent of its direction, it is a good approximation to first sample the direction of the incoming DM particles according to the sky map in Fig. 1 and then sample the boosted DM kinetic energy according to the spectrum in Fig. 2. The incident DM particle would then experience multiple scatterings when crossing the Earth. For each interaction step, we first sample the distance that the DM particle travels before the next scattering based on the mean free path and then sample the reduced kinetic energy. The simulation stops when the DM particle reaches the underground detector or drops below the detection threshold.
Imposing the detection threshold on the nuclear recoil energy, for a liquid xenon detector Cui:2017nnn , would reduce the event rate but still keep the modulation behavior as illustrated in Fig. 4. This is because the diurnal modulation mainly comes from the high recoil part as illustrated in Fig. 3. For two years of data at a benchmark liquid xenon detector PandaX-4T (5.6 tonyear exposure) Zhang:2018xdp , on average 8.1 (55) events are expected for and , which is quite significant compared to the background level Wang:2019opt . For the same detector, the event rate and hence the sensitivity is roughly independent of the DM mass for . In addition to a quadratic scaling with the cross section, one from the CRDM production and the other from its detection, the event rate is suppressed once the attenuation from the Earth becomes dominating for a sufficiently large cross section ( cm2) Bringmann:2018cvk . The cross section region that this technique can probe spans roughly 4 orders of magnitude.
Another factor is the scattering angle, which leads to deflection Emken:2019tni . For the relativistic CRDM with typical 1 GeV kinetic energy, mass MeV, and typical momentum transfer MeV Angeli:2004kvy , the scattering angle is . Although not completely negligible, the scattering angle does not affect the diurnal modulation effect due to the following arguments. For the peak region of Fig. 4, the DM from the GC only needs to penetrate . With a mean free path of around 17 km, most CRDMs experience only one scattering at most. Therefore, the peak region would not be affected significantly. Multiple scatterings will further suppress the valley region of the curve and therefore enhance the modulation effect.
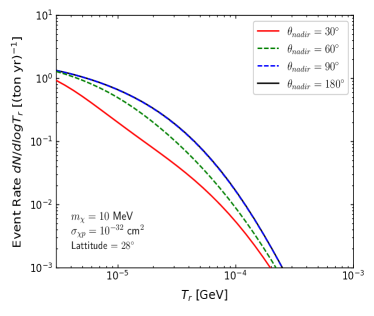
The recoil energy spectra for incident CRDMs along different nadir angles in a liquid xenon detector are shown in Fig. 5. Since the recoil energy can reach , observing a high energy recoil event is a smoking gun for the CRDM, especially when the detector and the GC are on the same side of the Earth. However, these energetic recoils may excite target isotopes and therefore may no longer be simple nuclear recoils. The signal identification strategy for such events needs more experimental study. Statistically, the boosted diurnal modulation can help to identify such high energy recoil signal and suppress the background which is expected to be constant over time. A more detailed analysis with real data will appear in a future work.
Conclusion – The CRDM provides a possibility for the conventional DM direct detection experiments to extend their sensitive window to the sub-GeV mass range via the detection of boosted DM events that produce a higher energy recoil above threshold. If the DM-nucleon cross section is sufficiently large, the CRDM is significantly attenuated when traveling through the Earth. Because of the anisotropies of the CRDM flux and the Earth attenuation, the event rate and energy spectrum exhibit a characteristic diurnal modulation, which is a powerful signature to suppress background and enhance sensitivities to sub-GeV DM. Future work can use the electron component in the CR and extend this exploration to DM-electron interactions. In addition, future directional detection experiments may directly image the anisotropic sky map of the CRDM. The modulation discussed in this Letter may also apply to the boosted DM scenario Agashe:2014yua ; Berger:2014sqa ; Cherry:2015oca .
Acknowledgements
SFG is sponsored by the Double First Class start-up fund (WF220442604) provided by Tsung-Dao Lee Institute & Shanghai Jiao Tong University, the Shanghai Pujiang Program (20PJ1407800), and the National Natural Science Foundation of China (No. 12090064). QY is supported by the National Natural Science Foundation of China (Nos. 11722328 and 11851305), the 100 Talents Program of the Chinese Academy of Sciences, and the Program for Innovative Talents and Entrepreneur in Jiangsu. JL and NZ are supported by the National Natural Science Foundation of China (Nos. 11525522, 11775141, and 12090061), a grant from the Ministry of Science and Technology of China (No. 2016YFA0400301), and a grant from Office of Science and Technology, Shanghai Municipal Government (No. 18JC1410200) and the Hongwen Foundation in Hong Kong. JL also acknowledges support from the Tencent Foundation. This work is also supported in part by the Chinese Academy of Sciences Center for Excellence in Particle Physics (CCEPP). The authors are grateful to Dr. Xiang-Yi Cui for checking the calculations.
References
- (1) B. L. Young, “A survey of dark matter and related topics in cosmology,” Front. Phys. (Beijing) 12, no.2, 121201 (2017).
- (2) G. B. Gelmini, “The Hunt for Dark Matter,” [arXiv:1502.01320 [hep-ph]].
- (3) M. W. Goodman and E. Witten, “Detectability of Certain Dark Matter Candidates,” Phys. Rev. D 31, 3059 (1985).
- (4) J. Liu, X. Chen and X. Ji, “Current status of direct dark matter detection experiments,” Nature Phys. 13, no.3, 212-216 (2017) [arXiv:1709.00688 [astro-ph.CO]].
- (5) M. Schumann, “Direct Detection of WIMP Dark Matter: Concepts and Status,” J. Phys. G 46, no.10, 103003 (2019) [arXiv:1903.03026 [astro-ph.CO]].
- (6) N. Bozorgnia, R. Catena and T. Schwetz, “Anisotropic dark matter distribution functions and impact on WIMP direct detection,” JCAP 12, 050 (2013) [arXiv:1310.0468 [astro-ph.CO]].
- (7) J. Zavala and C. S. Frenk, “Dark matter haloes and subhaloes,” Galaxies 7, no.4, 81 (2019) [arXiv:1907.11775 [astro-ph.CO]].
- (8) A. H. Abdelhameed et al. [CRESST], Phys. Rev. D 100, no.10, 102002 (2019) doi:10.1103/PhysRevD.100.102002 [arXiv:1904.00498 [astro-ph.CO]].
- (9) S. Pirro and P. Mauskopf, “Advances in Bolometer Technology for Fundamental Physics,” Ann. Rev. Nucl. Part. Sci. 67, 161-181 (2017);
- (10) C. Kouvaris and J. Pradler, “Probing sub-GeV Dark Matter with conventional detectors,” Phys. Rev. Lett. 118, no.3, 031803 (2017) [arXiv:1607.01789 [hep-ph]].
- (11) M. Ibe, W. Nakano, Y. Shoji and K. Suzuki, “Migdal Effect in Dark Matter Direct Detection Experiments,” JHEP 03, 194 (2018) [arXiv:1707.07258 [hep-ph]].
- (12) D. Baxter, Y. Kahn and G. Krnjaic, “Electron Ionization via Dark Matter-Electron Scattering and the Migdal Effect,” Phys. Rev. D 101, no.7, 076014 (2020) [arXiv:1908.00012 [hep-ph]].
- (13) R. Essig, J. Pradler, M. Sholapurkar and T. T. Yu, “Relation between the Migdal Effect and Dark Matter-Electron Scattering in Isolated Atoms and Semiconductors,” Phys. Rev. Lett. 124, no.2, 021801 (2020) [arXiv:1908.10881 [hep-ph]].
- (14) D. S. Akerib et al. [LUX], “Results of a Search for Sub-GeV Dark Matter Using 2013 LUX Data,” Phys. Rev. Lett. 122, no.13, 131301 (2019) [arXiv:1811.11241 [astro-ph.CO]].
- (15) E. Armengaud et al. [EDELWEISS], “Searching for low-mass dark matter particles with a massive Ge bolometer operated above-ground,” Phys. Rev. D 99, no.8, 082003 (2019) [arXiv:1901.03588 [astro-ph.GA]].
- (16) Z. Z. Liu et al. [CDEX], “Constraints on Spin-Independent Nucleus Scattering with sub-GeV Weakly Interacting Massive Particle Dark Matter from the CDEX-1B Experiment at the China Jinping Underground Laboratory,” Phys. Rev. Lett. 123, no.16, 161301 (2019) [arXiv:1905.00354 [hep-ex]].
- (17) E. Aprile et al. [XENON], “Search for Light Dark Matter Interactions Enhanced by the Migdal Effect or Bremsstrahlung in XENON1T,” Phys. Rev. Lett. 123, no.24, 241803 (2019) [arXiv:1907.12771 [hep-ex]].
- (18) R. Essig, J. Mardon and T. Volansky, “Direct Detection of Sub-GeV Dark Matter,” Phys. Rev. D 85, 076007 (2012) [arXiv:1108.5383 [hep-ph]]; Sec. IV-V of M. Battaglieri, et. al., “US Cosmic Visions: New Ideas in Dark Matter 2017: Community Report,” [arXiv:1707.04591 [hep-ph]];
- (19) T. Emken, R. Essig, C. Kouvaris and M. Sholapurkar, “Direct Detection of Strongly Interacting Sub-GeV Dark Matter via Electron Recoils,” JCAP 09, 070 (2019) [arXiv:1905.06348 [hep-ph]].
- (20) R. Essig, A. Manalaysay, J. Mardon, P. Sorensen and T. Volansky, “First Direct Detection Limits on sub-GeV Dark Matter from XENON10,” Phys. Rev. Lett. 109, 021301 (2012) [arXiv:1206.2644 [astro-ph.CO]]; R. Essig, T. Volansky and T. T. Yu, “New Constraints and Prospects for sub-GeV Dark Matter Scattering off Electrons in Xenon,” Phys. Rev. D 96, no.4, 043017 (2017) [arXiv:1703.00910 [hep-ph]]; E. Aprile et al. [XENON], “Light Dark Matter Search with Ionization Signals in XENON1T,” Phys. Rev. Lett. 123, no.25, 251801 (2019) [arXiv:1907.11485 [hep-ex]].
- (21) P. Agnes et al. [DarkSide], “Constraints on Sub-GeV Dark-Matter– Electron Scattering from the DarkSide-50 Experiment,” Phys. Rev. Lett. 121, no.11, 111303 (2018) [arXiv:1802.06998 [astro-ph.CO]].
- (22) D. W. Amaral et al. [SuperCDMS], “Constraints on low-mass, relic dark matter candidates from a surface-operated SuperCDMS single-charge sensitive detector,” [arXiv:2005.14067 [hep-ex]].
- (23) R. Essig, M. Fernandez-Serra, J. Mardon, A. Soto, T. Volansky and T. T. Yu, “Direct Detection of sub-GeV Dark Matter with Semiconductor Targets,” JHEP 05, 046 (2016) [arXiv:1509.01598 [hep-ph]]; O. Abramoff et al. [SENSEI], “SENSEI: Direct-Detection Constraints on Sub-GeV Dark Matter from a Shallow Underground Run Using a Prototype Skipper-CCD,” Phys. Rev. Lett. 122, no.16, 161801 (2019) [arXiv:1901.10478 [hep-ex]]; A. Aguilar-Arevalo et al. [DAMIC], “Constraints on Light Dark Matter Particles Interacting with Electrons from DAMIC at SNOLAB,” Phys. Rev. Lett. 123, no.18, 181802 (2019) [arXiv:1907.12628 [astro-ph.CO]].
- (24) V. Zacek, “Search for dark matter with moderately superheated liquids,” Nuovo Cim. A 107, 291-298 (1994).
- (25) Y. Hochberg, Y. Zhao and K. M. Zurek, “Superconducting Detectors for Superlight Dark Matter,” Phys. Rev. Lett. 116, no.1, 011301 (2016) [arXiv:1504.07237 [hep-ph]]; Y. Hochberg, T. Lin and K. M. Zurek, “Detecting Ultralight Bosonic Dark Matter via Absorption in Superconductors,” Phys. Rev. D 94, no.1, 015019 (2016) [arXiv:1604.06800 [hep-ph]].
- (26) Y. Hochberg, M. Pyle, Y. Zhao and K. M. Zurek, “Detecting Superlight Dark Matter with Fermi-Degenerate Materials,” JHEP 08, 057 (2016) [arXiv:1512.04533 [hep-ph]].
- (27) K. Schutz and K. M. Zurek, “Detectability of Light Dark Matter with Superfluid Helium,” Phys. Rev. Lett. 117, no.12, 121302 (2016) [arXiv:1604.08206 [hep-ph]]; S. Knapen, T. Lin and K. M. Zurek, “Light Dark Matter in Superfluid Helium: Detection with Multi-excitation Production,” Phys. Rev. D 95, no.5, 056019 (2017) [arXiv:1611.06228 [hep-ph]].
- (28) S. Derenzo, R. Essig, A. Massari, A. Soto and T. T. Yu, “Direct Detection of sub-GeV Dark Matter with Scintillating Targets,” Phys. Rev. D 96, no.1, 016026 (2017) [arXiv:1607.01009 [hep-ph]].
- (29) P. C. Bunting, G. Gratta, T. Melia and S. Rajendran, “Magnetic Bubble Chambers and Sub-GeV Dark Matter Direct Detection,” Phys. Rev. D 95, no.9, 095001 (2017) [arXiv:1701.06566 [hep-ph]].
- (30) Y. Hochberg, Y. Kahn, M. Lisanti, K. M. Zurek, A. G. Grushin, R. Ilan, S. M. Griffin, Z. F. Liu, S. F. Weber and J. B. Neaton, “Detection of sub-MeV Dark Matter with Three-Dimensional Dirac Materials,” Phys. Rev. D 97, no.1, 015004 (2018) [arXiv:1708.08929 [hep-ph]].
- (31) N. A. Kurinsky, T. C. Yu, Y. Hochberg and B. Cabrera, “Diamond Detectors for Direct Detection of Sub-GeV Dark Matter,” Phys. Rev. D 99, no.12, 123005 (2019) [arXiv:1901.07569 [hep-ex]].
- (32) Y. Hochberg, I. Charaev, S. W. Nam, V. Verma, M. Colangelo and K. K. Berggren, “Detecting Sub-GeV Dark Matter with Superconducting Nanowires,” Phys. Rev. Lett. 123, no.15, 151802 (2019) [arXiv:1903.05101 [hep-ph]].
- (33) T. Trickle, Z. Zhang and K. M. Zurek, “Direct Detection of Light Dark Matter with Magnons,” [arXiv:1905.13744 [hep-ph]]; S. Chigusa, T. Moroi and K. Nakayama, “Detecting Light Boson Dark Matter through Conversion into Magnon,” [arXiv:2001.10666 [hep-ph]].
- (34) N. Kurinsky, D. Baxter, Y. Kahn and G. Krnjaic, “A Dark Matter Interpretation of Excesses in Multiple Direct Detection Experiments,” [arXiv:2002.06937 [hep-ph]].
- (35) C. V. Cappiello, K. C. Ng and J. F. Beacom, “Reverse Direct Detection: Cosmic Ray Scattering With Light Dark Matter,” Phys. Rev. D 99, no.6, 063004 (2019) [arXiv:1810.07705 [hep-ph]].
- (36) T. Bringmann and M. Pospelov, “Novel direct detection constraints on light dark matter,” Phys. Rev. Lett. 122, no. 17, 171801 (2019) [arXiv:1810.10543 [hep-ph]].
- (37) C. Kouvaris, “Probing Light Dark Matter via Evaporation from the Sun,” Phys. Rev. D 92, no.7, 075001 (2015) [arXiv:1506.04316 [hep-ph]].
- (38) H. An, M. Pospelov, J. Pradler and A. Ritz, “Directly Detecting MeV-scale Dark Matter via Solar Reflection,” Phys. Rev. Lett. 120, no.14, 141801 (2018) [arXiv:1708.03642 [hep-ph]].
- (39) T. Emken, C. Kouvaris and N. G. Nielsen, “The Sun as a sub-GeV Dark Matter Accelerator,” Phys. Rev. D 97, no.6, 063007 (2018) [arXiv:1709.06573 [hep-ph]].
- (40) J. Alvey, M. Campos, M. Fairbairn and T. You, “Detecting Light Dark Matter via Inelastic Cosmic Ray Collisions,” Phys. Rev. Lett. 123, 261802 (2019) [arXiv:1905.05776 [hep-ph]].
- (41) J. B. Dent, B. Dutta, J. L. Newstead and I. M. Shoemaker, “Bounds on Cosmic Ray-Boosted Dark Matter in Simplified Models and its Corresponding Neutrino-Floor,” [arXiv:1907.03782 [hep-ph]].
- (42) W. Wang, L. Wu, J. M. Yang, H. Zhou and B. Zhu, “Sub-GeV Gravity-mediated Dark Matter in Direct Detections,” [arXiv:1912.09904 [hep-ph]].
- (43) R. Plestid, V. Takhistov, Y. D. Tsai, T. Bringmann, A. Kusenko and M. Pospelov, “New Constraints on Millicharged Particles from Cosmic-ray Production,” [arXiv:2002.11732 [hep-ph]].
- (44) Y. Ema, F. Sala and R. Sato, “Light Dark Matter at Neutrino Experiments,” Phys. Rev. Lett. 122, no.18, 181802 (2019) [arXiv:1811.00520 [hep-ph]].
- (45) C. Cappiello and J. F. Beacom, “Strong New Limits on Light Dark Matter from Neutrino Experiments,” Phys. Rev. D 100, no.10, 103011 (2019) [arXiv:1906.11283 [hep-ph]].
- (46) G. Guo, Y. L. S. Tsai and M. R. Wu, “Probing High-Energy Light Dark Matter with IceCube,” [arXiv:2004.03161 [astro-ph.HE]].
- (47) G. Krnjaic and S. D. McDermott, “Implications of BBN Bounds for Cosmic Ray Upscattered Dark Matter,” [arXiv:1908.00007 [hep-ph]].
- (48) K. Bondarenko, A. Boyarsky, T. Bringmann, M. Hufnagel, K. Schmidt-Hoberg and A. Sokolenko, “Direct detection and complementary constraints for sub-GeV dark matter,” JHEP 03, 118 (2020) [arXiv:1909.08632 [hep-ph]].
- (49) G. D. Starkman, A. Gould, R. Esmailzadeh and S. Dimopoulos, “Opening the Window on Strongly Interacting Dark Matter,” Phys. Rev. D 41, 3594 (1990).
- (50) G. D. Mack, J. F. Beacom and G. Bertone, “Towards Closing the Window on Strongly Interacting Dark Matter: Far-Reaching Constraints from Earth’s Heat Flow,” Phys. Rev. D 76, 043523 (2007) [arXiv:0705.4298 [astro-ph]].
- (51) D. Hooper and S. D. McDermott, “Robust Constraints and Novel Gamma-Ray Signatures of Dark Matter That Interacts Strongly With Nucleons,” Phys. Rev. D 97, no.11, 115006 (2018) [arXiv:1802.03025 [hep-ph]].
- (52) T. Emken and C. Kouvaris, “How blind are underground and surface detectors to strongly interacting Dark Matter?,” Phys. Rev. D 97, no.11, 115047 (2018) [arXiv:1802.04764 [hep-ph]].
- (53) J. Collar and F. Avignone, “Diurnal modulation effects in cold dark matter experiments,” Phys. Lett. B 275, 181-185 (1992); J. Collar, F. Avignone, R. Brodzinski, H. Miley, J. Reeves, E. Garcia, A. Morales, J. Morales, R. Nunez-Lagos, C. Saenz and J. Villar, “Bounds on diurnal modulations from the COSME-II dark matter experiment,” Nucl. Phys. B Proc. Suppl. 28A, 297-301 (1992); D. Di Gregorio, A. Gattone, H. Huck, A. Macchiavelli, S. Gil, J. Collar and F. Avignone, III, “Effects of diurnal modulation in direct cold matter searches. The experiment in Sierra Grande,” [arXiv:astro-ph/9311049 [astro-ph]]; J. Collar and F. Avignone, III, “Surface sputtering from cold dark matter interactions: Proposed search for its diurnal modulation,” Astropart. Phys. 3, 37 (1995) [arXiv:astro-ph/9505058 [astro-ph]]; F. Hasenbalg, D. Abriola, F. Avignone, J. Collar, D. Di Gregorio, A. Gattone, H. Huck, D. Tomasi and I. Urteaga, “Cold dark matter identification: Diurnal modulation revisited,” Phys. Rev. D 55, 7350-7355 (1997) [arXiv:astro-ph/9702165 [astro-ph]]; F. S. Ling, P. Sikivie and S. Wick, “Diurnal and annual modulation of cold dark matter signals,” Phys. Rev. D 70, 123503 (2004) [arXiv:astro-ph/0405231 [astro-ph]]; R. Foot, “Diurnal modulation due to self-interacting mirror and hidden sector dark matter,” JCAP 04, 014 (2012) [arXiv:1110.2908 [hep-ph]]; R. Bernabei et al. [DAMA-LIBRA], “Model independent result on possible diurnal effect in DAMA/LIBRA-phase1,” Eur. Phys. J. C 74, no.3, 2827 (2014) [arXiv:1403.4733 [astro-ph.GA]]; R. Foot and S. Vagnozzi, “Diurnal modulation signal from dissipative hidden sector dark matter,” Phys. Lett. B 748, 61-66 (2015) [arXiv:1412.0762 [hep-ph]]; D. Akerib et al. [LUX], “Search for annual and diurnal rate modulations in the LUX experiment,” Phys. Rev. D 98, no.6, 062005 (2018) [arXiv:1807.07113 [astro-ph.CO]].
- (54) J. Vergados and C. Moustakidis, “The Diurnal Variation of the Wimp Detection Event Rates in Directional Experiments,” [arXiv:0912.3121 [astro-ph.CO]]; A. Bandyopadhyay and D. Majumdar, “On Diurnal and Annual Variations of Directional Detection Rates of Dark Matter,” Astrophys. J. 746, 107 (2012) [arXiv:1006.3231 [hep-ph]]; R. J. Creswick, S. Nussinov and F. T. Avignone, “Direction dependence and diurnal modulation in dark matter detectors,” Astropart. Phys. 35, 62-66 (2011) [arXiv:1007.0214 [astro-ph.IM]]; J. D. Vergados and C. C. Moustakidis, “WIMP event rates in directional experiments: The diurnal variation signature,” Central Eur. J. Phys. 9, 628-643 (2011).
- (55) C. Perdrisat, V. Punjabi and M. Vanderhaeghen, “Nucleon Electromagnetic Form Factors,” Prog. Part. Nucl. Phys. 59, 694-764 (2007) [arXiv:hep-ph/0612014 [hep-ph]].
- (56) I. Angeli, “A consistent set of nuclear rms charge radii: properties of the radius surface R(N,Z),” Atom. Data Nucl. Data Tabl. 87, no.2, 185-206 (2004).
- (57) J. F. Navarro, C. S. Frenk and S. D. M. White, “A Universal density profile from hierarchical clustering,” Astrophys. J. 490, 493 (1997) [astro-ph/9611107].
- (58) R. Catena and P. Ullio, “A novel determination of the local dark matter density,” JCAP 08, 004 (2010) [arXiv:0907.0018 [astro-ph.CO]].
- (59) A. W. Strong and I. V. Moskalenko, “Propagation of cosmic-ray nucleons in the galaxy,” Astrophys. J. 509, 212 (1998) [astro-ph/9807150].
- (60) W. F. McDonough and R. Arevalo, ‘‘Uncertainties in the composition of Earth, its core and silicate sphere,” J. Phys. Conf. Ser. 136, 022006 (2008)
- (61) X. Cui et al. [PandaX-II], “Dark Matter Results From 54-Ton-Day Exposure of PandaX-II Experiment,” Phys. Rev. Lett. 119, no.18, 181302 (2017) [arXiv:1708.06917 [astro-ph.CO]] and its supplementary material.
- (62) H. Zhang et al. [PandaX], “Dark matter direct search sensitivity of the PandaX-4T experiment,” Sci. China Phys. Mech. Astron. 62, no.3, 31011 (2019) [arXiv:1806.02229 [physics.ins-det]].
- (63) Q. Wang et al. [PandaX-II], “An Improved Evaluation of the Neutron Background in the PandaX-II Experiment,” Sci. China Phys. Mech. Astron. 63, no.3, 231011 (2020) [arXiv:1907.00545 [hep-ex]].
- (64) K. Agashe, Y. Cui, L. Necib and J. Thaler, “(In)direct Detection of Boosted Dark Matter,” JCAP 10, 062 (2014) [arXiv:1405.7370 [hep-ph]].
- (65) J. Berger, Y. Cui and Y. Zhao, “Detecting Boosted Dark Matter from the Sun with Large Volume Neutrino Detectors,” JCAP 02, 005 (2015) [arXiv:1410.2246 [hep-ph]].
- (66) J. F. Cherry, M. T. Frandsen and I. M. Shoemaker, “Direct Detection Phenomenology in Models Where the Products of Dark Matter Annihilation Interact with Nuclei,” Phys. Rev. Lett. 114, 231303 (2015) [arXiv:1501.03166 [hep-ph]].
- (67) See Supplemental Material for the comparison of different DM profiles, which includes Yuan:2018lmc ; Aguilar:2017hno ; Aguilar:2018njt ; Case:1998qg ; Cummings:2016pdr ; Aguilar:2015ooa ; Aguilar:2015ctt ; Yoon:2017qjx ; An:2019wcw ; Gleeson:1968zza
- (68) Q. Yuan, C. R. Zhu, X. J. Bi and D. M. Wei, “Secondary cosmic-ray nucleus spectra disfavor particle transport in the Galaxy without reacceleration,” JCAP 11, 027 (2020) [arXiv:1810.03141 [astro-ph.HE]].
- (69) M. Aguilar et al. [AMS], “Observation of the Identical Rigidity Dependence of He, C, and O Cosmic Rays at High Rigidities by the Alpha Magnetic Spectrometer on the International Space Station,” Phys. Rev. Lett. 119, no.25, 251101 (2017).
- (70) M. Aguilar et al. [AMS], “Observation of New Properties of Secondary Cosmic Rays Lithium, Beryllium, and Boron by the Alpha Magnetic Spectrometer on the International Space Station,” Phys. Rev. Lett. 120, no.2, 021101 (2018).
- (71) G. L. Case and D. Bhattacharya, “A new sigma-d relation and its application to the galactic supernova remnant distribution,” Astrophys. J. 504, 761 (1998) [arXiv:astro-ph/9807162 [astro-ph]].
- (72) A. Cummings, E. Stone, B. Heikkila, N. Lal, W. Webber, G. Jó hannesson, I. Moskalenko, E. Orlando and T. Porter, “Galactic Cosmic Rays in the Local Interstellar Medium: Voyager 1 Observations and Model Results,” Astrophys. J. 831, no.1, 18 (2016).
- (73) M. Aguilar et al. [AMS], “Precision Measurement of the Proton Flux in Primary Cosmic Rays from Rigidity 1 GV to 1.8 TV with the Alpha Magnetic Spectrometer on the International Space Station,” Phys. Rev. Lett. 114, 171103 (2015).
- (74) M. Aguilar et al. [AMS], “Precision Measurement of the Helium Flux in Primary Cosmic Rays of Rigidities 1.9 GV to 3 TV with the Alpha Magnetic Spectrometer on the International Space Station,” Phys. Rev. Lett. 115, no.21, 211101 (2015).
- (75) Y. Yoon et al. [CREAM], “Proton and Helium Spectra from the CREAM-III Flight,” Astrophys. J. 839, no.1, 5 (2017) [arXiv:1704.02512 [astro-ph.HE]].
- (76) Q. An et al. [DAMPE], “Measurement of the cosmic-ray proton spectrum from 40 GeV to 100 TeV with the DAMPE satellite,” Sci. Adv. 5, no.9, eaax3793 [arXiv:1909.12860 [astro-ph.HE]].
- (77) L. Gleeson and W. Axford, “Solar Modulation of Galactic Cosmic Rays,” Astrophys. J. 154, 1011 (1968).
Supplemental Material
.1 Dark matter density profile
Two kinds of density profiles, a cuspy NFW one and a cored isothermal one are employed in this work. Fig. 6 shows the density distributions of both profiles. To match with the grid precision of the GALPROP propagation model, we employ a cut radius for the calculation of the NFW density profile, within which the density is taken as a constant. We have tested that for , 0.5, and 1.0 kpc, the final results differ very little.

.2 Cosmic ray modeling
Charged CRs propagate diffusively in the random magnetic field of the Milky Way. Besides the diffusion effect, particles may get re-accelerated by randomly moving magnetic turbulence, advected from the Galactic disk to the halo, and interact with the medium. It has been shown that the diffusion plus reacceleration propagation framework can best match the current data Yuan:2018lmc . The propagation parameters are obtained by fitting the most recent AMS-02 measurements of the secondary and primary nuclei Aguilar:2017hno ; Aguilar:2018njt . The propagation parameters adopted are: the diffusion coefficient with cm2 s-1, , , the half-height of the propagation cylinder kpc, and the Alfven velocity km s-1 that characterizes the reacceleration effect.
The spatial distribution of CR sources is assumed to follow that of supernova remnants Case:1998qg . For the source spectra of CRs, we employ a spline-interpolation approach as in Ref. Yuan:2018lmc . The spectral parameters are derived through fitting to the proton and helium data which are measured in a wide energy range from outside of the Solar System by Voyager-1 Cummings:2016pdr , and at the top-of-atmosphere by AMS-02 Aguilar:2015ooa ; Aguilar:2015ctt , CREAM-III Yoon:2017qjx , and DAMPE An:2019wcw . To connect the local interstellar spectra of CRs with the measured ones around the Earth, a force-field solar modulation model is applied Gleeson:1968zza .
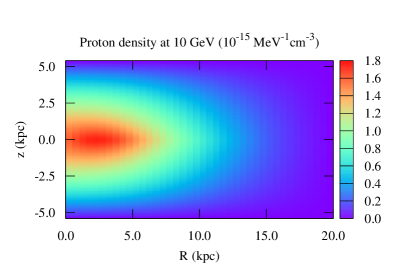
Fig. 7 shows the distribution of protons at energies of 10 GeV, calculated with the GALPROP tool. It shows that the CR density is not uniform, and higher in the inner Galaxy. The product of the CR density and the DM density thus gives a strong anisotropy of the expected CRDM fluxes, as shown in Fig. 1.
Effect on Diurnal Effect
Fig. 8 compares the effects of different density profiles and smooth scales of the DM distribution on the diurnal modulation effect. We can see that for different DM profiles, the basic features of diurnal modulation is not affected with only slight change. The largest difference between Isothermal and NFW profiles is around at the modulation valley.