A NICER look at the state transitions of the black hole candidate MAXI J1535-571 during its reflares
Abstract
The black hole candidate and X-ray binary MAXI J1535-571 was discovered in September 2017. During the decay of its discovery outburst, and before returning to quiescence, the source underwent at least four reflaring events, with peak luminosities of 1035-36 erg s-1 (d/4.1 kpc)2. To investigate the nature of these flares, we analysed a sample of NICER observations taken with almost daily cadence. In this work we present the detailed spectral and timing analysis of the evolution of the four reflares. The higher sensitivity of NICER at lower energies, in comparison with other X-ray detectors, allowed us to constrain the disc component of the spectrum at 0.5 keV. We found that during each reflare the source appears to trace out a q-shaped track in the hardness-intensity diagram similar to those observed in black hole binaries during full outbursts. MAXI J1535-571 transits between the hard state (valleys) and softer states (peaks) during these flares. Moreover, the Comptonised component is undetected at the peak of the first reflare, while the disc component is undetected during the valleys. Assuming the most likely distance of 4.1 kpc, we find that the hard-to-soft transitions take place at the lowest luminosities ever observed in a black hole transient, while the soft-to-hard transitions occur at some of the lowest luminosities ever reported for such systems.
keywords:
accretion, accretion discs black hole physics X-rays: binaries stars: individual: MAXI J1535-5711 Introduction
Low mass X-ray binaries (LMXBs) are binary systems composed of a compact object, a neutron star or a black hole, that accretes material from the outer layers of a low-mass (usually 2 M⊙) companion star. During this process, an accretion disc develops around the compact object and X-rays are emitted due to the high temperatures (107 K) reached by the infalling material in the innermost parts. Most of these systems are transient, displaying outburst and quiescence periods. During outburst, the matter is accreted rapidly and the system reaches high X-ray luminosities (1036-39 erg s-1). Contrarily, in quiescence the accretion rate and X-ray luminosities are lower (1031-34 erg s-1). Transient LMXBs spend most of their life time in the quiescent state, but they occasionally exhibit outbursts (e.g. Lasota, 2001) that might last from some days (see Heinke et al., 2010; Altamirano et al., 2010) to several years (for recent observational studies of X-ray binaries see, e.g, Corral-Santana et al., 2016; Tetarenko et al., 2016). Outbursts are mainly characterised by two spectral states: hard and soft (e.g. Remillard & McClintock, 2006; Matsuoka & Asai, 2013). In the hard state the X-ray spectrum is dominated by the emission of Comptonisation from a hot corona (e.g. Done et al., 2007; Burke et al., 2017) and it can be modelled by a power law. In the soft state, the X-ray spectrum is dominated by thermal emission from an optically thick, geometrically thin accretion disc (Shakura & Sunyaev, 1973), modelled by a disc black-body. LMXBs usually transit these states describing a “q-shaped" track, known as hysteresis loop, moving counter-clockwise (e.g. Belloni et al., 2005; Dunn et al., 2010; Belloni et al., 2011; Belloni & Motta, 2016) in the hardness-intensity diagram (HID; Homan et al., 2001). Although the HID is useful to trace the general evolution of the source, an analysis of the variability adds extra information, establishing e.g. the boundaries of the different states. In black hole systems the hard state is characterised by having a broadband fractional rms of 3040 per cent, the hard intermediate 1030 per cent, the soft intermediate 510 per cent, and the soft state 5 per cent (Muñoz-Darias et al., 2011, see also Méndez & van der Klis, 1997; Motta et al., 2012; Heil et al., 2012).
Outbursts in transient LMXBs are generally characterised by a fast brightness rise, followed by a slower decay to quiescence. However, during the decaying phase, or when the source is reaching the quiescence state, sometimes the accretion rate rises again and the source rebrightens, reaching X-ray luminosities one or two orders of magnitude fainter than the outburst peak. These episodes, known in the literature as reflares, rebrightenings, rebursts, mini-outbursts or echo-outbursts, have been observed in outbursts of a limited number of sources (e.g. Callanan et al., 1995; Altamirano et al., 2011; Jonker et al., 2012; Patruno et al., 2016). It is generally believed that the rebrightenings are “echoes" of the main outburst, in the sense that they are also due to an increase in the mass accretion rate, resembling the main outburst physical properties and phenomena, but in a smaller scale. Moreover, given that they are very common in dwarf novae systems, it is believed they are related to the accretion process and the companion star more than to the type of compact object. However, it is still unknown what produces reflaring and why it manifests only for some sources and for some outbursts. The main issue for studying these events is that observing campaigns usually stop when the sources head to quiescence, and in many cases the rebrightenings are not observed. In addition, sometimes the rebrightenings are only observed at some spectral ranges of the X-ray or optical bands. This makes some instruments more sensitive to reflares, and their detection depends on which instrument is observing. Moreover, since rebrightenings are several orders of magnitude fainter than the main outburst, it is difficult to infer strong conclusions based on colour/hardness studies as the data are dominated by low statistics. Although what causes the increase of the mass accretion rate that give rise to a rebrightening is still unknown, improved monitoring from instruments such as Swift (Neil Gehrels Swift Observatory; Gehrels et al., 2004), MAXI, NICER (Neutron star Interior Composition Explorer)111https://heasarc.gsfc.nasa.gov/docs/nicer/ and INTEGRAL, have increased significantly our ability to detect them.
The X-ray binary transient MAXI J1535-571 (J1535) was discovered simultaneously by MAXI (Negoro et al., 2017a) and Swift (Markwardt et al., 2017; Kennea et al., 2017), on September 2nd, 2017 (MJD 57999). The estimated peak luminosity in the 160 keV band and the observed rapid X-ray variability in MAXI light curves (220 keV), suggested that J1535 is a LMXB harbouring a black hole (Negoro et al., 2017b). Additionally, Russell et al. (2017) used Australia Telescope Compact Array (ATCA) data to estimate a 5 GHz radio luminosity of 2.0530.008 1030 erg s-1 (d/6.5 kpc)2, consistent with a black hole accretor (see also Russell et al., 2019a; Sridhar et al., 2019). J1535 exhibited the expected state transitions, hard-to-soft and soft-to-hard, for a LMXB during outburst (Negoro et al., 2017a, b; Shidatsu et al., 2017; Russell et al., 2018). The first rebrightening of J1535 was detected in mid May, 2018, by Parikh et al. (2018) at 0.510 keV, and the fits to these data suggested that the source may have transitioned to the soft state. A total detection of 5 reflaring episodes, during the outburst declining, was reported by Parikh et al. (2019a) from Swift and ATCA data. The source was no longer detected since May 2019 (Parikh et al., 2019b).
NICER monitored J1535, with almost daily cadence, from its discovery in 2017 until May, 2019, with the exception of the 2 periods when the source was behind the Sun [from 13 October 2017 to 5 January 2018 (MJD 5803958123) and from 8 October 2018 to 10 January 2019 (MJD 5839958493)]. In this paper we analyse NICER data during the decaying phase. We focus on the sequence of rebrightenings observed from mid May until October, 2018. According to the classification of Zhang et al. (2019) for different types of rebrightenings, the events in J1535 are reflares, which is the term we will use from now on. However, Parikh et al. (2019a) consider that the source had returned to quiescence before the rebrightening episodes, making J1535 to lie outside of this classification.
In Section 2 we describe the observations and data analysis. Results from the analysis of the light curve, hardness ratio, energy spectra and power spectra, are reported in Section 3. In Section 4 we discuss the implications of our results and compare J1535 reflares with similar events exhibited by other sources. We also discuss the possible scenarios for the origin of reflaring events. Conclusions follow in Section 5.
2 Observations and data analysis
2.1 NICER
2.1.1 Data
NICER on-board the International Space Station is an observatory that observes in the 0.212 keV band, with a time resolution 300 nsec (Gendreau et al., 2012). NICER’s X-ray Timing Instrument monitored J1535 since its discovery in September, 2017. As we are interested in the reflares observed at the end of the outburst, in this paper we focus our analysis on observations taken within MJD 5825058398 (ObsID: 11303601771130360276). We removed data from detectors #14 and #34, which occasionally show episodes of increased electronic noise. The data were processed using nicerdas version 6.0 and the caldb version 20190516. We applied standard filtering and cleaning criteria to obtain the cleaned event files, including data with a pointing offset of , bright Earth limb angle , dark Earth limb angle , and outside the South Atlantic Anomaly. Furthermore, we excluded time intervals showing strong background flare-ups. The background was calculated using the “3C50_RGv5" model provided by the NICER team. Individual NICER observations have a typical duration of a few ksec that were subdivided into several data segments, separated by 13 ksec gaps due to the orbit of the ISS and composed of good time intervals.
2.1.2 Energy spectra
We extracted a background-subtracted energy spectrum for each data segment during the reflaring periods. We rebinned the spectra by a factor of 3 to correct for energy oversampling and then grouped them in bins of at least 30 counts. The obtained energy spectra were then fitted in the 0.510 keV band using xspec version 12.10.1, within heasarc. We applied version 1.02 of the ancillary response file and version 1 of the response matrix, both provided by the NICER team. A preliminary analysis of the spectra showed the presence of a disc component and a Comptonisation component, as it is usual for black hole LMXBs. We fitted every spectrum with an absorbed 2-component model: a thermally Comptonised continuum component (Zdziarski et al., 1996; Życki et al., 1999) plus a multi-temperature disc component [tbabs*(nthcomp+diskbb)]. The choice of nthcomp over other Comptonisation models relies on the better description of a thermal Comptonisation due to the ability to constrain the low and high energies rollover. The interstellar absorption was modelled using the Tuebingen-Boulder intestellar absorption model (tbabs), with solar abundances set according to Wilms et al. (2000) and the cross-sections from Verner et al. (1996). The hydrogen column density was fixed to 3.2 1022 cm-2, the resulting value from fitting the spectrum in our sample with the highest net counts number. This value is consistent with previous estimates (Tao et al., 2018; Kennea et al., 2017; Stiele & Kong, 2018; Shang et al., 2019). Given that the cutoff energy of the Comptonised component lies outside of our energy range, we fixed the electron temperature. We chose 100 keV due to the likely black hole nature of the compact object (see Burke et al., 2017). The seed photon temperature was linked to the disc temperature. We estimated 1 errors for all the spectral parameters. X-ray luminosities were estimated from the unabsorbed flux, calculated with the cflux convolution model within xspec (0.510 keV), assuming a distance of 4.1 kpc (Chauhan et al., 2019), a value we adopt from now on.
During a period of 3 days (MJDs 58259, 58260 and 58261; corresponding to the peak of the first reflare), the background model underestimated the background count rate at keV for some of the orbits. The energy spectra of the source was dominated by the low-energy component during these observations, and the photon index of the Comptonised component was unconstrained due to the background uncertainties. Therefore we only report the best fit parameters for the disc component during these 3 days.
Mostly during the valleys of the reflares, we observed that the normalisation of the disc component was not 3 significant. In order to determine whether a disc component (detected at the peaks) is present also in the valleys, we estimated upper limits. In all cases, we fixed the disc temperature to 0.49 keV, the value obtained in the last fit where the component was significant from the first reflare (where the evidence of the presence of the disc is stronger). An analogous situation occurred for some fits after the peak of reflare 1, but for the Comptonised component. In these cases, we fixed at 2. We also considered as upper limits all the parameters that were consistent with 0 within errors.
2.1.3 Light curve and hardness-intensity diagram
We produced a light curve from the count rate in the 0.510 keV band, using xspec. We defined hardness as the ratio between the 310 keV and the 0.53 keV count rates.
2.1.4 Timing analysis
We calculated the Fast Fourier Transform (FFT) of the data. We generated the power spectra for each observation in the 0.510 keV band, using a minimum frequency of 7.6 10-3 Hz, a Nyquist frequency of 4000 Hz and data segments of 131 s. After visual inspection of each power spectra light curve, we cleaned the resulting power spectra by removing the data segments evidently produced by background features. We subtracted the Poisson noise from each power spectra. Finally, we renormalised by rms, using an average background count-rate for each observation estimated from the background energy spectra. We estimated the integrated fractional rms amplitude between the minimum frequency, 7.6 10-3 Hz, and 10 Hz for those observations with a net count rate higher than 10 cts s-1 in the 0.510 keV band. Some of the estimated rms amplitudes were not 3 significant individually. We therefore combined the power spectra of groups of non-significant rms amplitude that were close in time and had a similar hardness. Some of the averages were still not significant, but we nevertheless included them in the analysis for consistency, with their 1 error (see Section 3.3). In addition, we averaged all the power spectra of those observations with count rates between 1 and 10 cts s-1. Finally, we computed the absolute rms (RMS) by multiplying the fractional rms by the net count rate in the 0.510 keV band.
2.2 Swift
For a comparison, we used data from the X-ray Telescope (XRT; Burrows et al., 2003) on board Swift. We used the light-curve generator222http://www.swift.ac.uk/user_objects/ provided by the UK Swift Science Data Centre (Evans et al., 2007) to extract the long-term day averaged Swift/XRT light curve of J1535, in the 0.510 keV band.
3 Results
3.1 Light curve and hardness-intensity diagram
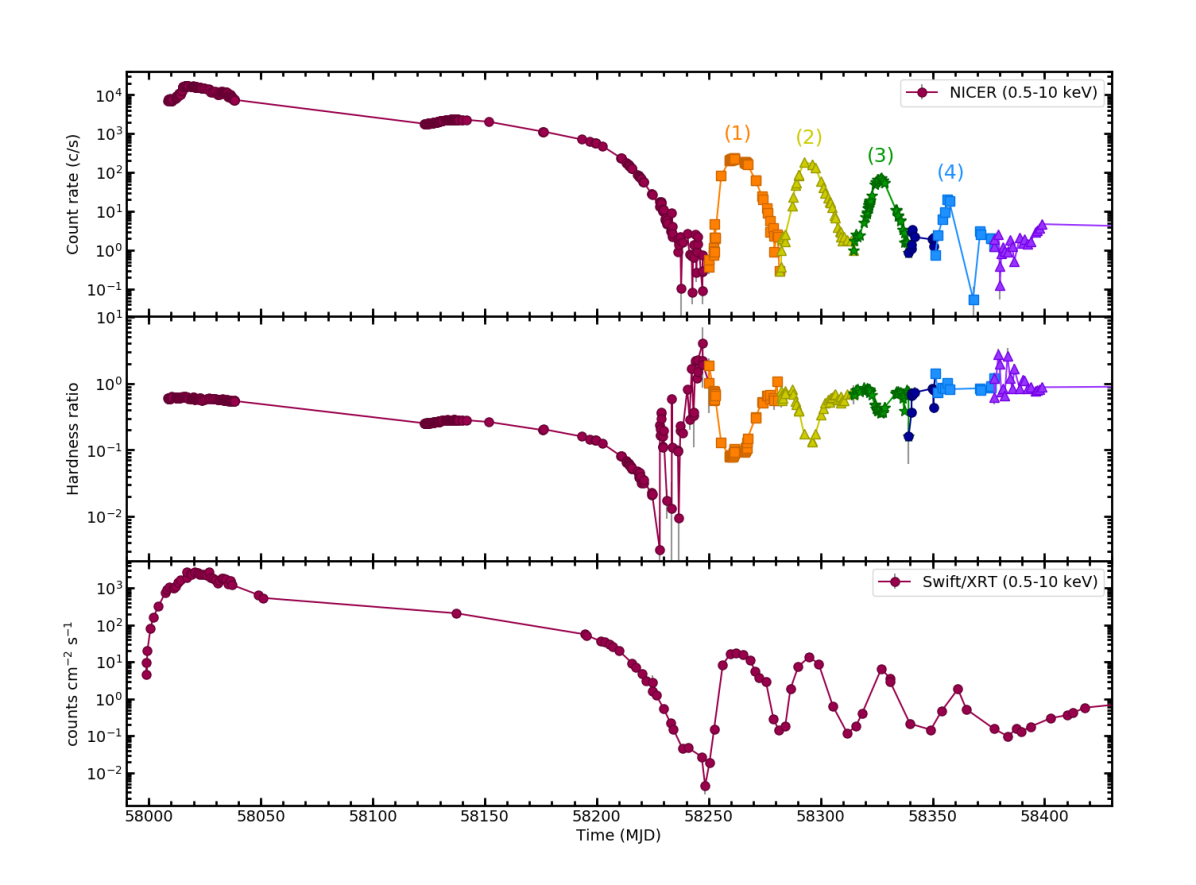
Figure 1, shows the long-term light curve of J1535. The top and bottom panels show the NICER and the Swift/XRT light curves, respectively. NICER started the observations at MJD 58003, when the outburst of J1535 was still rising. The source reached its peak brightness around MJD 58017, with a luminosity of 4 1038 erg s-1. Despite the observational gap between MJD 58039 and 58123 due to the source field of view going behind the Sun, the brightness appeared to have declined slowly for 106 days, before showing a slight increase from MJD 58123. The source reached its second maximum at MJD 58136, with a luminosity of 5 1037 erg s-1, and then continued declining. On MJD 58202 the flux started to decrease more rapidly, until J1535 reached a minimum on MJD 58236 and fluctuated slightly at low luminosities (1034 erg s-1) for 14 days. Starting from MJD 58250 the source exhibited a sequence of 4 reflares indicated from 1 to 4 in orange, yellow, green and light blue colours in time order, respectively, in Figure 1. We consider that each reflare started when the slope of the light curve changed and began to increase, keeping the trend, after a decreasing period. These flares occurred with an approximately averaged periodicity of 3132 days. Table 1 summarises the main characteristics of the reflares. Due to a sampling difference between NICER and Swift/XRT observations, the dates are approximate. The peak luminosities ranged between 0.8 and 7 1036 erg s-1, decreasing with time. After reflare 4, the count rate remained at a low value, similar to that reached before the reflaring events, at an average luminosity of 1034 erg s-1 for 15 days. In the last 3 days before the 2018 Sun constraint, the count rate started to increase again, strongly suggesting the onset of a fifth reflare (see Parikh et al., 2019a). The overall behaviour of the Swift/XRT light curve of J1535 (bottom panel of Figure 1) is, as expected, very similar to the NICER light curve, although with a poorer sampling.
| Reflare | Start date | Duration | Peak date | Unabsorbed Peak | Peak luminosity |
|---|---|---|---|---|---|
| [MJD] | [Days] | [MJD] | Flux [erg cm-2 s-1] | [erg s-1] | |
| 1 | 58250 | 31 | 58261 | 3.370.02 10-9 | 71 1036 |
| 2 | 58282 | 32 | 58292 | 2.930.02 10-9 | 61 1036 |
| 3 | 58314 | 2537 | 58327 | 1.330.02 10-9 | 2.7 1036 |
| 4 | 5834052 | 3143 | 58356 | 4.0 10-10 | 8 1035 |
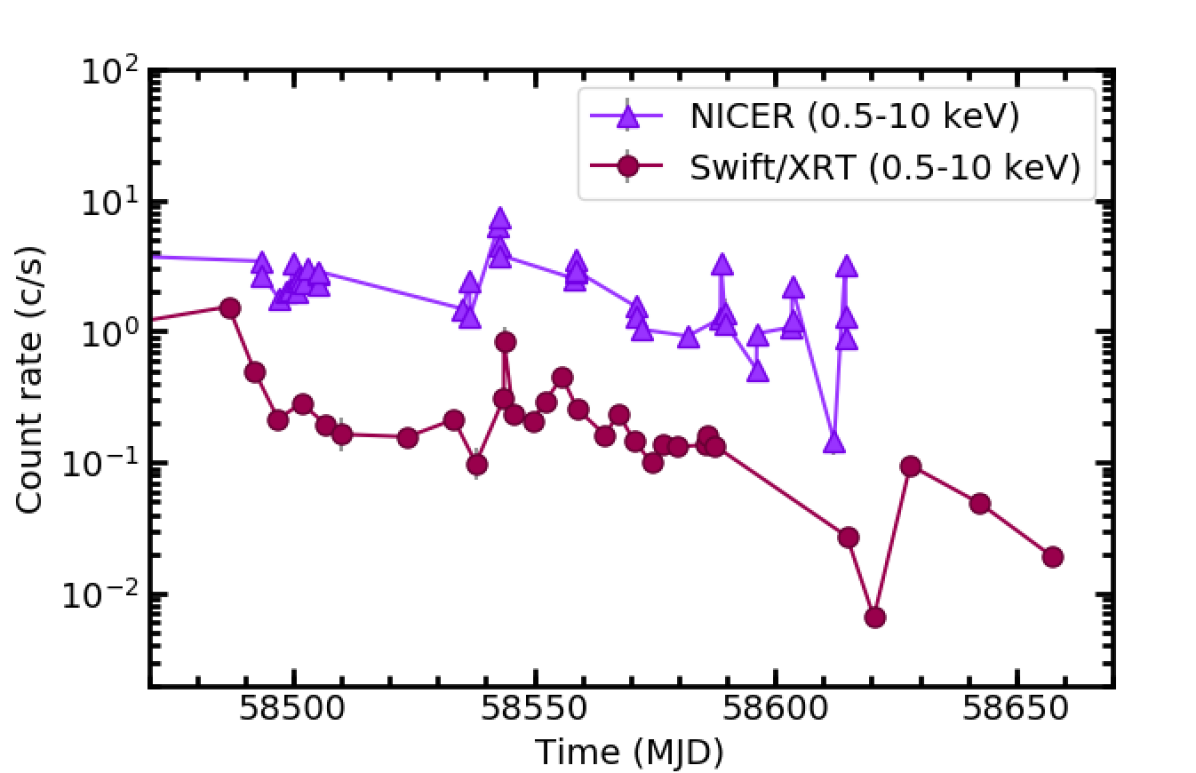
Figure 2 shows the light curve of the last part of the outburst, from MJD 58485 (January 2019), when J1535 was visible again after the Sun constraint, until the end of the monitoring (May 2019).
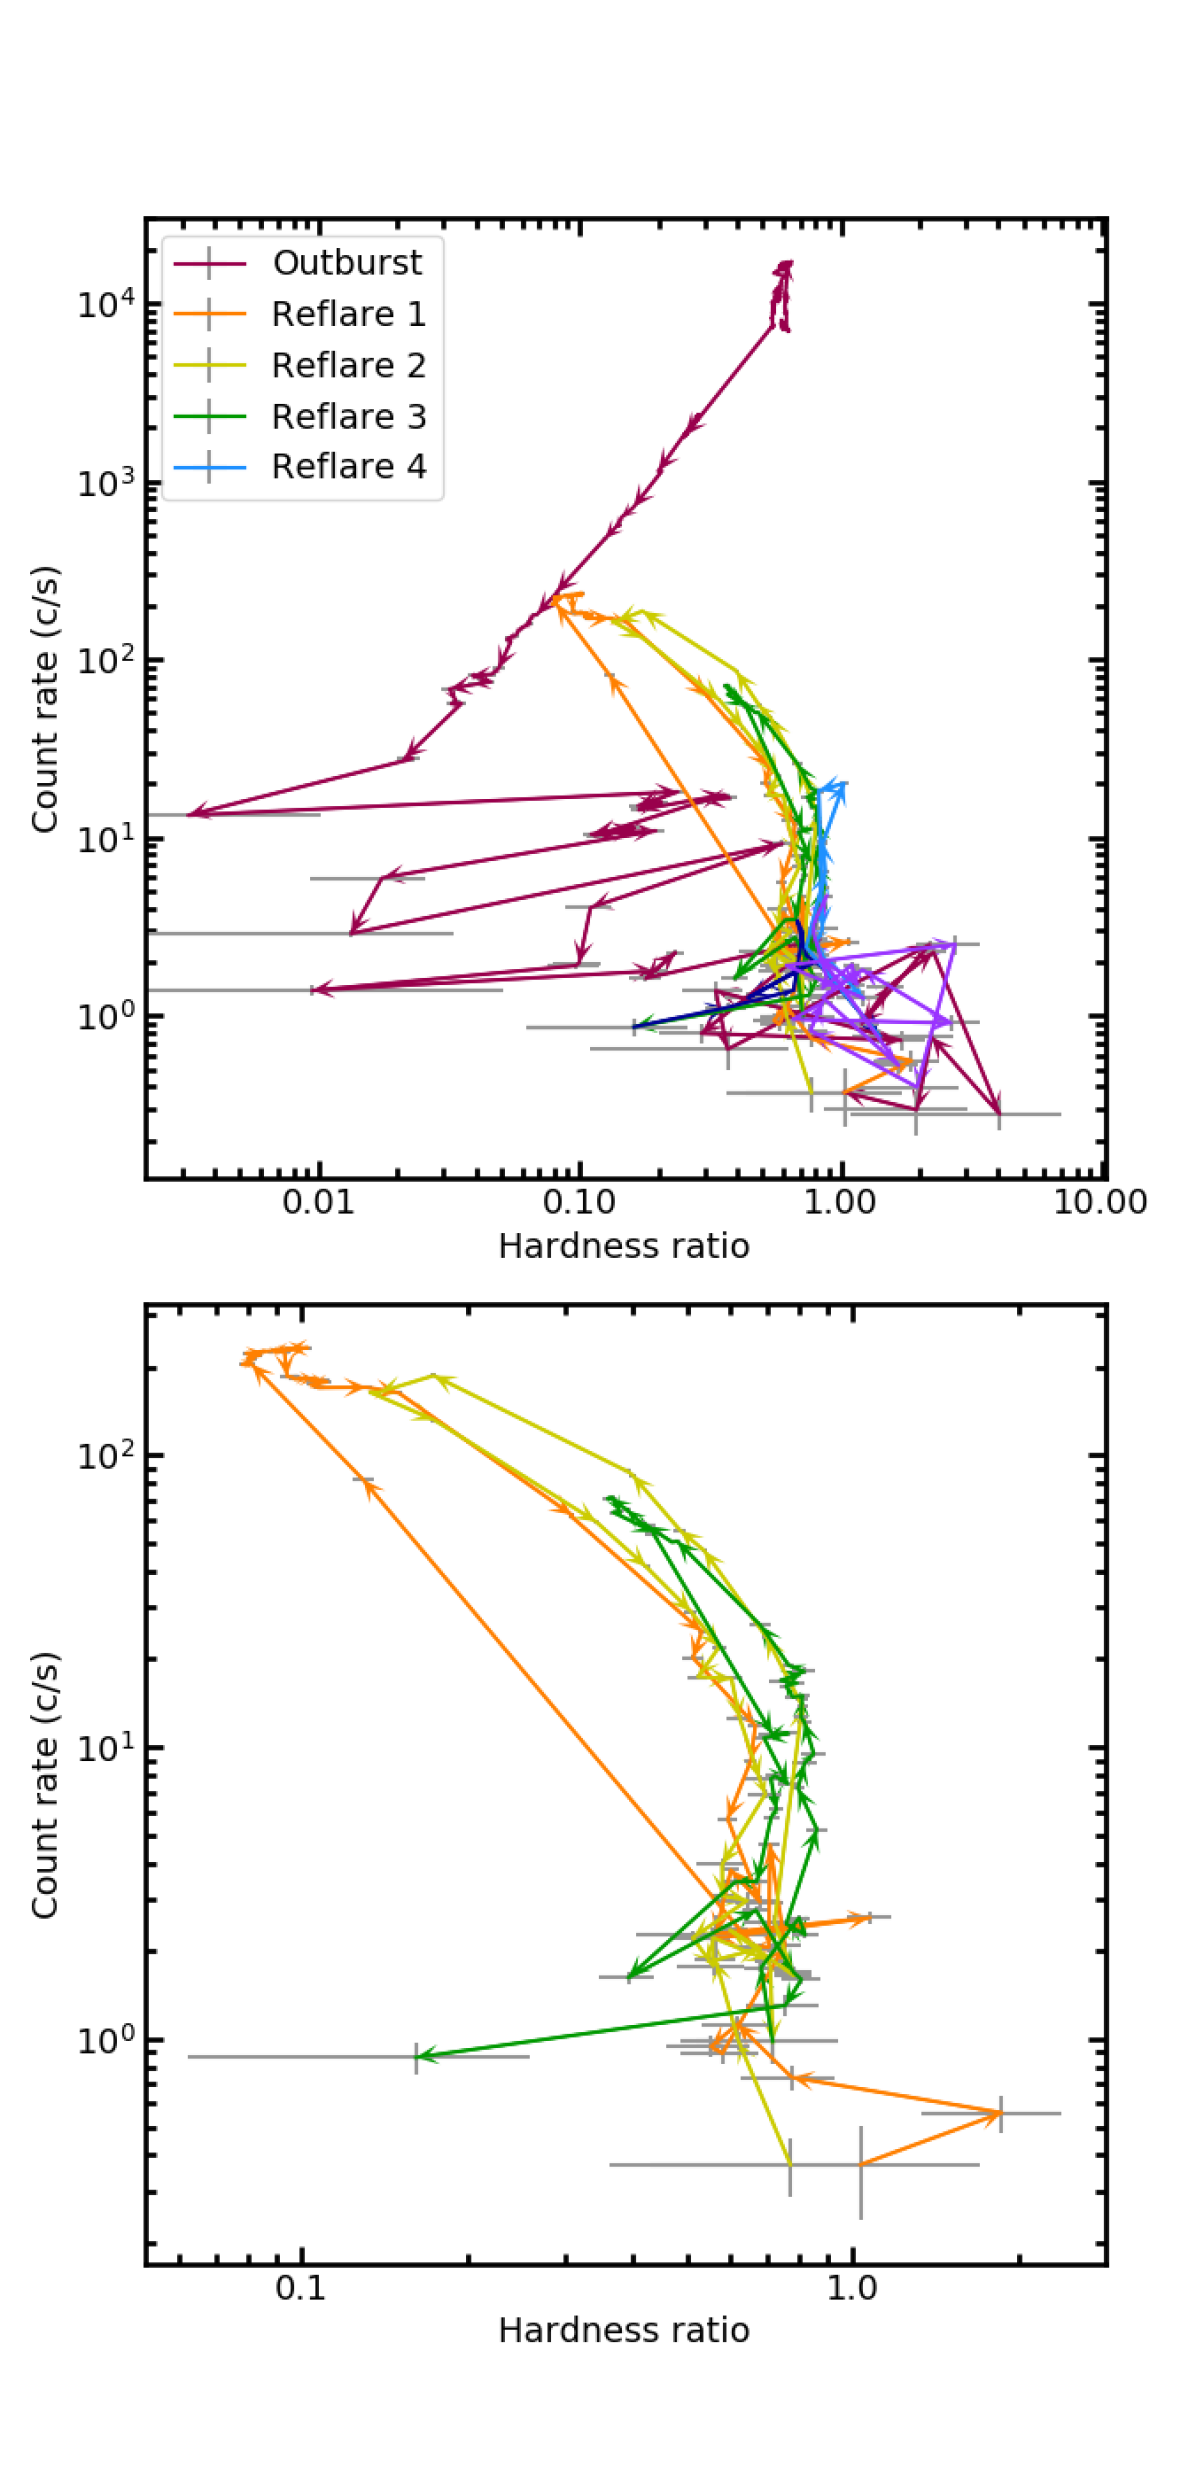
The middle panel of Figure 1 shows the evolution of the hardness ratio. Before MJD 58228, the hardness decreases nearly monotonically to low values, following mainly the main outburst decline stage. The behaviour changes from MJD 58228. The source’s intensity falls to low values and errors become large, while the hardness displays an increasing tendency, but also with large errors. On MJD 58247, right before the reflaring episodes start, the hardness is at a peak value of 4. The subsequent evolution is exactly opposite to the light curve evolution: the hardness is at a minimum when the source intensity peaks, and vice-versa. After reflare 4, when the intensity remains at low values, the hardness fluctuates around a value of 0.85. To study the state of the source with more detail, we plotted in the top panel of Figure 3 the HID for J1535. Although the rising part of the outburst is missing, we observe that for the spectral bands we chose to define the hardness, J1535 does not trace the expected “q-shape" during the outburst exactly, but it still evolves counter-clockwise, from the bright hard state to the soft state and back to the hard state. The source peaks at low values of the hard colour and then moves to soft colours while decreasing its intensity. After the source reaches its softest point at MJD 58228, we observe fluctuations in the hardness, however we note that the errors in those data points are large. The source evolves then to harder values. During the reflares, J1535 also evolves counter-clockwise with the exception of reflare 1, in which it appears to evolve in the opposite direction. However, we note that this conclusion is just motivated by a single data point and that the soft-to-hard transition takes place in a similar track than for reflares 2 and 3. The bottom panel of Figure 3 shows the HID for the reflares. We observe that instead of completing the “q-shape", the reflares fluctuate between the hard area and a softer region of the diagram, exhibiting hysteresis. However, during reflare 4 (in light blue at the left panel of Figure 3) the count rates are too low to detect such behaviour. The observed fluctuations of the source during the reflares point to smaller scale state transitions between a hard state and a “softer" state.
3.2 Energy spectra
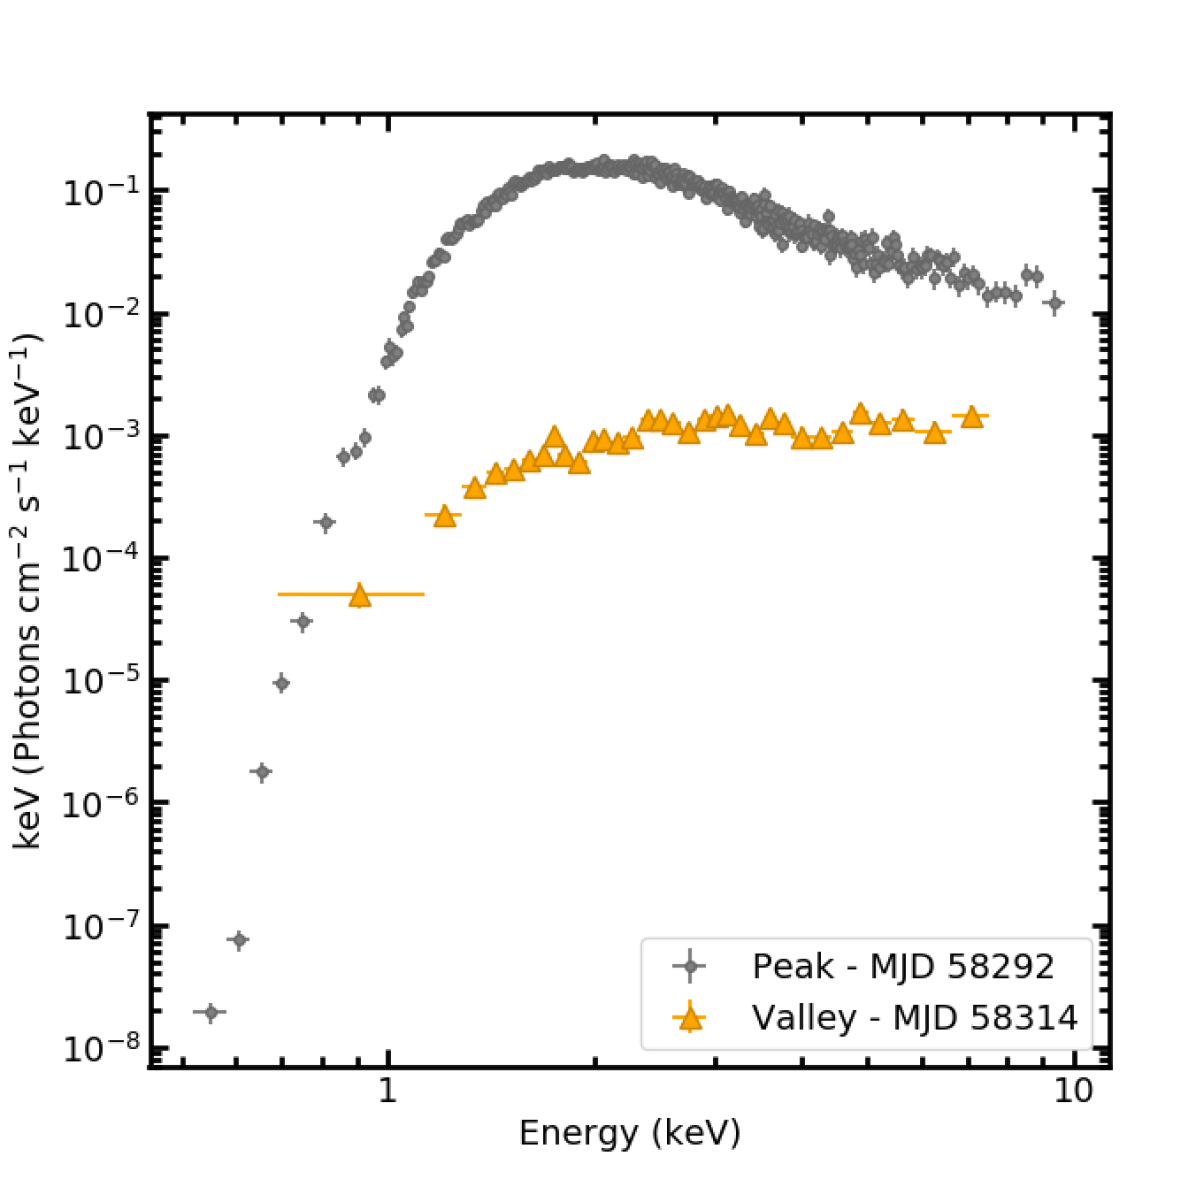
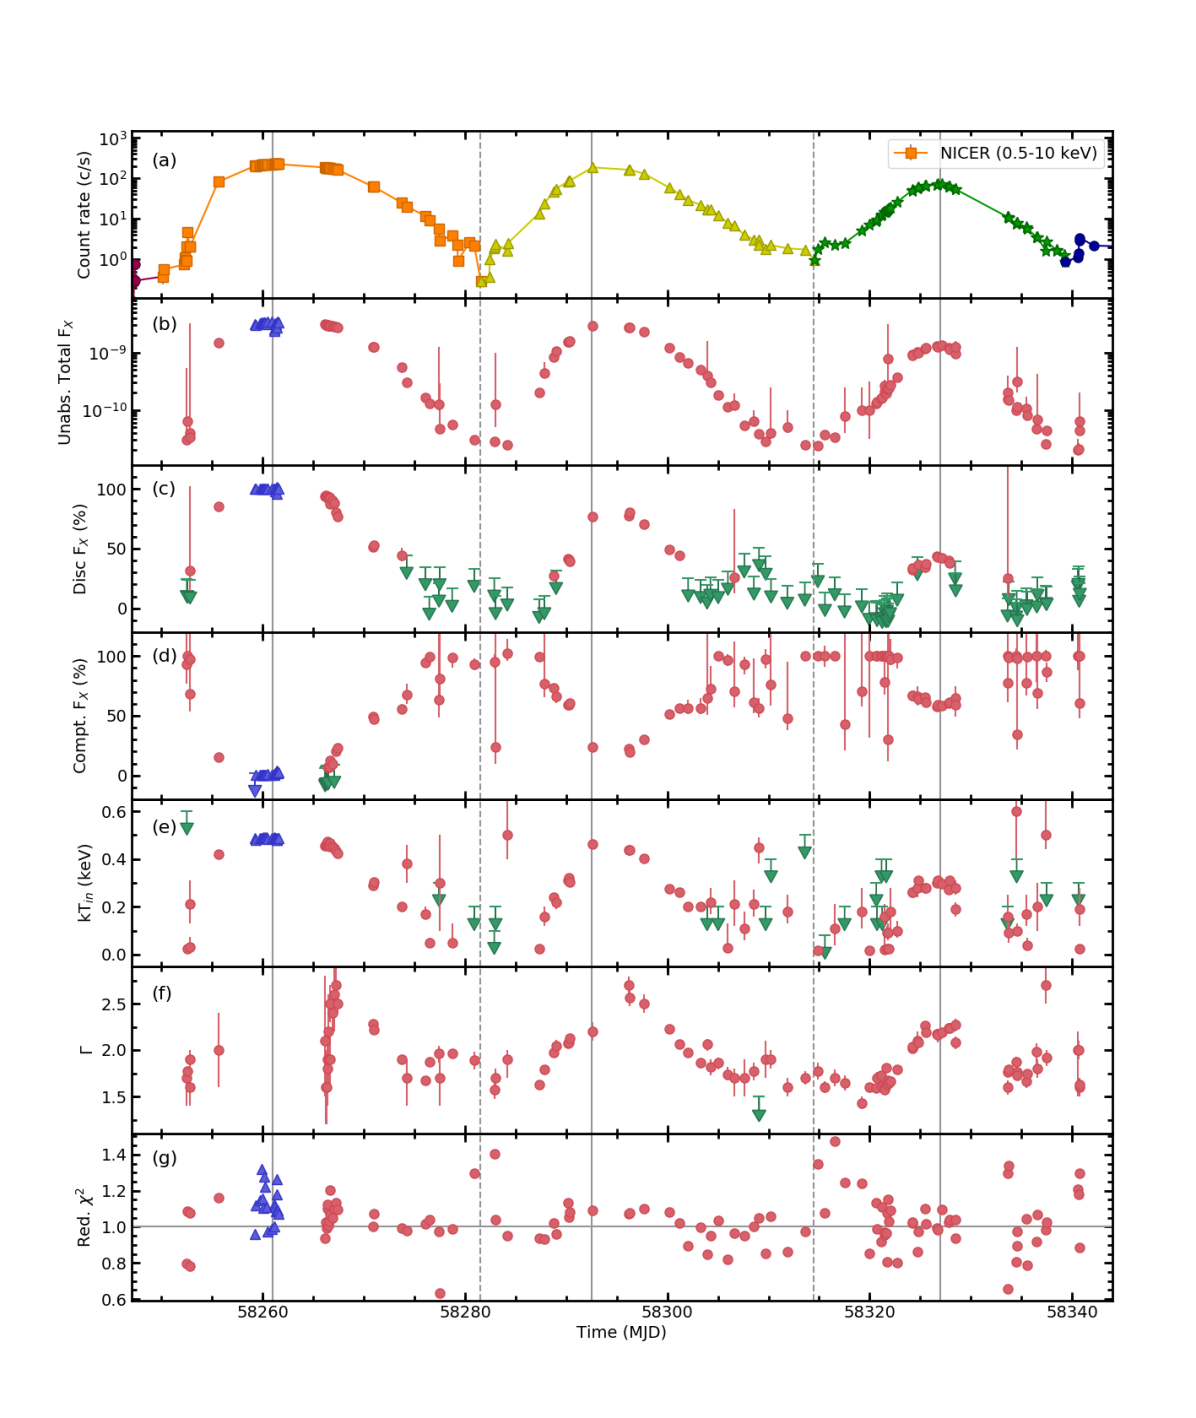
Figure 4 shows representative energy spectra: one near the peak of reflare 2 and one in the valley between reflares 2 and 3. Figure 5 shows the evolution of the parameters from the spectral fits. We only show the results for the first 3 reflares, as the fits for reflare 4 are not statistically sufficient. The panel (a) of Figure 5 shows the NICER light curve in units of count rates, while panel (b) is in units of unabsorbed flux (0.510 keV). Panels (c) and (d) show the percentage of the total flux corresponding to the disc and Comptonised components, respectively. While at the peaks the dominating component is the diskbb, the nthcomp component dominates the spectra when the source is in the valleys of the reflares. The temperature of the disc blackbody kTin is displayed in panel (e). We find that the temperature is correlated with the light curve, reaching values of 0.55 keV. Panel (f) in Figure 5 shows the photon index evolution. We observe that also follows the light curve sinusoidal behaviour, being on average 2.7 at the peak of the reflares and 1.5 in the valleys. Finally, panel (g) of Figure 5 shows the reduced . The best-fitting spectral parameters are compiled and available in a Table as online-only material.
3.3 X-ray variability
Figure 6 shows the HID (top panel) and the hardness-rms (7.6 10-3 10 Hz) diagram (bottom panel; e.g. Belloni et al., 2005) from MJD 58250 onward. The bottom panel of Figure 6 shows that the rms evolves from 1.3 per cent, at a hardness value of 0.09, to 30 per cent, at a hardness of 0.9, with the exception of three data points.
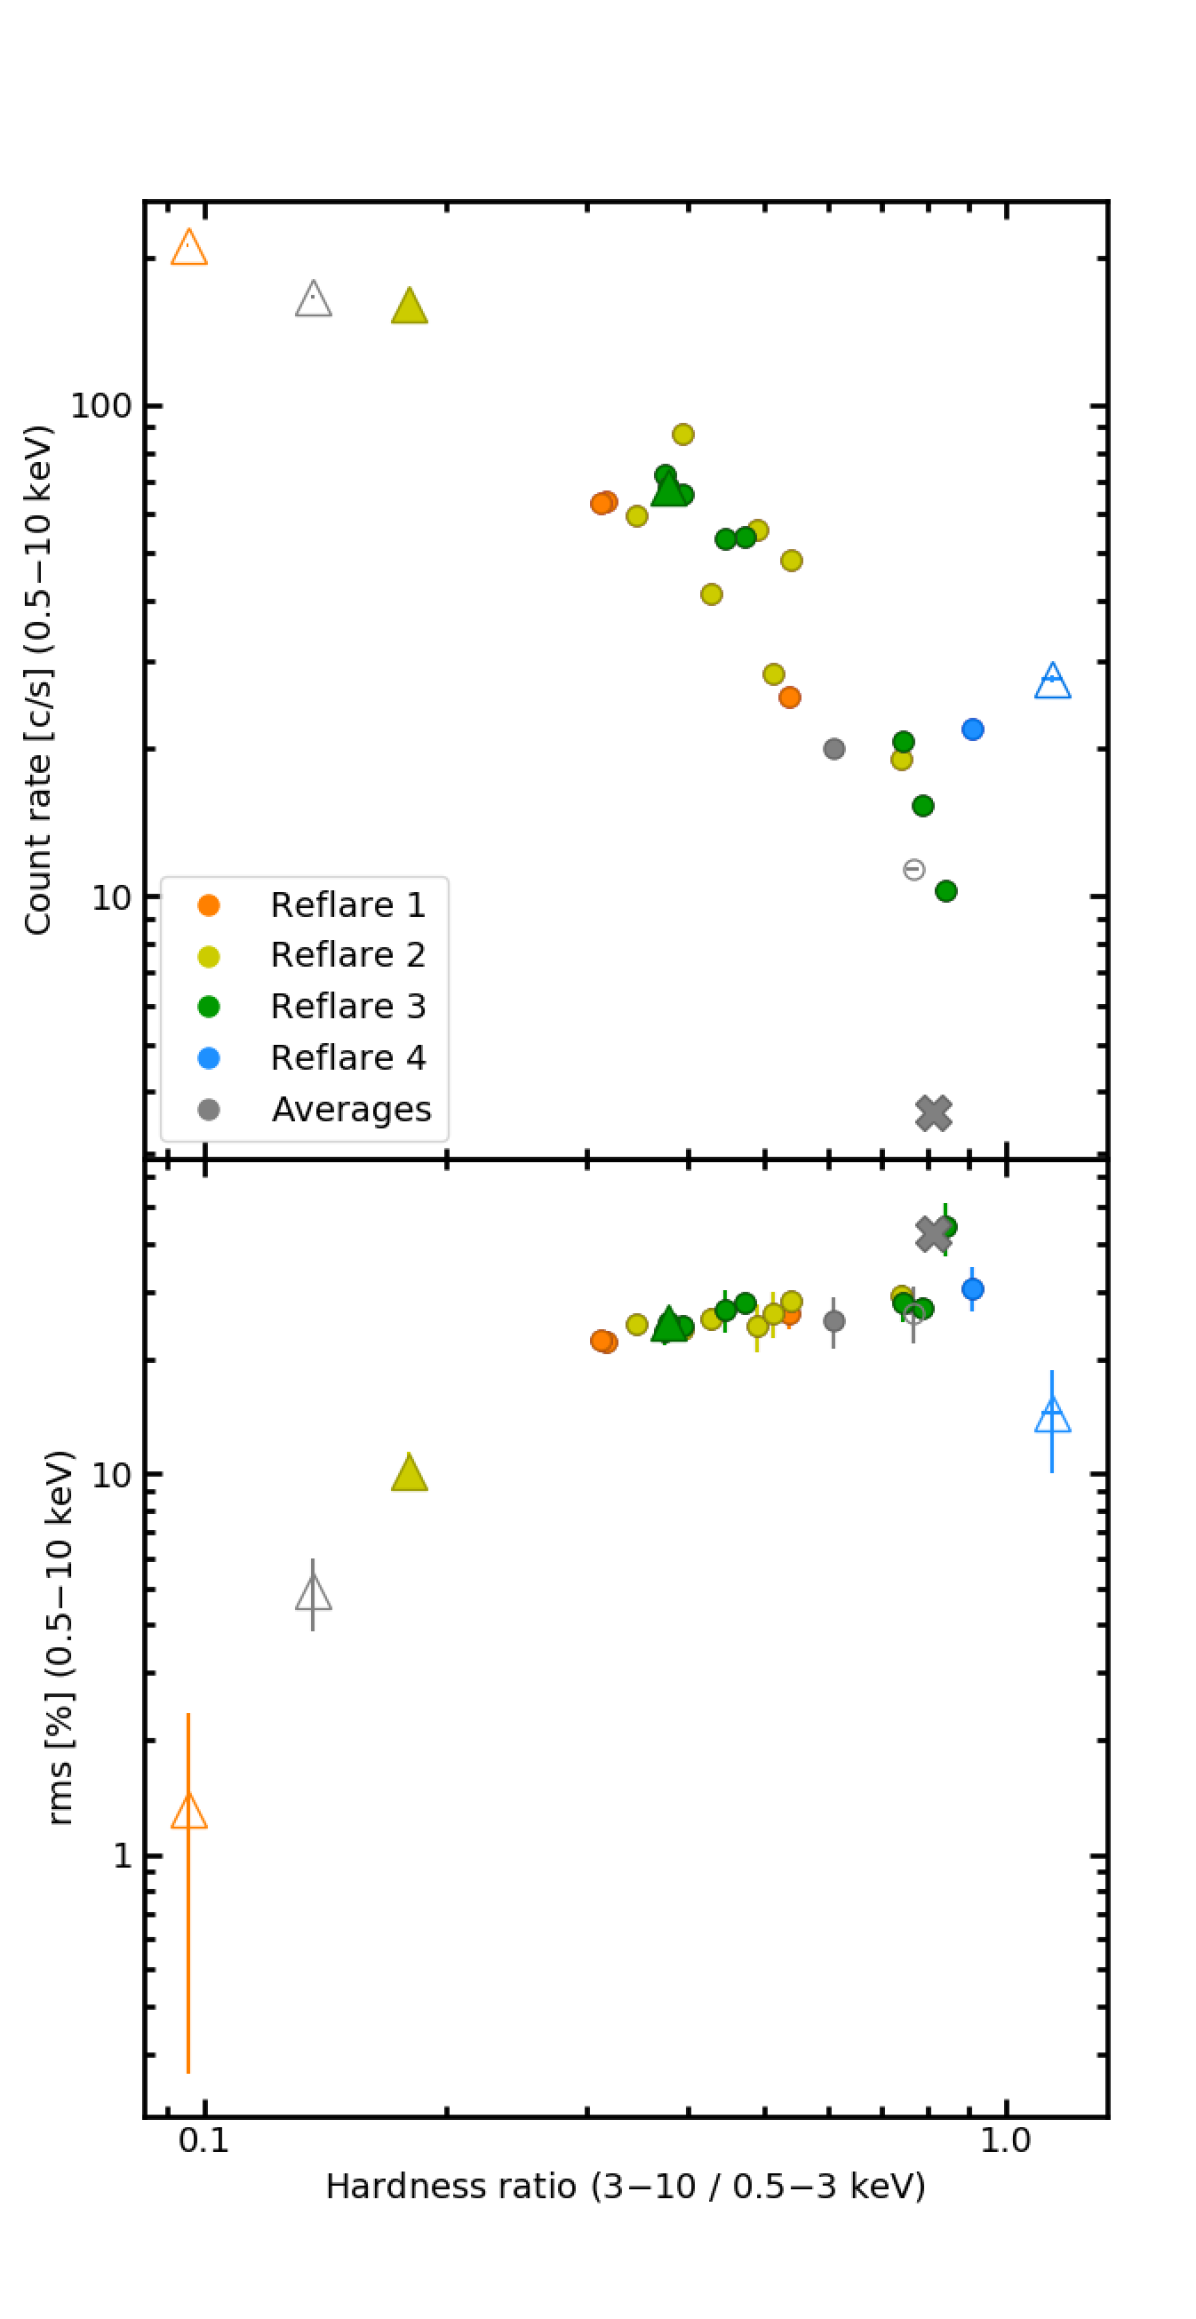
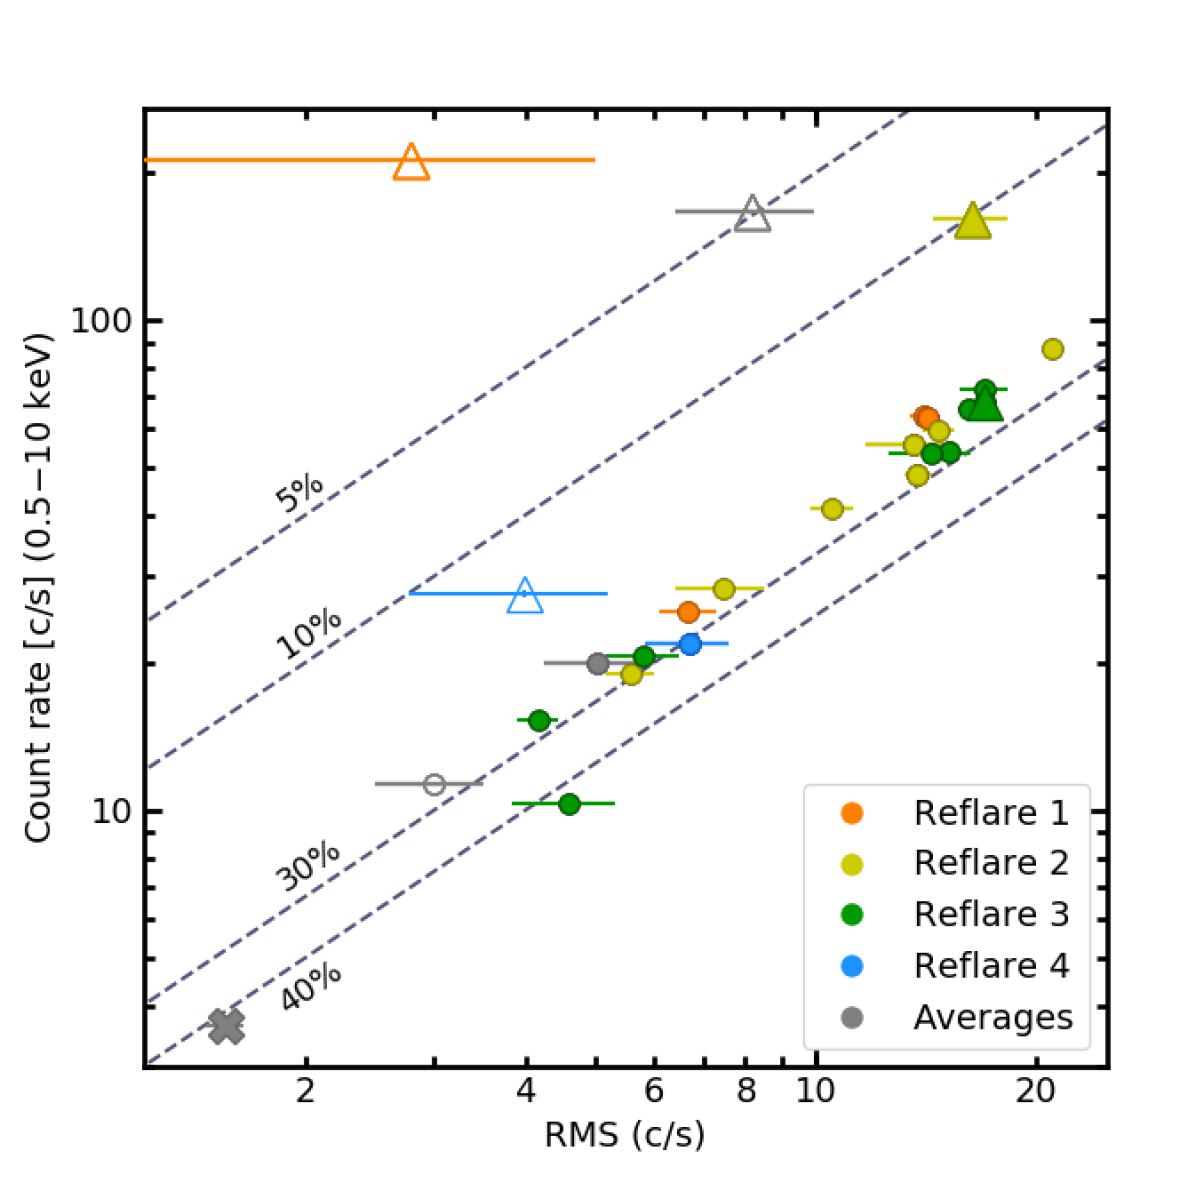
Figure 7 shows the RMS vs. the net count rate. We observe that most of the data are located in, or slightly to the right, of the 30 per cent of the rms, which was defined in the literature as the “hard line" (Muñoz-Darias et al., 2011, but note that these authors used wider energy and frequency bands to measure the rms amplitude). The three data points at a count rate higher than 100 cts s-1 correspond to the observations at the peaks of reflares 1 and 2: the point at an rms 5 per cent is an average of observations at the peak of reflare 1 (orange triangle), the point at 10 per cent is an average of observations at the peak of reflare 2 (yellow triangle), and the point at 5 per cent is an average of observations at both peaks (grey triangle).
The observations lying along the “hard line", at count rates lower than 100 cts s-1, are associated with energy spectra with a dominant Comptonised component, evidencing that the source was effectively in the hard state during the valleys of the reflares. The observations at fractional rms amplitudes 10 per cent, with count rates 100 cts s-1, are those whose fit was dominated by the disc component, implying that J1535 transitioned to softer states (likely soft intermediate state at the peak of reflare 2 and soft state at the peak of reflare 1, where the corona was undetectable).
4 Discussion
We present a detailed analysis of the spectral and timing properties of the reflaring episodes observed at the end of the discovery outburst of the black hole candidate J1535. The almost daily sampling and the low-energy coverage (down to 0.5 keV) offered by NICER, provided an unprecedented opportunity to study these reflaring episodes in great detail. We found that during these reflares, J1535 underwent state transitions, reaching softer states at the peaks (where the Comptonised component is not significantly detected) and returning to the hard state during the valleys (where the disc component is not significantly detected). These state transitions track a hysteresis loop in the HID, resembling to some extent the hysteresis displayed in the full outburst of this and other LMXBs with both black hole (e.g. Dunn et al., 2010) and neutron star (e.g. Muñoz-Darias et al., 2014) accretors. These results support the suggestions that outbursts and reflares are driven by the same physical processes.
4.1 Outburst reflares of MAXI J1535-571: the state transition identification
The HID is commonly used to trace the state of a LMXB during an outburst. NICER started observing J1535 when the source was already bright, and did not sample the rise of the hard branch in the HID. However, a “q-pattern" is still visible showing that J1535 underwent the hard-to-soft and the soft-to-hard transitions during the main, bright outburst (see also Tao et al., 2018). The reflares in J1535 also displayed hysteresis in the HID, suggesting similar state transitions that we then demonstrated with our spectral fits. Swift/XRT observations of these flares also suggested state transitions (Parikh et al., 2019a); however the Swift/XRT data quality did not allow the authors to detect the hysteresis loops.
The reflares hysteresis loops occur at 100 times lower luminosities than the main peak of the outburst. The peak luminosities of the reflares imply that the state transitions took place at L 71036 erg s-1; these values are, to our knowledge, the lowest luminosity hard-to-soft transitions ever observed in a black hole binary. This also implies that the soft-to-hard transitions occurred at lower luminosity, however such low luminosities have been observed before (e.g. Tomsick et al., 2014; Shaw et al., 2016). We note that our luminosity estimations assumed the most likely distance value of 4.1 kpc from Chauhan et al. (2019). However, these authors also estimated an upper limit for the distance of 7 kpc, which results in peak luminosities of 21037 erg s-1 for the reflares [Sridhar et al. (2019) estimated a distance of 5.4 kpc, which lies between the above-mentioned values]. Although such luminosities would be among the highest observed for reflares in LMXBs, they imply state transitions occurring at more usual intensity levels.
The spectral fits yielded 2.3 2.7 and 0.3 kT 0.55 keV at the peak of the first 3 reflares. These values, in agreement with the soft state revealed during the main outburst (Nakahira et al., 2018; Tao et al., 2018; Stiele & Kong, 2018), are consistent with the presence of an accretion disc. At the bottom of the reflares, the disc component was not significantly detected, while the fitted model yielded 1.5 2. This is again in agreement with the hard state values reported at the main outburst (Nakahira et al., 2018; Tao et al., 2018; Stiele & Kong, 2018).
The state transitions observed during the reflares evidence the (partial) non-detection of the Componised component during the peaks. Since our data set and current models do not allow to determine the temperature or size of the corona during the peaks, we can only speculate that the non-detection could be due to either a drop of the temperature of the corona (e.g. Yan et al., 2020) or a decrease of the corona size. In the first case, the electrons would not have enough energy to upscatter the photons from the disc. Without a heating mechanism, the corona would cool down very quickly (Merloni & Fabian, 2001); while it is unclear what the heating mechanism is, it is clear that it is very efficient in black hole candidates in the low-hard state, given that the temperature of the corona is quite high in those cases (e.g. Zdziarski et al., 1998; Xu et al., 2017). If the corona is cooler at the peaks than at the minima of the reflares, the efficiency of the heating mechanism must change rather quickly. In the second case, the reduction of the size of the corona implies a drop in the flux of the Comptonised component (Kara et al., 2019; Karpouzas et al., 2020; Zhang et al., 2020a). In both cases, if it is hot enough, the disc could dominate the spectrum as we see at the peak of the reflares of J1535. Similarly, we speculate that the disappearance of the disc during the valleys could be caused by a cooling of the disc and an increase of its inner radius (see, however, Sridhar et al., 2020). However we do not have strong evidence that this is the case.
The analysis of the X-ray variability for J1535 supports our spectral state identification during the reflares. We found that the observations that sample the valleys (i.e. where the Comptonisation component dominates), lie along the “hard line" of the RMS-intensity diagram plotted in Figure 7. As J1535 becomes brighter the reflares become softer (i.e. where the disc component dominates) and the X-ray variability decreases, reaching fractional rms amplitudes 5 per cent. It is worth noting that quasi-periodic oscillations (QPOs) were detected during the main outburst of J1535 (Mereminskiy et al., 2018; Stevens et al., 2018; Huang et al., 2018; Stiele & Kong, 2018; Shang et al., 2019; Sreehari et al., 2019), however, we did not detect any significant QPO during the reflares. This result could potentially be related to differences in the physical conditions during the normal bright outburst and the fainter reflares or it could be that QPOs are too weak to be detected at the low count rates we observe. However, the relationship between outbursts, reflares, state transitions and QPOs is probably complex. For example, Zhang et al. (submitted) reported on the spectral and X-ray variability study of the recent outburst of the black hole LMXB MAXI J1348-630. These authors found that the source underwent a bright outburst during which, similarly to J1535, it displayed Type-B and Type-C QPOs (Casella et al., 2005; Motta et al., 2011). After the main outburst, MAXI J1348-630 also underwent 3 reflares (Russell et al., 2019b; Negoro et al., 2019; Yazeedi et al., 2019; Pirbhoy et al., 2020; Shimomukai et al., 2020; Zhang et al., 2020b). However, contrastingly to J1535, Zhang et al. found that none of the reflares experienced state transitions (the source remained in the hard state during all flares) and they detected Type-C QPOs also during these reflares.
Finally, we found that each reflare is fainter than the preceding one (see also Parikh et al. 2019a and Section 4.3 for further discussion), albeit their duration appears to remain approximately constant (30 days). Additionally, we observe that the disc component follows the same behaviour, as it can be inferred from both spectral and timing parameters. The evolution of the disc flux and temperature [panels (c) and (e) in Figure 5] mimic the shape of the light curve, while the fractional rms evolves from 5 per cent at the peak of reflare 1 to 20 per cent in reflare 4 (see Figure 7), indicating that the disc component becomes weaker as the reflares get fainter.
4.2 Spectral and timing analysis of reflares in other LMXBs
In the previous Section we briefly discussed the results of Zhang et al. (submitted) on the reflares observed in the black hole candidate MAXI J1348-630. In addition to this source, outburst reflares have been reported for other sources, both black hole (e.g. Kuulkers et al., 1996; Kuulkers, 1998; Zurita et al., 2002; Tomsick et al., 2003; Homan et al., 2013; Yan & Yu, 2017) and neutron star (e.g. Šimon, 2010; Patruno et al., 2016; van den Eijnden et al., 2019; Bult et al., 2019) X-ray binaries. Yan & Yu (2017) studied the X-ray spectra of the black hole candidate GRS 1739-278 during the 2 reflares observed after its 2014 outburst. These reflares underwent spectral state transitions and showed hysteresis loops in the HID (see also Bykov et al., 2019). Yan & Yu defined the hard state as the period when a simple power law (with 2.1) fitted the spectra, the soft state when the disc component was 80 per cent of the total flux (0.510 keV), and the intermediate state between those two. Under those definitions, these authors found that the hard-to-soft transition luminosity and the soft state peak luminosity, during both the reflares and the main outburst, follow a correlation between those luminosities that was previously observed for bright X-ray binaries (Yu et al., 2004; Tang et al., 2011). This result led Yan & Yu (2017) to conclude that the same mechanism is driving both outbursts and reflares.
Similar reflares to the ones observed in GRS 1739-278 were detected for the black hole systems MAXI J1659-152 (Homan et al., 2013) and XTE J1650-500 (Tomsick et al., 2004). The energy spectra of both sources during the reflares were fitted by a simple power law with 1.552.5 and 1.661.93, respectively, implying that the sources remained in the hard state and no state transition took place. Moreover, Yan & Yu (2017) re-analysed MAXI J1659-152 and XTE J1650-500 data and determined there was no hysteresis during their reflares.
A reflare was also observed after the 2018 outburst of the accreting millisecond pulsar IGR J17379-3747 (Bult et al., 2019). The spectral modelling revealed that both a single power law model and a power law plus a blackbody model produced analogous results. In any case, 1.9 implying the source became relatively soft, but that it did not underwent a state transition.
While the spectral analysis of reflares has been difficult, X-ray variability studies have been even more challenging. These types of analyses were mostly reported in a few cases for individual observations taken during a reflare (e.g. Terada et al., 2002; Tomsick et al., 2004; Migliari et al., 2005; Court et al., 2017). In addition, a more extensive study of the X-ray variability during reflares was performed for the accreting millisecond pulsar SAX J1808.4-3658. This source exhibited reflares after 5 outbursts and the presence of a 1 Hz QPO was observed after 3 of them (van der Klis et al., 2000; Wijnands et al., 2001; Patruno et al., 2009), which was interpreted as being caused by hydrodynamic disc instabilities. However, the later report of a similar type of variability in the same source, but at higher luminosities, suggests that these QPOs are not related to the flaring state (Bult & van der Klis, 2014). Likewise, Bult et al. (2019) analysed the X-ray variability in the accreting millisecond pulsar IGR J17379-3747. In particular, these authors were able to study the properties of the coherent pulsations during both the main 2018 outburst and the subsequent reflares. Table 2 summarises the main results from the spectral and timing studies during the reflares of the sources discussed above.
| Source | State transitions | Hysteresis | QPOs | Reference |
|---|---|---|---|---|
| MAXI J1535-571 | yes | yes | no | This work |
| MAXI J1348-630 | no | no | yes | Zhang et al. (submitted) |
| GRS 1739-278 | yes | yes | Yan & Yu (2017); Bykov et al. (2019) | |
| MAXI J1659-152 | no | no | Homan et al. (2013) | |
| XTE J1650-500 | no | no | Tomsick et al. (2004) | |
| IGR J17379-3747 | no | no | Bult et al. (2019) | |
| SAX J1808.4-3658 | yes | van der Klis et al. (2000); Wijnands et al. (2001); | ||
| Patruno et al. (2009) |
Thanks to the low-background high-sensitivity of NICER and its capabilities of performing monitoring observations, it is now possible to do X-ray variability studies of low-luminosity outburst reflares like the one presented here and in Zhang et al. (submitted) for MAXI J1348-630. With the current data (two outburst of two different sources) it is not possible to discern whether there is a link between QPO occurrence and the spectral evolution of the reflares. This highlights the need for more monitoring observations of these reflares with instruments like NICER.
4.3 Origin of reflares
The disc instability model (DIM) is the model most commonly used to explain how outbursts start (for a review see Lasota, 2001). In this model, the outburst is the result of the heating of the disc due to the ionisation of the hydrogen accumulated during the quiescent state. The DIM is not able to consistently explain the onset of reflares, as the model implies that the disc is depleted from matter at the end of an outburst, while the reflares require a large amount of matter left (see Patruno et al., 2016, and references therein). Although it is not clear whether the different types of reflares are produced by the same physical process, their origin was discussed several times in the literature.
-
•
Chen et al. (1993) proposed a scenario that generates two glitches or reflares (according to the classification in Zhang et al., 2019) after the outburst, in which irradiation of the secondary star leads to a mass transfer process. The first maximum would be caused by X-ray evaporation of the material close to the first Lagrangian point, while the second one would be the result of mass transfer instability due to the heating of the secondary during the main outburst.
-
•
Other authors have favoured the enhanced mass transfer from the secondary caused by X-ray heating. For instance, Augusteijn et al. (1993) showed that if this is the case, then the main outbursts are caused by a burst of mass transfer from the secondary.
- •
Reflares are very common in dwarf novae systems. Particularly in the SU UMa systems, the reflares are only observed after long outbursts, known as superoutbursts. It was proposed that the reflares could be caused by enhanced mass transfer as a result of illumination of the donor (Hameury, 2000; Hameury et al., 2000), however this enhancement was proven to be negligible (Osaki & Meyer, 2003, 2004). Meyer & Meyer-Hofmeister (2015) proposed that the formation of magnetic fields during the superoutburst results in an enhanced viscosity, which produces wave reflections between the hot and cold states of the accretion disc, causing the reflares. Zhang et al. (2019) proposed that mini-outbursts in black hole systems could be explained by the DIM if the disc is still hot at the end of the outburst, as is the case of dwarf novae systems. Usually single or multiple reflares are observed in dwarf novae systems and, in the later case, they display a periodic behaviour. Although is not the usual behaviour for LMXBs, the nearly periodic occurrence of the reflares of J1535 resemble those observed in dwarf novae. Moreover, the reflaring light curves we obtain for J1535 are similar to the one observed at optical wavelengths in GRO J042232 (Kuulkers et al., 1996) and MAXI J1807132 (Jiménez-Ibarra et al., 2019). Zhang et al. (2019) noticed that the extrapolation of the decaying phase of the main outburst in the light curve coincides with the peaks of the reflares for both dwarf novae and LMXBs, implying the existence of a critical temperature of the disc.
While plausible, all the above models proposed to explain reflares in LMXBs are unproven. If we consider, for example, that reflares are triggered by the matter left in the disc after the main outburst, it remains unknown whether each reflare is powerful enough as to trigger the next one. Additionally, one can wonder whether mass transfer from the secondary can trigger the reflares in time scales of 30 days, or if reflares can result from wave reflections through the disc so regularly.
Independently of the trigger, Patruno et al. (2016) proposed that the reflares are small-scale outbursts, generated by a disc instability (a change in the disc density) at the end of an outburst. Although what triggers the new instability is still unclear, the lower scale appears to be due to the low amount of matter left in the disc after the main outburst. Likewise, the progressive faintness of the reflares in J1535 supports the interpretation of an emptying reservoir of mass available for accretion, as proposed by Parikh et al. (2019a). Additionally, these authors detected a compact radio jet in the hard state of the reflares that was observed to quench as the source transitioned to the soft state. This behaviour provides further support to the conclusion that the relevant physical ingredients of the main outburst are very similar to those describing the reflares.
In summary, as it was pointed before by several authors, reflares are observed in different accreting systems (dwarf novae, neutron stars, black holes), which indicates that they are related to the accretion process and independent of the nature of the compact object. Moreover, the reflares observed in J1535 showed state transitions and hysteresis, as is usually observed during bright outbursts of LMXBs. This result suggests that similar physical processes take place during outbursts and reflares, even when the X-ray luminosity is two orders of magnitude different.
5 Conclusions
In this work we present a detailed analysis of the evolution of the three brightest outburst reflares observed in the black hole candidate MAXI J1535-571 during the decline of its discovery outburst. Both our spectral and X-ray variability results show that during the reflares the source underwent state transitions, tracking hysteresis loops. J1535 reached the soft state at the peak of the first reflare, while it returned to the hard state during the valleys. We found that these state transitions were characterised by the appearance and disappearance of the disc component, implying that both the disc and the corona change significantly. Assuming the most probable distance value of 4 kpc, we found that the state-transition X-ray luminosities are the lowest luminosities ever observed at which the hard-to-soft state transitions took place and among the lowest at which the soft-to-hard state transitions ever happened. The similarities observed between the reflares and the main outburst of this and other black hole binaries support the interpretation that reflares are smaller scale outbursts, driven by the same physical mechanisms.
Acknowledgements
V.A.C. acknowledges support from the Royal Society International Exchanges “The first step for High-Energy Astrophysics relations between Argentina and UK" and from the Spanish Ministerio de Ciencia e Innovación under grant AYA2017-83216-P. K.A acknowledges support from a UGC-UKIERI Phase 3 Thematic Partnership (UGC-UKIERI-2017-18-006; PI: P. Gandhi). L.Z. acknowledges support from the Royal Society Newton Funds. D.A. and D.J.K.B. acknowledge support from the Royal Society. J.A.C was supported by PIP 0102 (CONICET) and PICT-2017-2865 (ANPCyT). This work was also supported by the Agencia Estatal de Investigación grant AYA2016-76012-C3-3-P from the Spanish Ministerio de Ciencia e Innovación and by the Consejería de Economía, Innovación, Ciencia y Empleo of Junta de Andalucía under research group FQM-322, as well as FEDER funds. T.M.D. acknowledges support via the Ramón y Cajal Fellowship RYC-2015-18148. This work was supported by NASA through the NICER mission and the Astrophysics Explorers Program. This work made use of data supplied by the UK Swift Science Data Centre at the University of Leicester. This research has also made use of data and software provided by the High Energy Astrophysics Science Archive Research Center (heasarc) and NASA’s Astrophysics Data System Bibliographic Services.
References
- Altamirano et al. (2010) Altamirano D., et al., 2010, ApJ, 712, L58
- Altamirano et al. (2011) Altamirano D., et al., 2011, ApJ, 742, L17
- Augusteijn et al. (1993) Augusteijn T., Kuulkers E., Shaham J., 1993, A&A, 279, L13
- Belloni & Motta (2016) Belloni T. M., Motta S. E., 2016, in Bambi C., ed., Astrophysics and Space Science Library Vol. 440, Astrophysics of Black Holes: From Fundamental Aspects to Latest Developments. p. 61 (arXiv:1603.07872), doi:10.1007/978-3-662-52859-4_2
- Belloni et al. (2005) Belloni T., Homan J., Casella P., van der Klis M., Nespoli E., Lewin W. H. G., Miller J. M., Méndez M., 2005, A&A, 440, 207
- Belloni et al. (2011) Belloni T. M., Motta S. E., Muñoz-Darias T., 2011, Bulletin of the Astronomical Society of India, 39, 409
- Bult & van der Klis (2014) Bult P., van der Klis M., 2014, ApJ, 789, 99
- Bult et al. (2019) Bult P., et al., 2019, ApJ, 877, 70
- Burke et al. (2017) Burke M. J., Gilfanov M., Sunyaev R., 2017, MNRAS, 466, 194
- Burrows et al. (2003) Burrows D. N., et al., 2003, in Truemper J. E., Tananbaum H. D., eds, Society of Photo-Optical Instrumentation Engineers (SPIE) Conference Series Vol. 4851, X-Ray and Gamma-Ray Telescopes and Instruments for Astronomy.. pp 1320–1325, doi:10.1117/12.461279
- Bykov et al. (2019) Bykov S. D., Filippova E. V., Mereminskiy I. A., Semena A. N., Lutovinov A. A., 2019, Astronomy Letters, 45, 127
- Callanan et al. (1995) Callanan P. J., et al., 1995, ApJ, 441, 786
- Casella et al. (2005) Casella P., Belloni T., Stella L., 2005, ApJ, 629, 403
- Chauhan et al. (2019) Chauhan J., et al., 2019, MNRAS, 488, L129
- Chen et al. (1993) Chen W., Livio M., Gehrels N., 1993, ApJ, 408, L5
- Corral-Santana et al. (2016) Corral-Santana J. M., Casares J., Muñoz-Darias T., Bauer F. E., Martínez-Pais I. G., Russell D. M., 2016, A&A, 587, A61
- Court et al. (2017) Court J. M. C., Altamirano D., Pereyra M., Boon C. M., Yamaoka K., Belloni T., Wijnands R., Pahari M., 2017, MNRAS, 468, 4748
- Done et al. (2007) Done C., Gierliński M., Kubota A., 2007, A&ARv, 15, 1
- Dunn et al. (2010) Dunn R. J. H., Fender R. P., Körding E. G., Belloni T., Cabanac C., 2010, MNRAS, 403, 61
- Evans et al. (2007) Evans P. A., et al., 2007, A&A, 469, 379
- Gehrels et al. (2004) Gehrels N., et al., 2004, ApJ, 611, 1005
- Gendreau et al. (2012) Gendreau K. C., Arzoumanian Z., Okajima T., 2012, in Proc. SPIE. p. 844313, doi:10.1117/12.926396
- Hameury (2000) Hameury J.-M., 2000, New Astron. Rev., 44, 15
- Hameury et al. (2000) Hameury J.-M., Lasota J.-P., Warner B., 2000, A&A, 353, 244
- Heil et al. (2012) Heil L. M., Vaughan S., Uttley P., 2012, MNRAS, 422, 2620
- Heinke et al. (2010) Heinke C. O., et al., 2010, ApJ, 714, 894
- Homan et al. (2001) Homan J., Wijnands R., van der Klis M., Belloni T., van Paradijs J., Klein-Wolt M., Fender R., Méndez M., 2001, The Astrophysical Journal Supplement Series, 132, 377
- Homan et al. (2013) Homan J., Fridriksson J. K., Jonker P. G., Russell D. M., Gallo E., Kuulkers E., Rea N., Altamirano D., 2013, ApJ, 775, 9
- Huang et al. (2018) Huang Y., et al., 2018, ApJ, 866, 122
- Jiménez-Ibarra et al. (2019) Jiménez-Ibarra F., et al., 2019, MNRAS, 484, 2078
- Jonker et al. (2012) Jonker P. G., Miller-Jones J. C. A., Homan J., Tomsick J., Fender R. P., Kaaret P., Markoff S., Gallo E., 2012, MNRAS, 423, 3308
- Kara et al. (2019) Kara E., et al., 2019, Nature, 565, 198
- Karpouzas et al. (2020) Karpouzas K., Méndez M., Ribeiro E. r. M., Altamirano D., Blaes O., García F., 2020, MNRAS, 492, 1399
- Kennea et al. (2017) Kennea J. A., Evans P. A., Beardmore A. P., Krimm H. A., Romano P., Yamaoka K., Serino M., Negoro H., 2017, The Astronomer’s Telegram, 10700
- King & Ritter (1998) King A. R., Ritter H., 1998, MNRAS, 293, L42
- Kuulkers (1998) Kuulkers E., 1998, New Astron. Rev., 42, 1
- Kuulkers et al. (1996) Kuulkers E., Howell S. B., van Paradijs J., 1996, ApJ, 462, L87
- Lasota (2001) Lasota J.-P., 2001, New Astronomy Reviews, 45, 449
- Markwardt et al. (2017) Markwardt C. B., Burrows D. N., Cummings J. R., Kennea J. A., Marshall F. E., Page K. L., Palmer D. M., Siegel M. H., 2017, GRB Coordinates Network, Circular Service, No. 21788, #1 (2017), 21788
- Matsuoka & Asai (2013) Matsuoka M., Asai K., 2013, PASJ, 65, 26
- Méndez & van der Klis (1997) Méndez M., van der Klis M., 1997, ApJ, 479, 926
- Mereminskiy et al. (2018) Mereminskiy I. A., Grebenev S. A., Prosvetov A. V., Semena A. N., 2018, Astronomy Letters, 44, 378
- Merloni & Fabian (2001) Merloni A., Fabian A. C., 2001, MNRAS, 321, 549
- Meyer & Meyer-Hofmeister (2015) Meyer F., Meyer-Hofmeister E., 2015, PASJ, 67, 52
- Migliari et al. (2005) Migliari S., Fender R. P., van der Klis M., 2005, MNRAS, 363, 112
- Motta et al. (2011) Motta S., Muñoz-Darias T., Casella P., Belloni T., Homan J., 2011, MNRAS, 418, 2292
- Motta et al. (2012) Motta S., Homan J., Muñoz Darias T., Casella P., Belloni T. M., Hiemstra B., Méndez M., 2012, MNRAS, 427, 595
- Muñoz-Darias et al. (2011) Muñoz-Darias T., Motta S., Belloni T. M., 2011, MNRAS, 410, 679
- Muñoz-Darias et al. (2014) Muñoz-Darias T., Fender R. P., Motta S. E., Belloni T. M., 2014, MNRAS, 443, 3270
- Nakahira et al. (2018) Nakahira S., et al., 2018, PASJ, 70, 95
- Negoro et al. (2017a) Negoro H., et al., 2017a, The Astronomer’s Telegram, 10699
- Negoro et al. (2017b) Negoro H., et al., 2017b, The Astronomer’s Telegram, 10708, 1
- Negoro et al. (2019) Negoro H., et al., 2019, The Astronomer’s Telegram, 12838, 1
- Osaki & Meyer (2003) Osaki Y., Meyer F., 2003, A&A, 401, 325
- Osaki & Meyer (2004) Osaki Y., Meyer F., 2004, A&A, 428, L17
- Parikh et al. (2018) Parikh A. S., Russell T. D., Wijnands R., Bahramain A., Miller-Jones J. C. A., Tetarenko A. J., Sivakoff G. R., 2018, The Astronomer’s Telegram, 11652, 1
- Parikh et al. (2019a) Parikh A. S., Russell T. D., Wijnands R., Miller-Jones J. C. A., Sivakoff G. R., Tetarenko A. J., 2019a, The Astrophysical Journal, 878, L28
- Parikh et al. (2019b) Parikh A. S., Wijnands R., Russell T. D., 2019b, The Astronomer’s Telegram, 12780, 1
- Patruno et al. (2009) Patruno A., Watts A., Klein Wolt M., Wijnand s R., van der Klis M., 2009, ApJ, 707, 1296
- Patruno et al. (2016) Patruno A., Maitra D., Curran P. A., D’Angelo C., Fridriksson J. K., Russell D. M., Middleton M., Wijnands R., 2016, ApJ, 817, 100
- Pirbhoy et al. (2020) Pirbhoy S. F., Baglio M. C., Russell D. M., Bramich D. M., Saikia P., Yazeedi A. A., Lewis F., 2020, The Astronomer’s Telegram, 13451, 1
- Remillard & McClintock (2006) Remillard R. A., McClintock J. E., 2006, ARA&A, 44, 49
- Russell et al. (2017) Russell T. D., Miller-Jones J. C. A., Sivakoff G. R., Tetarenko A. J., Jacpot Xrb Collaboration 2017, The Astronomer’s Telegram, 10711
- Russell et al. (2018) Russell T. D., Altamirano S. R. D., Miller-Jones J. C. A., Plotkin R., Tetarenko A. J., Sivakoff G. R., JACPOT XRB Collaboration 2018, The Astronomer’s Telegram, 11611, 1
- Russell et al. (2019a) Russell T. D., et al., 2019a, ApJ, 883, 198
- Russell et al. (2019b) Russell D. M., Al Yazeedi A., Bramich D. M., Baglio M. C., Lewis F., 2019b, The Astronomer’s Telegram, 12829, 1
- Shahbaz et al. (1998) Shahbaz T., Charles P. A., King A. R., 1998, MNRAS, 301, 382
- Shakura & Sunyaev (1973) Shakura N. I., Sunyaev R. A., 1973, A&A, 500, 33
- Shang et al. (2019) Shang J. R., Debnath D., Chatterjee D., Jana A., Chakrabarti S. K., Chang H. K., Yap Y. X., Chiu C. L., 2019, ApJ, 875, 4
- Shaw et al. (2016) Shaw A. W., et al., 2016, MNRAS, 458, 1636
- Shidatsu et al. (2017) Shidatsu M., et al., 2017, The Astronomer’s Telegram, 11020, 1
- Shimomukai et al. (2020) Shimomukai R., et al., 2020, The Astronomer’s Telegram, 13459, 1
- Sreehari et al. (2019) Sreehari H., Ravishankar B. T., Iyer N., Agrawal V. K., Katoch T. B., Mandal S., Nand i A., 2019, MNRAS, 487, 928
- Sridhar et al. (2019) Sridhar N., Bhattacharyya S., Chandra S., Antia H. M., 2019, MNRAS, 487, 4221
- Sridhar et al. (2020) Sridhar N., García J. A., Steiner J. F., Connors R. M. T., Grinberg V., Harrison F. A., 2020, ApJ, 890, 53
- Stevens et al. (2018) Stevens A. L., et al., 2018, ApJ, 865, L15
- Stiele & Kong (2018) Stiele H., Kong A. K. H., 2018, ApJ, 868, 71
- Tang et al. (2011) Tang J., Yu W.-F., Yan Z., 2011, Research in Astronomy and Astrophysics, 11, 434
- Tao et al. (2018) Tao L., et al., 2018, MNRAS, 480, 4443
- Terada et al. (2002) Terada K., Kitamoto S., Negoro H., Iga S., 2002, PASJ, 54, 609
- Tetarenko et al. (2016) Tetarenko B. E., Sivakoff G. R., Heinke C. O., Gladstone J. C., 2016, ApJS, 222, 15
- Tomsick et al. (2003) Tomsick J. A., Kalemci E., Corbel S., Kaaret P., 2003, ApJ, 592, 1100
- Tomsick et al. (2004) Tomsick J. A., Kalemci E., Kaaret P., 2004, ApJ, 601, 439
- Tomsick et al. (2014) Tomsick J. A., Yamaoka K., Corbel S., Kalemci E., Migliari S., Kaaret P., 2014, ApJ, 791, 70
- Verner et al. (1996) Verner D. A., Ferland G. J., Korista K. T., Yakovlev D. G., 1996, ApJ, 465, 487
- Wijnands et al. (2001) Wijnands R., Méndez M., Markwardt C., van der Klis M., Chakrabarty D., Morgan E., 2001, ApJ, 560, 892
- Wilms et al. (2000) Wilms J., Allen A., McCray R., 2000, ApJ, 542, 914
- Xu et al. (2017) Xu Y., et al., 2017, ApJ, 851, 103
- Yan & Yu (2017) Yan Z., Yu W., 2017, MNRAS, 470, 4298
- Yan et al. (2020) Yan Z., Xie F.-G., Zhang W., 2020, ApJ, 889, L18
- Yazeedi et al. (2019) Yazeedi A. A., Russell D. M., Lewis F., Baglio M. C., Bramich D. M., Saikia P., 2019, The Astronomer’s Telegram, 13188, 1
- Yu et al. (2004) Yu W., van der Klis M., Fender R., 2004, ApJ, 611, L121
- Zdziarski et al. (1996) Zdziarski A. A., Johnson W. N., Magdziarz P., 1996, MNRAS, 283, 193
- Zdziarski et al. (1998) Zdziarski A. A., Poutanen J., Mikolajewska J., Gierlinski M., Ebisawa K., Johnson W. N., 1998, MNRAS, 301, 435
- Zhang et al. (2019) Zhang G. B., et al., 2019, ApJ, 876, 5
- Zhang et al. (2020a) Zhang L., et al., 2020a, MNRAS, 494, 1375
- Zhang et al. (2020b) Zhang L., et al., 2020b, The Astronomer’s Telegram, 13465, 1
- Zurita et al. (2002) Zurita C., et al., 2002, MNRAS, 334, 999
- Życki et al. (1999) Życki P. T., Done C., Smith D. A., 1999, MNRAS, 309, 561
- Šimon (2010) Šimon V., 2010, A&A, 513, A71
- van den Eijnden et al. (2019) van den Eijnden J., Degenaar N., Russell T. D., Hernández Santisteban J. V., Wijnands R., Miller-Jones J. C. A., Rouco Escorial A., Sivakoff G. R., 2019, MNRAS, 483, 4628
- van der Klis et al. (2000) van der Klis M., Chakrabarty D., Lee J. C., Morgan E. H., Wijnands R., Markwardt C. B., Swank J. H., 2000, IAU Circ., 7358, 3