A quantitatively consistent, scale-spanning model for same-material tribocharging
Abstract
We propose a quantitative, scale-spanning model for same-material tribocharging. Our key insight is to account for mesoscale spatial correlations in donor/acceptor surface properties, which dramatically affect the macroscopic charge transfer and quantitatively reconcile previous inconsistencies related to the microscale. We furthermore identify a viable mechanism by which the mesoscale features emerge, which may help constrain the list of donor/acceptor candidates. As the only free-parameters in our model involve the atomic scale, data analyzed in light of it could help resolve the detailed mechanism of tribocharging.
Tribocharging, i.e. charge transfer between materials during contact Lacks:2019dx , plays a critical role in natural phenomena Wurm:2019 ; Schrader:2018eh ; Steinpilz:2020iy ; Desch:2000 ; Berdeklis:2001ta , industrial processes Baytekin:2013dq ; Abbasi:2007cv , and energy harvesting devices Kanik:2014bn ; Musa:2018uy ; Wang:2013bq , yet resists interpretation. One fundamental roadblock has been the inability to identify the atomic-scale mechanism, and in particular the charge carriers, i.e. ions vs. electrons Lacks:2019dx . An equally important roadblock is the lack of quantitative agreement (or even comparison) between experiments and theory. Experimentally, issues such as the difficulty of measuring contact areas render much data qualitative (e.g. the sign or scale of charging) Hu:2012jf ; Waitukaitis:2013fwa ; Waitukaitis:2014cg ; Collins:2018 ; Lee:2018gg ; Harris:2019 . Theoretical advances are stymied by the multi-scale nature of the effect, where one must simultaneously account for probabilistic effects at the atomic scale (1 nm), unexplained emergent features at the mesoscale (1 µm), and then through these explain the familiar behavior of the macroscale (1 mm). These challenges have perhaps led to a general disinterest in quantitative reconciliation, with some authors characterizing the outlook on achieving a scale-spanning description as ‘impossible’ Lacks:2011hm .
Same-material tribocharging, where charge is exchanged between identical materials, is perhaps the most puzzling manifestation of the phenomenon. It has been attributed to trapped electrons Lowell:2000jk ; Lowell:2000bl ; Lacks:2007ge ; Lacks:2008hz ; Duff:2008 ; Forward:2009in ; Lacks:2016 , induced polarization Shinbrot:2017 ; Siu:2014 ; Kolehmainen:2018 ; Yoshimatsu:2016 ; Yoshimatsu:2016b , or mechanochemistry Sow:2012 ; Sow:2012b ; Sow:2013 ; Baytekin:2013dq . Yet, experiments on same-material tribocharging have produced some valuable clues. Using soft (Young’s modulus 1 MPa), atomically smooth (roughness nm) polymers to achieve conformal contact, Apodaca et al. found that the magnitude of charge transfer grows with the square root of the contacting area Apodaca:2009dr . They proposed that the surface consists of equally-sized, randomly-assigned donor/acceptor sites (Fig. 1a), each capable of giving/receiving one unit charge. This allowed them to recover , where the prefactor, depends on the length scale of a single site, . Though should be on the scale of one atom, fits to their model required a value of 0.005 Å—more than 100 times smaller than the Bohr radius of hydrogen. Thus, while their idea is compelling, this discrepancy suggested it is still somehow a ‘toy model.’
Nonetheless, features suggestive of their idea have been observed, but at significantly larger scales. Using Kelvin Force Probe Microscopy on the same polymers, Baytekin et al. found ‘mosaics’—regions of positive/negative charge after contact—that were spatially correlated over length scales up to 450 nm Baytekin:2011bx . This observation raises fundamental questions: How can the impossibly small scales implied by Apodaca be connected to the mesoscopic ones seen by Baytekin? What would the introduction of an intermediate scale change in Apodaca’s model? And why do the intermediate scale correlations emerge in the first place? In this work, we use analysis supported by numerical simulations to investigate the multi-scale aspects of same-material tribocharging. Our key development is to properly account for the mesoscale spatial correlations, which allows us to quantitatively resolve the discrepancies in the Apodaca framework and produce a scale-spanning model.
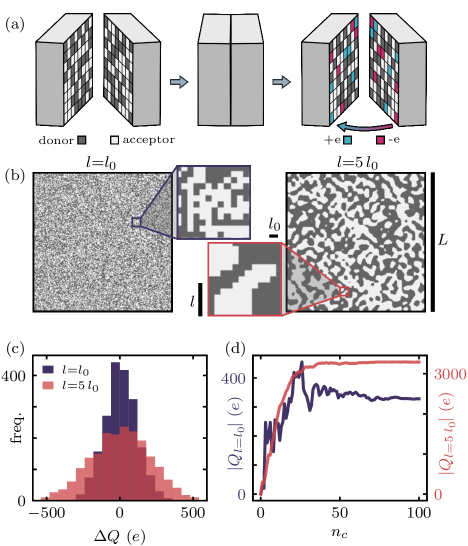
We start by explaining a first set of numerical simulations, where we mimic charge transfer between ‘synthetic’ surfaces (in contrast to physically derived surfaces later) by creating two -element matrices involving three length scales: , , and . The smallest, , corresponds to the elementary donors/acceptors of the atomic scale, and is represented by a single matrix element. The largest, , corresponds to the macroscopic system size. We assume that there is a single intermediate scale, , that characterizes the mesoscopic correlations observed by Baytekin. (Note they measured charge, but this implies donor/acceptor correlations.) Each matrix element is assigned as donor or acceptor, with probabilities and , respectively. We account for correlations in assignments via thresholding a random scalar field (see Supplemental Material Sup ). To perform a ‘contact’, we first generate a ‘left’ and ‘right’ surface from identical input length scales and probabilities (Fig. 1a). Charge transfer of one unit, , between matrix elements [i,j] occurs if (1) [i,j] on the left/right is a donor, (2) [i,j] on the right/left is an acceptor, (3) the value of an independent random uniform variable is less than the transfer probability, , and (4) for sequential contacts, transfer at [i,j] hasn’t yet occurred. The net charge transferred is the difference between left-to-right (‘right’) and right-to-left (‘left’) transfers.
Figure 1b shows two representative surfaces, one with and the second . Although their only difference involves the length scale, , we see stark changes in the charging behavior. In Fig. 1c, we plot distributions of the charge transferred in the first contact, , for 1000 pair-instances. As we do not assume any post-contact discharge Haberle:2019 , both distributions are Gaussian and centered at zero, but while produces a width of 100 , the width is 200 . Correlations also change the behavior during sequential contacts. Fig. 1d shows two examples of the accumulated charge, , vs. the number of contacts, . Like the initial transfer, the final charge, , is typically larger when . Additionally, the fluctuations are on the order of when , but are hardly discernible when the (consistent with experiments Apodaca:2009dr ).
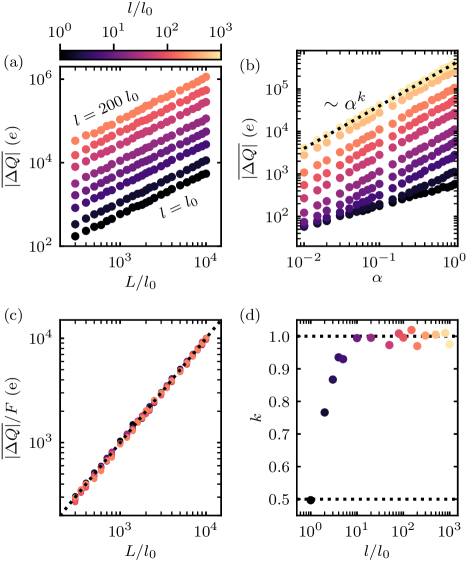
We now examine the first contact behavior of these simulations in detail. Figure 2a shows the average absolute value of charge exchanged, , for increasing system size and several values of . The scaling is recovered in all cases, but the prefactor steadily increases with . Figure 2b shows that the dependence on the transfer probability, , exhibits unexpected non-linear behavior as a function of the correlation length, . At every value of , we see a trend consistent with a power law, i.e. . However, the exponent, , increases with , starting at for and saturating at for (Fig. 2d).
To analytically explain these observations, we first consider the case , here sketching our argument (details are in the Supplemental Material Sup ). We momentarily focus on right transfers, which occur with compound probability . Absent correlations, all sites [] are independent, hence the total right charge transfer is Gaussian with mean and width . A similar distribution exists for left transfer, but technically only when considered independently—simultaneous left/right transfer cannot occur. Nonetheless, the probability for this is small, and we therefore approximate the left/right distributions as independent. The net transfer, , is thus also Gaussian distributed, with zero mean and width . Neglecting terms like and considering Sup , we find
| (1) |
This recovers the scaling, but points to a slight mistake in the earlier work Apodaca:2009dr in that the -dependence is square root rather than linear—exactly as our simulations in Fig. 2d. In the Supplemental Material Sup , we verify that Eq. 1 collapses our simulated data for wide ranges of and .
Next we consider the case (again with details in the Supplemental Material Sup ). This fundamentally alters the argument above as the site identities exhibit spatial correlations. To handle this, we first imagine rescaling the system by , leading to surfaces with larger ‘patches’, each consisting of many sites. Identities of entire patches still occur with probabilities and . Next, we rescale back to deal with transfers, which still occur independently for each site. During contact, regions of donors face acceptors with the characteristic size of a patch. If the number of sites in these regions () is large, the mean transfer per patch () effectively hides the fluctuations ()—hence we treat as a rate. Thus, when we have
| (2) |
Here, like in the Apodaca work, the -dependence is linear. The critical difference, however, is the dependence on the intermediate length scale, which amplifies the charge transfer by the factor, . We confirm this with our simulated data in Fig. 2c, where the prefactor collapses when . Qualitatively, the explanation for this amplification is that the variability (i.e. standard deviation) in the number of donors/acceptors on a surface increases with the scale of spatial correlations. One can quickly grasp why by considering the extreme case , where each surface is either purely donor or acceptor, and consequently . This highlights that same- and different-material tribocharging are two manifestations of a similar underlying phenomenon, only appearing different depending on the scale at which one looks.
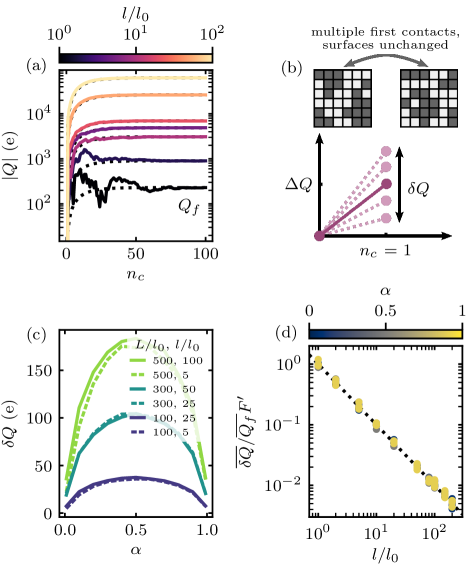
We now turn to sequential contacts. As the simulation results of Fig. 3a show, repeated contacts with the same surfaces leads to curves in accumulated charge, vs. , that level off at some value, . In the Supplemental Material, we show that the underlying trend is given by a saturated exponential, i.e.,
| (3) |
Figure 3a also illustrates the presence of fluctuations on approach to . For large , these aren’t noticeable, but for small they are overwhelming, and cannot be suppressed even when we increase the system size, . We quantify their scale by repeatedly performing first contacts between individual surface pairs (‘resetting’ each time) and measuring the standard deviation, (Fig. 3b). In Fig. 3c we show for a few pairs, which reveals that the fluctuations grow with the macroscale length, , and depend strongly on , but are independent of the mesoscale, . To analyze why, we note that a particular pair has a fixed donor/acceptor arrangement, which means arises solely from . Denoting the number of donors on the left/right that face acceptors on the right/left as , one finds that . In the Supplemental Material Sup , we justify using the averages to find the ensemble expression,
| (4) |
This establishes that the fluctuations, like , grow linearly with , but unlike are independent of . Consequently, they cannot be suppressed by increasing system size, but can be suppressed by the introduction of the intermediate scale, . In Fig. 3d, we collapse the simulated data to our predicted line with the appropriate rescaling.
The last question we posed remains: Why do the intermediate scale correlations emerge in the first place? A few mechanisms have been proposed. For example, with inelastically deformed materials it has been shown that micron-sized voids form, which are somewhat suggestive of mosaics Wang:2017 . Other authors make connections to ‘islands’ of adsorbed surface water, but the sizes of these has not been measured nor compared to the charge mosaics Xie:2016gr ; Yu:2017 ; Lee:2018gg ; Harris:2019 ; Haberle:2019 . In the case of void formation, the process for a growing lenghtscale is clear—the materials are ripped apart—yet the polymers used by Apodaca/Baytekin are highly elastic and not intentionally stretched. In the case of water islands, and indeed virtually all ‘patch’-type models, one must assume features of a certain size exist, but how that length scale emerges is still unclear.
We propose that a nucleation process which energetically favors neighboring donors (or equivalently, neighboring acceptors) is a viable candidate. We support this by developing a second, distinct set of simulations to mimic the physics of surface formation, which are time-dependent and latticed-based, and which again produce donor/acceptor matrices. At each time step, we assume a donor site can transition into an acceptor site, and vice-versa. This could represent widely suspected mechanisms such as adsorption of an ambient donor species (i.e. H2O), but also novel ideas such as phase separation during polymer curing. The transition probabilities of a given site depend on its neighbors i.e.,
| (5) | ||||
where is the number of neighbors that are donors (i.e. ). The exponential form is motivated from an Arrhenius-like process where each neighbor modifies a local energy barrier by . Such as process could equally represent interactions between individual atoms or in a continuous medium Brune:1998 ; Varanasi:2009 ; Lu:2018 . Full details can be found in the Supplemental Material Sup .
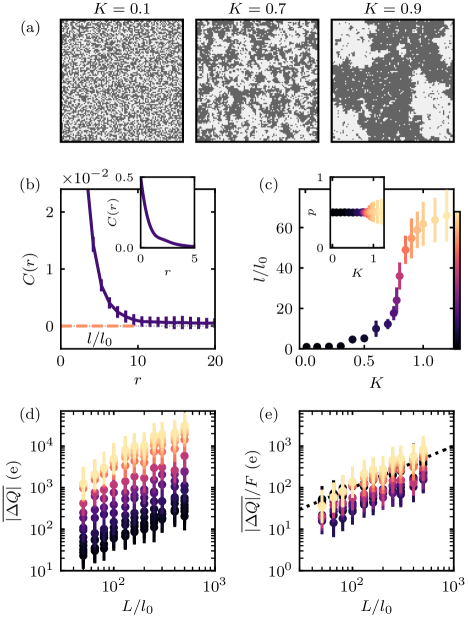
Starting with an initial arrangement, a surface evolves until it reaches a dynamic equilibrium set by the parameters in Eq. 5 (for a movie, see the Supplemental Material Sup ). Three examples for different are shown in Fig. 4a . To characterize these surfaces in the context of our analysis, we measure and . Determining is trivial. To get we start by calculating the correlation function,
| (6) |
where is the site identity at a position , is the distance from the point , and averages denoted by are over all sites separated by . Figure 4b shows an example of for a particular surface. We use the first zero crossing (within the standard deviation of ) to define the correlation length, , as it corresponds to the typical distance before having an equal probability of switching from donor to acceptor (or vice versa). In the Supplemental Material, we show that this identically recovers the input correlation lengths in of our other set of simulations Sup . In Figure 4c, we show how sweeping through the parameter ( fixed) allows us to explore nearly two orders of magnitude in (with ).
After they have reached a dynamic equilibrium, we freeze these surfaces and then use them as input for contact experiments, with the same transfer rules as before. We generate 20 surfaces for various combinations of correlation length and system size , and calculate for every permutation (Fig. 4d). The effect of spatial correlations in this physically-derived system is the same as with the synthetic surfaces, i.e. the magnitude of transfer increases with the correlation length. Figure 4e presents the results rescaled using Eq. 2, which largely collapses them onto a single line with the predicted unity slope. In the Supplemental Material Sup , we show that the deviation for intermediate is due a broader ‘spectrum’ of length scales for than in our synthetic simulations.
Based on widely held assumptions and consideration of existing experiments, we have developed a quantitative, scale-spanning model for same-material tribocharging. We have shown that the intermediate scale corresponding to donor/acceptor spatial correlations, , plays a crucial role, amplifying the amount of charge transferred in a single contact, and suppressing otherwise overwhelming fluctuations in sequential contacts. We have furthermore introduced a candidate mechanism for how the intermediate length scale emerges, which is based on the energetics of donor/acceptor interactions during the formation process. Our results allow us to quantitatively resolve the inconsistency encountered by Apodaca Apodaca:2009dr : using our analysis with their data and Baytekin’s correlation length Baytekin:2011bx , we infer an elementary site size Å—precisely on the atomic scale Sup . Furthermore, our work has implications regarding the carrier and mechanism. By elevating the Apodaca framework from a ‘toy model’ to a ‘quantitative model,’ we propose that confident extractions of from experimental data can be made, giving information directly related to underlying atomic-scale mechanism Kok:2009gn . Although our model is restricted to surfaces where the macroscopic contact area is known, these considerations become even more important in systems where roughness or stiffness play a role.
This project has received funding from the European Union’s Horizon 2020 research and innovation programme under the Marie Skłodowska-Curie Grant Agreement No. 754411.
References
- (1) D.J. Lacks and T. Shinbrot, Nat. Rev. Chem. 3, 465-476 (2019).
- (2) T. Steinpilz, K. Joeris, F. Jungmann, D. Wolf, L. Brendel, J. Teiser, T. Shinbrot and G. Wurm, Nat. Phys. 16, 225-229 (2020).
- (3) S.J. Desch and J.N. Cuzzi, Icarus 143, 87-105 (2000).
- (4) G. Wurm, L. Schmidt, T. Steinpilz, L. Boden and J. Teiser, Icarus 331, 103-109 (2019).
- (5) D.L. Schrader, K. Nagashima, S.R. Waitukaitis, J. Davidson, T.J. McCoy, H.C. Connolly Jr., and D.S. Lauretta, Geochim. Cosmochim. Ac. 223, 405-421 (2018).
- (6) P. Berdeklis and R. List, J. Am. Met. So. 58, 2751-2770 (2001).
- (7) H.T. Baytekin, B. Baytekin, T.M. Hermans, B. Kowalczyk and B.A. Grzybowski, Science 341, 1368-1371 (2013).
- (8) T. Abbasi and S.A. Abbasi, J. Hazard. Mat. 140 7-44 (2007).
- (9) M. Kanik, O. Aktas, H.S. Sen, E. Durgun and M. Bayindir, ACS Nano 8, 9311-9323 (2014).
- (10) U.G. Musa, S.D. Cezan, B. Baytekin and H.T. Baytekin, Sci. Rep. 8, 2472 (2018).
- (11) Z.L. Wang, ACS Nano 7 9533-9557 (2013).
- (12) W. Hu, L. Xie and X. Zheng, Appl. Phys. Lett. 101, 114107 (2012).
- (13) S.R. Waitukaitis and H.M. Jaeger, Rev. Sci. Instrum. 84, 025104 (2013).
- (14) S.R. Waitukaitis, V. Lee, J.M. Pierson, S.L. Forman and H.M. Jaeger, Phys. Rev. Lett. 112, 218001 (2014).
- (15) A. L. Collins, C. G. Camara, E. V. Van Cleve and S. J. Putterman, Rev. Sci. Instrum. 89, 013901 (2018).
- (16) V. Lee, N.M. James, S.R. Waitukaitis and H.M. Jaeger, Phys. Rev. Mat. 2, 035602 (2018).
- (17) I.A. Harris, M.X. Lim and H.M. Jaeger, Phys. Rev. Mat. 3, 085603 (2019).
- (18) D.J. Lacks and M.R. Sankaran, J. Phys. D: Appl. Phys. 44, 453001 (2011).
- (19) J. Lowell and W.S. Truscott, J. Phys. D: Appl. Phys. 19, 1273-1280 (1986).
- (20) K.M. Forward, D.J. Lacks and R.M. Sankaran, Geophys. Res. Lett. 36, L13201 (2009).
- (21) J. Lowell and W. S. Truscott, J. Phys. D: Appl. Phys. 19, 1281 (1986).
- (22) D. J. Lacks, N. Duff and S. K. Kumar, Phys. Rev. Lett. 100, 188305 (2008).
- (23) D. J. Lacks and A. Levandovsky, J. Electrostat. 65, 107-112 (2007).
- (24) N. Duff and D.J. Lacks, J. Electrostat. 66, 51-57 (2008).
- (25) D.J. Lacks and R.M. Sankaran, Particul. Sci. Technol. 34, 55-62 (2016).
- (26) T. Shinbrot, M. Rutala and H. Herrmann, Phys. Rev. E 96, 032912 (2017).
- (27) T. Siu, J. Cotton, G. Mattson and T. Shinbrot, Phys. Rev. E 89, 052208 (2014).
- (28) J. Kolehmainen, A. Ozel, Y. Gu, T. Shinbrot and S. Sundaresan, Phys. Rev. Lett. 121, 124503 (2018).
- (29) R. Yoshimatsu, N.A.M. Araújo, G. Wurm, H.J. Herrmann and T Shinbrot, Sci. Rep. 7, 39996 (2016).
- (30) R. Yoshimatsu, N.A.M. Araújo, T. Shinbrot and H.J. Herrmann, Soft Mat. 12, 6261–6267 (2016).
- (31) M. Sow, D.J. Lacks and M.R. Sankaran, J. Appl. Phys. 112, 084909 (2012).
- (32) M. Sow, R. Widenor, A. Kumar, S.W. Lee, D.J. Lacks and R.M. Sankaran, Angew. Chem. Int. Ed. 51, 2695 (2012).
- (33) M. Sow, D.J. Lacks and R.M. Sankaran, J. Electrostat. 71, 396–399 (2013).
- (34) M.M. Apodaca, P.J. Wesson, K.J.M. Bishop, M.A. Ratner and B.A. Grzybowski, Angew. Chem. Int. Ed. 49, 946-949 (2009).
- (35) H. T. Baytekin, A. Z. Patashinski, M. Branicki, B. Baytekin, S. Soh and B. A. Grzybowski, Science 333, 308-312 (2011).
- (36) See Supplemental Material at [URL will be inserted by publisher] for additional details.
- (37) J. Haeberle, A. Schella, M. Sperl, M. Schröter and P. Born, Soft Matter 14, 4987-4995 (2019).
- (38) A. E. Wang, P. S. Gil, M. Holonga, Z. Yavuz, H. T. Baytekin, R. M. Sankaran and D. J .Lacks, Phys. Rev. Mater. 1, 035605 (2017).
- (39) L. Xie, N. Bao, Y. Jiang and J. Zhou, AIP Adv. 6, 035117 (2016).
- (40) H. Yu, L. Mu and L. Xie, J. Electrostat. 90, 113-122 (2017).
- (41) H. Brune, Surf. Sci. Rep. 31, 121-229 (1998).
- (42) K. K. Varanasi, M. Hsu, N. Bhate, W. Yang and T. Deng, Appl. Phys. Lett. 95, 094101 (2009).
- (43) B. Lü, G. A. Almyras, V. Gervilla, J. E. Greene and K. Sarakinos, Phys. Rev. Mater. 2, 063401 (2018).
- (44) J.F. Kok and D.J. Lacks, Phys. Rev. E 79, 051304 (2009).