Shaping the envelope of the asymptotic giant branch star W43A with a collimated fast jet
Abstract
One of the major puzzles in the study of stellar evolution is the formation process of bipolar and multi-polar planetary nebulae. There is growing consensus that collimated jets create cavities with dense walls in the slowly-expanding (10–20 km s-1) envelope ejected in previous evolutionary phases, leading to the observed morphologies. However, the launching of the jet and the way it interacts with the circumstellar material to create such asymmetric morphologies have remained poorly known. Here we present for the first time CO emission from the asymptotic giant branch star W43A that traces the whole stream of a jet, from the vicinity of its driving stellar system out to the regions where it shapes the circumstellar envelope. We found that the jet has a launch velocity of 175 km s-1 and decelerates to a velocity of 130 km s-1 as it interacts with circumstellar material. The continuum emission reveals a bipolar shell with a compact bright dot in the centre that pinpoints the location of the driving source of the jet. The kinematical ages of the jet and the bipolar shell are equal, 60 years, indicating that they were created simultaneously, probably by a common underlying mechanism, and in an extremely short time. These results provide key initial conditions for the theoretical models that aim to explain the formation of bipolar morphologies in the circumstellar envelopes of low and intermediate mass stars.
1 Introduction
In the past couple of decades there has been mounting observational evidence that, after the Asymptotic Giant Branch (AGB) phase, low and intermediate-mass () stars develop powerful highly collimated outflows that have a strong impact on the circumstellar envelope (CSE) that forms in previous mass-loss episodes. One important effect of the activity of such collimated outflows is sculpting and modifying the shape of the roughly spherical CSE (e.g. Sahai & Trauger 1998). According to the increasingly popular model proposed by Sahai & Trauger (1998) to explain the formation of asymmetric planetary nebulae, the fast collimated outflows carve cavities within the spherical CSE that are eventually seen as bright lobes and bubble-like morphologies in the subsequent planetary nebula phase, when the star becomes hot enough to ionize the CSE. This process occurs in a very short time-scale (1000 yr), during which the star becomes enshrouded by gas and dust that render it invisible at optical wavelengths. As a result, it is difficult to find objects undergoing this ephemeral phase. Nonetheless, there is a particular group, containing 15 known sources in our Galaxy, of oxygen-rich post-AGB objects that exhibit high-velocity H2O masers (vexp100 km s-1) tracing collimated structures and/or bow-shocks (Imai 2007). These objects are called water fountains (WF) and they are thought to be undergoing the earliest manifestation of collimated mass-loss after the AGB phase (Likkel & Morris 1988). Thus, the study of WF is of great importance to understand the evolution of low and intermediate-mass stars since they hold key information to understand the launching and collimation of jets in the late phases of these sources, as well as their interaction with the CSE.
W43A, located at a distance of 2.2 kpc from the Sun (see Appendix A), is surrounded by a thick dusty envelope that renders it invisible at optical and near-infrared (IR) wavelengths (Wilson & Barrett 1972). The mid-IR images reveal an elongated structure (1216) oriented along a position angle (P.A.) 62∘ (Lagadec et al. 2011). The presence of hydroxyl (OH) masers with a periodic variability and the silicon monoxide (SiO) maser emission strongly suggest that W43A hosts an AGB star (Herman & Habing 1985; Imai et al. 2005). Furthermore, the bipolar distribution of the SiO masers and the discovery of highly collimated water (H2O) maser structures indicate that this source is undergoing the ephemeral transition in which the spherical CSE formed during the AGB phase develops a bipolar morphology (Diamond & Nyman 1988; Imai et al. 2002; 2005; Vlemmings et al. 2006; Amiri et al. 2010; Chong et al. 2015). The H2O masers exhibit expansion velocities (150 km s-1) much higher than that of the 1612 MHz OH masers (8 km s-1), which gives W43A the classification of a water fountain source (Likkel & Morris 1988; Imai et al. 2002). The H2O masers were originally found to be located mainly in two linear structures separated by 06 on the plane of the sky, which corresponds to a de-projected separation of 1600 AU considering an inclination angle with respect to the plane of the sky of 35∘ (Imai et al. 2002; Chong et al. 2015). The highly collimated motions and distribution of the H2O masers suggested the presence of a jet with a kinematical age of only 50 yr (Imai et al. 2002; 2005). In addition, a magnetic field of 20075 mG was measured via the Zeeman effect of the H2O masers (Vlemmings et al. 2006). Thus, it has been thought that the H2O masers trace the regions where a magnetically collimated jet interacts with the CSE, creating low-density cavities that will lead to the formation of an asymmetric planetary nebula when the central star becomes hot enough to ionise the surrounding gas (Imai et al. 2002; Vlemmings et al. 2006). However, since the H2O masers do not trace the jet in its entirety, the true extent of the jet, collimation mechanism, as well as the way it interacts with the ambient material have remained unclear (Chong et al. 2015).
2 Observations
We used the Atacama Large Millimeter/submillimetre Array (ALMA) to observe with high-angular-resolution (0040=90 AU) the emission from the dust and molecular gas around W43A. The observations were carried out on 22 September 2017 using 42 antennas of the ALMA 12m array with Band 6 receivers (230 GHz) as part of the project 2016.1.00540.S (P.I. H. Imai). The maximum and minimum baseline lengths were 12.1 km and 41.4 m, respectively. The corresponding angular resolution and maximum recoverable scale are 004 and 06, respectively. The field of view of the observations was approximately 25′′. The total time of observation on W43A was 23 min. The data were calibrated with the ALMA pipeline using J19242914 (3.4 Jy) as a flux/bandpass calibrator and J1851+0035 (260 mJy) as a gain calibrator. Images were created with CASA 5.4.0 using a Briggs weighting scheme with the robust parameter set to 0. The continuum emission was subtracted from the data cubes and channel maps with a spectral resolution of 1.3 km s-1 were created. The typical channel root-mean-square (rms) noise level is 2 mJy beam-1 in line-free channels. Among the detected spectral lines, the emission of the CO(=21) and -H2S(=220211) lines was used for the analysis presented in this work. The continuum image was created by averaging line-free channels from three 234.375 MHz wide spectral windows giving a total bandwidth of 0.7 GHz. The central frequencies of the spectral windows used for creating the continuum are 230.282 GHz, 230.930 GHz and 231.866 GHz, respectively. The rms level in the continuum image is 110 Jy beam-1.
3 Results and Discussion
3.1 CO emission
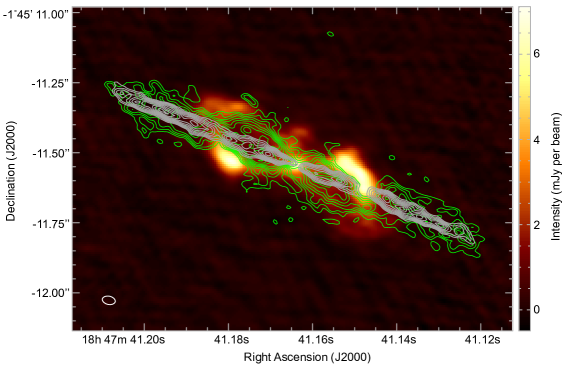
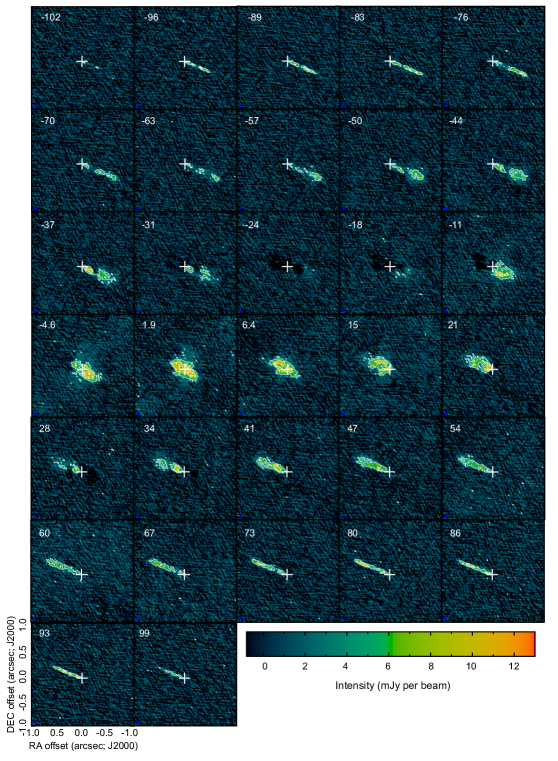
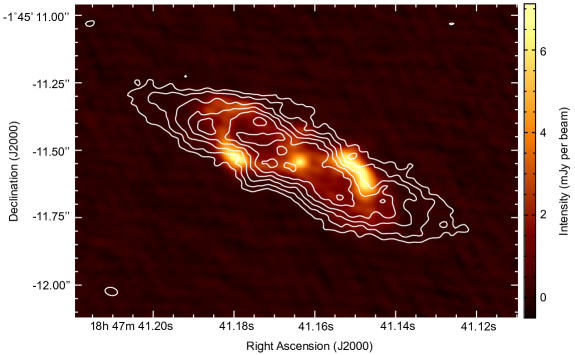
The CO(=21) emission spans a total velocity range of 200 km s-1 and is distributed over an elongated region (de-projected size 3003500 AU) whose major axis has a P.A.68∘ (see Figures 1 and 4). From the channel map shown in Figure 4 it can be seen that the emission with the highest velocity-offset111The velocity-offset, offset, is defined with respect to the systemic velocity of W43A, =34 km s-1, and corresponds to only the line-of-sight velocity component., offset(km s-1)100 (see also Figure 2), is the most collimated and lies closest to the star. For velocity-offsets 75offset(km s-1)100, the emission exhibits a high degree of collimation and it reaches locations farther away from the star than for the highest velocity offsets, i.e. it exhibits a negative velocity gradient, dv/dr0. Furthermore, for velocity-offsets 0offset(km s-1)75 the emission is less collimated and the velocity gradient inverts, i.e. the emission reaches locations farther away from the star with increasing velocity offset.
Thus, the CO(=21) emission can be divided into two components characterised by their spatial distributions and velocity gradient. The component with negative velocity gradient has the highest velocity-offsets 75offset(km s-1)100 and it exhibits an extremely collimated morphology all the way from the vicinity of the central star (90 AU) out to a de-projected distance of 1600 AU. The negative velocity gradient may indicate a deceleration of the emitting material as it moves away from the central system. This component is shown with grey contours in Figure 1. The other component has lower velocity-offsets 0offset(km s-1)75 and is less collimated, albeit it has a bipolar morphology and is distributed around the high-velocity component, which is shown with green contours in Figure 1. The positive velocity gradient in this component may indicate entrainment of the circumstellar material by a fast jet. The criteria to distinguish these kinematical components is further explained in §3.3.
3.2 Continuum emission
The continuum emission traces a bipolar shell (colour map in Figure 1; see also Figure 3) that confines parts of the low-velocity CO(=21) emission. The bipolar shell has a typical deconvolved width of 130 AU and it has two bright regions that exhibit point-symmetry with respect to the central source. From Figure 1 it can be seen that the CO(=21) emission is absorbed toward these bright regions, suggesting that they are optically thick regions. Therefore, the brightness temperature of the bright regions ( K) is likely to be the actual temperature of the dust. Figure 1 also reveals that the bright regions lie on the sides of the shell located closest to the main axis of the jet. This may be due to the passage of the jet close to the shell causing an increase in the density and/or temperature of the dust. The average density of the shell is estimated to be 5108 cm-3 (see Appendix D for the calculations), which favours the physical conditions to produce the observed H2O masers.
There is also a bright emission source at the centre of the nebula. A Gaussian fit to this source gives a deconvolved size of 9060 AU with a P.A. , which is nearly perpendicular to the direction of the jet.
3.3 A decelerating collimated jet and a bipolar outflow
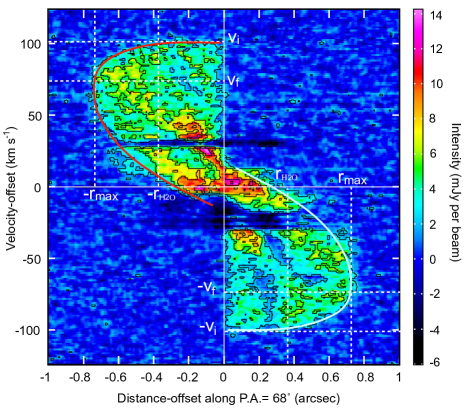
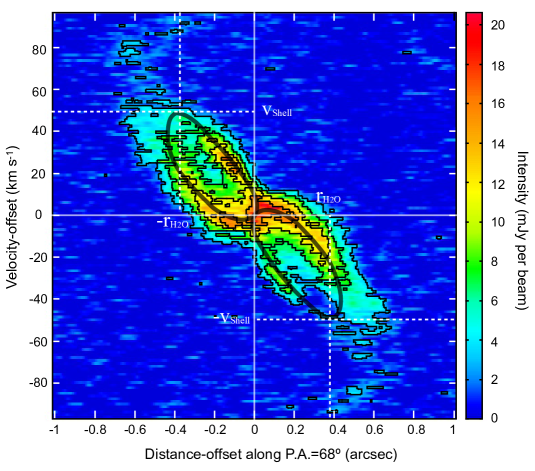
Figure 2 shows a PV-diagram of the CO(=21) emission obtained with a slit along the major axis of the emitting region, P.A.=68∘. It is evident in this PV-diagram that the spatial spread of the CO(=21) emission, delimited horizontally by the solid red and light-blue lines, increases as a function of the velocity-offset for 0offset(km s-1)75 and decreases for 75offset(km s-1)100. Thus, this PV-diagram of W43A exhibits an S-like pattern that resembles the PV-diagram of the WF IRAS 163423814 (Sahai et al. 2011; Tafoya et al. 2019). Tafoya et al. (2019) interpreted the PV-diagram of IRAS 163423814 in terms of a jet-driven molecular outflow where the jet decelerates as it interacts with the surrounding material, transferring kinetic energy and momentum. The surrounding material and the jet produce the emission with positive and negative gradient, respectively, in the PV-diagram. Given the spatial distribution of the emission seen in Figure 1 and the profile of the PV-diagram of Figure 2, it is evident that the spatio-kinematical configuration of W43A is similar to the one of IRAS 163423814. Following the analysis done by Tafoya et al. (2019), the launch velocity of the jet can be obtained from the highest velocity-offset of the CO(=21) emission, which in Figure 2 is indicated as 100 km s-1. Considering the inclination of the source of 35∘ with respect to the plane of the sky, this velocity corresponds to a de-projected expansion velocity /sin 35∘=175 km s-1. The velocity-offset at which the velocity gradient changes from positive to negative is offset(km s-1)75. This value represents the velocity-offset at the tip of the jet, 75 km s-1, and its corresponding de-projected expansion velocity is /sin 35∘=130 km s-1.
This shows that the material at the tip of the jet has decelerated during its journey from the launching region to its present location. This behaviour is expected if turbulent entrainment along the jet is a dominant process since, for such a case, the average velocity of the jet would decrease as momentum is transferred to the entrained material (Chernin et al. 1994). On the other hand, the overall velocity spread of the emission at a given position in the PV-diagram, delimited vertically by the solid red and light-blue lines, decreases with the distance from central system as an effect of the lateral expansion and turbulent motion of the gas (Chernin et al. 1994; Balick et al. 2013). From Figure 2 it can be seen that beyond the radius of the outer edge of the H2O masers clusters, =, the maximum velocity-offset of the CO emission begins to drop significantly. Thus, it is likely that the largest deceleration occurs when the jet interacts with material of the shell, creating the physical conditions (400 K; 109 cm-3) that favour H2O maser emission (Yates et al. 1997). This would explain the high concentration of H2O masers in the interaction region. After the jet interacts with the shell, it continues streaming outwards and decelerates even further.
The collimation factor of the CO structure that traces the jet, defined as the ratio between the length and the width, is very high (20). Surprisingly, the degree of collimation of the jet is not affected after passing the region of interaction with the bipolar shell. The persistence of the high degree of collimation of the jet after the interaction with the shell is likely due to the pressure of the magnetic field, since it is expected to dominate the gas pressure by a factor of a few hundred in the interaction region (Vlemmings et al. 2006). Even though from these observations there is no clear evidence that the jet is precessing, as opposed to what was thought from the H2O masers observations earlier (Imai et al. 2002), it is possible that there have been some slight variations in the P.A. of the jet that may explain the changes seen in the distribution of the H2O masers over the past couple of decades (Chong et al. 2015).
3.4 Time scale of the jet and bipolar shell
Considering that the velocity of the jet remains roughly constant from the launching point to the H2O masers region, the kinematical time scale for the jet to reach this location is 30 years. In addition, assuming that the jet suffers a constant deceleration in the region beyond the location of the H2O masers, the kinematical time scale from the H2O maser region to the tip of the jet is 35 years. Thus, the total kinematical age of the jet is of just =65 years.
In addition to CO(=21), the -H2S (=220211) line was also detected from the observations of this project. The H2S emission is shown in Figure 5 superimposed on the continuum emission. As it can be seen from Figure 5, the H2S emission has a spatial distribution that is significantly different from that of the CO emission. Particularly, while the later one seems to be confined by the shell in the direction perpendicular to the outflow, the former one extends beyond the shell. Figure 6 shows a PV-diagram of the H2S emission where it can be seen that it exhibits the characteristic morphology of a double-lobe structure, indicated with solid lines, similar to the morphology of the bipolar shell traced by the continuum emission. H2S is known to trace shocked material (e.g. Holdship et al. 2016), and in the case of W43A it is most likely tracing the shock produced by the expansion of the shell. Thus, we assume that the H2S emission traces not only the spatial distribution but also the kinematics of the bipolar shell. The kinematical age of the bipolar shell can be obtained as /, where is the expansion velocity of the shell at any point located at a distance from the central source. The expansion velocity of the H2S emission at the location of the H2O masers (1100 AU) is 50 km s-1/sin()=90 km s-1, where =35∘.) The resulting timescale for the shell is 60 years.
Thus, the kinematic ages of the jet and the bipolar shell, traced by the continuum emission, are basically equal, strongly suggesting that the former created the latter as it interacted with material in the vicinity of the driving source. The difference in size between the jet and the bipolar shell, despite their common kinematic age, can be explained in the following way. When the highly collimated jet was launched for the first time, around 65 years ago, it interacted with the dense material close to the central source creating bipolar shell. As circumstellar material was swept up, the expansion of the bipolar shell slowed down. Additionally, since the jet is launched with a velocity higher than the resulting velocity of the shell, it opens its way out through the shell, creating the physical conditions that favour the H2O maser emission in the region where the two components interact. Since the edges of the CO(=21) emission are clearly defined and there is no evidence of collimated emission beyond the structures seen in Figure 1 , it is likely that W43A is indeed undergoing the earliest phase of collimated mass-loss, as suggested previously (Imai et al. 2002). It is worth noting that recent numerical simulations presented by Balick et al. (2020) predict morphologies very similar to that of W43A for certain combinations of initial conditions of the density, velocity and magnetic field. Therefore, these observational results are of utter importance to constrain such kind of numerical simulations.
3.5 A binary system in W43A?
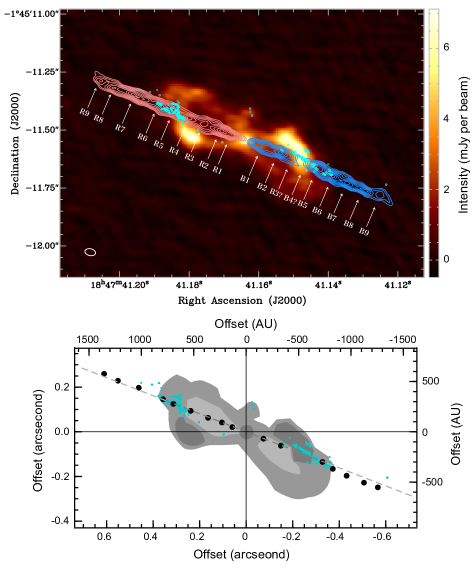
The CO(=21) emission associated to the jet also exhibits a clumpy structure. The red-shifted jet has nine
knots while the blue-shifted jet exhibits only seven knots (see Figure 3). The knots are roughly associated in pairs, although
there are some variations in their separations from the central source. The missing knots in the blue-shifted jet coincide with the
location of one of the continuum bright regions. Thus, it is likely that they are obscured by dense material in the dusty shell.
The average knot spacing is 180 AU. Similar clumpy structures are commonly found in jets associated to young
stellar objects (Lee et al. 2007; Hirano et al. 2006; Santiago-García et al. 2009; Hirano et al. 2010) and they are interpreted as due to periodic events
of increase of the velocity within the jets (Santiago-García et al. 2009; Hirano et al. 2010). For the case of W43A, this could be explained
in terms of a jet launching mechanism associated to accretion in a binary system that hosts an AGB star and a companion
with eccentric orbits. When the components are in periastron the accretion disc is perturbed and the mass-loss rate
increases (Bonnell & Bastien 1992; Clarke & Syer 1996; Davis et al. 2013), leading to internal shocks in the jet that produce the observed clumpy
structure (Hirano et al. 2006; Santiago-García et al. 2009). Given the knot spacing and the speed of the jet, the time interval between
them is around 5–7 years, which would be equal to the orbital period of the binary system.
4 Final Remarks
The observations presented in this work reveal with unprecedented detail the structure of a highly collimated jet and a bipolar bipolar morphology in the envelope of an AGB star and provide crucial information on the initial conditions of the CSE shaping. Particularly, the physical parameters derived from these observations will be essential to feed the theoretical models and numerical simulations that aim to explain the aspherical morphologies in the late stages of the evolution of low and intermediate mass stars (e.g. Balick et al. 2020 and references there in). Given the short time scale, 100 years, derived for this transition, it is imperative to investigate the other few (15) water fountain sources (Desmurs 2012) that may exhibit different stages of this ephemeral phase.
ADS/JAO.ALMA#2016.1.00540.S. ALMA is a partnership of ESO (representing its member states), NSF (USA) and NINS (Japan), together with NRC (Canada), MOST and ASIAA (Taiwan), and KASI (Republic of Korea), in cooperation with the Republic of Chile. The Joint ALMA Observatory is operated by ESO, AUI/NRAO and NAOJ. The VLBA is operated by the National Radio Astronomy Observatory (NRAO) under cooperative agreement by Associated Universities, Inc. JFG is partially supported by MINECO (Spain) grant AYA2017-84390-C2-R (co-funded by FEDER) and by the State Agency for Research of the Spanish MCIU through the “Center of Excellence Severo Ochoa” award for the Instituto de Astrofísica de Andalucía (SEV-2017-0709). HI and GO are supported by the MEXT KAKENHI program (16H02167). HI and JFG were supported by the Invitation Program for Foreign Researchers of the Japan Society for Promotion of Science (JSPS grant S14128). GO was supported by the Australian Research Council Discovery project DP180101061 of the Australian government, and the grants of CAS LCWR 2018-XBQNXZ-B-021 and National Key R&D Program 2018YFA0404602 of China. DT was supported by the ERC consolidator grant 614264. The authors are grateful to Bruce Balick for careful reading of the paper and valuable suggestions and comments.
Appendix A Distance to W43A.
In previous works, W43A has been assumed to be located at a distance of =2.6 kpc from the Sun. This value was calculated assuming the source is in a circular orbit around the Galaxy with an angular velocity given by a Galactic rotation curve derived in the 1960s (Schmidt 1965; Bowers et al. 1980). In this work, the kinematical distance to W43A is updated using the Revised Kinematic Distance Calculator (2014) using Galactic parameters from model A5 in Reid et al. (2014). The calculator gives near and far kinematical distances of 2.22 kpc and 11.90 kpc, respectively. We adopt the near kinematical distance since it is compatible with the result of the Bayesian Distance Calculator (Reid et al. 2016).
Appendix B Channel map of the CO(=21) emission in W43A.
Figure 4 shows a velocity channel map of the CO(=21) emission from W43A.
Appendix C Velocity-integrated and PV-diagram of the H2S line emission in W43A.
The contours in Figure 5 represent a velocity-integrated map of the -H2S(=220211) emission in W43A superimposed on the continuum emission (colour map) at 230 GHz. Figure 6 shows PV-diagram of the H2S emission obtained using a slit along P.A.=68∘.
Appendix D Volume density of the molecular gas in the bipolar shell.
The mass of the gas in the bipolar shell can be estimated assuming optically thin emission and isothermal conditions for the dust. It should be pointed out that although the dust emission is optically thick toward the bright regions, as discussed in the main text, it is reasonable to assume optically thin emission from the rest of the shell. Having this in mind, the mass of the dust can obtained from the following relation (Hildebrand 1983; Gall et al. 2011):
| (D1) |
where is the distance to the source, is the flux density of the continuum emission, is the dust absorption coefficient and is the Planck function evaluated at the temperature of the dust, . The flux density of the continuum emission that traces the bipolar shell is 26725 mJy. Considering an average dust temperature =100 K, obtained from the brightness temperature of the optically thick bright regions; a dust absorption coefficient =1.8 cm2 g-1 for small silicate grains with coating of amorphous carbon (Ossenkopf & Henning 1994), and a dust-to-gas ratio value of 100, the mass of the bipolar shell is 2.00.2 solar masses. The volume of the bipolar shell is obtained from the size of the bipolar lobes of molecular gas confined by the shell and from the thickness of the shell. The resulting average density of the bipolar shell is =5.10.5108 cm-3. For silicate grains without coating the dust absorption coefficient is 0.15 cm2 g-1 (Ossenkopf & Henning 1994), resulting in values of the bipolar shell mass and density a factor of 10 larger, which are unrealistically high given that the initial mass of the star must be 8.
Appendix E VLBA observations of the H2O masers.
The results of all the VLBA observations presented in this paper were summarized by Chong et al. (2015). One exception is the one based on the latest observation on 19 January 2014 (project code BI41A). This observation and its data reduction were conducted similarly to those of other observations. The detected H2O masers include a maser feature located close to the tip of the blue-shifted jet, and give the largest extent of the maser distribution. This indicates that the H2O maser region has grown along the jet at a rate roughly consistent with the proper motions of the individual maser features (9 milliarcseconds yr-1 in one side of the bipolar jet). The coordinates of the fringe-phase and position reference maser spot at =126.1 km s-1 were determined to be: (J2000) R.A.=18h 47m 41.1821s, Dec.=01∘45′11396 , with an uncertainty better than 1 milliarcsecond that may be dominated by the uncertainty in the position of the phase-reference source J183323.9032331. The superposition of the H2O maser maps taken from the different observation sessions was made by the spatio-kinematical fitting to the bipolar jet as described by Chong et al. (2015).
References
- Amiri et al. (2010) Amiri, N., Vlemmings, W., & van Langevelde, H. J. 2010, A&A, 509, A26, doi: 10.1051/0004-6361/200913194
- Balick et al. (2020) Balick, B., Frank, A., & Liu, B. 2020, The Astrophysical Journal, 889, 13, doi: 10.3847/1538-4357/ab5651
- Balick et al. (2013) Balick, B., Huarte-Espinosa, M., Frank, A., et al. 2013, ApJ, 772, 20, doi: 10.1088/0004-637X/772/1/20
- Bonnell & Bastien (1992) Bonnell, I., & Bastien, P. 1992, ApJ, 401, L31, doi: 10.1086/186663
- Bowers et al. (1980) Bowers, P. F., Reid, M. J., Johnston, K. J., Spencer, J. H., & Moran, J. M. 1980, ApJ, 242, 1088, doi: 10.1086/158540
- Chernin et al. (1994) Chernin, L., Masson, C., Gouveia dal Pino, E. M., & Benz, W. 1994, ApJ, 426, 204, doi: 10.1086/174055
- Chong et al. (2015) Chong, S.-N., Imai, H., & Diamond, P. J. 2015, ApJ, 805, 53, doi: 10.1088/0004-637X/805/1/53
- Clarke & Syer (1996) Clarke, C. J., & Syer, D. 1996, MNRAS, 278, L23, doi: 10.1093/mnras/278.1.L23
- Davis et al. (2013) Davis, P. J., Siess, L., & Deschamps, R. 2013, A&A, 556, A4, doi: 10.1051/0004-6361/201220391
- Desmurs (2012) Desmurs, J.-F. 2012, in IAU Symposium, Vol. 287, Cosmic Masers - from OH to H0, ed. R. S. Booth, W. H. T. Vlemmings, & E. M. L. Humphreys, 217–224, doi: 10.1017/S1743921312006990
- Diamond & Nyman (1988) Diamond, P. J., & Nyman, L. . 1988, in IAU Symposium, Vol. 129, The Impact of VLBI on Astrophysics and Geophysics, ed. M. J. Reid & J. M. Moran, 249
- Gall et al. (2011) Gall, C., Hjorth, J., & Andersen, A. C. 2011, A&A Rev., 19, 43, doi: 10.1007/s00159-011-0043-7
- Herman & Habing (1985) Herman, J., & Habing, H. J. 1985, A&AS, 59, 523
- Hildebrand (1983) Hildebrand, R. H. 1983, QJRAS, 24, 267
- Hirano et al. (2010) Hirano, N., Ho, P. P. T., Liu, S.-Y., et al. 2010, ApJ, 717, 58, doi: 10.1088/0004-637X/717/1/58
- Hirano et al. (2006) Hirano, N., Liu, S.-Y., Shang, H., et al. 2006, ApJ, 636, L141, doi: 10.1086/500201
- Holdship et al. (2016) Holdship, J., Viti, S., Jimenez-Serra, I., et al. 2016, MNRAS, 463, 802, doi: 10.1093/mnras/stw1977
- Imai (2007) Imai, H. 2007, in IAU Symposium, Vol. 242, Astrophysical Masers and their Environments, ed. J. M. Chapman & W. A. Baan, 279–286, doi: 10.1017/S1743921307013130
- Imai et al. (2005) Imai, H., Nakashima, J.-i., Diamond, P. J., Miyazaki, A., & Deguchi, S. 2005, ApJ, 622, L125, doi: 10.1086/429820
- Imai et al. (2002) Imai, H., Obara, K., Diamond, P. J., Omodaka, T., & Sasao, T. 2002, Nature, 417, 829, doi: 10.1038/nature00788
- Lagadec et al. (2011) Lagadec, E., Verhoelst, T., Mékarnia, D., et al. 2011, MNRAS, 417, 32, doi: 10.1111/j.1365-2966.2011.18557.x
- Lee et al. (2007) Lee, C.-F., Ho, P. T. P., Hirano, N., et al. 2007, ApJ, 659, 499, doi: 10.1086/512540
- Likkel & Morris (1988) Likkel, L., & Morris, M. 1988, ApJ, 329, 914, doi: 10.1086/166435
- Ossenkopf & Henning (1994) Ossenkopf, V., & Henning, T. 1994, A&A, 291, 943
- Reid et al. (2016) Reid, M. J., Dame, T. M., Menten, K. M., & Brunthaler, A. 2016, ApJ, 823, 77, doi: 10.3847/0004-637X/823/2/77
- Reid et al. (2014) Reid, M. J., Menten, K. M., Brunthaler, A., et al. 2014, ApJ, 783, 130, doi: 10.1088/0004-637X/783/2/130
- Sahai et al. (2011) Sahai, R., Morris, M. R., & Villar, G. G. 2011, AJ, 141, 134, doi: 10.1088/0004-6256/141/4/134
- Sahai & Trauger (1998) Sahai, R., & Trauger, J. T. 1998, AJ, 116, 1357, doi: 10.1086/300504
- Santiago-García et al. (2009) Santiago-García, J., Tafalla, M., Johnstone, D., & Bachiller, R. 2009, A&A, 495, 169, doi: 10.1051/0004-6361:200810739
- Schmidt (1965) Schmidt, M. 1965, Rotation Parameters and Distribution of Mass in the Galaxy (The University of Chicago Press), 513
- Tafoya et al. (2019) Tafoya, D., Orosz, G., Vlemmings, W. H. T., Sahai, R., & Pérez-Sánchez, A. F. 2019, A&A, 629, A8, doi: 10.1051/0004-6361/201834632
- Vlemmings et al. (2006) Vlemmings, W. H. T., Diamond, P. J., & Imai, H. 2006, Nature, 440, 58, doi: 10.1038/nature04466
- Wilson & Barrett (1972) Wilson, W. J., & Barrett, A. H. 1972, A&A, 17, 385
- Yates et al. (1997) Yates, J. A., Field, D., & Gray, M. D. 1997, MNRAS, 285, 303, doi: 10.1093/mnras/285.2.303