Temperature dependent elastic constants and thermodynamic properties of BAs: an ab-initio investigation.
Abstract
We present an ab-initio study of the temperature dependent elastic constants of boron arsenide (BAs), a semiconductor that exhibits ultra-high thermal conductivity and is under investigation for thermal management in electronics. We test the consistency of our predictions by computing the temperature dependent sound velocity of the longitudinal acoustic mode along the direction and comparing with experiment. Furthermore, as a byproduct, we present the room temperature phonon dispersions, and the temperature dependent thermal expansion, isobaric heat capacity, and average Grüneisen parameter comparing with the most updated experiments and previous calculations when available. Finally, we present the theoretical estimate of the temperature dependent mean square atomic displacements.
I Introduction
Boron arsenide (BAs) is a promising semiconductor for its high thermal conductivity at room temperature (RT) that makes it a possible candidate for applications in electronics and photonics that require efficient heat dissipation from hot spots in devices. Although the growth of BAs was reported since 1950s, only recently high-quality samples have been synthesized with the measurement of an ultrahigh thermal conductivity up to 1300 Kang, Wu, and Hu (2017); Kang et al. (2018); Li et al. (2018); Tian et al. (2018). These measurements spurred the interest for this material so that many experiments and theoretical calculations have been carried out to investigate its physical properties. BAs has a zinc-blende cubic structure and belongs to the space group Kang et al. (2018); Li et al. (2018); Tian et al. (2018). Recent measurements, supported by ab-initio calculations, range from the lattice constant and thermal expansion (TE), to the band gap and refractive index, to the elastic constants (EC) and the bulk modulus Tian et al. (2019); Kang et al. (2019); Chen et al. (2019).
The EC are important quantities to describe the mechanical and thermodynamic properties of materials since they allow the check of the crystal stability, determine the speeds of sound, and can be used to compute the TE and the thermal stresses. At K the ECs of BAs have been computed in several works by means of density functional theory (DFT) using several exchange and correlation functionals Wang and Ye (2003); Hassan, Akbarzadeh, and Zoaeter (2004); Meradji et al. (2004); Bing, Feng, and Dong (2010); Daoud, Bioud, and Bouarissa (2015); Tian et al. (2019); Kang et al. (2019). However, in literature, the information about the effect of temperature on the ECs is rather indirect. Kang et al. Kang et al. (2019) reported the measured speed of sound of the longitudinal acoustic mode along the direction from K to K showing a decrease of about %, but no theoretical calculation is available to support this measurement and in general to estimate the temperature dependent elastic constants (TDECs) of BAs.
We have recently implemented in the thermo_pw code Malica and Dal Corso (2020) the calculation of the TDECs both isothermal and adiabatic. The TDECs can be computed from second derivatives of the Helmholtz free-energy within the quasi-harmonic approximation (QHA) by means of density functional theory (DFT) and density functional perturbation theory (DFPT). In this paper we apply the calculation of TDECs to BAs. We found that in the range of temperature K the percentage softening of adiabatic ECs is 11 % for , 9 % for and 13 % for . In the range of temperature K the softening is comparable but slightly smaller than the one of silicon.
As a byproduct of our calculation we report the RT phonon dispersions of BAs comparing with the inelastic X-ray scattering measurements and the temperature dependence of several other thermodynamic quantities such as the TE, the isobaric heat capacity, the average Grüneisen parameter, and the atomic B-factors (BFs). We compare these quantities with experimental data and previous calculations when available. In general, the agreement is quite good.
II Theory
The calculation of the TDECs within the QHA is explained in detail in our recent work Malica and Dal Corso (2020); in this section we limit ourselves to a summary of the most important formulas in order to make the paper self-contained.
The isothermal ECs are obtained from the derivatives of the Helmholtz free-energy with respect to strain :
| (1) |
Since we are usually interested in the ECs obtained from the stress-strain relationship () we correct the when the system is under a pressure as:
| (2) |
The Helmholtz free-energy of Eq. 1 is obtained as the sum of the DFT total energy and the vibrational free energy (neglecting the electronic contribution): . The latter is given by:
| (3) | |||||
where is the number of cells in the crystal, is the phonon angular frequency of the mode with wave-vector computed in the system with a strain . Cubic solids have three independent ECs that in Voigt notations are , , and Nye (1985). The QHA calculation of the ECs, Eq. 1, is performed on a grid of reference geometries by varying the lattice constant . Phonon dispersions are computed in the same grid in order to evaluate the free-energy as a function of the volume, minimize it and obtain the temperature dependent crystal parameter Palumbo and Dal Corso (2017a, b). Then, at each temperature , the TDECs as a function of are interpolated and evaluated at . The calculation requires phonon dispersions in all the strained configurations for all the reference geometries, in addition to the phonon dispersions used to compute .
The temperature dependent lattice parameter can be used to derive the TE as:
| (4) |
The isochoric heat capacity within the harmonic approximation is given by:
| (5) |
It is computed for each reference geometry and it is interpolated at . The knowledge of and allows to compute the isobaric heat capacity and the average Grüneisen parameter :
| (6) |
| (7) |
where is the volume of one unit cell at the temperature , is the volume TE and is the isothermal bulk modulus calculated from the ECs as:
| (8) |
The adiabatic ECs are obtained from the isothermal ones with the relation:
| (9) |
where the are the thermal stresses obtained from:
| (10) |
The adiabatic bulk modulus is computed as in Eq. 8 in terms of the adiabatic ECs.
The atomic BF is calculated as explained in a previous work Malica and Dal Corso (2019). Calling the mean-square displacement matrix of the atom we have:
| (11) |
where is the mass of -th atom, is the -th component of the dynamical matrix eigenvector of the mode with wave-vector . The BF is defined as Malica and Dal Corso (2019). In order to include anharmonic effects, BFs are computed in the same reference geometries used for elastic constants and interpolated at each temperature at the .
| LDAa | 4.745 | 2897 | 768 | 1557 | 1477 |
|---|---|---|---|---|---|
| LDAb | 4.745 | 2897 | 768 | 1772 | 1477 |
| LDAc | 4.756 | 2828 | 759 | 1520 | 1449 |
| LDAd | 4.759 | 2807 | 754 | 1507 | 1438 |
| LDA Kang et al. (2019) | 4.7444 | 2940 | 806 | 1770 | 1500 |
| LDA Daoud, Bioud, and Bouarissa (2015) | 3013 | 772 | 1639 | 1519 | |
| LDA Bing, Feng, and Dong (2010) | 4.779 | 2864 | 710 | 1575 | 1428 |
| LDA Meradji et al. (2004) | 4.743 | 2950 | 780 | 1770 | 1500 |
| LDA Wang and Ye (2003) | 4.721 | 2914 | 728 | 1579 | 1457 |
| PBE Tian et al. (2019) | 4.817 | 2630 | 620 | 1430 | 1290 |
| PBE Meradji et al. (2004) | 4.812 | 2750 | 630 | 1500 | 1340 |
| PBE Hassan, Akbarzadeh, and Zoaeter (2004) | 4.784 | 2510 | 798 | 1270 | 1370 |
| Expt. Kang et al. (2019) | 4.78 | 2850 | 795 | 1490 | 1480 |
a This work at K,
b This work at K with frozen ions,
c This work at K + ZPE,
d This work at K (adiabatic ECs)
III Method
The calculations presented in this work were carried out using DFT as implemented in the Quantum ESPRESSO package Giannozzi et al. (2009, 2017). Thermodynamic properties have been computed using the thermo_pw package tpw . The exchange and correlation functional was approximated by the local density approximation (LDA) which gives the best agreement between experimental and theoretical quantities especially for the K ECs. We employed the projector augmented wave (PAW) method and a plane waves basis set with pseudopotentials Blöchl (1994) from psl . The pseudopotentials B.pz-n-kjpaw_psl.1.0.0.UPF and As.pz-n-kjpaw_psl.1.0.0.UPF have been used for boron and arsenic, respectively. The wave functions (charge density) were expanded in a plane waves basis with a kinetic energy cut-off of Ry ( Ry), and a mesh of k-points has been used for the Brillouin zone integration. Density functional perturbation theory (DFPT) Baroni et al. (2001); Dal Corso (2010) was used to calculate the dynamical matrices on a q-points grid. The dynamical matrices have been Fourier interpolated on a q-points mesh to evaluate the free-energy. The grid of the reference geometries was centered at the lattice constant reported in Table 1. The number of reference geometries were 9 with lattice constants separated from each other by . In the ECs calculation the number of strained configuration was 6 for each type of strain with an interval of strains between two strained geometries of . In total we computed phonon dispersions for 162 geometries (in addition to the 9 phonon dispersions used for the calculation). A second degree polynomial has been used to fit the energy (for the ECs at K) or the free-energy (for the QHA TDECs) as a function of strain, while a fourth degree polynomial was used to fit at each temperature all the other quantities computed at the various reference geometries versus .
IV Applications
In Table 1 we report the computed equilibrium lattice constant at K both with and without the zero point energy (ZPE) and the RT value: the differences among them are of the order of hundredths of angstroms. The computed RT is in good agreement with the RT experiment Kang et al. (2019) (the difference is smaller than 0.02 Å). The comparison with other computed is also reported: the LDA values agree within 1 %. This small differences depend primarily on the computational parameters chosen for the calculation and from the different pseudopotentials. The PBE values of are slightly larger than the LDA ones as usually found with the functionals that use the generalized gradient approximation (GGA).
In Table 1 we report the calculated values of the elastic constants together with other theoretical estimates available in the literature and the experimental values. The LDA values are closer to experiment, while the PBE (Perdew Burke Ernzerhof) calculations give smaller ECs, as usually found with the GGA functionals. At K, the softening due to the ZPE is for , for and in . In our calculation we relax the ionic positions for each strained configuration so the ECs are relaxed-ions results. This is relevant only for while for and the ionic positions are determined by symmetry. The frozen-ions results, obtained by a uniform strain of the atomic positions but no further relaxation, are also shown in Tab. 1: is 14 % larger than the relaxed-ions value. Our theoretical K values are in good agreement with experiment: is smaller of 1.5 %, is smaller of 5.1 % and is larger of 1 %.
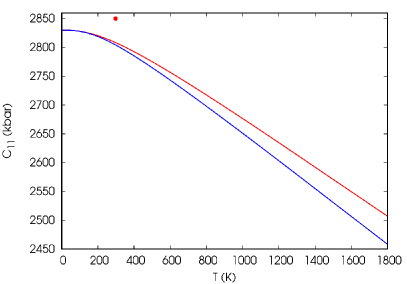
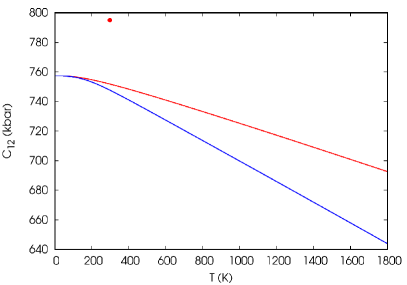
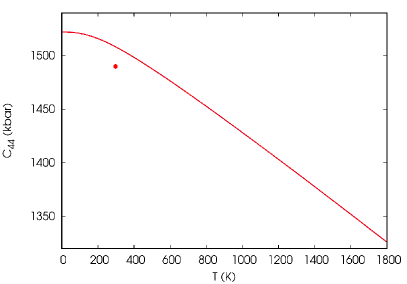
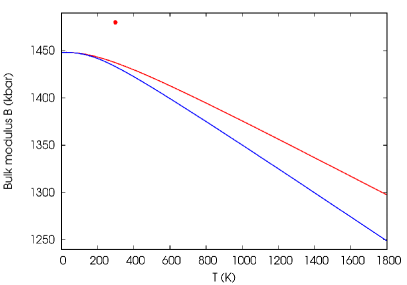
In Figure 1 the TDECs and the bulk modulus are reported. The red lines are the adiabatic ECs (or bulk modulus), while the blue lines are the isothermal ECs. Evaluating the percentage softening of ECs due to temperature as:
| (12) |
where the ZPE is included in we find: 11 % (adiabatic) and 13 % (isothermal) for , 9 % (adiabatic) and 15 % (isothermal) for and 13 % for .
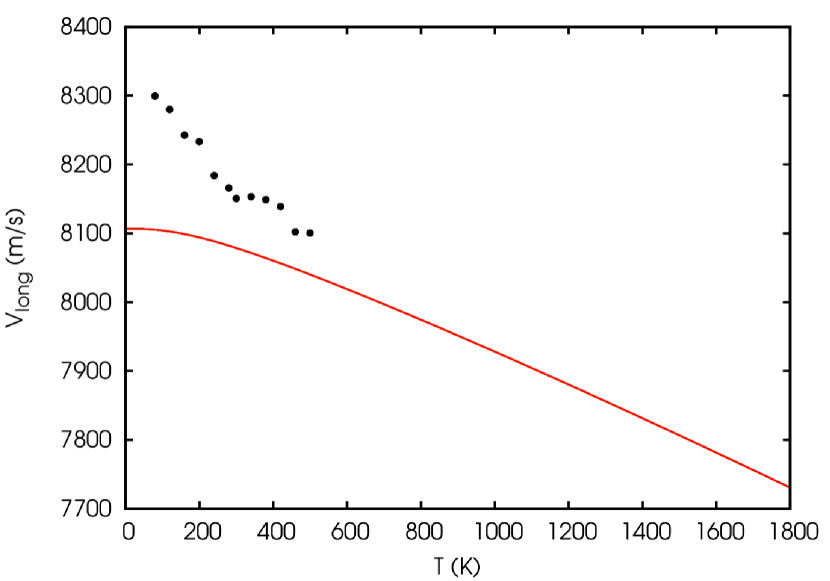
As far as we know, presently no experimental measurement of the TDECs is available to compare directly with our result, but recently the temperature dependence of the longitudinal sound velocity along the direction was measured till K Kang et al. (2019). Using the adiabatic TDECs and the density this sound velocity can be written as Kittel (1976):
| (13) |
and in Fig. 2 we compare our theoretical estimate with experiment. We take into account the temperature dependence of the density due to TE effect. The use of a temperature independent density in Eq. 13 (for instance the density at K or K) leads to an appreciably lower sound velocity above the RT (for instance at K the difference is 90 m/s). The theoretical values of the sound velocity as a function of temperature is in reasonable agreement with experiment in the analyzed range, but the experimental slope of the curve at low temperatures is not reproduced. The comparison improves above RT. The difference between theory and experiment at RT () is compatible with the errors in the elastic constants and in the density, while the difference at the lowest measured temperature () is larger.
We can also compare the TDECs of BAs with those of silicon that we have calculated by using LDA Malica and Dal Corso (2020). Silicon ECs are smaller, the K values (with ZPE) are: kbar, kbar and kbar. In the range of temperature calculated for silicon ( K) and decrease of about % and of % (for both isothermal and adiabatic). In the same range of temperature the decrease of the ECs of BAs is slightly smaller: % (adiabatic) and % (isothermal) for , % (adiabatic) and % (isothermal) for and % for .
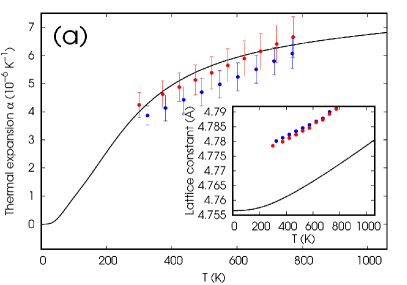
We now present several other thermodynamic properties of BAs that have been calculated together with the TDECs. The TE and the temperature dependence of the lattice constant are shown in Figure 3 in the range of temperature K. We compare our numerical result (black line) with two recent measurements in the temperature range K (red points) Chen et al. (2019) and K (blue points) Kang et al. (2019). The experimental is higher than the theoretical one by approximately Å, but the temperature dependence is reproduced correctly as visible in the TE plot reported in the same figure. In the experimental temperature range, the experimental are both linear with but the slope of the red points is slightly larger and more in agreement with our calculation. This behavior is reflected in the TE: the TE of Chen et al. Chen et al. (2019) agrees with ours within experimental uncertainties while the TE of Kang et al. Kang et al. (2019) has slightly smaller values (although within the error bar of the former Chen et al. (2019)). In particular the RT TEs are (this work), (Chen et al. Chen et al. (2019)) and (Kang et al. Kang et al. (2019)). Other DFT-LDA estimates are: (Chen et al. Chen et al. (2019)), and (Broido et al. Broido, Lindsay, and Reinecke (2013)). Molecular dynamic simulations Benkabou et al. (1999) produced the result . A much larger value has appeared recently Daoud, Bioud, and Lebga (2019) by using DFT method within the GGA, quite far from experiment.
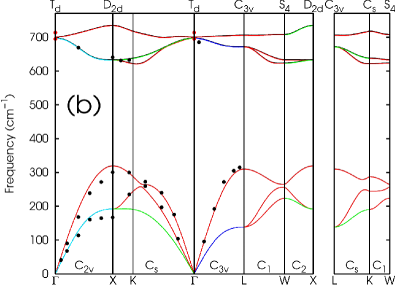
The phonon frequencies computed at the different geometries are interpolated at K and the result is shown in Figure 3b (colored lines). The phonons are compared with RT measurements obtained from inelastic X-ray scattering Ma et al. (2016) and Raman spectroscopy Greene, Luo, and Ruoff (1994) (points). As already found in previous references Broido, Lindsay, and Reinecke (2013); Ma et al. (2016) the agreement between theory and experiment is quite good. The difference between RT and K phonons (black lines) is only barely visible in the optical branches.
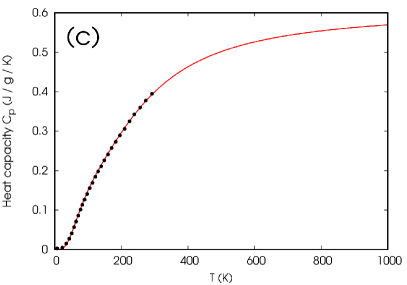
The isobaric heat capacity is shown in Figure 3c. The points indicate the temperature dependence of experimental data below RT Chen et al. (2019) that we extrapolated from the plot. The agreement is very good, consistently with the fact that also the calculated Debye temperature ( K, obtained from the K+ ZPE ECs) is in good agreement with the experimental value Chen et al. (2019) ( K).
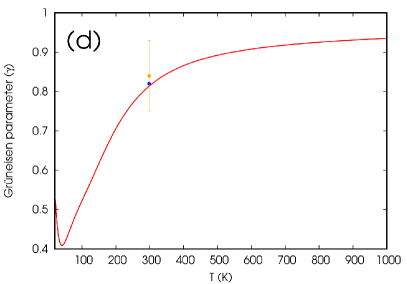
The temperature dependence of the average Grüneisen parameter is reported in Figure 3d. We also report the RT experimental values of Kang et al. Kang et al. (2019) (blue point) and Chen et al. Chen et al. (2019) (orange point). The experimental uncertainty of the first point is not known, but it is very close to our curve. The second point is in agreement with our estimate within the experimental error bar.
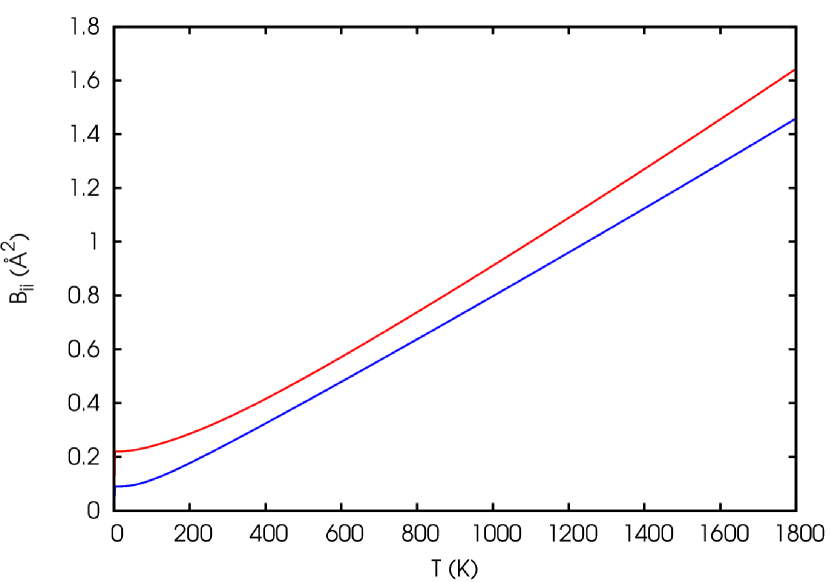
Finally in Figure 4 we show our estimate of the BF for boron (red) and arsenic (blue). The BF of boron is 0.35 Å2 at K and grows up to 0.74 Å2 at K. The BF of arsenic is smaller because of the larger mass: 0.25 Å2 at K and 0.64 Å2 at K. They are smaller than the BFs of silicon Malica and Dal Corso (2019) which has 0.52 Å2 at K and 1.29 Å2 at K.
V Conclusions
We studied TDECs of BAs by means of ab-initio simulation by using the recent tools implemented in the thermo_pw code within the QHA. The values of the adiabatic ECs at K are kbar, kbar, kbar. We found that in the range of temperature K the percentage softening of the adiabatic ECs is 11 % for , 9 % for and 13 % for . The order of magnitude of the softening is consistent with the temperature variation of the longitudinal sound velocity measured along the direction Kang et al. (2019). The slope of the curves are different below RT and similar for larger temperatures. The softening computed in BAs is slightly smaller than that calculated for silicon in the temperature range K Malica and Dal Corso (2020). We also computed thermodynamic properties of BAs such as the TE, the heat capacity, and the average Grüneisen parameter finding good agreement with experiments. Finally we presented the calculated atomic BFs as a function of the temperature for which no information, neither experimental nor theoretical, was available so far.
Acknowledgements.
Computational facilities have been provided by SISSA through its Linux Cluster and ITCS and by CINECA through the SISSA-CINECA 2019-2020 Agreement.References
- Kang, Wu, and Hu (2017) J. S. Kang, H. Wu, and Y. Hu, Nano Lett. 17, 7507 (2017).
- Kang et al. (2018) J. S. Kang, M. Li, H. Wu, H. Nguyen, and Y. Hu, Science 361, 575 (2018).
- Li et al. (2018) S. Li, Q. Zheng, Y. Lv, X. Liu, X. Wang, P. Y. Huang, D. G. Cahill, and B. Lv, Science 361, 579 (2018).
- Tian et al. (2018) F. Tian, B. Song, X. Chen, N. K. Ravichandran, Y. Lv, K. Chen, S. Sullivan, and J. Kim, Science 361, 582 (2018).
- Tian et al. (2019) F. Tian, K. Luo, C. Xie, B. Liu, X. Liang, L. Wang, G. A. Gamage, H. Sun, H. Ziyaee, J. Sun, Z. Zhao, B. Xu, G. Gao, X.-F. Zhou, and Z. Ren, Appl. Phys. Lett. 114, 131903 (2019).
- Kang et al. (2019) J. S. Kang, M. Li, H. Wu, H. Nguyen, and Y. Hu, Appl. Phys. Lett. 115, 122103 (2019).
- Chen et al. (2019) X. Chen, C. Li, F. Tian, G. A. Gamage, S. Sullivan, J. Zhou, D. Broido, Z. Ren, and L. Shi, “Thermal expansion coefficient and lattice anharmonicity of cubic boron arsenide,” Physical Review Applied 11 (2019), 10.1103/physrevapplied.11.064070.
- Wang and Ye (2003) S. Q. Wang and H. Q. Ye, Phys. Status Solidi B 240, 45 (2003).
- Hassan, Akbarzadeh, and Zoaeter (2004) F. E. H. Hassan, H. Akbarzadeh, and M. Zoaeter, J. Phys.: Condens. Matter 16, 293 (2004).
- Meradji et al. (2004) H. Meradji, S. Drablia, S. Ghemid, H. Belkhir, B. Bouhafs, and A. Tadjer, Phys. Status Solidi B 241, 2881 (2004).
- Bing, Feng, and Dong (2010) L. Bing, L. R. Feng, and Y. X. Dong, Chin. Phys. B. 19, 076201 (2010).
- Daoud, Bioud, and Bouarissa (2015) S. Daoud, N. Bioud, and N. Bouarissa, Mater. Sci. Semicond. Process. 31, 124 (2015).
- Malica and Dal Corso (2020) C. Malica and A. Dal Corso, J. Phys.: Condens. Matter 32, 315902 (2020).
- Nye (1985) J. F. Nye, Physical properties of crystals (Oxford science publications, 1985).
- Palumbo and Dal Corso (2017a) M. Palumbo and A. Dal Corso, J. Phys.: Condens. Matter 29, 395401 (2017a).
- Palumbo and Dal Corso (2017b) M. Palumbo and A. Dal Corso, Phys. Status Solidi B 254, 1700101 (2017b).
- Malica and Dal Corso (2019) C. Malica and A. Dal Corso, Acta Crystallographica Section A 75, 624 (2019).
- Giannozzi et al. (2009) P. Giannozzi, S. Baroni, N. Bonini, M. Calandra, R. Car, C. Cavazzoni, D. Ceresoli, G. L. Chiarotti, M. Cococcioni, I. Dabo, A. Dal Corso, S. De Gironcoli, S. Fabris, G. Fratesi, U. G. Ralph Gebauer, C. Gougoussis, A. Kokalj, M. Lazzeri, L. Martin-Samos, N. Marzari, F. Mauri, R. Mazzarello, S. Paolini, A. Pasquarello, L. Paulatto, C. Sbraccia, S. Scandolo, G. Sclauzero, A. P. Seitsonen, A. Smogunov, P. Umari, and R. M. Wentzcovitch, J. Phys.: Condens. Matter 21, 395502 (2009).
- Giannozzi et al. (2017) P. Giannozzi, O. Andreussi, T. Brumme, O. Bunau, M. B. Nardelli, M. Calandra, R. Car, C. Cavazzoni, D. Ceresoli, M. Cococcioni, N. Colonna, I. Carnimeo, A. Dal Corso, S. De Gironcoli, P. Delugas, R. A. DiStasio, A. Ferretti, A. Floris, G. Fratesi, G. Fugallo, R. Gebauer, U. Gerstmann, F. Giustino, T. Gorni, J. Jia, M. Kawamura, H.-Y. Ko, A. Kokalj, E. Küçükbenli, M. Lazzeri, M. Marsili, N. Marzari, F. Mauri, N. L. Nguyen, H.-V. Nguyen, A. O. de-la Roza, L. Paulatto, S. Poncé, D. Rocca, R. Sabatini, B. Santra, M. Schlipf, A. P. Seitsonen, A. Smogunov, I. Timrov, T. Thonhauser, P. Umari, N. Vast, X. Wu, and S. Baroni, “Advanced capabilities for materials modelling with quantum ESPRESSO,” Journal of Physics: Condensed Matter 29, 465901 (2017).
- (20) “https://dalcorso.github.io/thermo_pw,” .
- Blöchl (1994) P. E. Blöchl, Phys. Rev. B 50, 17953 (1994).
- (22) “https://github.com/dalcorso/pslibrary,” .
- Baroni et al. (2001) S. Baroni, S. de Gironcoli, A. Dal Corso, and P. Giannozzi, Rev. Mod. Phys. 73, 515 (2001).
- Dal Corso (2010) A. Dal Corso, Phys. Rev. B 82, 075123 (2010).
- Ma et al. (2016) H. Ma, C. Li, S. Tang, J. Yan, A. Alatas, L. Lindsay, B. C. Sales, and Z. Tian, Phys. Rev. B 94, 220303 (2016).
- Greene, Luo, and Ruoff (1994) R. G. Greene, H. Luo, and A. L. Ruoff, Phys. Rev. Lett. 73, 2476 (1994).
- Kittel (1976) C. Kittel, Introduction to Solid State Physics (Wiley, New York, 1976).
- Broido, Lindsay, and Reinecke (2013) D. A. Broido, L. Lindsay, and T. L. Reinecke, Phys. Rev. B 88, 214303 (2013).
- Benkabou et al. (1999) F. Benkabou, C. Chikr.Z, H. Aourag, P. J. Becker, and M. Certier, Phys. Lett. A 252, 71 (1999).
- Daoud, Bioud, and Lebga (2019) S. Daoud, N. Bioud, and N. Lebga, Chinese J. Phys. 57, 165 (2019).