Broadband Study of High-Synchrotron-Peaked BL Lac Object 1ES 1218+304
Abstract
The origin of the multiwavelength emission from the high-synchrotron-peaked BL Lac 1ES 1218+304 is studied using the data from Swift UVOT/XRT, NuSTAR and Fermi-LAT. A detailed temporal and spectral analysis of the data observed during 2008-2020 in the -ray ( MeV), X-ray (0.3-70 keV), and optical/UV bands is performed. The -ray spectrum is hard with a photon index of above MeV. The Swift UVOT/XRT data show a flux increase in the UV/optical and X-ray bands; the highest keV X-ray flux was . In the 0.3-10 keV range the averaged X-ray photon index is which softens to in the 3-50 keV band. However, in some periods, the X-ray photon index became extremely hard (), indicating that the peak of the synchrotron component was above keV, and so 1ES 1218+304 behaved like an extreme synchrotron BL Lac. The hardest X-ray photon index of 1ES 1218+304 was on MJD 58489. The time-averaged multiwavelength spectral energy distribution is modeled within a one-zone synchrotron self-Compton leptonic model using a broken power-law and power-law with an exponential cutoff electron energy distributions. The data are well explained when the electron energy distribution is extending up to , and the magnetic field is weak ( G). By solving the kinetic equation for electron evolution in the emitting region, the obtained electron energy distributions are discussed considering particle injection, cooling, and escape.
keywords:
Gamma rays: galaxies–Galaxies: jets–quasars: individual: 1ES1218+3041 Introduction
Active galactic nuclei (AGNs) with a bolometric luminosity of up to are the most powerful non-explosive sources in the Universe. Among AGNs, blazars are the most extreme class dominated by nonthermal emission extending from radio to Very High Energy (VHE; 100 GeV) -ray band. The blazar features are best described when assuming that the relativistically moving plasma in the jet is closely aligned with the line of sigh of the observer (Urry &
Padovani, 1995). The observations in various bands provide different windows on blazar physics, allowing to investigate the accretion disc, innermost jet (sub-parsec) as well as the knots and hotspots of large-scale jets. Most recently, the observation of VHE neutrinos from TXS 0506+056 (IceCube
Collaboration et al., 2018a, b) opened another window for studying the physics of blazar jets. Combination of electromagnetic and neutrino observations could provide most detailed information on the physics at work in the jets (e.g., for TXS 0506+056 (Ansoldi
et al., 2018; Gao
et al., 2019; Cerruti et al., 2019; Keivani
et al., 2018; Murase et al., 2018; Liao et al., 2018; Wang
et al., 2018; Padovani
et al., 2018; Sahakyan, 2018; Righi
et al., 2019) and (Sahakyan, 2019)).
Commonly, blazars are divided into two subclasses: flat-spectrum radio quasars (FSRQs) and BL Lacertae objects (Urry &
Padovani, 1995). The optical spectrum of FSRQs reveals strong broad emission lines, while that of BL Lacs has weak or no lines. The spectral energy distribution (SED) of blazars in representation has two components (e.g., Padovani
et al., 2017) and is characterized by two broad peaks: the low energy component commonly explained by synchrotron emission of relativistic electrons, peaks between the IR and the X-ray bands. When the synchrotron peak () is Hz in the rest-frame, blazars are called low synchrotron peaked (LSP) sources, and when Hz and Hz are intermediate synchrotron peaked (ISP) and high synchrotron peaked (HSP) sources, respectively (Giommi &
Padovani, 1994; Abdo
et al., 2010). In this division, FSRQs are almost exclusively LSPs.
There are various models explaining the second peak in the SED. In the leptonic scenarios, this is explained as inverse Compton (IC) scattering of photons provided by the synchrotron emission of the jet itself (i.e., synchrotron self Compton (SSC) Maraschi et al., 1992; Bloom &
Marscher, 1996a; Ghisellini et al., 1985a) or produced external to the jet (Sikora
et al., 1994; Dermer &
Schlickeiser, 1994). The most widely used sources of external seed photons are disc photons reflected from broad line region (BLR) clouds (Sikora
et al., 1994) or IR photons emitted from the dusty torus (Błażejowski et al., 2000; Ghisellini &
Tavecchio, 2009). Since the BLR lines are weak or absent in BL Lacs their SEDs are usually modeled using SSC while those of FSRQs by external IC mechanism. In the alternative hadronic scenarios, the second component is modeled by proton synchrotron emission
(e.g., Mücke &
Protheroe, 2001), photopion production (Mannheim, 1993; Mannheim &
Biermann, 1989; Mücke &
Protheroe, 2001; Mücke et al., 2003; Böttcher et al., 2013) or interaction (Dar & Laor, 1997; Araudo
et al., 2010; Bednarek &
Banasiński, 2015; Beall &
Bednarek, 1999; Bednarek &
Protheroe, 1997).
The synchrotron peak location is defined by the maximum energy at which the electrons are accelerated. In this context, HSPs are not the highest-energy end of the blazar sequence, and Costamante
et al. (2001) found objects with a hard synchrotron X-ray spectrum of at least up to keV. These extreme synchrotron BL Lacs or extreme HSPs (EHSPs) show a synchrotron peak energy above Hz (1 keV), an order of magnitude higher than that of standard HSPs. For example, during the flares of Mkn 501 the synchrotron peak reached keV (Pian
et al., 1998). Due to this shift, in the optical band the emission from EHSPs is generally dominated by the thermal emission of the giant elliptical host galaxy. The radio properties of EHSPs are in general similar to those of HSPs but rather with a low flux. In addition to extreme synchrotron BL Lacs, there are BL Lacs extreme in -rays which after extragalactic background light (EBL) correction demonstrate a very hard intrinsic photon index of up to and beyond 1 TeV (Bonnoli et al., 2015; Tavecchio et al., 2011). There is no clear relation between extreme synchrotron and TeV blazars and these two extreme behaviors should not necessarily appear together. Hard spectral photon indexes above 1 TeV due to similar hard index of the emitting particles represent major difficulties for current particle acceleration and emission theories. These extreme blazars are also discussed as possible sources of VHE neutrinos and cosmic rays (Padovani et al., 2016; Resconi et al., 2017).
The hard High Energy (HE; MeV) -ray spectrum of HSPs implies that particles are efficiently accelerated up to VHEs in their jets, so their detailed study is interesting from the theoretical point of view. One of such HSPs, is 1ES 1218+304 at (Véron-Cetty & Véron, 2003) which has been for the first time observed at VHEs by MAGIC (Albert
et al., 2006) and then by VERITAS telescopes (Acciari
et al., 2009). The observed GeV and TeV emission is described with a hard -ray photon index of after EBL correction (Acciari
et al., 2009). Next, the VERITAS observations during the active state in 2009 provided the first evidence of variability of VHE -ray emission of 1ES 1218+304 with a flux doubling time scale of day (Acciari
et al., 2010). In the HE -ray band, 1ES 1218+304 appears with a hard photon index of , as observed by Fermi Large Area Telescope (Fermi-LAT ) (Abdollahi
et al., 2020), with the emission extending beyond 100 GeV well in agreement with the data in the VHE -ray band. 1ES 1218+304 was identified as an X-ray source in the early observations (Wilson et al., 1979) and since then it was always observed with X-ray telescopes. Considering the unusually hard VHE -ray spectra of 1ES 1218+304 for its redshift, its observations were also used to constrain the EBL absorption density (e.g., Korochkin et al., 2020) or extragalactic magnetic field (Taylor
et al., 2011).
The multiwavelength observations of 1ES 1218+304 over years provided a large amount of data in different bands. First, more than eleven years of Fermi-LAT observations will allow detailed temporal and spectral analyses of -ray data which combined with MAGIC/VERITAS data provides the -ray spectrum in the large energy range from 100 MeV to TeV. Moreover, using the new PASS 8 event selection and instrument response function, the spectrum can be investigated with improved statistics at higher energies, which is crucial for identifying the peak of the HE component. Frequent observations of 1ES 1218+304 with Neil Gehrels Swift Observatory (Gehrels
et al. (2004), hereafter Swift) provided unprecedented data both in the optical/UV and X-ray bands, allowing to perform a detailed investigation of the flux variation in these bands. This broadband coverage allows to constrain the SED of 1ES 1218+304 in different periods, which is then used for theoretical modeling. Together with Swift, the NuSTAR observation will shape the peak of the low energy component, which in turn allows to derive the main parameters characterizing the jet of 1ES 1218+304 (emitting electron distribution, magnetic field, jet power, etc.). 1ES 1218+304 belongs to the group of blazars that exhibit hard -ray spectrum from MeV/GeV to TeV band, which implies the emission is most likely produced from fresh accelerated electrons allowing to test various acceleration and cooling processes for the emitting particles. The combination of this with the available data, makes 1ES 1218+304 an ideal target for exploring the physics of blazar jets.
The purpose of this paper is to investigate the origin of broadband emission from 1ES 1218+304 by analyzing the most recent available data. In Section 2 the -ray data extraction and analyses are presented and discussed while X-ray and optical data analyses are in Section 3. The origin of broadband emission as well as the SED modeling are given in Section 4. The time dependent formation of emitting electron spectrum is discussed in Section 5. The discussions and conclusions are given in Section 6.
2 Fermi-LAT data extraction and analyses
Fermi-LAT is a pair-conversation telescope sensitive to MeV -rays (Atwood
et al., 2009). By default it operates in the survey mode scanning the entire sky every three hours. Operating since 2008, Fermi-LAT has provided a most detailed and deeper view of the -ray sky.
In the current study, -ray data from the observation of 1ES 1218+304 from August 2008 to April 2020 were obtained from the data portal and analyzed using the standard analysis procedure provided by the Fermi-LAT collaboration. The events in the energy range from 100 MeV to 600 GeV within a circular region of radius centered on the -ray position of 1ES 1218+304 were analyzed using Fermi ScienceTools (1.2.1) package with P8R2_SOURCE_V6 instrument response functions. A zenith angle cut of was applied to reduce the contamination due to the -rays from the Earth’s limb. The model file containing the spectral parameters of all known -ray emitting sources located within a + region was generated by make4FGLxml.py script based on the fourth Fermi-LAT source catalog of -ray sources (4FGL) (Abdollahi
et al., 2020). The Galactic and extragalactic diffuse -ray emission was parametrized using gll_iem_v07 and iso_P8R3_SOURCE_V2_v1 models. The parameters of all sources within the region around 1ES 1218+304 as well as the normalization of diffuse components were left free to vary during the fitting while the spectral parameters of all other sources were fixed to their values given in the 4FGL.
The data from a square region are divided into a spatial pixel size of and into 38 logarithmically equal energy bins. The best match between the model and the data is obtained by the binned likelihood analysis method implemented in gtlike tool. In the considered years, 1ES 1218+304 is detected with an overall significance of ( where and and are the maximum likelihood values obtained when fitting the observed data using the null and alternative hypotheses, respectively). The best fit results a relatively hard -ray photon index of with a -ray flux of in the energy range from 100 MeV to 600 GeV. The SED of 1ES 1218+304 generated by running the gtlike tool separately for ten energy bands is shown in Fig. 3.
The -ray light curve is generated to investigate the flux and photon index variation in time. The MeV events were only considered in the unbinned likelihood analyses, since, due to the hard spectrum of 1ES 1218+304 during short periods the number of photons is not enough at lower energies. The model file obtained from the binned likelihood analyses was used for the light curve calculations fixing the photon indexes of all background sources allowing only their normalization to vary. The normalization of both background models was fixed as no variability is expected from them. When the source detection significance is , only upper limit is computed.
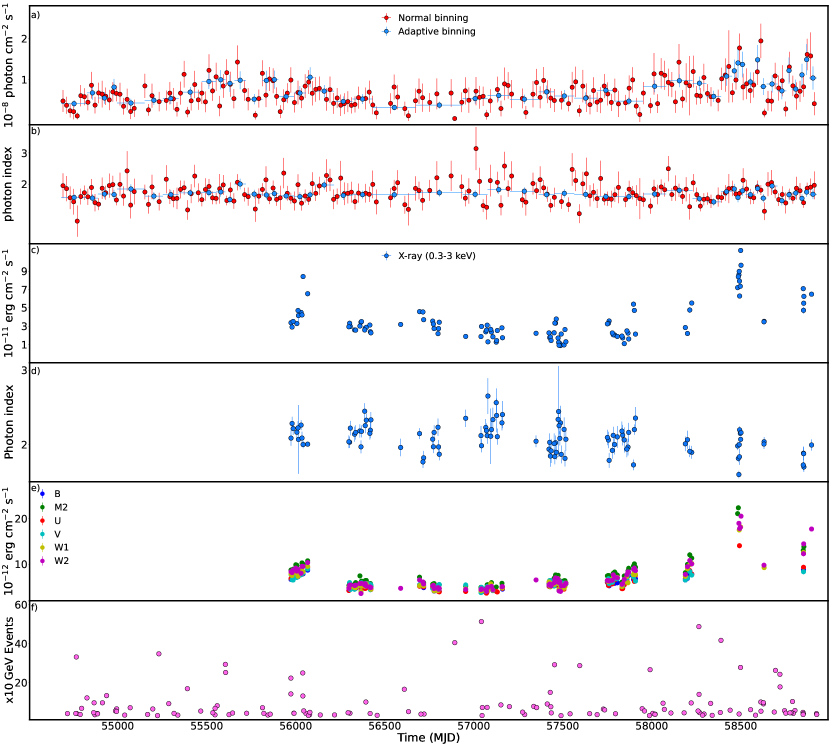
Fig. 1 panels a) and b) show the change of the -ray flux and photon index calculated for day intervals, respectively. Despite the increase of the -ray flux in some periods, no high-amplitude flares are observed. This is in agreement with the results of 4FGL where 1ES 1218+304 was flagged as variable source (i.e., the variability index over two-month intervals is Abdollahi
et al., 2020). The hard -ray photon index of 1ES 1218+304 implies that the emission is mostly at higher energies where the number of observed photons is low, so no comprehensive variability studies (e.g., short time scale variation) are possible. Next, using the adaptive binning algorithm (Lott et al., 2012), the -ray light curve is computed. In this method, the time bins have been optimized to have a fractional uncertainty of 20 % above the optimal energy of MeV (for the calculation of see Lott et al., 2012). The light curve generated by this strategy allows us to search variability, which is sometimes not visible in the regular time binning (Rani
et al., 2013a; Sahakyan &
Gasparyan, 2017; Baghmanyan et al., 2017; Zargaryan et al., 2017; Sahakyan et al., 2018; Gasparyan et al., 2018; Rani et al., 2013b). The flux and photon index calculated by adaptive binning method shown in light blue correspondingly in Fig. 1 a) and b). The photon index is relatively stable, being always below , which is natural, as HSPs usually have a hard -ray photon index but the -ray flux is sometimes above its average level. Despite large uncertainties, an increases in the flux had been observed around MJD 55578, 55879, 56080 and after 58000. For example, on MJD the flux above MeV was with a photon index of , with a detection significance. It corresponds to a flux of above 100 MeV. Or on MJD and , the -ray flux and photon index were and , and and , respectively. Therefore, even if the flux is above its average level ( times), the photon index does not change substantially. However, in normal binning, the hardest photon index of was observed from MJD 58262 to 58282 when the detection significance was . The spectrum in this period was investigated further. The source emission above GeV can be described by the photon index and the emission extending up to GeV with a flux of .
1ES 1218+304 is also a source of VHE photons due to its relatively hard photon index. Using the output model file obtained after running gtlike, with the gtsrcprob tool, the probability of VHE events from the direction of 1ES 1218+304 is computed. The distribution of highest-energy events ( GeV) is presented in Fig. 1 (f). Interestingly, there are many GeV photons within the inner region around 1ES 1218+304 with a high probability of being associated with it. For example, the , and GeV events with probabilities of , and , respectively, were observed within a circle of , and , respectively. The highest energy event of GeV has been detected on MJD 57042.8 within a circle of around 1ES 1218+304 with the probability to be associated with it.
3 X-ray and optical/UV observations
The X-ray emission from 1ES 1218+304 is investigated by analyzing the data collected by Swift XRT (Gehrels et al., 2004) and NuSTAR (Harrison et al., 2013). This provides X-ray data in a large energy range of keV which is important, as for HSPs this range corresponds to the highest energy tail of the low energy component.
3.1 Swift XRT
Swift observed 1ES 1218+304 116 times between 2008 and 2020. All XRT data are analyzed using the Swift XRTPROC pipeline, which is an automatic script for downloading and analyzing XRT data. The script first presented in Giommi (2015) and further updated in the context of the Open Universe initiative (Giommi
et al., 2018), is based on the official XRT Data Analysis Software (XRTDAS). For the source region, photons were counted over a circular region of 47 arcsec (-pixel) radius centered on the source position, while for the background region a larger annulus was used, with inner and outer radii of 120 and 200 arcsec, correspondingly, centered on the source and selected to avoid any contaminating sources. The count rate in some observations was above , so the data is significantly affected by the pileup in the inner part of the point-spread function (Moretti
et al., 2005). This effect was removed by excluding the events within a -pixel radius circle centered on the source position. In this case, the source count selection radius was increased to 70 arcsec. The individual spectra were fitted with XSPEC12.10.1 adopting an absorbed power-law and log-parabola models, applying Cash statistics on ungrouped data.
The 0.3-3, 0.5-2, 2-10, 3-7 keV X-ray fluxes as well as the 0.3-10 keV photon index are computed for each observation. In the X-ray band, the flux gradually increases around MJD 58500 with the highest 0.3-3 keV X-ray flux of on MJD 58499.1, which is by a factor of higher than the mean X-ray flux (). It should be noted that from MJD 58482 to 58501, 1ES 1218+304 was in an active X-ray emission state, when the 0.3-3 keV flux changed in the range of . Similar increases are also observed in the other considered intervals for the flux computation. The X-ray photon index varies as well, being of the order of for most of the time, but on MJD 58489.1 it was which is the hardest index recorded for this source (corrected for pile-up effect). There are thirty-four periods with a photon index of and six with . Fig. 3 shows the XRT spectra when 1ES 1218+304 was in a bright (Obsid 30376106), moderately bright (Obsid 30376101), and average (Obsid 30376042) X-ray emitting states, as well as when the X-ray emission is with the hardest X-ray photon index (Obsid 30376099).
3.2 NuSTAR
NuSTAR is a hard X-ray focusing satellite comprised of two Focal Plane Modules (FPMs): FPMA and FPMB, providing continuous coverage over a broad bandpass of 3-78 keV (Harrison
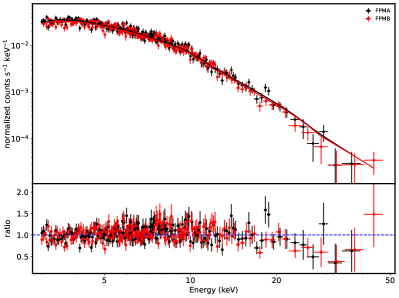
et al., 2013). 1ES 1218+304 was observed by NuSTAR on MJD 57349 with a net exposure of ksec. The NuSTAR data were processed with the NuSTARDAS software package available within HEASOFT package using the latest version of the calibration database (CALDB). The event file is cleaned and calibrated using nupipeline tool. The spectra of 1ES 1218+304 in the energy range of 3-79 keV is extracted from a circular region of 50′′ radius centered at the source position whereas the background counts are extracted from a circle of 80′′ from a nearby region on the same chip and avoiding source contamination. The spectra were binned so as to have at least 30 counts and fitted assuming an absorbed power-law model.
Initially, the energy range from 3 to 79 keV have been considered for the fit. However, the count rate rapidly decreases above 50 keV and the background starts to dominate. Thus, the source parameters are estimated in the energy range 3-50 keV. The best fit resulted in and with for 364 degree of freedom. The spectra of FPMA and FPMB are shown in Fig. 2 with black and red, respectively. The high energy tail of X-ray spectra cannot be fitted satisfactorily by a simple power-law, and the model deviates from the data. Thus, an additional fit with a log-parabola is performed. The best-fit spectral parameters of the log-parabola fit are: , and with .
3.3 Swift UVOT
1ES 1218+304 was also observed with the UVOT instrument of Swift observatory. UVOT provides observations in three optical (V,B,U) and three UV (W1,M2,W2) filters (Roming
et al., 2005). All the data available from the observations of 1ES 1218+304 were downloaded from the Swift archive and reduced using the HEAsoft version 6.26 with the latest release of of HEASARC CALDB. Source counts were extracted using a 5′′ radius for all single exposures and all filters, while the background was estimated from different positions from a region with 20′′ radius not being contaminated with any signal from the nearby sources. uvotsource tool was used to derive the magnitudes which were converted to fluxes using the conversion factors provided by Poole et al. (2008). Then, the fluxes were corrected for extinction using the reddening coefficient from the Infrared Science Archive 111 http://irsa.ipac.caltech.edu/applications/DUST/.
The flux measured for all six filters (V, B, U, W1, M2, and W2) is sown in Fig. 1 e). The light curve shows that like in the X-ray band, also the optical/UV flux shows few active periods. In the average state the flux in all filters is around , which around MJD 56035, 57870 and 58200 moderately increases up to . Strong brightening of the optical/UV flux was observed after MJD 58482 when the flux reached ; the absolute highest fluxes of and were observed in M2 and W2 filters on MJD 58486.10 and 58501.20, respectively. Fig. 3 shows the UVOT spectra for the average state (Obsid 30376044, pink) state and when the highest flux in U, W1, M2 and W2 filters were observed around MJD (light blue).
4 The Origin of Broadband Emission
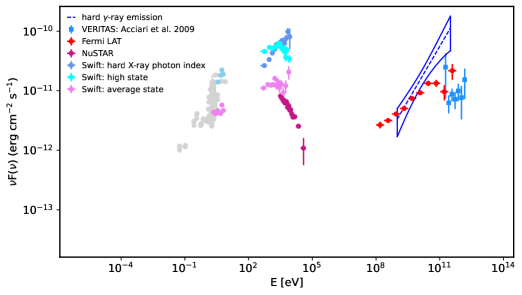
The multiwavelength dataset analyzed in this paper allows to build broadband SEDs of 1ES 1218+304 in different emission states. The resulting broadband SED of 1ES 1218+304 is shown in Fig. 3, displaying the standard double peaked structure. Archival data are extracted from SSDC SED Builder tool 222https://tools.ssdc.asi.it/SED/ and are shown in gray. The Swift UVOT/XRT data from different states of the source are shown together with the NuSTAR spectrum. In the average state (pink), the 0.3-10 keV X-ray photon index is which softens to in the 3-50 keV band. In the bright state (cyan), the photon index is but it can be as hard as on MJD 58489.1 (dark blue circle). In the -ray band, in addition to the -ray spectra averaged over years, the spectrum in the period of the hardest -ray emission () is shown with a bow-tie. Even though the -ray light curve reveals periods when the flux moderately increases, their duration ( 20-30 days) and the low amplitude () do not impact the averaged -ray spectra in Fig. 3. To demonstrate this, the -ray data analysis was performed limiting the time up to MJD 58500 which resulted in and , in agreement with the results obtained for years. The VHE -ray data are from the VERITAS observations after EBL correction (Acciari
et al., 2009).
The multiwavelength SED in Fig. 3 shows dramatic changes in the spectrum of 1ES 1218+304 , especially in the X-ray band. In the quiescent state, the NuSTAR spectrum is a continuation of that of XRT and they together constrain the HE tail of the synchrotron component. Moreover, in quiescent state, the synchrotron and IC peaks have similar luminosity but unlike the HE peak which is relatively stable, the X-ray flux increases substantially (cyan data) and the low energy peak luminosity clearly dominates over that at HEs. In the active state, apart from the flux increase, the X-ray spectrum also hardened, shifting towards HEs (light blue data). Such an X-ray spectrum cannot be associated with the synchrotron component dominating at lower energies, being most likely due to another component. For example, this hard X-ray emission can be due to Comptonization of disc photons in the jet (Celotti et al., 2007). However, the origin of this X-ray emission cannot be investigated because of the absence of contemporaneous multiwavelength data. This change of X-ray spectrum will be further discussed in Section 6.
The HE -ray data clearly demonstrate that the peak of the second component is above eV which cannot be constrained even when VHE -ray data are considered because of the large uncertainty in the measurement of the VHE -ray photon index (). However, independently of the VHE -ray data, the constraint on the synchrotron spectrum and hence on the distribution of emitting electrons will allow to shape the second component.
The SED of 1ES 1218+304 in Fig. 3 is modeled in order to gain further insight of the physical processes at work in its jet. The broadband spectrum of 1ES 1218+304 in the quiescent state is modeled within a simple one zone leptonic scenario as a large amount of data is available. In this model, the low energy data are interpreted by synchrotron emission of relativistic electrons while the HE component - as SSC radiation from a compact emitting region (Bloom &
Marscher, 1996b; Ghisellini et al., 1985b; Marscher &
Gear, 1985; Chiaberge &
Ghisellini, 1999). It is assumed that this emission region is a spherical blob moving relativistically along the axis of the jet with a Lorentz factor of and because of this, the emission will be strongly Doppler boosted in the observer frame by a factor of where is the angle between the direction of observation and the axis of the jet. For a small viewing angle . It is assumed that the blob is filled with an electron (or electron/positron) population in an isotropic magnetic field. For the electron energy distribution we consider a broken power-law (BPL) function in the form of
| (1) |
where defines the total electron energy , and are the low and high indexes of electrons, correspondingly below and above the break energy . is the minimum energy of electrons in the jet frame. The electron distribution given by Eq. 1 is a result of injection and cooling of particles (Kardashev, 1962). As an alternative, a power-law with an exponential cut-off (PLEC) distribution of particles is assumed:
| (2) |
where is the highest energy cut-off in the electron spectrum. This electron distribution is naturally formed when the acceleration is limited by cooling or dynamical time scales (e.g., Yan et al. (2013); Zheng
et al. (2018); Sahakyan (2020); Baring et al. (2017)). In the next section, time dependent formation of these spectra is discussed in the context of particle acceleration and cooling.
The emitting region is characterized by the electron energy distribution (, , ), magnetic field, Doppler boosting and its size. The upper limit on the size of the emission region can be derived from the relation , where the variability time can be inferred from the -ray light curve when the flare rise or decay time can be estimated. In the HE -ray band, 1ES 1218+304 did not show prominent flares, while in the VHE -ray band, the flux doubling time was observed to be day (Acciari
et al., 2010) which limits the emission region size by . Assuming a typical value for , the emission region size would be . Also, following Rüger et al. (2010), for the same the data is modeled considering .
In the fit, the model free parameters and their uncertainties are estimated using the Markov chain Monte Carlo (MCMC) method in two approaches. Initially, the spectral model parameters have been derived through MCMC sampling of their likelihood distributions using a modified version of naima package (e.g., Sahakyan &
Gasparyan, 2017; Gasparyan et al., 2018). Then, the fitting is done with the open source package JetSet (Massaro et al., 2006; Tramacere et al., 2011, 2009), initially optimizing the parameter space with Minuit minimizer, then applying MCMC sampling centered on the best fit values. Both methods produce similar results.
4.1 Broadband SED fitting
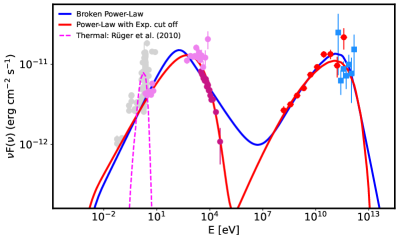
The SED modeling results are shown in Fig. 4 with the corresponding parameters listed in Table 1. In addition to the synchrotron/SSC component, a thermal component (a blackbody with a temperature of K) from Rüger et al. (2010) is shown in magenta. This corresponds to the thermal emission of the host galaxy, showing that the UVOT data in the average state are likely dominated by the nonthermal emission from the jet rather than by thermal emission from the host galaxy. It can be seen that the data up to the X-ray band (including NuSTAR) are explained by synchrotron radiation of electrons. The SSC component is dominant above MeV and it describes the data up to the VHE -ray band. When the BPL distribution of electrons is considered (blue line in Fig. 4), the data can be modeled when changes to at the break energy of . So, the index change is significantly different from that expected when the electrons undergo radiative losses effectively (). The archival data allows to put a limit on the to be : for larger the synchrotron component will decline in the low energy band which is in disagreement with the observed data. The magnetic field is estimated to be G and the emission region is particle-dominated with an equipartition ratio between the particle energy density and magnetic field energy density of .
The modeling with a PLEC distribution of electrons better explains the SED (red line in Fig. 4); the goodness of fit (reduced square) is . The power-law index is not substantially different from that estimated in the previous case. The synchrotron peak and NuSTAR spectrum allowed to measure the cut-off energy with a high accuracy, , which in its turn constrains the HE component which decreases above eV. A relatively high value of the minimal energy of the radiating electrons, is obtained which is not exceptional for blazar modeling, and high is often used to describe the emission from HSPs (e.g., Abdo
et al., 2011; Archer
et al., 2018; MAGIC
Collaboration et al., 2020). The magnetic field is mostly constrained by fitting the low energy component; the synchrotron component depends on the product of and , so G is the same as in the previous case. Again, the electron energy density is higher than that of the magnetic field, .
The modeling parameters when are given in Table 4 in the brackets. As compared with the modeling when , a noticeable difference in this case is that the electron distribution is with a softer power-law index ( and ) and the magnetic field is lower ( G). As the peak of the low energy component is well defined by the data, when increasing the Doppler factor (and hence the luminosity), a lower magnetic field would be required to explain the same data. This, in its turn increases the particle dominance and now .
The jet power in the form of magnetic field and particles is given in Table 1. The luminosities have been computed for a pure electron/positron jet, since the proton content is not well known, and these can be considered as the lower limit. The absolute jet power () is significantly below the Eddington luminosity for a black hole mass () estimated from the properties of the host galaxy in the optical band (Rüger et al., 2010).
| PLEC | BPL | |
|---|---|---|
| – | ||
5 Time dependent formation of electron spectrum: Electron cooling
The multiwavelength modeling presented in the previous section allowed to put a constraint on the parameters of emitting electrons. These parameters contain valuable information on the processes taking place in the jet of 1ES 1218+304 . For example, the power-law index of the emitting electrons mostly defined by the acceleration mechanisms could be used to test the process by which the particles gain energy. On the other hand, the break or cutoff energy allows to evaluate the electron radiation cooling or dynamical timescales, which helps to understand the particle interaction processes. Thus, the parameters reported in Table 1 can be used for further exploring the physics of 1ES 1218+304 jet.
The spectra given in Eqs. 1 and 2 are ad-hoc assumption of emitting particles used for modeling the SED. However, the formation of the particle spectrum is governed by the injection and cooling of electrons. To calculate the temporal evolution of the electron distribution [], it is necessary to solve integro-differential equations, describing the losses and injection of relativistic electrons in the emitting region (Kardashev, 1962). In this case the kinetic equation has the following form
| (3) |
where is the radiation loss term, is the characteristic escape time and is the rate of electron injection. The emitting region electrons can loose energy by synchrotron and SSC processes, so where is either the energy density of the magnetic field () or the density of synchrotron radiation (). The latter can be approximated by where is the total synchrotron luminosity in the jet frame. The modeling shows that so which is significantly less than . This implies that the electrons are predominantly cooled through interaction with the magnetic field. However, usually should be taken into account, considering the non-linear effects in the particle cooling which is particularly strong when the emission is produced in a very compact region . In this case, also due to the narrow distribution of synchtron photons (low energy component in Fig. 4), its density is lower than that of the magnetic field. Accordingly, the radiation loss term in Eq. 3 is replaced by pure synchrotron cooling.
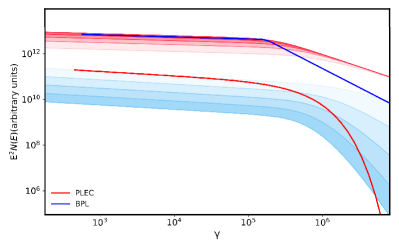
In the case of no escape (), that is all the particles cool inside the emitting region, a BPL spectrum of the electrons will be formed when the power-law index changes as . The break energy will be defined by equating the cooling time with the evolution time of the system. In Fig. 5 the evolution of the spectrum when the particles are constantly injected () into the emitting region with is shown for different dynamical time scales; the red gradient shows the spectrum with increasing time. After the system evolves up to sec, a break at will be formed in the spectrum; for shorter times the break is at higher energies. However, as expected, the transition at the break energy is smooth () which cannot explain the estimated electron spectrum obtained from the data modeling (blue spectrum in Fig. 5). A steep electron spectrum is required after the break to explain the X-ray data; the NuSTAR spectrum completely defines the power-law index of the electrons after the break to be . It means that the power law index of electrons before the break should be but in that case their -ray emission will be nearly flat in disagreement with the data (). The electron power-law indexes before and after the break are rather well defined by the X-ray and -ray data, so when changing the values of and reported in Table 1 to get a cooling break, the data will not be satisfactorily reproduced. When assuming a constant injection of particles with their escape timescale depending on the energy (), more gradual transition will be achieved at the cooling break when , but again a component with a softer spectrum cannot be formed. Most likely, this break is due to the characteristics of the acceleration processes and for an unknown reason the change in the electrons spectrum is . Or alternatively, the inhomogeneities in the emitting region could also cause a stronger change in the emitting electron spectrum, which might produce BPL spectrum of electrons with (Reynolds, 2009).
In the case the electrons can escape from the emitting region, a standard BPL spectrum will be formed again, only the break will correspond to the electron energy at which the escape and cooling timescales are equal (). For example, a BPL spectrum at can be formed when . However, the transition at the break is again not sharp enough to explain the observed data.
Alternative to BPL, a PLEC spectrum can be formed as a result of time averaging of the injected particle spectrum, i.e., after the abrupt power-law injection of the particles () they start to cool in the emitting region. In time, the HE tail of the particle distribution steepens and a cut-off will be formed. In order to demonstrate this, it is assumed that the injection of the particles stops at and then the electron distribution evolution up to is followed by setting and G. The blue gradient in Fig. 5 corresponds to the electron spectrum calculated for different time intervals. Initially, only the HE electrons () cool or escape the region, declining the injected electron spectrum only at higher energies. Then, with the time the cut-off energy moves to lower energies and after the break is at the same level as that estimated from the data modeling (). In principle, by changing the parameters (injection and escape times, etc.), it is possible to satisfactorily reproduce the PLEC spectrum of electrons with the parameters given in Table 1. It should be noted that such an exponential cut-off will be also formed in the case of an episodic injection with an energy dependent escape.
6 Discussions and Conclusions
The HSP blazars having the second peak in the SED toward the higher energies are extremely interesting sources for HE and VHE -ray observations. For HSPs, the X-ray spectrum limits the synchrotron component below keV/MeV band and the -ray emission is due to IC scattering. In the -ray band, HSPs appear with a moderately hard photon index () with a mean of (Ajello
et al., 2020), so the emitting particles are accelerated to much higher energies as compared with LSPs or ISPs. This implies the multiwavelength observations have potential not only for investigation of the emission features in different bands but also for testing various acceleration and emission scenarios in the blazar jets.
The -ray emission from 1ES 1218+304 is investigated during more than eleven years, from August 2008 to April 2020. Its long time-averaged -ray spectrum is hard with a photon index of and with a flux of . The emission extends up to GeV with a detection significance of . The sub-GeV source photons are relatively less, which prevents detailed variability studies in short time scales. Although the adaptively binned light curve shows several periods (e.g., on MJD , and ) when the flux moderately increased as compared to its average level. During these periods the data accumulation of 20-30 days is enough to reach the required uncertainty of 20 % (usually days are required). The photon index of the source is relatively constant with the hardest and softest values being and , respectively. The hard emission observed in MJD extends up to GeV with a flux of and photon index of above GeV. In general, the spectrum measured by Fermi-LAT agrees well with that non-simultaneously measured by VERITAS at VHE -rays (after EBL correction).
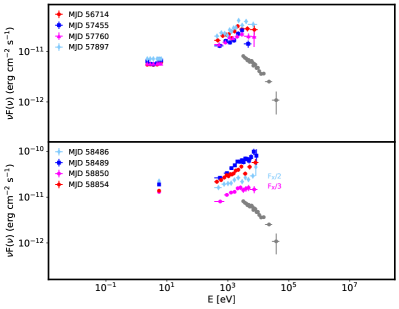
As a bright source in the X-ray band, 1ES 1218+304 shows interesting features in the 0.3-10 keV band. First of all, an X-ray flux amplification in different observations is found with a highest X-ray flux of . In the hard X-ray band, as observed by NuSTAR, the spectrum is soft with photon index. In the quiescent state, the Swift XRT and NuSTAR measured spectra are in a good agreement, allowing to measure the 1ES 1218+304 spectrum in the broad band of 0.3-50 keV. Yet, the Swift XRT observations reveal interesting modification of the X-ray photon index in some observations. It is mostly above , as expected for HPS, but there are periods when the photon index hardens to . In Fig. 6 eight periods when such hard photon index is observed are presented together with Swift UVOT and NuSTAR data where the modification of X-ray spectra is evident. In the quiescent state, the nearly flat spectrum measured by Swift XRT and the soft X-ray photon index obtain by NuSTAR clearly imply that the synchrotron peak is Hz. However, in the specific periods shown in Fig. 6, the position of the synchrotron peak moves above Hz and 1ES 1218+304 shows characteristics similar to EHSPs. This peak frequency shift is more evident and drastic for the periods highlighted in the lower panel of Fig. 6. It should be noted that the optical/UV flux did not change substantially, but not always all the filters are available for detailed investigation. During the observations on MJD 57760 and 57897 the UVOT data could either correspond to the peak of the host galaxy emission (thus appear with a nearly flat spectrum) or be due to the synchrotron emission from the jet electrons but from a different component that produces hard X-ray emission. However, due to the lack of data no definite conclusion can be drawn. Such temporary extreme behavior of HPSs has already been observed for Mrk 501 (Pian
et al., 1998) and 1ES 2344+514 (Giommi
et al., 2000). In these extreme periods, the high counts () allowed precise estimation of the photon index which was and on MJD 58489 and 58854, respectively, and being within for the other periods. Also, the MAGIC and VERITAS observations of 1ES 1218+304 reveal an exceptional hard photon index in the TeV band (), though not simultaneous with the X-ray observations, which shows 1ES 1218+304 might have features similar to those of BL Lacs extreme in the -ray band. Along with these features also in the -ray band 1ES 1218+304 does not show a short time scale variability compatible with the behaviour of EHSPs. Yet, in the -ray band some of VHE photons from the direction of 1ES 1218+304 were observed around those extreme X-ray periods. For example, VHE events with , and GeV were observed on MJD 57453.7, 58498.3 and 57429.6, respectively, within a circle of around 1ES 1218+304 and with a probability to be associated with it. These periods overlap with some highlighted in Fig. 6. The are also GeV events emitted close to the periods in Fig. 6 which come from a bit larger circular region or with a smaller probability of association with 1ES 1218+304 . However, considering 1ES 1218+304 is the only source in the ROI with emission extending above tens of GeV, these photons are most likely also associated with it. This shows that during the extreme X-ray emission periods of 1ES 1218+304 , also GeV/TeV photons were efficiently produced which hints at possible transition of 1ES 1218+304 to an extreme BL Lac from the viewpoint of both synchrotron peak and VHE -ray photon index. It is expected that such extreme periods are hidden in the spectrum of HSP blazars and sometimes the transition of the synchrotron peak to higher frequencies is possible.
The quiescent state SED is modeled within a one-zone leptonic scenario. The synchrotron/SSC model well explains the observed data and can reproduce both low and HE peaks. The low energy photons with a peak at Hz, well constrained by XRT and NuSTAR data, are IC up scattered to higher energies Hz, explaining the second peak. The derived magnetic field in the jet emitting region is G for , the system being slightly particle dominated which is in agreement with the SED modeling of other HSPs; usually within the leptonic scenario the HSP SEDs can be modeled when the emitting region is by far out of equipartition.
In this case the equipartition is between the magnetic field and nonthermal electron energy density, and it would break when considering the jet protons, the content of which is unknown. The energy density of electrons strongly depends on which in this case should be considered as an upper limit; in the case when the SED can be still described well but when , the model starts to drop in disagreement with the observed data. When the modeling infers an extremely out-of-equipartition condition in the jet, additional jet power is required which is however limited by the Eddington accretion rate (e.g., Dermer et al., 2015). As an alternative, in highly magnetized environments the combined lepto-hadronic modeling would allow to choose parameters and explain the data when the system is close to the equipartition condition (e.g., modeling of 3C 279 Bottacini et al., 2016).
The one-zone SSC model was also used to model the 1ES 1218+304 SED in the previous studies (e.g., Rüger et al., 2010; Weidinger &
Spanier, 2010; Costamante
et al., 2018; Singh
et al., 2019). For example, in Rüger et al. (2010), using a time dependent code taking into account cooling of electrons and time evolution of photons the SED of 1ES 1218+304 was modeled for the electron distribution with and . Or in Singh
et al. (2019), a log-parabolic distribution function for the electrons can reproduce the observed data for index of and curvature parameter of . Thus, in the previous modelings even if different assumptions were made for the emitting region size and Doppler boosting, the parameters obtained for the emitting electrons do not differ significantly from those obtained here. The energetics (e.g., luminosity or energy density) is different in all modelings as it depends on and the values of which were different. However, like in all the models, here too . As an alternative to leptonic models, the HE bump of 1ES 1218+304 can be modeled by the proton synchrotron component when the magnetic field in the region is G and the protons are accelerated up to ultra high energies eV and (Cerruti et al., 2015).
The BPL and PLEC electron spectra were used to model the SED. In general, the spectra of electrons is controlled by several timescales, namely, the cooling time, the injection duration and the escape time. In the continuous injection of particles and in the absence of escape, the traditional cooling break formed in the electron spectrum can not explain the tail of the high energy component which requires much stepper decrease: the cooled electron spectrum above will exceed that obtained from the modeling. The change in the electron spectrum is most likely caused by the nature of the acceleration process. Alternatively, Reynolds (2009) showed that when synchrotron losses are dominating, spectral breaks in the electrons spectrum differing from can be naturally formed in inhomogeneous sources. These can be straightforwardly applied to pulsar wind nebulae or knots in large-scale jets, but may be applied also wherever bulk flows of relativistic material are involved, as in the case of relativistic jets. On the other hand, the time limited power-law injection of electrons which cool in the emitting region will stabilize and form a cutoff in the electron distribution in time. The value of cut-off energy depends on the time for which the system evolves and obtained from the SED modeling can be naturally obtained. The required time for dynamical evolution of the system is 3-4 which is in agreement with the absence of flaring activities in -ray band in short time scales. In principle, more complicated scenarios for the formation of a curved spectrum are possible, but here a simplified scenario when the curvature is caused by the injection/cooling or energy-independent escape from the emitting region, is discussed.
As a powerful HSP, 1ES 1218+304 has always been monitored in various bands; it is still debatable whether 1ES 1218+304 is a normal HSP or an extreme blazar. Some of the Swift XRT observations analyzed here appeared with an extremely hard photon index of shifting the X-ray spectrum toward higher frequencies, making 1ES 1218+304 an episodic extreme synchrotron blazar. It should be noted that a smooth transition within the blazar classification is emerging in some observations, e.g., a classical FSRQ shows a BL Lac features during the flares (e.g., Cutini
et al., 2014; Sbarrato et al., 2012; Cavaliere &
D’Elia, 2002; Giommi et al., 2012) or HSPs appear as extreme blazars (e.g., Pian
et al., 1998; Giommi
et al., 2000; Ghisellini, 1999). Identification of such hidden periods when HSPs are in an extreme emission state with a large multifrequency coverage can be crucial for understanding the physics of extreme blazars and investigation of the changes in the jet parameters causing their extreme behaviour.
Acknowledgements
I thank the anonymous referee for constructive comments. This work was supported by the RA MoESCS Committee of Science, in the frames of the research project No 18T-1C335. This work used resources from the ASNET cloud and the EGI infrastructure with the dedicated support of CESGA (Spain).
Data availability
The data underlying this article will be shared on reasonable request to the corresponding author.
References
- Abdo et al. (2010) Abdo A. A., et al., 2010, ApJ, 716, 30
- Abdo et al. (2011) Abdo A. A., et al., 2011, ApJ, 736, 131
- Abdollahi et al. (2020) Abdollahi S., et al., 2020, ApJS, 247, 33
- Acciari et al. (2009) Acciari V. A., et al., 2009, ApJ, 695, 1370
- Acciari et al. (2010) Acciari V. A., et al., 2010, ApJ, 709, L163
- Ajello et al. (2020) Ajello M., et al., 2020, ApJ, 892, 105
- Albert et al. (2006) Albert J., et al., 2006, ApJ, 642, L119
- Ansoldi et al. (2018) Ansoldi S., et al., 2018, ApJ, 863, L10
- Araudo et al. (2010) Araudo A. T., Bosch-Ramon V., Romero G. E., 2010, A&A, 522, A97
- Archer et al. (2018) Archer A., et al., 2018, ApJ, 862, 41
- Atwood et al. (2009) Atwood W. B., et al., 2009, ApJ, 697, 1071
- Baghmanyan et al. (2017) Baghmanyan V., Gasparyan S., Sahakyan N., 2017, ApJ, 848, 111
- Baring et al. (2017) Baring M. G., Böttcher M., Summerlin E. J., 2017, MNRAS, 464, 4875
- Beall & Bednarek (1999) Beall J. H., Bednarek W., 1999, ApJ, 510, 188
- Bednarek & Banasiński (2015) Bednarek W., Banasiński P., 2015, ApJ, 807, 168
- Bednarek & Protheroe (1997) Bednarek W., Protheroe R. J., 1997, MNRAS, 287, L9
- Błażejowski et al. (2000) Błażejowski M., Sikora M., Moderski R., Madejski G. M., 2000, ApJ, 545, 107
- Bloom & Marscher (1996a) Bloom S. D., Marscher A. P., 1996a, ApJ, 461, 657
- Bloom & Marscher (1996b) Bloom S. D., Marscher A. P., 1996b, ApJ, 461, 657
- Bonnoli et al. (2015) Bonnoli G., Tavecchio F., Ghisellini G., Sbarrato T., 2015, MNRAS, 451, 611
- Bottacini et al. (2016) Bottacini E., Böttcher M., Pian E., Collmar W., 2016, ApJ, 832, 17
- Böttcher et al. (2013) Böttcher M., Reimer A., Sweeney K., Prakash A., 2013, ApJ, 768, 54
- Cavaliere & D’Elia (2002) Cavaliere A., D’Elia V., 2002, ApJ, 571, 226
- Celotti et al. (2007) Celotti A., Ghisellini G., Fabian A. C., 2007, MNRAS, 375, 417
- Cerruti et al. (2015) Cerruti M., Zech A., Boisson C., Inoue S., 2015, MNRAS, 448, 910
- Cerruti et al. (2019) Cerruti M., Zech A., Boisson C., Emery G., Inoue S., Lenain J.-P., 2019, MNRAS, 483, L12
- Chiaberge & Ghisellini (1999) Chiaberge M., Ghisellini G., 1999, MNRAS, 306, 551
- Costamante et al. (2001) Costamante L., et al., 2001, A&A, 371, 512
- Costamante et al. (2018) Costamante L., Bonnoli G., Tavecchio F., Ghisellini G., Tagliaferri G., Khangulyan D., 2018, MNRAS, 477, 4257
- Cutini et al. (2014) Cutini S., et al., 2014, MNRAS, 445, 4316
- Dar & Laor (1997) Dar A., Laor A., 1997, ApJ, 478, L5
- Dermer & Schlickeiser (1994) Dermer C. D., Schlickeiser R., 1994, ApJS, 90, 945
- Dermer et al. (2015) Dermer C. D., Yan D., Zhang L., Finke J. D., Lott B., 2015, ApJ, 809, 174
- Gao et al. (2019) Gao S., Fedynitch A., Winter W., Pohl M., 2019, Nature Astronomy, 3, 88
- Gasparyan et al. (2018) Gasparyan S., Sahakyan N., Baghmanyan V., Zargaryan D., 2018, ApJ, 863, 114
- Gehrels et al. (2004) Gehrels N., et al., 2004, ApJ, 611, 1005
- Ghisellini (1999) Ghisellini G., 1999, Astroparticle Physics, 11, 11
- Ghisellini & Tavecchio (2009) Ghisellini G., Tavecchio F., 2009, MNRAS, 397, 985
- Ghisellini et al. (1985a) Ghisellini G., Maraschi L., Treves A., 1985a, A&A, 146, 204
- Ghisellini et al. (1985b) Ghisellini G., Maraschi L., Treves A., 1985b, A&A, 146, 204
- Giommi (2015) Giommi P., 2015, Journal of High Energy Astrophysics, 7, 173
- Giommi & Padovani (1994) Giommi P., Padovani P., 1994, MNRAS, 268, L51
- Giommi et al. (2000) Giommi P., Padovani P., Perlman E., 2000, MNRAS, 317, 743
- Giommi et al. (2012) Giommi P., Padovani P., Polenta G., Turriziani S., D’Elia V., Piranomonte S., 2012, MNRAS, 420, 2899
- Giommi et al. (2018) Giommi P., et al., 2018, arXiv e-prints, p. arXiv:1805.08505
- Harrison et al. (2013) Harrison F. A., et al., 2013, ApJ, 770, 103
- IceCube Collaboration et al. (2018a) IceCube Collaboration et al., 2018a, Science, 361, 147
- IceCube Collaboration et al. (2018b) IceCube Collaboration et al., 2018b, Science, 361, eaat1378
- Kardashev (1962) Kardashev N. S., 1962, Soviet Ast., 6, 317
- Keivani et al. (2018) Keivani A., et al., 2018, ApJ, 864, 84
- Korochkin et al. (2020) Korochkin A., Neronov A., Semikoz D., 2020, A&A, 633, A74
- Liao et al. (2018) Liao N.-H., Xin Y.-L., Liang Y.-F., Guo X.-L., Li S., He H.-N., Yuan Q., Fan Y.-Z., 2018, preprint, (arXiv:1807.05210)
- Lott et al. (2012) Lott B., Escande L., Larsson S., Ballet J., 2012, A&A, 544, A6
- MAGIC Collaboration et al. (2020) MAGIC Collaboration et al., 2020, arXiv e-prints, p. arXiv:2002.00129
- Mannheim (1993) Mannheim K., 1993, A&A, 269, 67
- Mannheim & Biermann (1989) Mannheim K., Biermann P. L., 1989, A&A, 221, 211
- Maraschi et al. (1992) Maraschi L., Ghisellini G., Celotti A., 1992, ApJ, 397, L5
- Marscher & Gear (1985) Marscher A. P., Gear W. K., 1985, ApJ, 298, 114
- Massaro et al. (2006) Massaro E., Tramacere A., Perri M., Giommi P., Tosti G., 2006, A&A, 448, 861
- Moretti et al. (2005) Moretti A., et al., 2005, in Siegmund O. H. W., ed., Society of Photo-Optical Instrumentation Engineers (SPIE) Conference Series Vol. 5898, Proc. SPIE. pp 360–368, doi:10.1117/12.617164
- Mücke & Protheroe (2001) Mücke A., Protheroe R. J., 2001, Astroparticle Physics, 15, 121
- Mücke et al. (2003) Mücke A., Protheroe R. J., Engel R., Rachen J. P., Stanev T., 2003, Astroparticle Physics, 18, 593
- Murase et al. (2018) Murase K., Oikonomou F., Petropoulou M., 2018, ApJ, 865, 124
- Padovani et al. (2016) Padovani P., Resconi E., Giommi P., Arsioli B., Chang Y. L., 2016, MNRAS, 457, 3582
- Padovani et al. (2017) Padovani P., et al., 2017, A&ARv, 25, 2
- Padovani et al. (2018) Padovani P., Giommi P., Resconi E., Glauch T., Arsioli B., Sahakyan N., Huber M., 2018, MNRAS, 480, 192
- Pian et al. (1998) Pian E., et al., 1998, ApJ, 492, L17
- Poole et al. (2008) Poole T. S., et al., 2008, MNRAS, 383, 627
- Rani et al. (2013a) Rani B., et al., 2013a, A&A, 552, A11
- Rani et al. (2013b) Rani B., Lott B., Krichbaum T. P., Fuhrmann L., Zensus J. A., 2013b, A&A, 557, A71
- Resconi et al. (2017) Resconi E., Coenders S., Padovani P., Giommi P., Caccianiga L., 2017, MNRAS, 468, 597
- Reynolds (2009) Reynolds S. P., 2009, ApJ, 703, 662
- Righi et al. (2019) Righi C., Tavecchio F., Pacciani L., 2019, MNRAS, 484, 2067
- Roming et al. (2005) Roming P. W. A., et al., 2005, Space Sci. Rev., 120, 95
- Rüger et al. (2010) Rüger M., Spanier F., Mannheim K., 2010, MNRAS, 401, 973
- Sahakyan (2018) Sahakyan N., 2018, ApJ, 866, 109
- Sahakyan (2019) Sahakyan N., 2019, A&A, 622, A144
- Sahakyan (2020) Sahakyan N., 2020, A&A, 635, A25
- Sahakyan & Gasparyan (2017) Sahakyan N., Gasparyan S., 2017, MNRAS, 470, 2861
- Sahakyan et al. (2018) Sahakyan N., Baghmanyan V., Zargaryan D., 2018, A&A, 614, A6
- Sbarrato et al. (2012) Sbarrato T., Ghisellini G., Maraschi L., Colpi M., 2012, MNRAS, 421, 1764
- Sikora et al. (1994) Sikora M., Begelman M. C., Rees M. J., 1994, ApJ, 421, 153
- Singh et al. (2019) Singh K. K., Bisschoff B., van Soelen B., Tolamatti A., Marais J. P., Meintjes P. J., 2019, MNRAS, 489, 5076
- Tavecchio et al. (2011) Tavecchio F., Ghisellini G., Bonnoli G., Foschini L., 2011, MNRAS, 414, 3566
- Taylor et al. (2011) Taylor A. M., Vovk I., Neronov A., 2011, A&A, 529, A144
- Tramacere et al. (2009) Tramacere A., Giommi P., Perri M., Verrecchia F., Tosti G., 2009, A&A, 501, 879
- Tramacere et al. (2011) Tramacere A., Massaro E., Taylor A. M., 2011, ApJ, 739, 66
- Urry & Padovani (1995) Urry C. M., Padovani P., 1995, PASP, 107, 803
- Véron-Cetty & Véron (2003) Véron-Cetty M. P., Véron P., 2003, A&A, 412, 399
- Wang et al. (2018) Wang K., Liu R.-Y., Li Z., Wang X.-Y., Dai Z.-G., 2018, preprint, (arXiv:1809.00601)
- Weidinger & Spanier (2010) Weidinger M., Spanier F., 2010, A&A, 515, A18
- Wilson et al. (1979) Wilson A. S., Ward M. J., Axon D. J., Elvis M., Meurs E. J. A., 1979, MNRAS, 187, 109
- Yan et al. (2013) Yan D., Zhang L., Yuan Q., Fan Z., Zeng H., 2013, ApJ, 765, 122
- Zargaryan et al. (2017) Zargaryan D., Gasparyan S., Baghmanyan V., Sahakyan N., 2017, A&A, 608, A37
- Zheng et al. (2018) Zheng Y. G., Long G. B., Yang C. Y., Bai J. M., 2018, PASP, 130, 083001