How does the extracellular matrix affect the rigidity of an embedded spheroid?
Abstract
Cellularized tissue and polymer networks can both transition from floppy to rigid as a function of their control parameters, and, yet, the two systems often mechanically interact, which may affect their respective rigidities. To study this interaction, we consider a vertex model with interfacial tension (a spheroid) embedded in a spring network in two dimensions. We identify two regimes with different global spheroid shapes, governed by the pressure resulting from competition between interfacial tension and tension in the network. In the first regime, the tissue remains compact, while in the second, a cavitation-like instability leads to the emergence of gaps at the tissue-network interface. Intriguingly, compression of the tissue promotes fluidization, while tension promotes cellular alignment and rigidification, with the mechanisms driving rigidification differing on either side of the instability.
Introduction. Cellularized tissue– groups of cells exhibiting collective behavior– is held together by adhesive cell-cell junctions, which regulate an incredible range of functions, including wound healing and embryogenesis Cooper (2000); Niessen et al. (2011); Li et al. (2013); Garcia et al. (2018); Bruckner and Janshoff (2018). In addition, there is typically a non-cellular component present, the extracellular matrix (ECM)– a network often largely composed of cross-linked collagen fibers– to which cells mechanically couple via cell-ECM adhesions. Through these adhesions, the ECM imposes forces on cells to provide structural support and regulate cell-cell interactions, driving changes in cell behavior and, ultimately, tissue mechanics Galbraith and Sheetz (1998); Lo et al. (2000); Liu et al. (2017); Humphrey et al. (2014); Frantz et al. (2010). Maintenance of these interactions is crucial for healthy tissue, and, in fact, disruptions in forces exerted by the ECM, or in the cells’ ability to sense or respond to mechanical signals from the ECM, are hallmarks of disease Walker et al. (2018); Giussani et al. (2015); Acerbi et al. (2015); Leight et al. (2017); McKenzie et al. (2018).
A key in vitro model system for studying the combined effects of cell-cell and cell-ECM interactions on tissue behavior is a tissue spheroid embedded in a collagen network. It has been shown that tensile forces and stiffer collagen fibers in the ECM facilitate tumor invasion Kopanska et al. (2016); Suh et al. (2019), and that as various ECM proteins are modified, cell shapes may be a good predictor of invasion potential Baskaran et al. (2020).
Despite the recent spate of experimental work on multicellular systems embedded in biopolymer networks, numerical models for cells interacting with ECM have focused on single cells, potentially missing important features associated with collective cell behavior Zheng et al. (2019); Kim et al. (2018); Han et al. (2018). Yet, models for bulk tissue and collagen network have separately been quite successful. One such model is a cell-based vertex model Nagai and Honda (2001); Farhadifar et al. (2007); Bi et al. (2015), which predicts a density-independent rigidity transition in disordered confluent tissues and micro-demixing in tissue mixtures Bi et al. (2015); Merkel and Manning (2018); Sahu et al. (2020). Both phenomena have been verified experimentally Park et al. (2015); Malinverno et al. (2017); Sahu et al. (2020). Meanwhile, the strain-stiffening behavior observed in biopolymer networks has been captured by under-constrained spring network models Licup et al. (2015); Jansen et al. (2018). Interestingly, in the absence of energetic penalties for bending, the spring network’s floppy-to-rigid transition at finite shear strain is yet another density-independent rigidity transition in the same universality class as that of the vertex model Merkel et al. (2019).
Here we couple a tissue-based vertex model to a surrounding spring network in two dimensions with line tension at the interface, and study the rheology and morphology of the tissue. Our model is minimal as our goal is to investigate the effect of mechanical coupling alone on the collective behavior of pre-migratory tissue cells. However, even for this minimal bi-material, without feedback to dynamically up- or down-regulate model parameters, nontrivial changes in cell shape, tissue phase, and overall tissue structure can be induced. Using mean-field approximations, we analytically quantify the state of the tissue in two distinct regimes, separated by an instability in the tissue boundary, to predict the fluidity and geometry of the tissue cells, using arguments that are generalizable to any biological system where the competition between external forces and interfacial tension plays an important role.
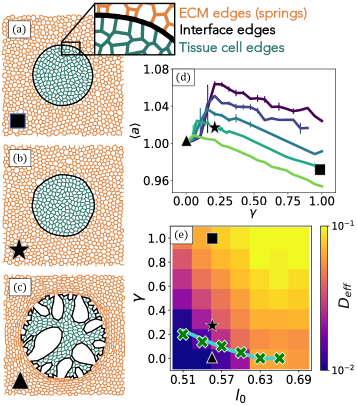
Model. Our model is composed of a tissue of cells, each with area, , and perimeter, , embedded in a network of springs, each with equilibrium spring length, , and stiffness, , with line tension, , at the interface (see Fig. 1 (a), detail). The dimensionless energy functional is
| (1) |
with the first two terms representing the standard vertex model for the tissue, the third term the elasticity of the spring network with edge lengths , and the fourth term the interfacial tension, with edge lengths . The control parameter for rigidity in the standard vertex model is the preferred cell shape index, , with values of below a threshold inducing rigidity in the cellularized tissue (see Supplementary Material (SM) Sec. A). In a homogeneous, under-constrained spring network system, the control parameter for rigidity (tension) is the rest length of the springs, , with a rest length below some threshold resulting in a rigid network (see SM Sec. B). For simplicity, we study the spring network in the limit of zero bending energy where the rigid-to-floppy transition is well-defined.
Using zero-temperature energy-minimization and low-temperature Brownian dynamics (see SM Sec. D), we explore minimal-energy configurations of this model, focusing on the emergent morphology and rheology of the tissue. In doing so, the rules for tissue cell T1 transitions near the boundary must be carefully considered (see SM Sec. C).
Results. We find that both the phase and morphology of the tissue depend on the balance of interfacial tension, , and the equilibrium spring length, , of the surrounding network, for a fixed of the tissue cells. As decreases, the mean spring length, , decreases to minimize the total energy. This decrease necessitates the shrinking of the area taken up by the springs, either by increasing the size of the tissue or by opening gaps at the tissue-ECM interface. At the same time, changes to the global area of the tissue spheroid cost energy due to a quadratic penalty for deviations from the preferred cell area, while changes to the tissue-ECM interface are penalized by the interfacial tension and induced deviations from the preferred cell perimeter.
The competition between these effects is illustrated in Fig. 1 for . The configurations in (a)-(c) depict the effect on the overall tissue shape of decreasing (, , ) for fixed . We observe roughly circular shapes for the tissue in the first two cases, while at cavities appear, yielding a different global shape. Fig. 1 (d) shows the mean cell area, , as a function of , for varying values (see caption). Fig. 1 (e) shows the effects of and on the tissue fluidity, quantified by the effective diffusion coefficient, (see SM Sec. D2), where higher values correspond to more fluid-like tissues. Points with the same parameters as in (a)-(c) are marked with corresponding symbols in (d) and (e).
For a fixed corresponding to rigid ECM, increasing results in a smooth increase in , as shown in (e), while changes non-monotonically, as shown in (d). As we increase beyond some critical value, , defined by the maximum of each curve in (d), decreases, while the overall tissue geometry remains roughly circular. As we decrease below , also decreases, but ECM tension induces cavities. This behavior is indicative of an instability, whose location we predict analytically and plot as a solid line in (e), while the Xs denote the locations of determined numerically.
Cavitation Instability. To analytically predict the onset of the instability occurring at , we devise a mean-field model in which a circular tissue containing a circular cavity is embedded in a regular, hexagonal spring network. We assume that all cells remain at their preferred area and perimeter, leaving contributions only from the tissue boundary and spring network. This assumption allows us to write the total energy as a function of the cavity radius, , only (see SM Sec. F). For a fixed value, we find two energy minima— one at , and another at at a particular value of which we denote . For , the energetically-favorable cavity radius is zero, and the system prefers circular, compact tissue geometries. For , the system prefers a cavity of finite radius, which grows as decreases. The computed agrees well with the measured identified by the location of the peak in the vs. curve for the corresponding (see Fig. 1 (e) and SM Sec. F). As decreases, increases, since larger interfacial tension is required to overcome the increased tension in the network and prevent the formation of cavities.
Compact tissue regime. When , the tissue is roughly circular, or “compact,” with no cavities. To understand this regime, we first focus on the limit of zero ECM tension. Thus, increasing the interfacial tension, , drives the tissue boundary to shrink, reducing the tissue radius and compressing the tissue, as shown in Fig. 2 (a). To study the effect of this compression on tissue fluidity, we compute the cells’ effective diffusion coefficient, , as a function of interfacial tension, . Fig. 2 (b) shows results for a tissue with . At , , and the tissue is solid-like. As increases and the tissue cells are compressed, becomes non-zero at a particular value of .
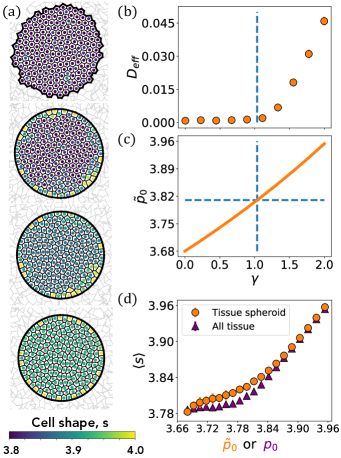
This compression-induced fluidization can be understood via a mapping of the embedded tissue to an effective bulk vertex model. By approximating the tissue geometry as circular, ignoring fluctuations in the cell perimeters, cell areas, and interface edge lengths, and assuming that cell areas depend on the pressure balance generated by interfacial tension and spring tension, we generate an effective bulk model (see SM Sec. E):
| (2) |
The effective model parameters are denoted by tildes and are functions of the original model parameters, including , and the number of tissue cells, . A plot of the effective parameter is shown as a function of in Fig. 2 (c). Given the form of this effective energy functional, we predict that a system with a finite boundary and non-zero interfacial line tension will behave as a bulk vertex model with effective parameters, and . Although the critical , , in the bulk vertex model has been shown to depend on temperature and simulation protocol, the zero-temperature value of appears to represent a lower-bound, and at our simulation temperature we expect a transition from fluid-like to solid-like behavior at (see Refs. Bi et al. (2016); Sussman and Merkel (2018); Wang et al. (2020) and SM Sec. A). Indeed we find that the value of at which corresponds well to the point at which becomes non-zero, as noted by the dashed lines in Fig. 2 (b) and (c). This mapping explains our observation of fluid-like behavior with increasing interfacial tension; even for , we expect fluid-like behavior for associated . Moreover, since the relationship between and mean observed cell shape, , has been shown for the bulk vertex model, our mapping also predicts the behavior of with increasing , or, equivalently, . This relationship, along with that for a bulk vertex model alone with varying , is illustrated in Fig. 2 (d).
Although these results focus on the limit of floppy ECM, adding tension to the network, by decreasing , simply shifts the mean cell area, as shown in Fig. 1 (d). By identifying another mean-field approximation relating the mean spring length to the mean cell area, our effective model parameters become functions of both and (see SM Sec. E).
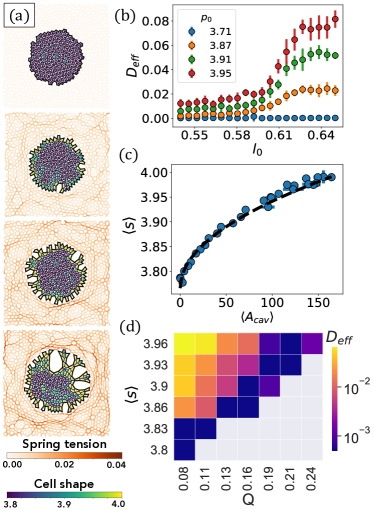
Irregular tissue regime. At , the tissue boundary becomes unstable, and for , we observe irregular tissue boundaries facilitated by the opening of cavities– empty spaces along which cells are not coupled to ECM springs. To study this regime, we first explore the limit of increasing tension in the spring network with no tissue interfacial tension. In this limit, there is no cost to opening gaps that increase the length of the spheroid-ECM interface, and so, as decreases below the critical threshold and the tension in the ECM increases, gaps open. Minimum energy configurations are illustrated in Fig. 3 (a). As the spring network tension increases, the tissue boundary becomes increasingly irregular and the average cavity size grows.
To study the phase of the tissue, we again run low-temperature simulations and extract the effective diffusion constant, , in this case for a range of values. For a fixed and decreasing , decreases. Examples of this are shown in Fig. 3 (b). To determine if the observed cell shape is correlated with the decrease in diffusivity, we ignore fluctuations in cell perimeters, areas, and spring lengths and treat each cell as bordering a cavity and being stretched along the cavity’s circular circumference. We also assume the cell areas do not increase, which is substantiated by numerics. As each cell becomes highly elongated in the tangential direction and compressed in the radial direction, the relationship between the cell perimeter and the radius of the cavity approaches a linear form (see SM Sec. G). Therefore, the perimeter of the cell scales with the square root of the area of the cavity, and, since we assume the cell area is fixed, so does the cell shape. Assuming the total cavity area, , is a multiple of the single cavity area, we obtain
| (3) |
In Fig. 3 (c), simulation results for and a fit of the form of Eq. 3 are shown. Since we anticipate bulk tissue behavior when , we expect (see SM Sec. A). We find that and . These results, along with the observed decrease in fluidity, indicate that, unlike the compact tissue regime, a mean cell shape above does not necessarily correspond to fluid-like tissue.
Prior work has shown that bulk tissue under anisotropic strain can rigidify due to cell-cell alignment for Wang et al. (2020). To determine if this phenomenon is relevant here, we quantify cell-cell alignment with the parameter Wang et al. (2020), which is similar to a nematic order parameter except that it also contains information about the shape of the cells (see SM Sec. H). As illustrated in Fig. 3 (d), the decrease in is indeed correlated with an increase in cell shape and an increase in cell-cell alignment. Zero-temperature energy barrier measurements also support this finding (see SM Sec. I). Note that although there is a clear decrease in as decreases, a difference remains across values. This suggests that the rigidification may not necessarily be a bulk phenomenon but become enhanced toward the periphery of the spheroid. Energy barrier measurements as a function of distance from the periphery suggest this. Finite-size and temperature studies are in SM Secs. J and K.
Discussion. We have generalized the bulk vertex model for cellularized tissue to include a coupling to a surrounding spring network representing the ECM. By studying this bi-material, we gain insight into the competition between cell-cell and cell-environment interactions. Our findings represent the essential first step in understanding a model that can now easily be augmented with specific features. When the tissue remains compact, isotropic compression– driven by increasing interfacial tension– leads to increased cell shapes and fluidization of the tissue, as predicted by a mean-field mapping to a bulk tissue. Moreover, a transition from a compact tissue geometry to an irregular one happens suddenly, due to a generic instability in the balance of negative pressure induced by the surrounding network and positive pressure caused by the interfacial tension. Once gaps open between the tissue and the ECM, the rheology of the tissue depends both on cell shape and alignment, as in the case of tissues under shear deformations Wang et al. (2020). We note that the tissue deformation in our system is non-uniform, due to the system’s disorder and heterogeneity, resulting in heterogeneity in alignment and shape among the tissue cells. It has been shown that heterogeneity itself can promote rigidity in tissues Li et al. (2019), which perhaps also contributes to the induced rigidity of the system.
Our results suggest that although stiff networks have been shown to induce tissue breakup and cell migration, this may not mean they induce tissue fluidity. In fact, stiff networks may induce stiffer tissues, due to emergent cellular alignment, despite irregular tumor boundaries and elongated cell shapes. In other words, describing cancer invasion as cellular unjamming may be over-simplifying the phenomenon, as some experiments have recently indicated Kang et al. (2020). The pre-invasion stage of the tumor may involve solidification due to cellular alignment, ultimately facilitating cellular streaming upon enhanced cellular activity, with the tissue becoming an active fluid, flowing with respect to the ECM. Measurements of cellular alignment are needed to test this idea. Experiments searching for compression-induced fluidization in compact tumors or looking for cavity formation at the tumor-ECM interface would also test the model, since, given the generic nature of our arguments, we expect the phenomena to survive in three-dimensions. Finally, our model lays the groundwork for understanding more complex scenarios. For example, the ability for cells to form or degrade cell-ECM contacts, cell self-propulsion, ECM reorganization, and feedback between cell-cell and cell-ECM interactions are all fascinating directions for future study.
We acknowledge NSF-PoLS 1607416 for financial support. We would like to thank Daniel Sussman and Preeti Sahu for stimulating discussions and guidance on use of the cellGPU codebase. We acknowledge Mingming Wu for feedback on early results.
References
- Cooper (2000) G. Cooper, The Cell: A Molecular Approach. 2nd edition (Sunderland (MA): Sinauer Associates, 2000).
- Niessen et al. (2011) C. M. Niessen, D. Leckband, and A. S. Yap, Physiol. Rev. 91 (2011).
- Li et al. (2013) L. Li, Y. He, M. Zhao, and J. Jiang, Burns & trauma 1, 21 (2013).
- Garcia et al. (2018) M. A. Garcia, W. J. Nelson, and N. Chavez, Cold Spring Harbor Perspect. Biol. 10 (2018).
- Bruckner and Janshoff (2018) B. Bruckner and A. Janshoff, Sci. Reps. 8 (2018).
- Galbraith and Sheetz (1998) C. G. Galbraith and M. P. Sheetz, Curr. Opin. Cell Biol. 10 (1998).
- Lo et al. (2000) C. M. Lo, H. B. Wang, M. Dembo, and Y. L. Wang, Biophys. J. 79 (2000).
- Liu et al. (2017) A. Liu, O. Chaudhuri, and S. Parekh, Int. J. Integr. Biol. 9 (2017).
- Humphrey et al. (2014) J. Humphrey, E. Dufresne, and M. Schwartz, Nat. Rev. Mol. Cell Biol. 15 (2014).
- Frantz et al. (2010) C. Frantz, K. Stewart, and V. Weaver, J. Cell Sci. 123 (2010).
- Walker et al. (2018) C. Walker, E. Mojares, and A. del Río Hernández, Int. J. Mol. Sci. 19 (2018).
- Giussani et al. (2015) M. Giussani, G. Merlino, V. Cappelletti, E. Tagliabue, and M. G. Daidone, Semin. Cancer Biol. 35 (2015).
- Acerbi et al. (2015) I. Acerbi, L. Cassereau, I. Dean, Q. Shi, A. Au, C. Park, Y. Y. Chen, J. Liphardt, E. S. Hwang, and V. M. Weaver, Int. Biol. 7 (2015).
- Leight et al. (2017) J. L. Leight, A. P. Drain, and V. M. Weaver, Annu. Rev. Cancer Biol. 1 (2017).
- McKenzie et al. (2018) A. J. McKenzie, S. R. Hicks, K. V. Svec, H. Naughton, Z. L. Edmunds, and A. K. Howe, Sci. Rep. 8 (2018).
- Kopanska et al. (2016) K. S. Kopanska, Y. Alcheikh, R. Staneva, D. Vignjevic, and T. Betz, PLOS ONE 11 (2016).
- Suh et al. (2019) Y. J. Suh, M. S. Hall, Y. L. Huang, S. Y. Moon, W. Song, M. Ma, L. J. Bonassar, J. E. Segall, and M. Wu, Integr. Biol. 11 (2019).
- Baskaran et al. (2020) J. P. Baskaran, A. Weldy, J. Guarin, G. Munoz, M. Kotlik, N. Subbiah, A. Wishart, Y. Peng, M. A. Miller, L. Cowen, and M. J. Oudin, bioRxiv (2020).
- Zheng et al. (2019) Y. Zheng, H. Nan, Y. Liu, Q. Fan, X. Wang, R. Liu, L. Liu, F. Ye, B. Sun, and Y. Jiao, Phys. Rev. E 100 (2019).
- Kim et al. (2018) M.-C. Kim, Y. R. Silberberg, R. Abeyaratne, R. D. Kamm, and H. H. Asada, PNAS 115 (2018).
- Han et al. (2018) Y. L. Han, P. Ronceray, G. Xu, A. Malandrino, R. D. Kamm, M. Lenz, C. P. Broedersz, and M. Guo, Proc. Nat. Acad. Sci. 115 (2018).
- Nagai and Honda (2001) T. Nagai and H. Honda, Philos. Mag. B - Physics of Condensed Matter, Statistical Mechanics, Electronic, Optical, and Magnetic Properties 81 (2001).
- Farhadifar et al. (2007) R. Farhadifar, J.-C. Röper, B. Aigouy, S. Eaton, and F. Jülicher, Curr. Biol. 17 (2007).
- Bi et al. (2015) D. Bi, J. Lopez, J. M. Schwarz, and M. L. Manning, Nat. Phys. 11 (2015).
- Merkel and Manning (2018) M. Merkel and M. L. Manning, New J. of Phys. 20 (2018).
- Sahu et al. (2020) P. Sahu, D. M. Sussman, M. Rübsam, A. F. Mertz, V. Horsley, E. R. Dufresne, C. M. Niessen, M. C. Marchetti, M. L. Manning, and J. M. Schwarz, Soft Matter 16 (2020).
- Park et al. (2015) J.-A. Park, J. H. Kim, D. Bi, J. A. Mitchel, N. T. Qazvini, K. Tantisira, C. Y. Park, M. McGill, S.-H. Kim, B. Gweon, and et. al., Nat. Mater. 14 (2015).
- Malinverno et al. (2017) C. Malinverno, S. Corallino, M. Giavazzi, Fabioand Bergert, Q. Li, M. Leoni, A. Disanza, E. Frittoli, A. Oldani, E. Martini, T. Lendenmann, and et. al., Nat. Mater. 16 (2017).
- Licup et al. (2015) A. J. Licup, S. Münster, A. Sharma, M. Sheinman, L. M. Jawerth, B. Fabry, D. A. Weitz, and F. C. MacKintosh, PNAS 112 (2015).
- Jansen et al. (2018) K. A. Jansen, A. J. Licup, A. Sharma, R. Rens, F. C. MacKintosh, and G. H. Koenderink, Biophys. J. 114 (2018).
- Merkel et al. (2019) M. Merkel, K. Baumgarten, B. P. Tighe, and M. L. Manning, PNAS 116 (2019).
- Bi et al. (2016) D. Bi, X. Yang, M. C. Marchetti, and M. L. Manning, Phys. Rev. X 6 (2016).
- Sussman and Merkel (2018) D. M. Sussman and M. Merkel, Soft Matter 14 (2018).
- Wang et al. (2020) X. Wang, M. Merkel, L. B. Sutter, G. Erdemci-Tandogan, M. L. Manning, and K. E. Kasza, PNAS 117 (2020).
- Li et al. (2019) X. Li, A. Das, and D. Bi, Phys. Rev. Lett. 123 (2019).
- Kang et al. (2020) W. Kang, J. Ferruzzi, C.-P. Spatarelu, Y. L. Han, Y. Sharma, S. A. Koehler, J. P. Butler, D. Roblyer, M. H. Zaman, M. Guo, Z. Chen, A. F. Pegoraro, and J. J. Fredberg, bioRxiv (2020).