Updated MiniBooNE neutrino oscillation results with increased data and new background studies
Abstract
The MiniBooNE experiment at Fermilab reports a total excess of electronlike events from a data sample corresponding to protons-on-target in neutrino mode, which is a 46% increase in the data sample with respect to previously published results, and protons-on-target in antineutrino mode. The overall significance of the excess, , is limited by systematic uncertainties, assumed to be Gaussian, as the statistical significance of the excess is . The additional statistics allow several studies to address questions on the source of the excess. First, we provide two-dimensional plots in visible energy and cosine of the angle of the outgoing lepton, which can provide valuable input to models for the event excess. Second, we test whether the excess may arise from photons that enter the detector from external events or photons exiting the detector from decays in two model independent ways. Beam timing information shows that almost all of the excess is in time with neutrinos that interact in the detector. The radius distribution shows that the excess is distributed throughout the volume, while tighter cuts on the fiducial volume increase the significance of the excess. The data likelihood ratio disfavors models that explain the event excess due to entering or exiting photons.
pacs:
14.60.Lm, 14.60.Pq, 14.60.StI Introduction
The LSND [1] and MiniBooNE [2, 3] experiments have reported excesses of and charge-current quasielastic (CCQE) events in beams. Exotic models beyond the three-neutrino paradigm that have been invoked to explain these anomalies include, for example, 3+N neutrino oscillation models involving three active neutrinos and N additional sterile neutrinos [4, 5, 6, 7, 8, 9, 10, 11, 12, 13, 14], resonant neutrino oscillations [15], Lorentz violation [16], sterile neutrino decay [17], scalar decay [18], sterile neutrino nonstandard interactions [19], and altered dispersion relations with sterile neutrinos [20]. This paper presents improved MiniBooNE appearance results with increased statistics and with additional studies that disfavor neutral-current (NC) and external event backgrounds.
II The MiniBooNE Experiment
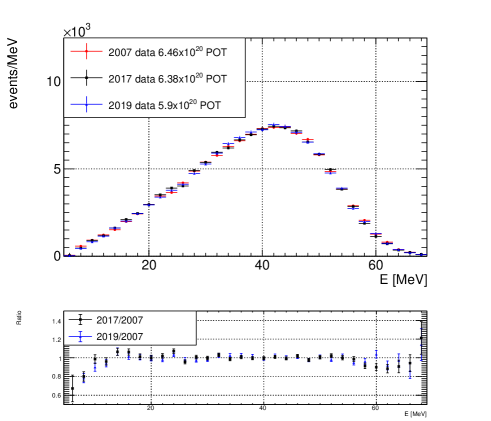
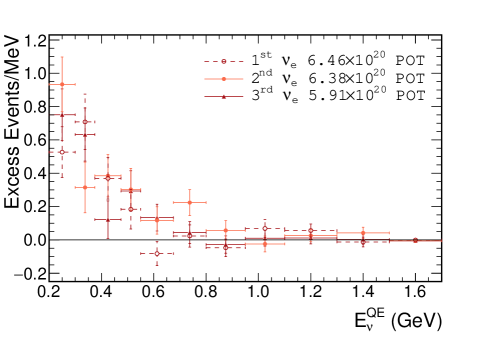
The MiniBooNE experiment makes use of the Booster Neutrino Beam (BNB) that is produced by 8 GeV protons from the Fermilab Booster interacting on a beryllium target inside a magnetic focusing horn, followed by meson decay in a 50 m decay pipe. In neutrino mode, the , , , and flux contributions at the detector are 93.5%, 5.9%, 0.5%, and 0.1%, respectively, while in antineutrino mode, the flux contributions are 15.7%, 83.7%, 0.2%, and 0.4%, respectively. The and fluxes peak at approximately 600 MeV and 400 MeV, respectively. The MiniBooNE detector, described in detail in reference [21], consists of a 12.2 m diameter sphere filled with 818 tonnes of pure mineral oil (CH2) and is located 541 m from the beryllium target. The detector is covered by 1520 8-inch photomultiplier tubes (PMTs), where 1280 PMTs are in the interior detector region and 240 PMTs are located in the optically isolated outer veto region. The PMTs detect the directed Cherenkov light and the isotropic scintillation light produced by charged particles from neutrino interactions in the mineral oil. Events are reconstructed [22] from the hit PMT charge and time information, and the reconstructed neutrino energy, , is estimated from the measured energy and angle of the outgoing muon or electron, assuming the kinematics of CCQE scattering [23]. The MiniBooNE experiment has collected data from 2002-2019, based on a total of protons-on-target (POT) in antineutrino mode and POT in neutrino mode. Also, a special beam off-target run collected an additional POT in a search for sub-GeV dark matter [24]. During the 17 years of running, the BNB and MiniBooNE detector have been stable to within 3% in neutrino energy. Fig. 1 shows the energy distribution of Michel electrons from stopped muon decay for the first ( POT from 2002 to 2007), second ( POT from 2015 to 2017), and third running periods ( POT from 2017 to 2019) in neutrino mode. By adjusting the energy calibration by 2% for the second running period and by 3% for the third running period, good agreement is obtained for the Michel electron energy distribution.
III Data Analysis
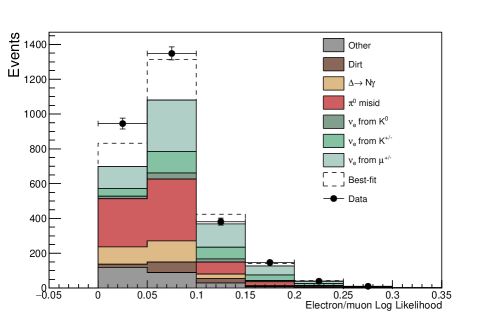
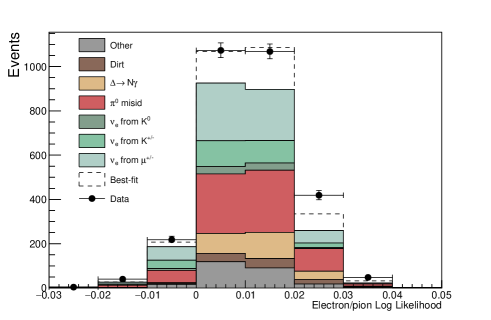
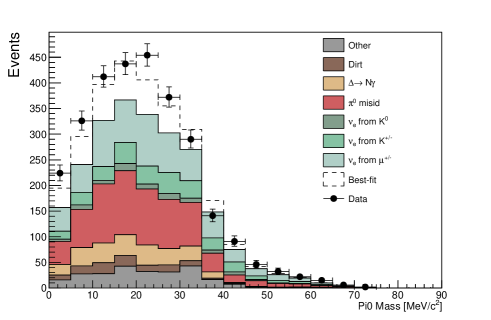
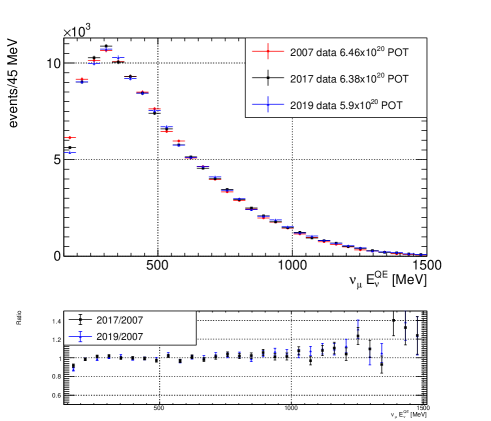
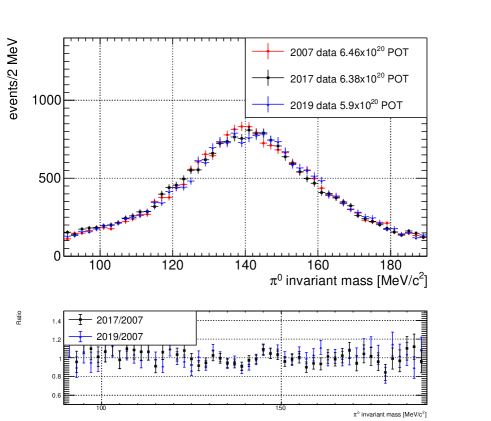
The data analysis is optimized to measure -induced CCQE events and reject induced events, and is identical to the previous analysis [2]. Figs. 2, 3, and 4 show the CCQE data and background for the three particle identification variables in neutrino mode in the MeV energy range for the total POT data. The comparison between data and background for the full range of particle identification variables was shown in the supplementary material of a previous publication [3]. The average selection efficiency is () for -induced CCQE events (-induced background events) generated over the fiducial volume. The fraction of CCQE events in antineutrino mode that are from wrong-sign neutrino events was determined from the angular distributions of muons created in CCQE interactions and by measuring CC single events [25]. Table 1 shows the predicted but unconstrained and CCQE background events for the neutrino energy range MeV for both neutrino and antineutrino modes, where there are approximately twice as many Monte Carlo events compared to data events. Table 1 also shows the total constrained background, where the overall normalization of the intrinsic background is constrained by the CCQE event sample. The upper limit of 1250 MeV was chosen by the collaboration before unblinding the data in 2007, while the lower limit of 200 MeV was chosen in 2013 [2] because it is the lowest energy for reliably reconstructing the Cherenkov ring of CCQE events with a visible energy greater than 140 MeV. From the given detector resolution estimated from the Michel electron spectrum (Fig. 1), there is a negligible amount of migration from events below 200 MeV. Note that the original lower limit was chosen to be 300 MeV before unblinding the data in 2007. During the unblinding procedure, the lower limit was increased to 475 MeV due to the low probability of the two-neutrino oscillation fit and worries about the single-gamma background. However, careful studies of the single-gamma background were performed after unblinding and convinced the collaboration that the single-gamma background was estimated correctly within systematic uncertainties and agreed with theoretical calculations [31]. Finally, Table 1 shows the expected number of events corresponding to the LSND best fit oscillation probability of 0.26%, assuming large where the oscillations are washed out. LSND and MiniBooNE have the same average value of L/E, but MiniBooNE has a larger range of L/E. Therefore, the appearance probabilities for LSND and MiniBooNE should not be exactly the same at lower L/E values. Figs. 5 and 6 show the CCQE energy distribution and the NC mass distribution in neutrino mode for the first, second, and third running periods. As shown in the figures, the three running periods have good agreement.
| Process | Neutrino Mode | Antineutrino Mode |
|---|---|---|
| & CCQE | 107.6 28.2 | 12.9 4.3 |
| NC | 732.3 95.5 | 112.3 11.5 |
| NC | 251.9 35.2 | 34.7 5.4 |
| External Events | 109.8 15.9 | 15.3 2.8 |
| Other & | 130.8 33.4 | 22.3 3.5 |
| & from Decay | 621.1 146.3 | 91.4 27.6 |
| & from Decay | 280.7 61.2 | 51.2 11.0 |
| & from Decay | 79.6 29.9 | 51.4 18.0 |
| Other & | 8.8 4.7 | 6.7 6.0 |
| Unconstrained Bkgd. | ||
| Constrained Bkgd. | ||
| Total Data | 2870 | 478 |
| Excess | 560.6 119.6 | 77.4 28.5 |
| 0.26% (LSND) | 676.3 | 100.0 |
Systematic uncertainties are determined by considering the predicted effects on the , , , and CCQE rates from variations of model parameters that include uncertainties in the neutrino and antineutrino flux estimates, uncertainties in neutrino cross sections, uncertainties from nuclear effects, and uncertainties in detector modeling and reconstruction. A covariance matrix in bins of is constructed by considering the variation from each source of systematic uncertainty on the and CCQE signal and background, and the and CCQE prediction as a function of . This matrix includes correlations between any of the and CCQE signal and background and and CCQE samples, and is used in the calculation of the oscillation fits.
IV Electron-neutrino Appearance Results
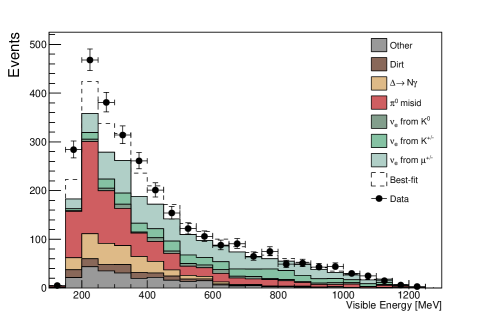
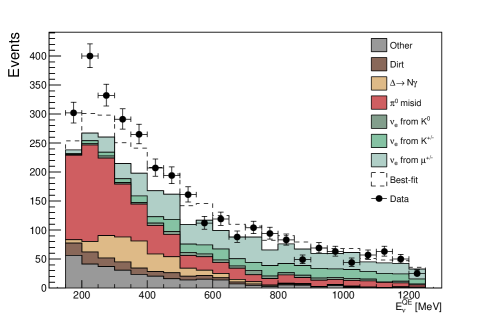
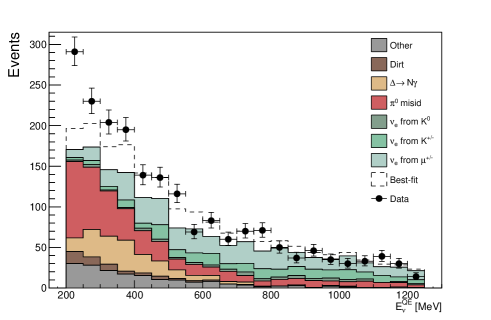
Figs. 7, 8, and 9 show the visible energy, , and distributions for CCQE data and background in neutrino mode in the MeV energy range for the total POT data, where is the angle of the reconstructed electron relative to the incident beam direction. Each bin of reconstructed corresponds to a distribution of “true” generated neutrino energies, which can overlap adjacent bins. In neutrino mode, a total of 2870 data events pass the CCQE event selection requirements with MeV, compared to a background expectation of events. The excess, as shown in Table 2, is then events or a effect. Fig. 10 shows the event excesses as a function of in neutrino mode for the first, second, and third running periods. Combining the MiniBooNE neutrino and antineutrino data [3], there are a total of 3348 events in the MeV energy region, compared to a background expectation of events. This corresponds to a total plus CCQE excess of events with respect to expectation, where the statistical uncertainty is the square root of the background estimate and the systematic uncertainty includes correlated and uncorrelated systematic parameters. The overall significance of the excess, , is limited by systematic uncertainties, assumed to be Gaussian, as the statistical significance of the excess is . The fractional unconstrained systematic uncertainties in the MeV energy range are shown in Table 3.
| Selection | Data | Background | Excess | Significance |
|---|---|---|---|---|
| MeV & | 2870 | 4.7 | ||
| MeV & | 3172 | 4.7 | ||
| MeV & | 1978 | 5.6 | ||
| MeV & | 864 | 4.6 |

| Systematic Uncertainty | Fraction of Event Excess |
|---|---|
| Cross Section | 35% |
| Optical Model | 23% |
| Production | 14% |
| Neutrino Flux | 7% |
| Production | 4% |
| Production | 4% |
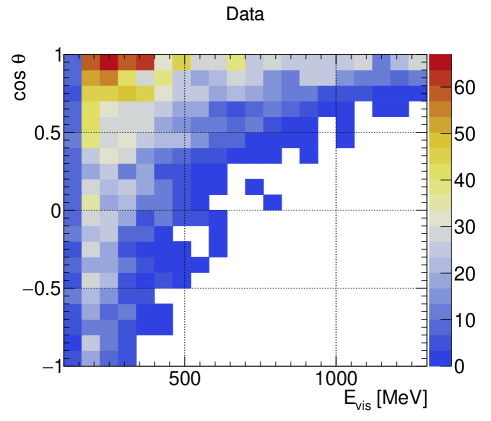
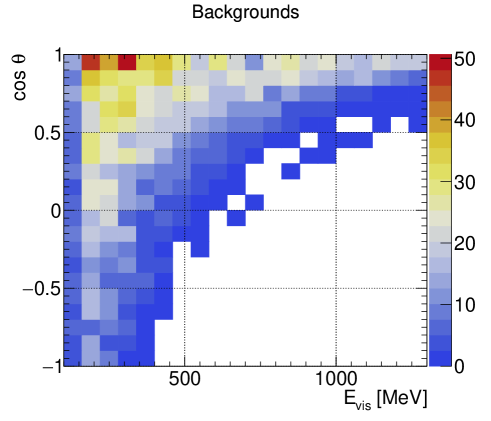
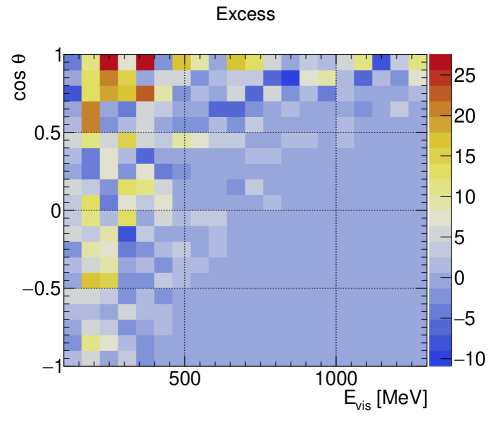
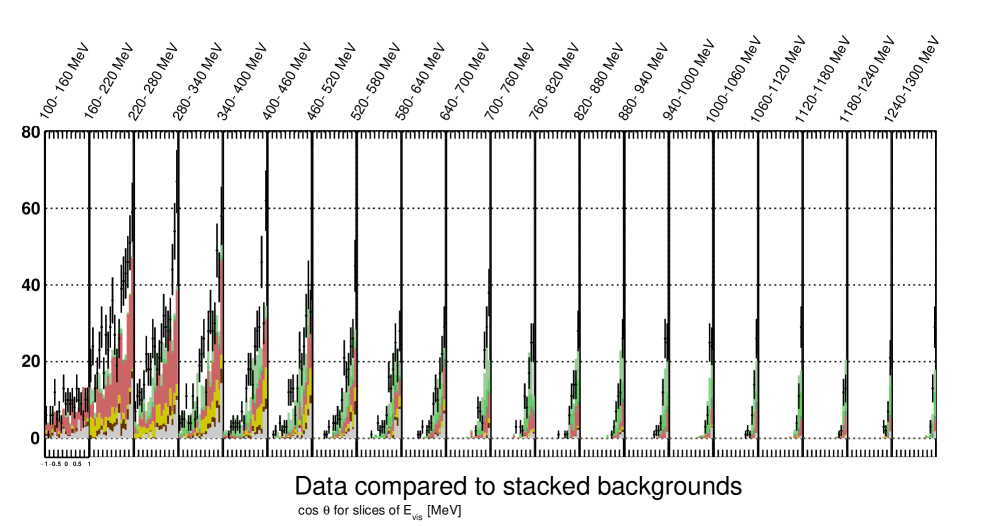
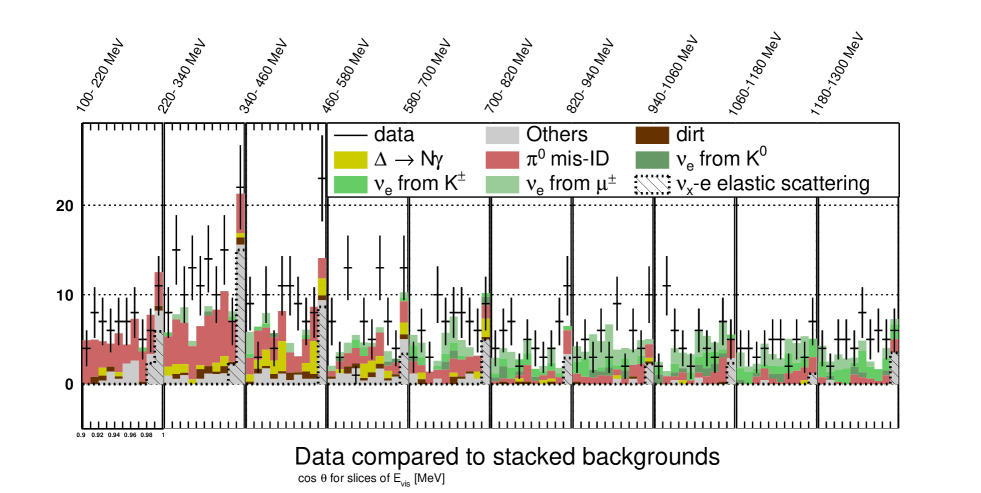
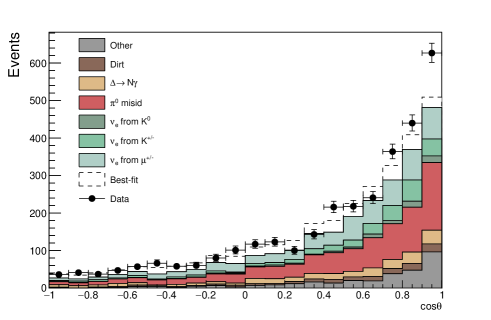
In order to test physics models, the numbers of data events, unconstrained background events, and excess events in neutrino mode with visible energy between 150 and 1250 MeV are shown in Figs. 11, 12, and 13 as functions of visible energy and . In these figures, there are 20 columns of visible energy from 150 to 1250 MeV and 20 rows of from -1 to 1. There are a total of 3182 data events, 2568.8 background events and 613.2 excess events. Fig. 14 shows the distribution of data and background events for the 20 different energy bins, while Fig. 15 shows the distributions from 0.9 to 1 for 10 different visible energy bins. Neutrino-electron elastic scattering events are shown as the hatched region in the “Others” category.
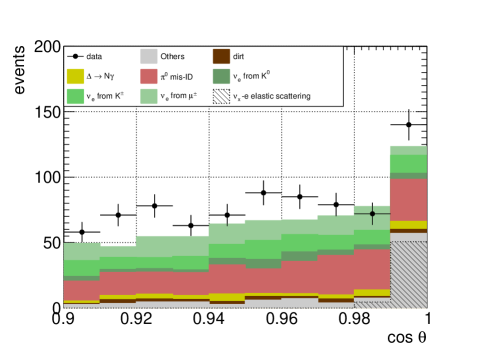
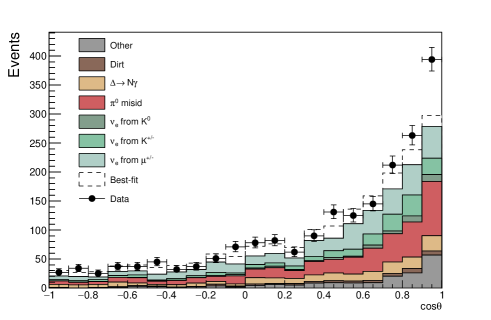
Fig. 16 shows the number of data and background events as a function of for , where neutrino-electron elastic scattering events are shown as the hatched region in the “Others” category and contribute to the bins. The neutrino-electron elastic events constitute 53% (89%) of the “Others” category for (), and the category also includes neutrino-nucleon charged-current and neutral-current scattering events. As shown in the figure, the excess of data events over background events is approximately the same in each bin.
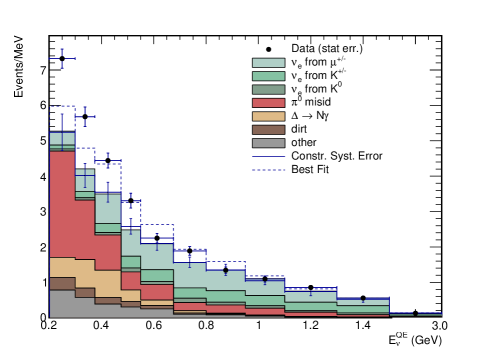
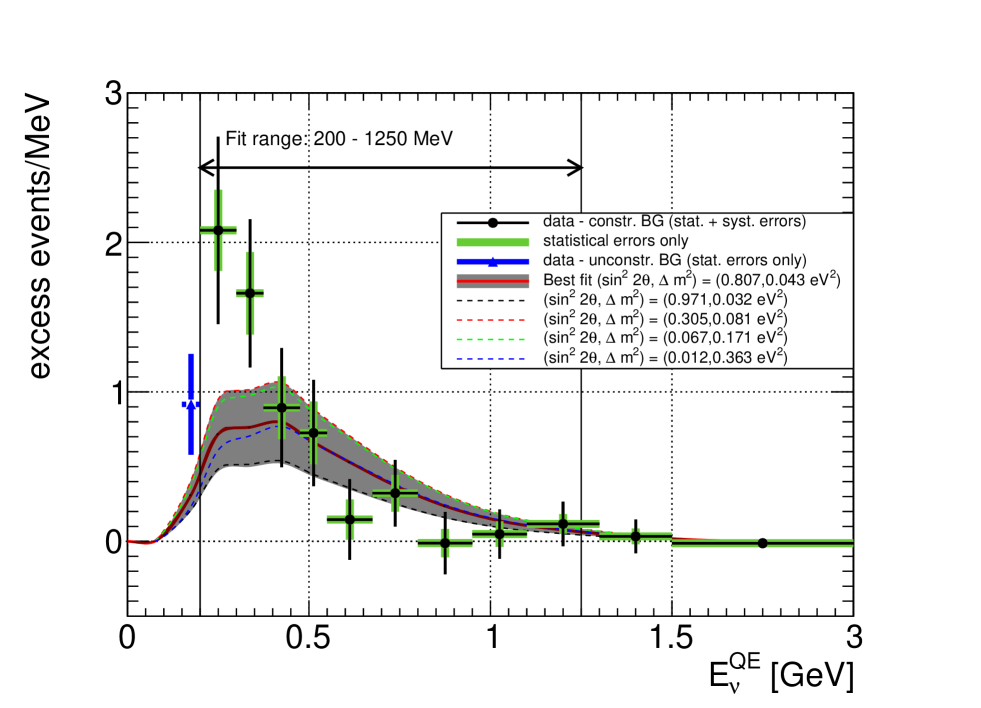
Figs. 17 and 18 show the and distributions for the MeV energy range, and the total event excess as a function of is shown in Fig. 19. The solid curve on the latter plot shows the two-neutrino oscillation prediction at the best-fit point (, eV2). The lowest energy data point has less acceptance than the other data points due to the requirement that the visible energy be greater than 140 MeV. Table 2 lists the number of data events, background events, excess events, and excess significance for the MeV energy range.
V Neutrino Oscillation Fits
Fig. 20 shows the MiniBooNE allowed regions in both neutrino mode and antineutrino mode [3] for events with MeV within a two-neutrino oscillation model. For this oscillation fit the entire data set is used and includes the POT data in neutrino mode and the POT data in antineutrino mode. Also shown are 90% C.L. limits from the KARMEN [26] and OPERA [27] experiments. The best combined neutrino oscillation fit occurs at (, ) (0.807, 0.043 eV2). The for the best-fit point in the energy range MeV is 21.7/15.5 with a probability of , and the background-only fit has a probability of relative to the best oscillation fit and a with a probability of .
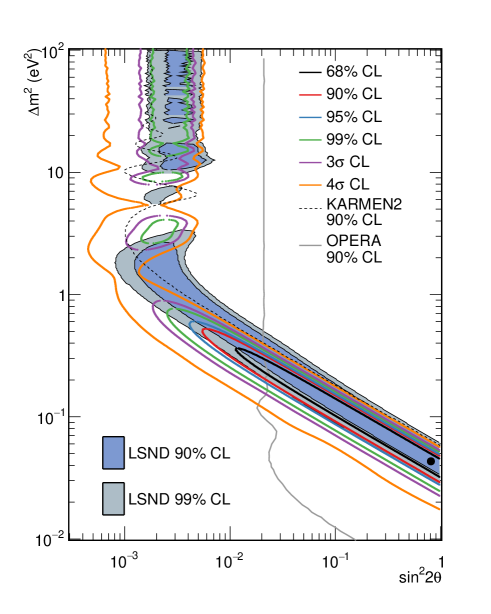
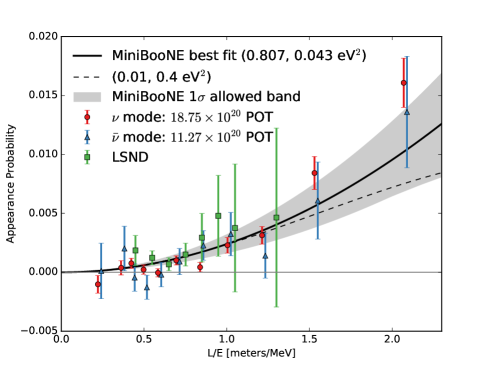
Fig. 21 compares the distributions for the MiniBooNE data excesses in neutrino mode and antineutrino mode to the distribution from LSND [1]. The error bars show statistical uncertainties only. As shown in the figure, there is agreement among all three data sets. Assuming two-neutrino oscillations, the curves show fits to the MiniBooNE data described above. The significance of the combined LSND () [1] and MiniBooNE () excesses is , which is obtained by adding the significances in quadrature, as the two experiments have completely different neutrino energies, neutrino fluxes, reconstructions, backgrounds, and systematic uncertainties.
VI Background Studies and Constraints
Constraints have been placed on the various backgrounds in Table 1 by direct measurements of these backgrounds in the MiniBooNE detector. The CC background has been well measured [28] by using the Michel electrons from muon decay to identify the event topology. Likewise, the NC background has also been well measured [29] by reconstructing the two-gamma invariant mass.
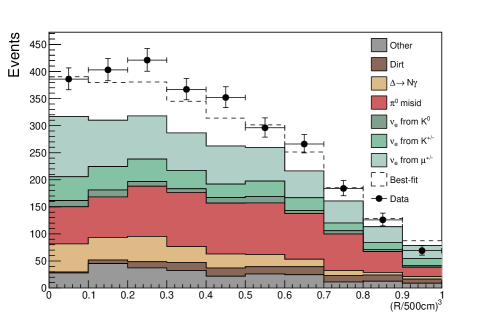
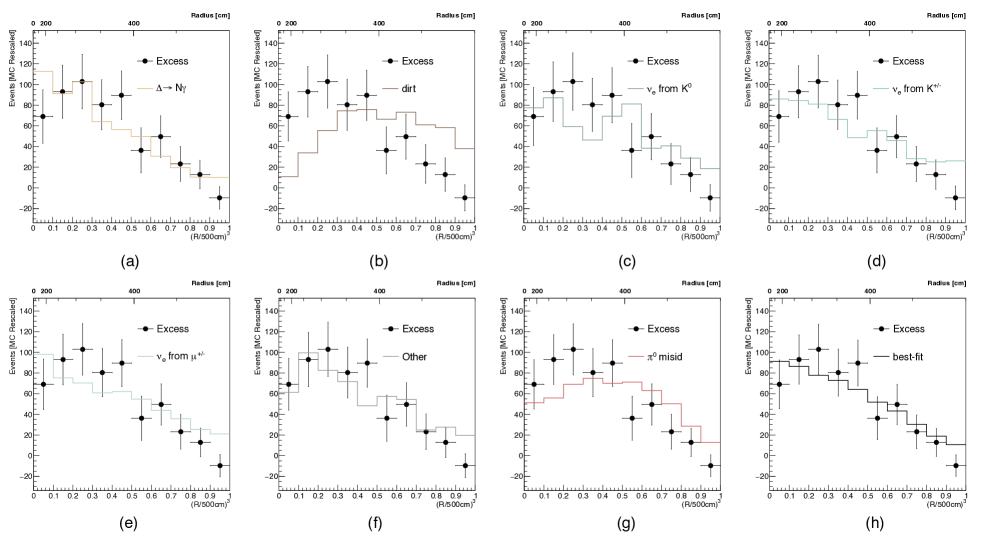
In addition, a fit to the vertex radial distribution, shown in Fig. 22, allows a constraint to be placed on the NC background, due to this background having more events near the edge of the 5 m radius fiducial volume. (NC events near the edge of the fiducial volume have a greater chance of one photon leaving the detector with the remaining photon then mis-reconstructing as an electron candidate.) Fig. 23 shows the excess event radial distributions, where different processes are normalized to explain the event excess, while Table 4 shows the result of log-likelihood shape-only fits to the radial distribution and the multiplicative factor that is required for each hypothesis to explain the observed event excess. The two-neutrino oscillation hypothesis fits the radial distribution best with a , while the NC hypothesis has a worse fit with a . The intrinsic backgrounds have a worse than the two-neutrino oscillation hypothesis due to higher energy events having a different radial distribution than lower energy events.
| Hypothesis | Multiplicative factor | |
|---|---|---|
| NC Background | 3.18 | 10.0 |
| External Event Background | 5.98 | 44.9 |
| & from Decay Background | 7.85 | 14.8 |
| & from Decay Background | 2.95 | 16.3 |
| & from Decay Background | 1.88 | 16.1 |
| Other & Background | 3.21 | 12.5 |
| NC Background | 1.75 | 17.2 |
| Best Fit Oscillations | 1.24 | 8.4 |
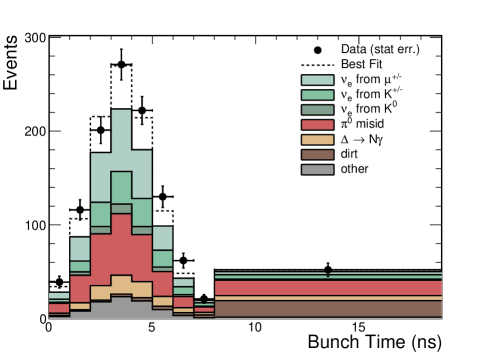
Single-gamma backgrounds from external neutrino interactions (“dirt” backgrounds) are estimated using topological and spatial cuts to isolate the events whose vertices are near the edge of the detector and point towards the detector center [30]. The external event background estimate has been confirmed by measuring the absolute time of signal events relative to the proton beam microstructure (52.81 MHz extraction frequency), which corresponds to buckets of beam approximately every 18.9 ns. Fig. 24 shows that the event excess peaks in the 8 ns window associated with beam bunch time, as expected from neutrino events in the detector, and is inconsistent with external neutrino events or beam-off events, which would be approximately flat in time. Also, the observed background level outside of the beam agrees well with the predicted background estimate. In addition, good agreement is obtained for the event excess with . The timing reconstruction performed here is similar to the reconstruction in reference [24], but with a different time offset applied.
The background is determined from the NC event sample [29], which has contributions from production in 12C (52.2%), production in H2 (15.1%), coherent scattering on 12C (12.5%), coherent scattering on H2 (3.1%), higher-mass resonances (12.9%), and non-resonant background (4.2%). The fraction of decays to is 2/3 from the Clebsch-Gordon coefficients, and the probability of pion escape from the 12C nucleus is estimated to be 62.5%. The radiative branching fraction is 0.60% for 12C and 0.68% for H2 after integration over all the invariant mass range, where the single gamma production branching ratio increases below the pion production threshold. With these values, the ratio of single gamma events to NC events, , can be estimated to be
Note that single gamma events are assumed to come entirely from radiative decay. The total uncertainty on this ratio is 14.0% (15.6%) in neutrino (antineutrino) mode. This estimate of agrees fairly well with theoretical calculations of the single gamma event rate [31].
The intrinsic background comes almost entirely from muon and kaon decay-in-flight in the beam decay pipe. MiniBooNE CCQE event measurements [28] constrain the size and energy dependence of the intrinsic background from muon decay, while the intrinsic background from kaon decay is constrained by fits to kaon production data and SciBooNE measurements [32]. Furthermore, due to the higher energy of the intrinsic background, this background is disfavored from the fit to the radial distribution, as shown in Table 4.
Finally, backgrounds from exotic decay in the neutrino production target are ruled out from the MiniBooNE beam-dump run, where the incident proton beam was steered above the Be target and interacted in the steel beam dump at the downstream end of the decay pipe. No excess of events was observed [24], which set limits on light dark matter and other exotic decays.
VII Constraints on NC Background with Tighter Radius Selection
Explanations for the event excess have included unsimulated photons entering the detector from external interactions and the undersimulation of photons lost from production within the detector. To test these explanations in a model-independent way, we can use our higher event statistics to study the change in the excess as a function of tighter fiducial volume cuts. The NC and external event backgrounds preferentially populate higher radius compared to electron neutrino interactions. Therefore, reducing the fiducial radius is expected to reduce the significance of the excess if it is due to these backgrounds and increase the significance of the excess if its distribution is -like. If we change the standard 5 m cut to 4 m, we find there are 1978 data events in neutrino mode, background events, and an excess of events (). If we use a 3 m cut, we find 864 data events, background events, and an excess of events (), consistent with what is expected if the signal is more -like. The event statistics are shown in Table 2, while Figs. 25 and 26 show the reconstructed neutrino energy and distributions for electronlike events with radius less than 4 m for both data events and background events.
VIII Conclusion
In summary, the MiniBooNE experiment observes a total excess of electronlike events in the energy range MeV in both neutrino and antineutrino running modes. The overall significance of the excess, , is limited by systematic uncertainties, assumed to be Gaussian, as the statistical significance of the excess is . All of the major backgrounds are constrained by in situ event measurements. Beam timing information shows that almost all of the excess is in time with neutrinos that interact in the detector. The radius distribution shows that the excess is distributed throughout the volume, while tighter cuts on the fiducal volume increase the significance of the excess. The data likelihood ratio disfavors models that explain the event excess due to entering or exiting photons. The MiniBooNE event excess will be further studied by the Fermilab short-baseline neutrino (SBN) program [33] and by the JSNS2 experiment at J-PARC [34].
Acknowledgements.
We acknowledge the support of Fermilab, the Department of Energy, and the National Science Foundation, and we acknowledge Los Alamos National Laboratory for LDRD funding.References
- [1] C. Athanassopoulos et al., Phys. Rev. Lett. 75, 2650 (1995); 77, 3082 (1996); 81, 1774 (1998); Phys. Rev. C. 54, 2685 (1996); 58, 2489 (1998); A. Aguilar et al., Phys. Rev. D 64, 112007 (2001).
- [2] A. A. Aguilar-Arevalo et al., Phys. Rev. Lett. 98, 231801 (2007); Phys. Rev. Lett. 102, 101802 (2009); Phys. Rev. Lett. 105, 181801 (2010); Phys. Rev. Lett. 110, 161801 (2013).
- [3] A. A. Aguilar-Arevalo et al., Phys. Rev. Lett. 121, 221801 (2018).
- [4] M. Sorel, J. M. Conrad, and M. H. Shaevitz, Phys. Rev. D 70, 073004 (2004).
- [5] G. Karagiorgi, Z. Djurcic, J. M. Conrad, M. H. Shaevitz, and M. Sorel, Phys. Rev. D 80, 073001 (2009); D 81, 039902(E) (2010).
- [6] G.H. Collin, C.A. Argüelles, J.M. Conrad, and M.H. Shaevitz, Phys. Rev. Lett. 117, 221801 (2016).
- [7] C. Giunti and M. Laveder, Phys. Lett. B 706, 200 (2011); Phys. Rev. D84, 073008, (2011).
- [8] S. Gariazzo, C. Giunti, M. Laveder, and Y.F. Li, J. High Energy Phys. 06 (2017) 135.
- [9] Sebastian Boser, Christian Buck, Carlo Giunti, Julien Lesgourgues, Livia Ludhova, Susanne Mertens, Anne Schukraft, and Michael Wurm, Prog. Part. Nucl. Phys. 111 (2020) 103736.
- [10] J. Kopp, M. Maltoni, and T. Schwetz, Phys. Rev. Lett. 107, 091801 (2011); Joachim Kopp, Pedro A.N. Machado, Michele Maltoni, and Thomas Schwetz, J. High Energy Phys. 05 (2013) 050.
- [11] Mona Dentler, Alvaro Hernandez-Cabezudo, Joachim Kopp, Pedro Machado, Michele Maltoni, Ivan Martinez-Soler, and Thomas Schwetz, J. High Energy Phys. 08 (2018) 010.
- [12] K. N. Abazajian et al., arXiv:1204.5379.
- [13] J. M. Conrad, C. M. Ignarra, G. Karagiorgi, M. H. Shaevitz, and J. Spitz, Adv. High Energy Phys. 2013, 1 (2013).
- [14] A. Diaz, C. A. Argüelles, G. H. Collin, J. M. Conrad, and M. H. Shaevitz, Phys. Rep. 884, 1 (2020).
- [15] J. Asaadi, E. Church, R. Guenette, B. J. P. Jones, and A. M. Szelc, Phys. Rev. D 97, 075021 (2018); G. Karagiorgi, M. H. Shaevitz, and J. M. Conrad, arXiv:1202.1024; Heinrich Paes, Sandip Pakvasa, and Thomas J. Weiler, Phys. Rev. D 72, 095017 (2005); Dominik Doring, Heinrich Pas, Philipp Sicking, and Thomas J. Weiler, Eur. Phys. J. C 80, 1202 (2020).
- [16] V. A. Kostelecky and M. Mewes, Phys. Rev. D 69, 016005 (2004); T. Katori, V. A. Kostelecky, and R. Tayloe, Phys. Rev. D 74, 105009 (2006); Jorge S. Diaz and V. A. Kostelecky, Phys. Lett. B 700, 25 (2011); Jorge S. Diaz and V. A. Kostelecky, Phys. Rev. D 85, 016013 (2012).
- [17] S. N. Gninenko, Phys. Rev. Lett. 103, 241802 (2009); S. N. Gninenko and D. S. Gorbunov, Phys. Rev. D 81, 075013 (2010); Yang Bai, Ran Lu, Sida Lu, Jordi Salvado, and Ben A. Stefanek, Phys. Rev. D 93, 073004 (2016); Zander Moss, Marjon H. Moulai, Carlos A. Argüelles, and Janet M. Conrad, Phys. Rev. D 97, 055017 (2018); Enrico Bertuzzo, Sudip Jana, Pedro A. N. Machado, and Renata Zukanovich Funchal, Phys. Rev. Lett. 121, 241801 (2018); Peter Ballett, Silvia Pascoli, and Mark Ross-Lonergan, Phys. Rev. D 99, 071701 (2019); Oliver Fischer, Alvaro Hernandez-Cabezudo, and Thomas Schwetz, Phys. Rev. D 101 7, 075045 (2020); M. H. Moulai, C. A. Argüelles, G. H. Collin, J. M. Conrad, A. Diaz, and M. H. Shaevitz, Phys. Rev. D 101, 055020 (2020); Mona Dentler, Ivan Esteban, Joachim Kopp, and Pedro Machado, Phys. Rev. D 101, 115013 (2020); Andre de Gouvea, O. L. G. Peres, Suprabh Prakash, and G. V. Stenico, JHEP 07, 141 (2020); Carlos A. Argüelles, Matheus Hostert, and Yu-Dai Tsai, Phys. Rev. Lett. 123, 261801 (2019); Alakabha Datta, Saeed Kamali, and Danny Marfatia, Phys. Lett. B 807, 135579 (2020); Asli Abdullahi, Matheus Hostert, and Silvia Pascoli, arXiv:2007.11813.
- [18] Bhaskar Dutta, Sumit Ghosh, and Tianjun Li, Phys. Rev. D 102, 055017 (2020); Waleed Abdallah, Raj Gandhi, and Samiran Roy, JHEP 12, 188 (2020); Waleed Abdallah, Raj Gandhi, and Samiran Roy, arXiv:2010.06159.
- [19] Jiajun Liao and Danny Marfatia, Phys. Rev. Lett. 117, 071802 (2016).
- [20] Marcela Carena, Ying-Ying Li, Camila S. Machado, Pedro A. N. Machado, Carlos E. M. Wagner, Phys. Rev. D 96, 095014 (2017).
- [21] A. A. Aguilar-Arevalo et al., Nucl. Instrum. Methods Phys. Res., Sect. A 599, 28 (2009).
- [22] R. B. Patterson, E. M. Laird, Y. Liu, P. D. Meyers, I. Stancu, and H. A. Tanaka, Nucl. Instrum. Methods Phys. Res., Sect. A 608, 206 (2009).
- [23] A. A. Aguilar-Arevalo et al., Phys. Rev. D 81, 092005 (2010); A. A. Aguilar-Arevalo et al., Phys. Rev. D 88, 032001 (2013).
- [24] A. A. Aguilar-Arevalo et al. (MiniBooNE Collaboration), Phys. Rev. Lett. 118, 221803 (2017); A. A. Aguilar-Arevalo et al. (MiniBooNE Collaboration), Phys. Rev. D 98, 112004 (2018).
- [25] A. A. Aguilar-Arevalo et al., Phys. Rev. D 84, 072005 (2011).
- [26] B. Armbruster et al., Phys. Rev. D 65, 112001 (2002).
- [27] N. Agafonova et al., arXiv:1803.11400.
- [28] A. A. Aguilar-Arevalo et al., Phys. Rev. D 81, 092005 (2010); Phys. Rev. Lett. 100, 032301 (2008).
- [29] A. A. Aguilar-Arevalo et al., Phys. Rev. D 81, 013005 (2010); Phys. Lett. B. 664, 41 (2008).
- [30] A. A. Aguilar-Arevalo et al., Phys. Rev. Lett. 102, 101802 (2009).
- [31] D. Rein and L. M. Sehgal, Phys. Lett. 104B, 394 (1981); S. S. Gershtein, Yu. Ya. Komachenko, and M. Yu. Khlopov, Sov. J. Nucl. Phys. 33, 860 (1981); Jeffrey A. Harvey, Christopher T. Hill, and Richard J. Hill, Phys. Rev. Lett. 99, 261601 (2007); Tina Leitner, Oliver Buss, Ulrich Mosel, and Luis Alvarez-Ruso, arXiv:0809.3986; J. P. Jenkins and T. Goldman, Phys. Rev. D 80, 053005 (2009); Artur M. Ankowski, Omar Benhar, Takaaki Mori, Ryuta Yamaguchi, and Makoto Sakuda, Phys. Rev. Lett. 108, 052505 (2012); K. M. Graczyk, D. Kielczewska, P. Przewlocki, and J. T. Sobczyk, Phys. Rev. D 80, 093001 (2009); V. P. Efrosinin, Yu. G. Kudenko, and A. N. Khotjantsev, Phys. At. Nucl. 72, 459 (2009); Richard J. Hill, Phys. Rev. D 81, 013008 (2010); Richard J. Hill, Phys. Rev. D 84, 017501 (2011); Xilin Zhang and Brian D. Serot, Phys. Lett. B 719, 409 (2013); Phys. Rev. C 86, 035502 (2012); Phys. Rev. C 86, 035504 (2012); Brian D. Serot and Xilin Zhang, Phys. Rev. C 86, 015501 (2012); E. Wang, L. Alvarez-Ruso, and J. Nieves, Phys. Rev. C 89, 015503 (2014); Phys. Lett. B 740, 16 (2015).
- [32] G. Cheng et al., Phys. Rev. D 84, 012009 (2011); C. Mariani, G. Cheng, J. M. Conrad and M. H. Shaevitz, Phys. Rev. D 84, 114021 (2011).
- [33] M. Antonello et al., arXiv:1503.01520.
- [34] M. Harada et al., arXiv:1310.1437.