Sum-Frequency Signals in 2D-Terahertz-Terahertz-Raman Spectroscopy
1 Abstract
We demonstrate that halogenated methane 2D-Terahertz Terahertz Raman (2D-TTR) spectra are determined by the complicated structure of the instrument response function (IRF) along and by the molecular coherences along . Experimental improvements have helped increase the resolution and dynamic range of the measurements, including accurate THz pulse shape characterization. Sum-frequency excitations convolved with the IRF are found to quantitatively reproduce the 2D-TTR signal. A new Reduced Density Matrix model which incorporates sum-frequency pathways, with linear and harmonic operators fully supports this (re)interpretation of the 2D-TTR spectra.
2 Main text
Observing interactions within the low-frequency, thermally populated continuum of bath states is critical to developing a molecular understanding of liquid dynamics at room temperature. This energy regime is predominantly characterized by broad inter-molecular modes with short coherence times (100s fs) which complicate the measurement and interpretation of potential energy, dipole and polarizability surfaces. One exception to this general observation are the intra-molecular vibrational modes of the halogenated methane (HM) family of liquids, whose well-defined coherent vibrational signals have long been observed in optical Kerr effect (OKE) experiments.1, 2
Multidimensional time-resolved spectroscopy methods seek to disentangle these ambiguous spectra by introducing an additional time delay which separates dynamics along a second axis. The 5th order Raman technique3 extends OKE to two dimensions and provides information on electrical and mechanical anharmonicities of the liquid, but practical implementation of this method is quite challenging.4, 5 A trio of 3rd order terahertz-Raman hybrid spectroscopies have been proposed as alternatives to 5th order Raman spectroscopy that avoid some technical challenges inherent to 5th order spectroscopy.6, 7, 8, 9, 10 However, new challenges emerge in the hybrid techniques, especially compared to the more common 2D-infrared (2D-IR) spectroscopy. First, there are no commercially available dispersive THz spectrometers with adequate sensitivity to directly detect the emitted THz signal in THz-Raman-THz (2D-TRT) and Raman-THz-THz (2D-RTT) measurements. Instead, the 2D-TRT/RTT techniques have used time-domain electro-optic sampling to capture the faint THz emission.11 2D-TTR avoids this step by using a Raman probe pulse which generates an easily detected near-IR signal photon. In all the cases of hybrid THz-Raman spectroscopies, the poorly defined THz wave vector precludes a phase-matching box-CARS style geometry that could be used to discriminate between signals originating from different quantum mechanical coherence pathways.
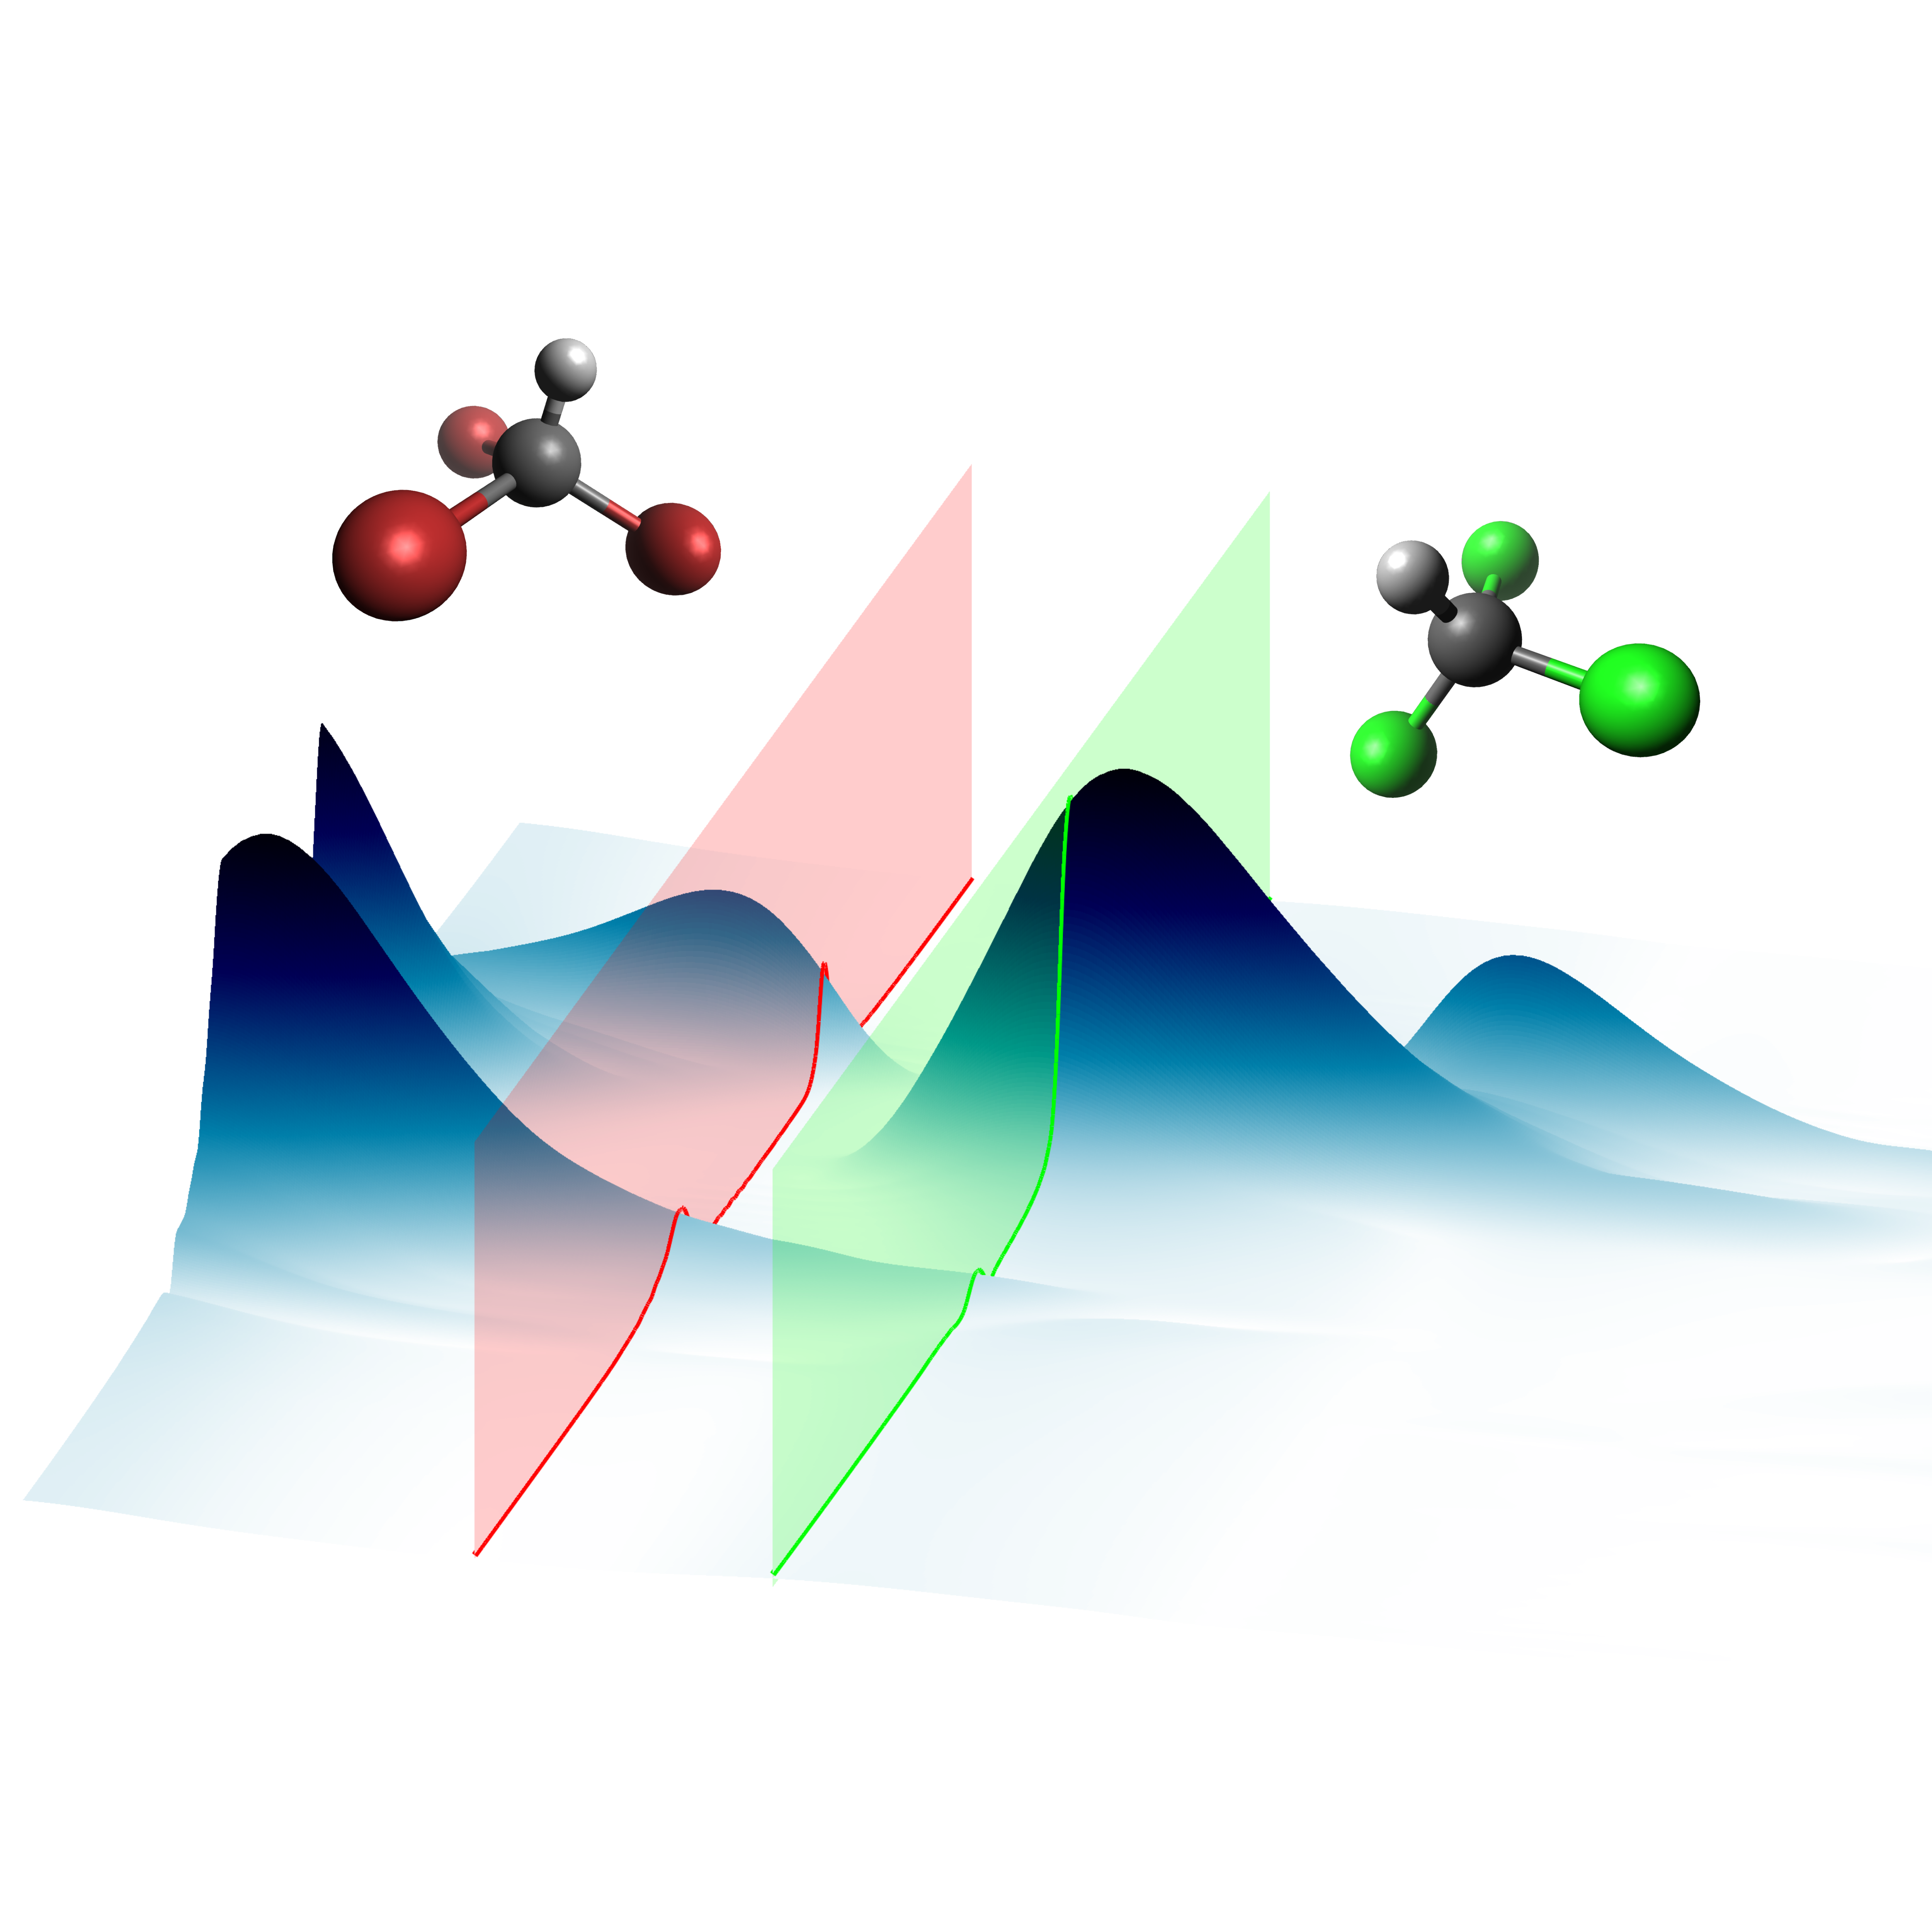
With 2D-TTR spectroscopy, complex spectra have been observed in several halogenated methane (HM) liquids, and were interpreted as signatures of coherent energy transfer pathways between intra-molecular vibrational modes.12, 13, 14, 15. A thorough re-investigation of two HM liquids – bromoform (CHBr3) and chloroform (CHCl3) – casts doubt on this original interpretation. Our new investigation is enabled by the development of a single-shot 2D-TTR spectrometer16 which records tens of picoseconds of molecular dynamics in a single acquisition. From the order of magnitude speed-up, the new technique provides substantially higher signal-to-noise data which has allowed a much larger region of the molecular response to be measured, and at finer resolution.
We demonstrate through experiment, models, and theoretical simulations that the features observed in the HM 2D-TTR spectra arise from convolutions between the instrument response function (IRF) and linear interactions with the molecular polarizability operator . This interaction requires a scattering with two instantaneous THz photons, and is therefore referred to throughout the text as a sum-frequency (SF) excitation process. (Very recent experimental and theoretical works have also observed efficient phonon excitation through the same linear- interaction with two THz field interactions.17, 18, 19) Resonant nonlinear interactions with the transition dipole operator , while also in principal weakly allowed, are not detected.
We begin by re-examining the relative importance of the (resonant) and (sum-frequency) excitation pathways in HM vibrational modes. Ladder diagrams in Fig. 2 illustrate the two competing pathways as well as the OKE process, which is analogous to SF-TKE. In order to observe the desired nonlinear THz signal, the resonant pathway must have a larger or (at least) comparable magnitude with the sum-frequency pathway. This is a difficult condition to satisfy in HMs since the resonant process is nonlinear with respect to while the sum-frequency pathway is linear in .
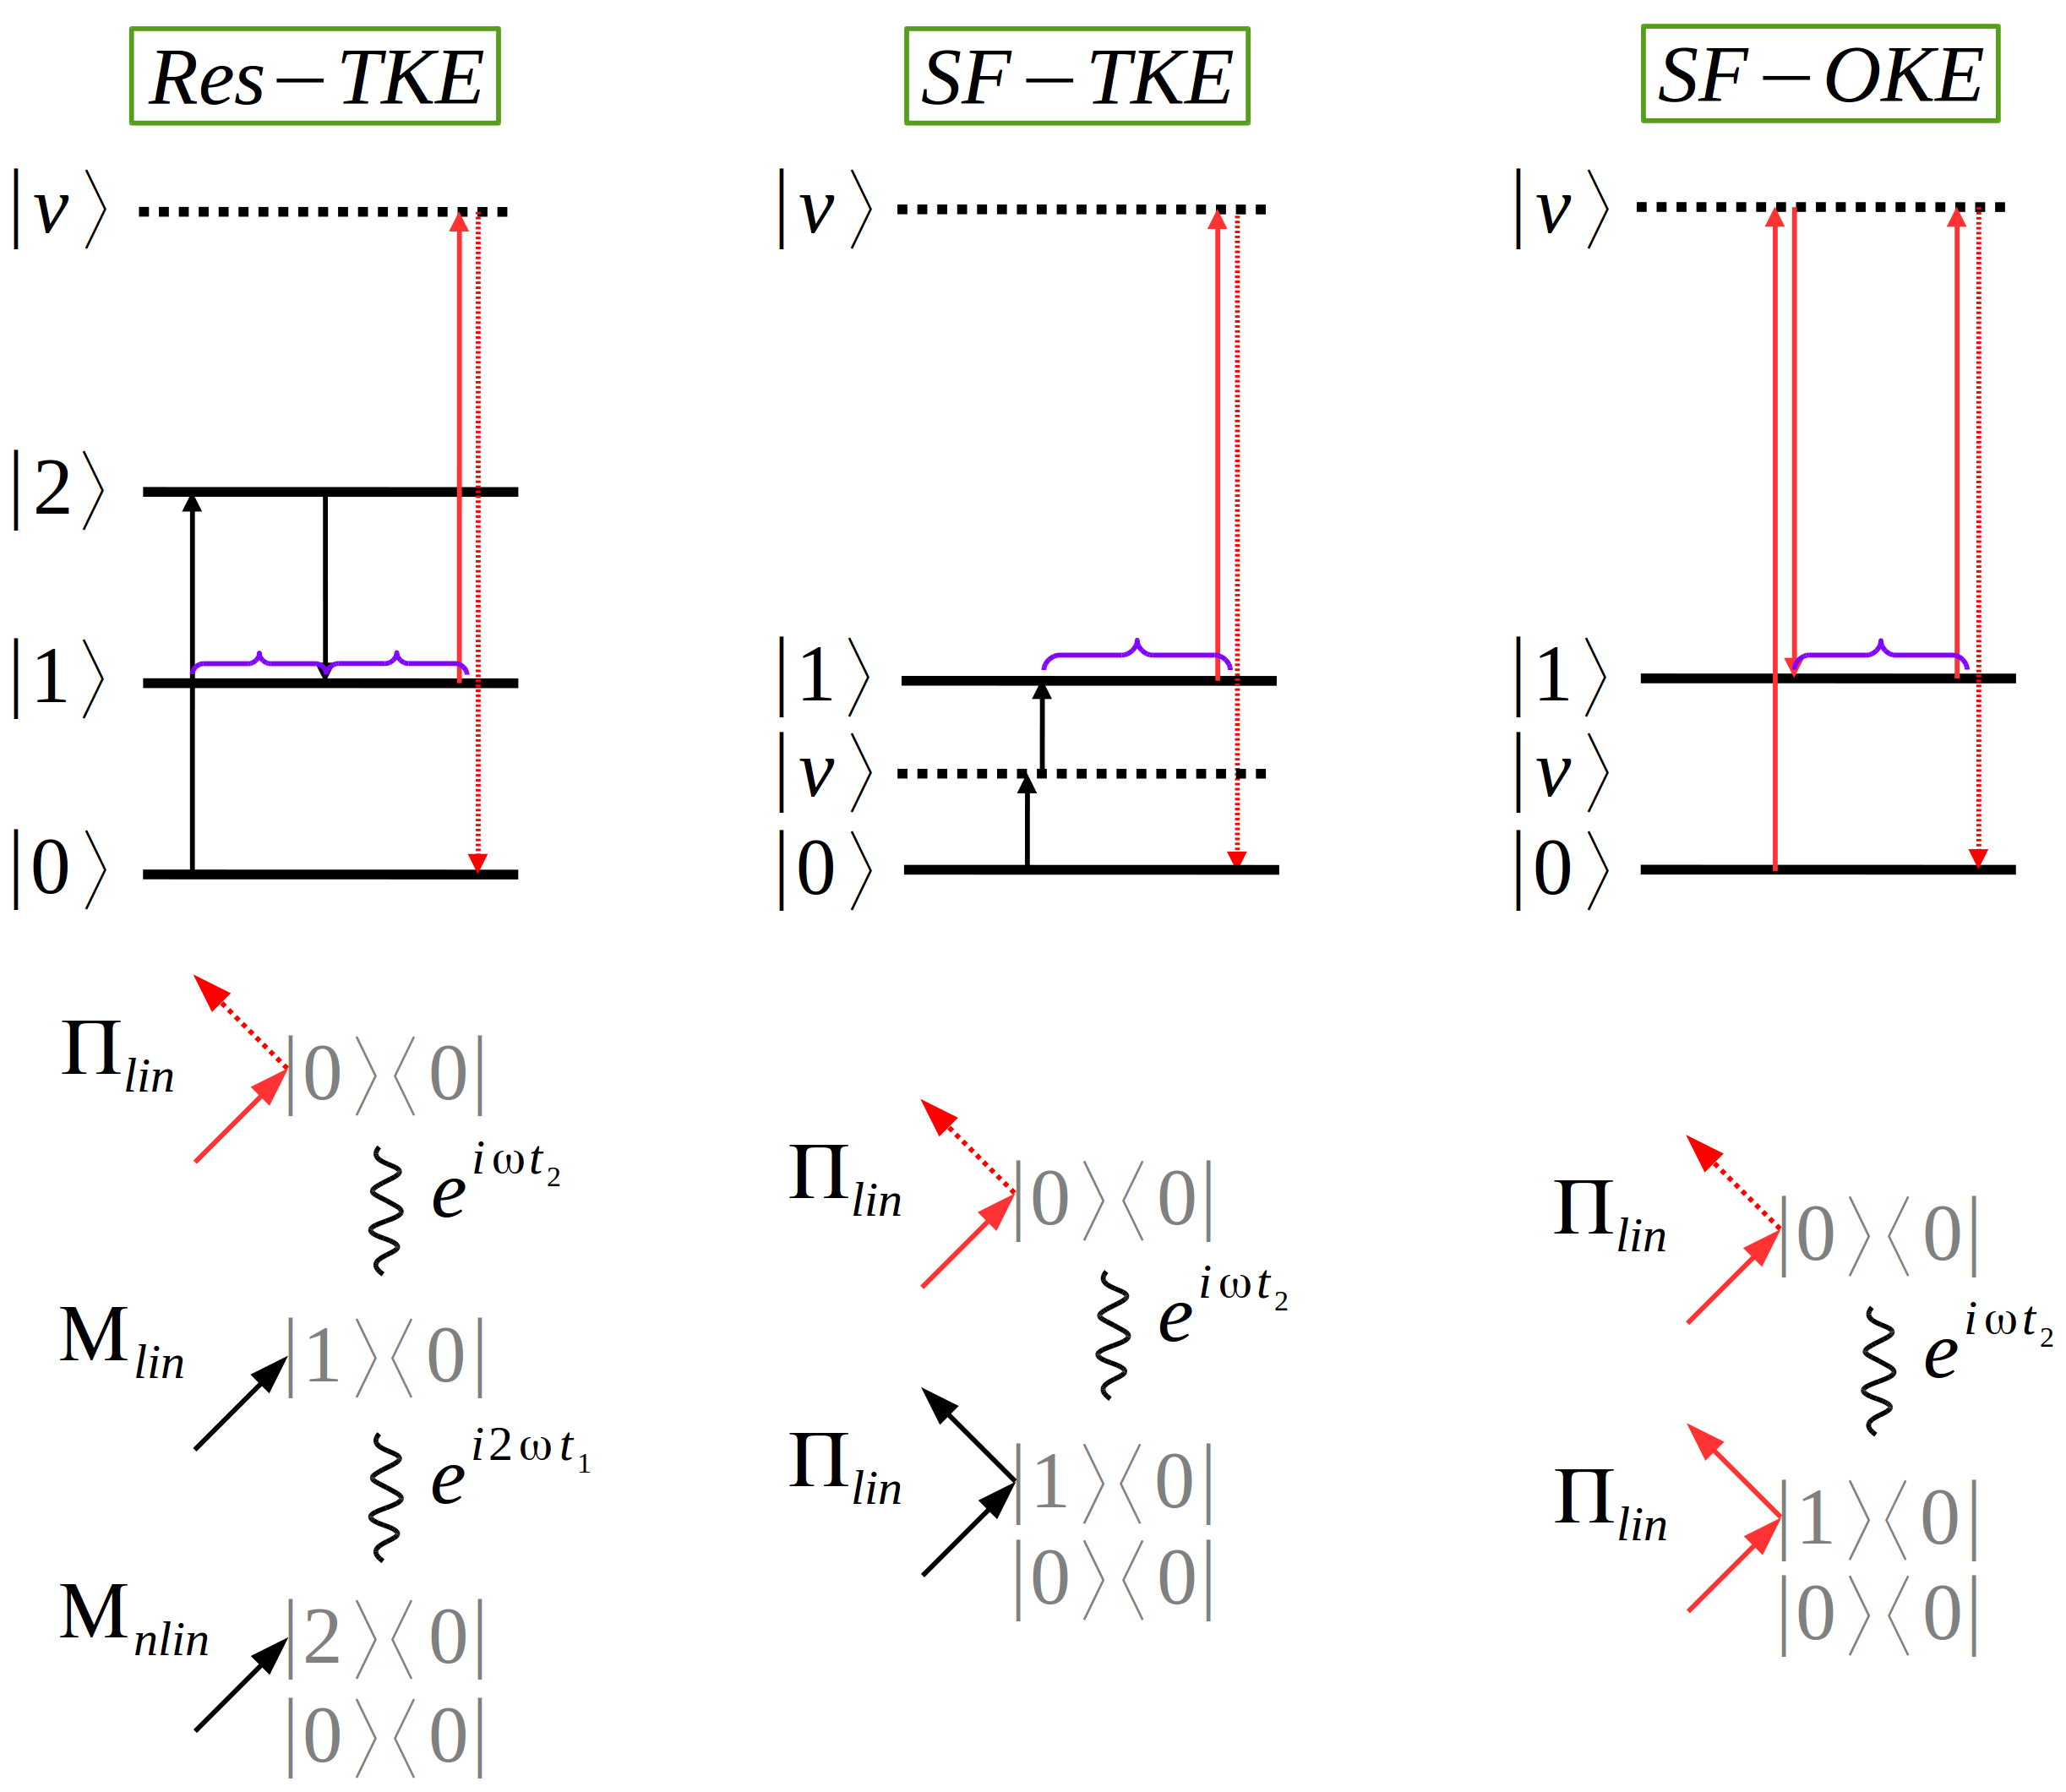
Sum-frequency and resonant excitation pathways have distinct responses. A clear sign of resonant interactions is a prolonged vibrational response along which arises from the generation of a vibrational coherence during the first THz field interaction. From 2D-TTR measurements, molecular coherences extending in excess of 5 ps along have been observed in HMs, suggesting a resonant signal should have a commensurate lifetime along . In contrast, sum-frequency excitation cannot directly generate coherent states through a single field interaction, but instead require two instantaneous interactions. In this case, the extent of a molecular response along will be determined by the duration of temporal overlap of the two THz electric field waveforms.
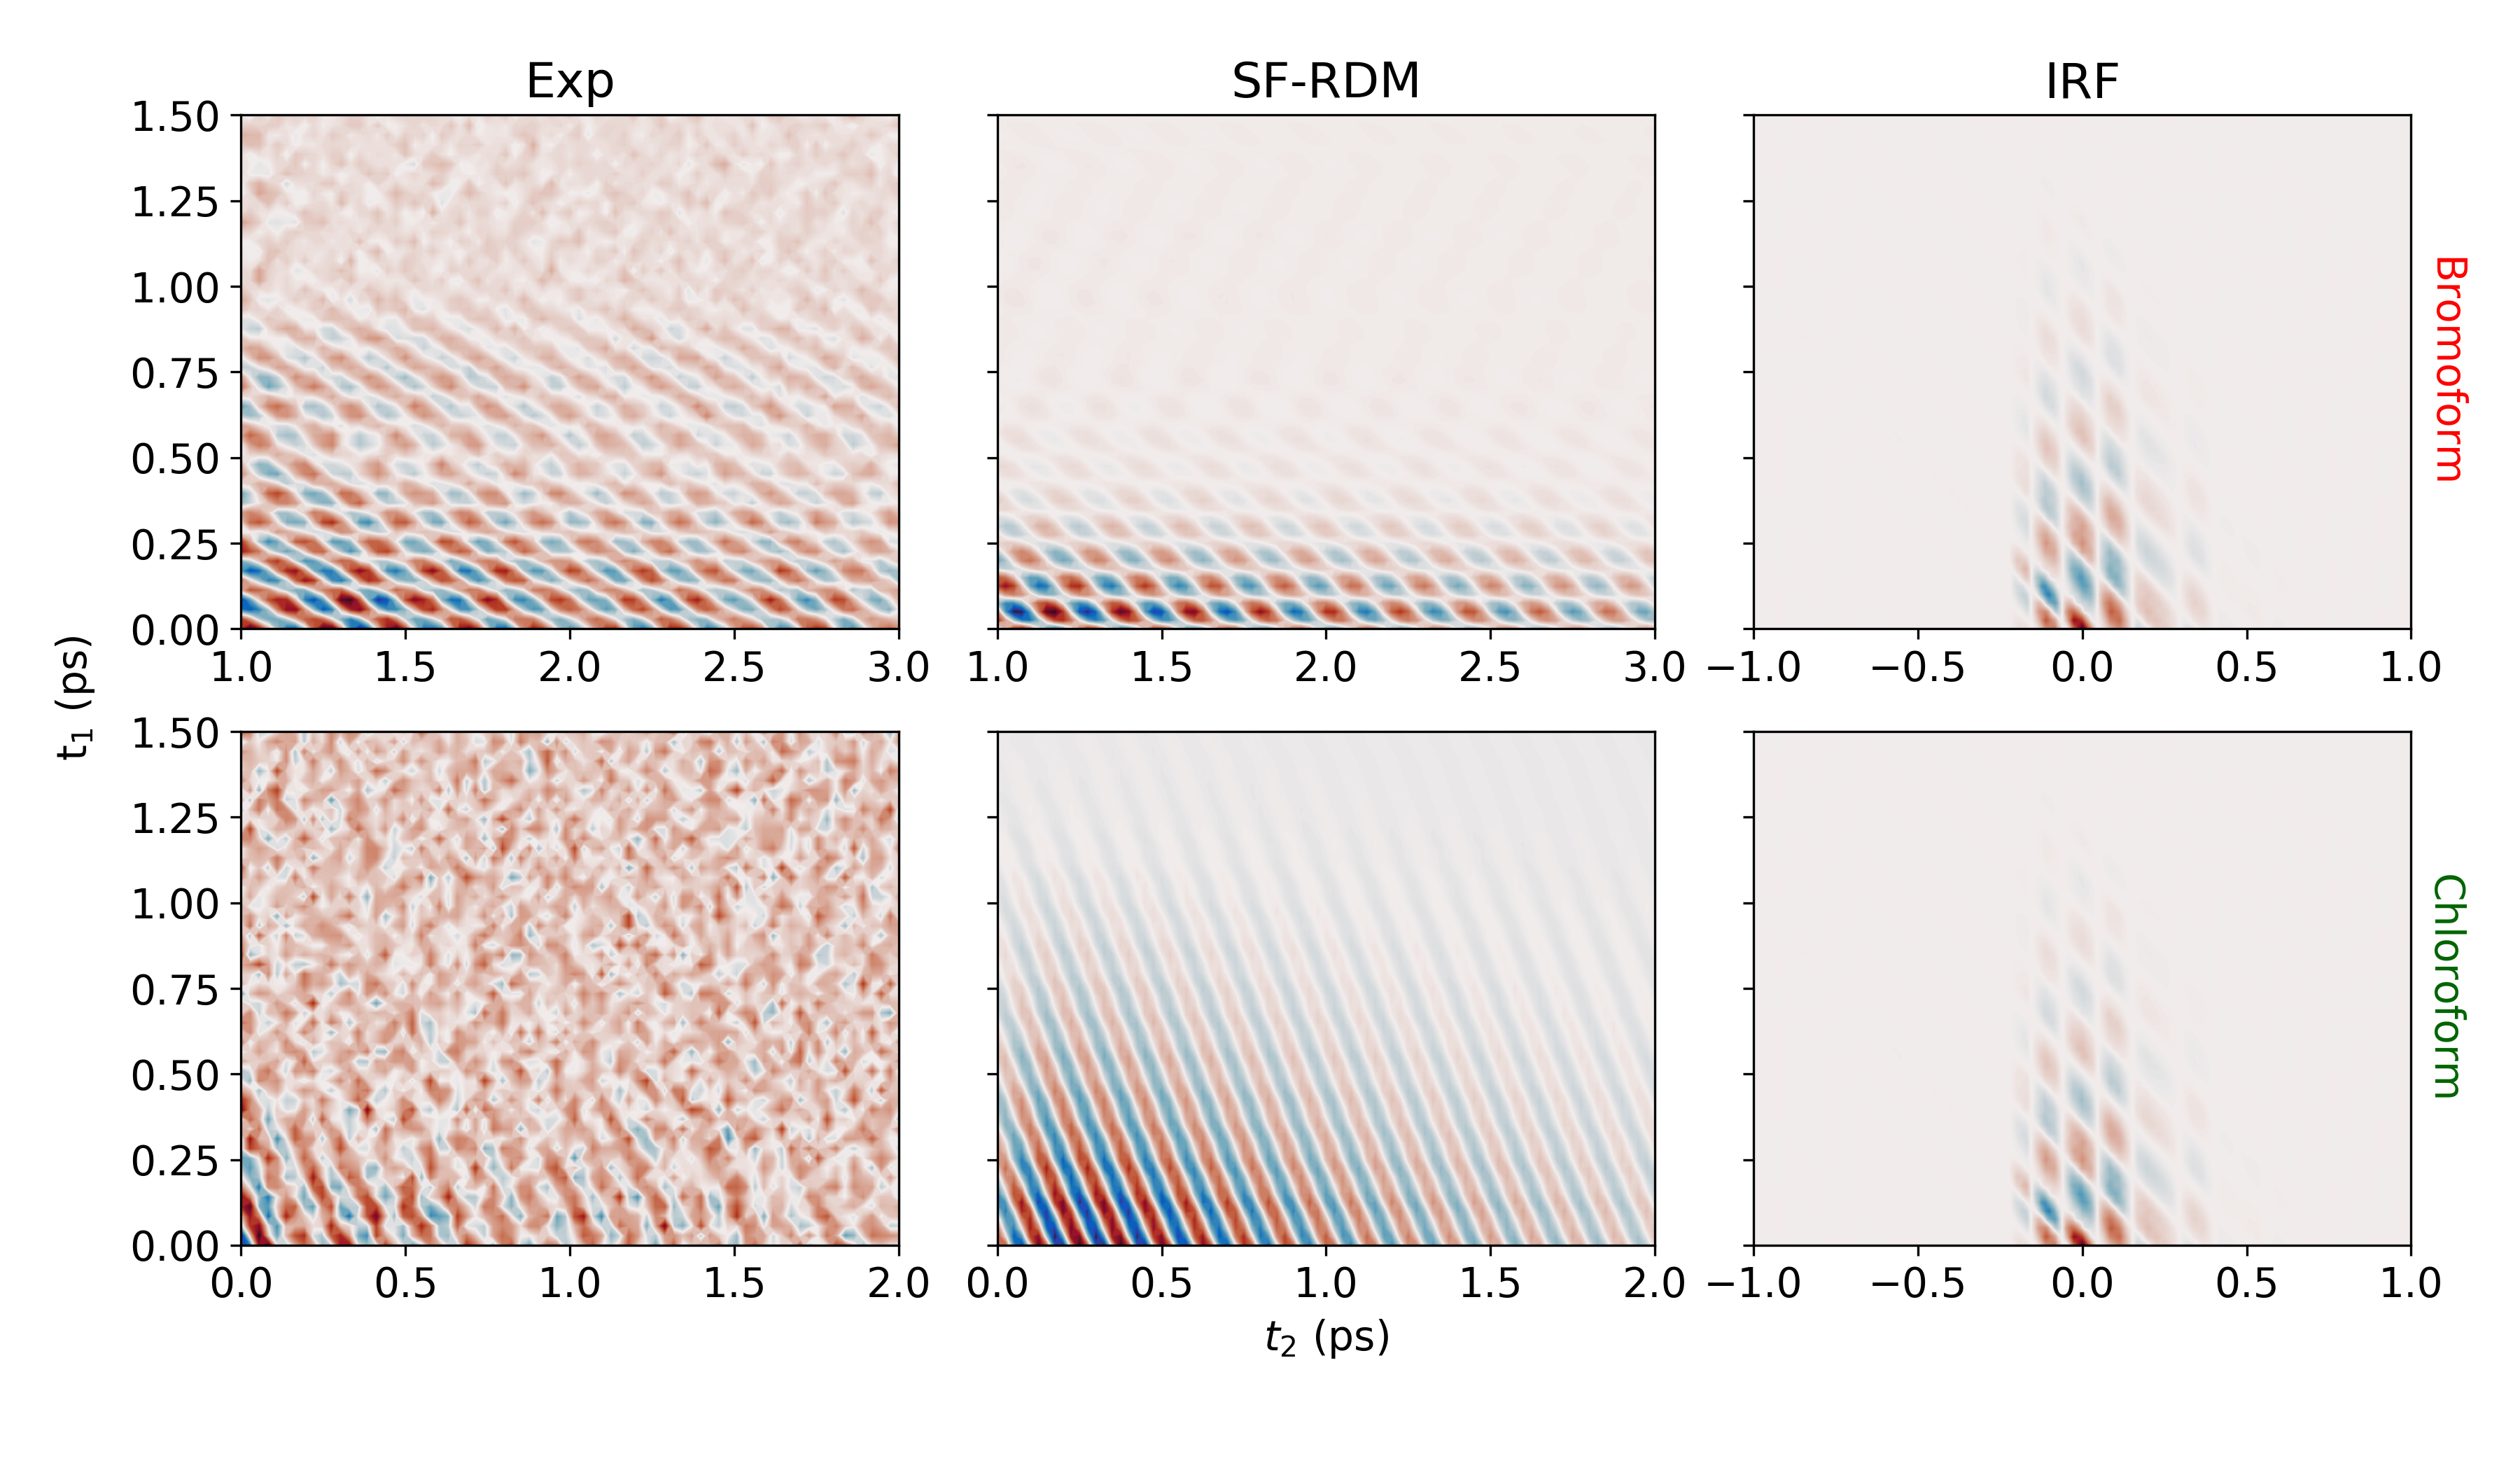
In Fig. 3 time-domain bromoform and chloroform measurements recorded under identical experimental conditions are shown. The initial key observation is that while the response is long-lived, the response along never extends past the region of THz field overlap. Both bromoform’s and chloroform’s vibrational coherent responses are therefore far more consistent with a SF excitation mechanism than a resonant process.
The different bandwidth requirements of the two processes provides a second argument supporting SF excitation as the dominant pathway. In both SF and resonant 2D-TTR pathways, a vibrational mode must begin and end the measurement in a population state. In addition, the Raman probe interaction only changes the vibrational quanta by . If a non-linearity is present, one of the THz field interactions must produce either a zero-quanta or two-quanta excitation, which in the latter case necessitates a bandwidth spanning .20 (No evidence for zero-quanta transitions in HM vibrational modes have been observed.) Again, this is quite different from 2D-IR spectroscopies. SF excitation, on the other hand, progresses with a bandwidth . The experimental THz field bandwidth spans 1-5 THz, and therefore the 2D-TTR experiment lacks the necessary frequency content to produce vibrational coherences arising from non-linearities in the molecular Hamiltonian.
Given that sum-frequency excitation is the predominant source of the signals observed in 2D-TTR spectroscopy of HMs, a key mystery becomes how this mechanism, whose instantaneous nature precludes separating the two THz field interactions in time, can nonetheless produce a signal which varies along ? We interrogate the origins of this complex response by considering how the observed signal depends upon the IRF (Eq. 2). In a 2D-TTR experiment, two orthogonally polarized THz fields ( in the laboratory frame) create a birefringent response within the room-temperature HM liquid sample. A polarized Raman probe scatters off this birefringence, producing a polarized signal field that is selectively isolated through an analyzing polarizer and differential chopping. The 2D-TTR signal is proportional to the anisotropic third-order molecular response function , and contains information on the molecular orientational and vibrational correlation functions of the system. During the measurement process, this response is inevitably convolved with the experimental IRF, which in 2D-TTR is determined by the product of the two THz electric fields.
| (1) |
Through the convolution theorem, the time-domain convolution becomes a multiplication between the IRF spectral power and the HM molecular response function upon transformation to the frequency domain.
| (2) |
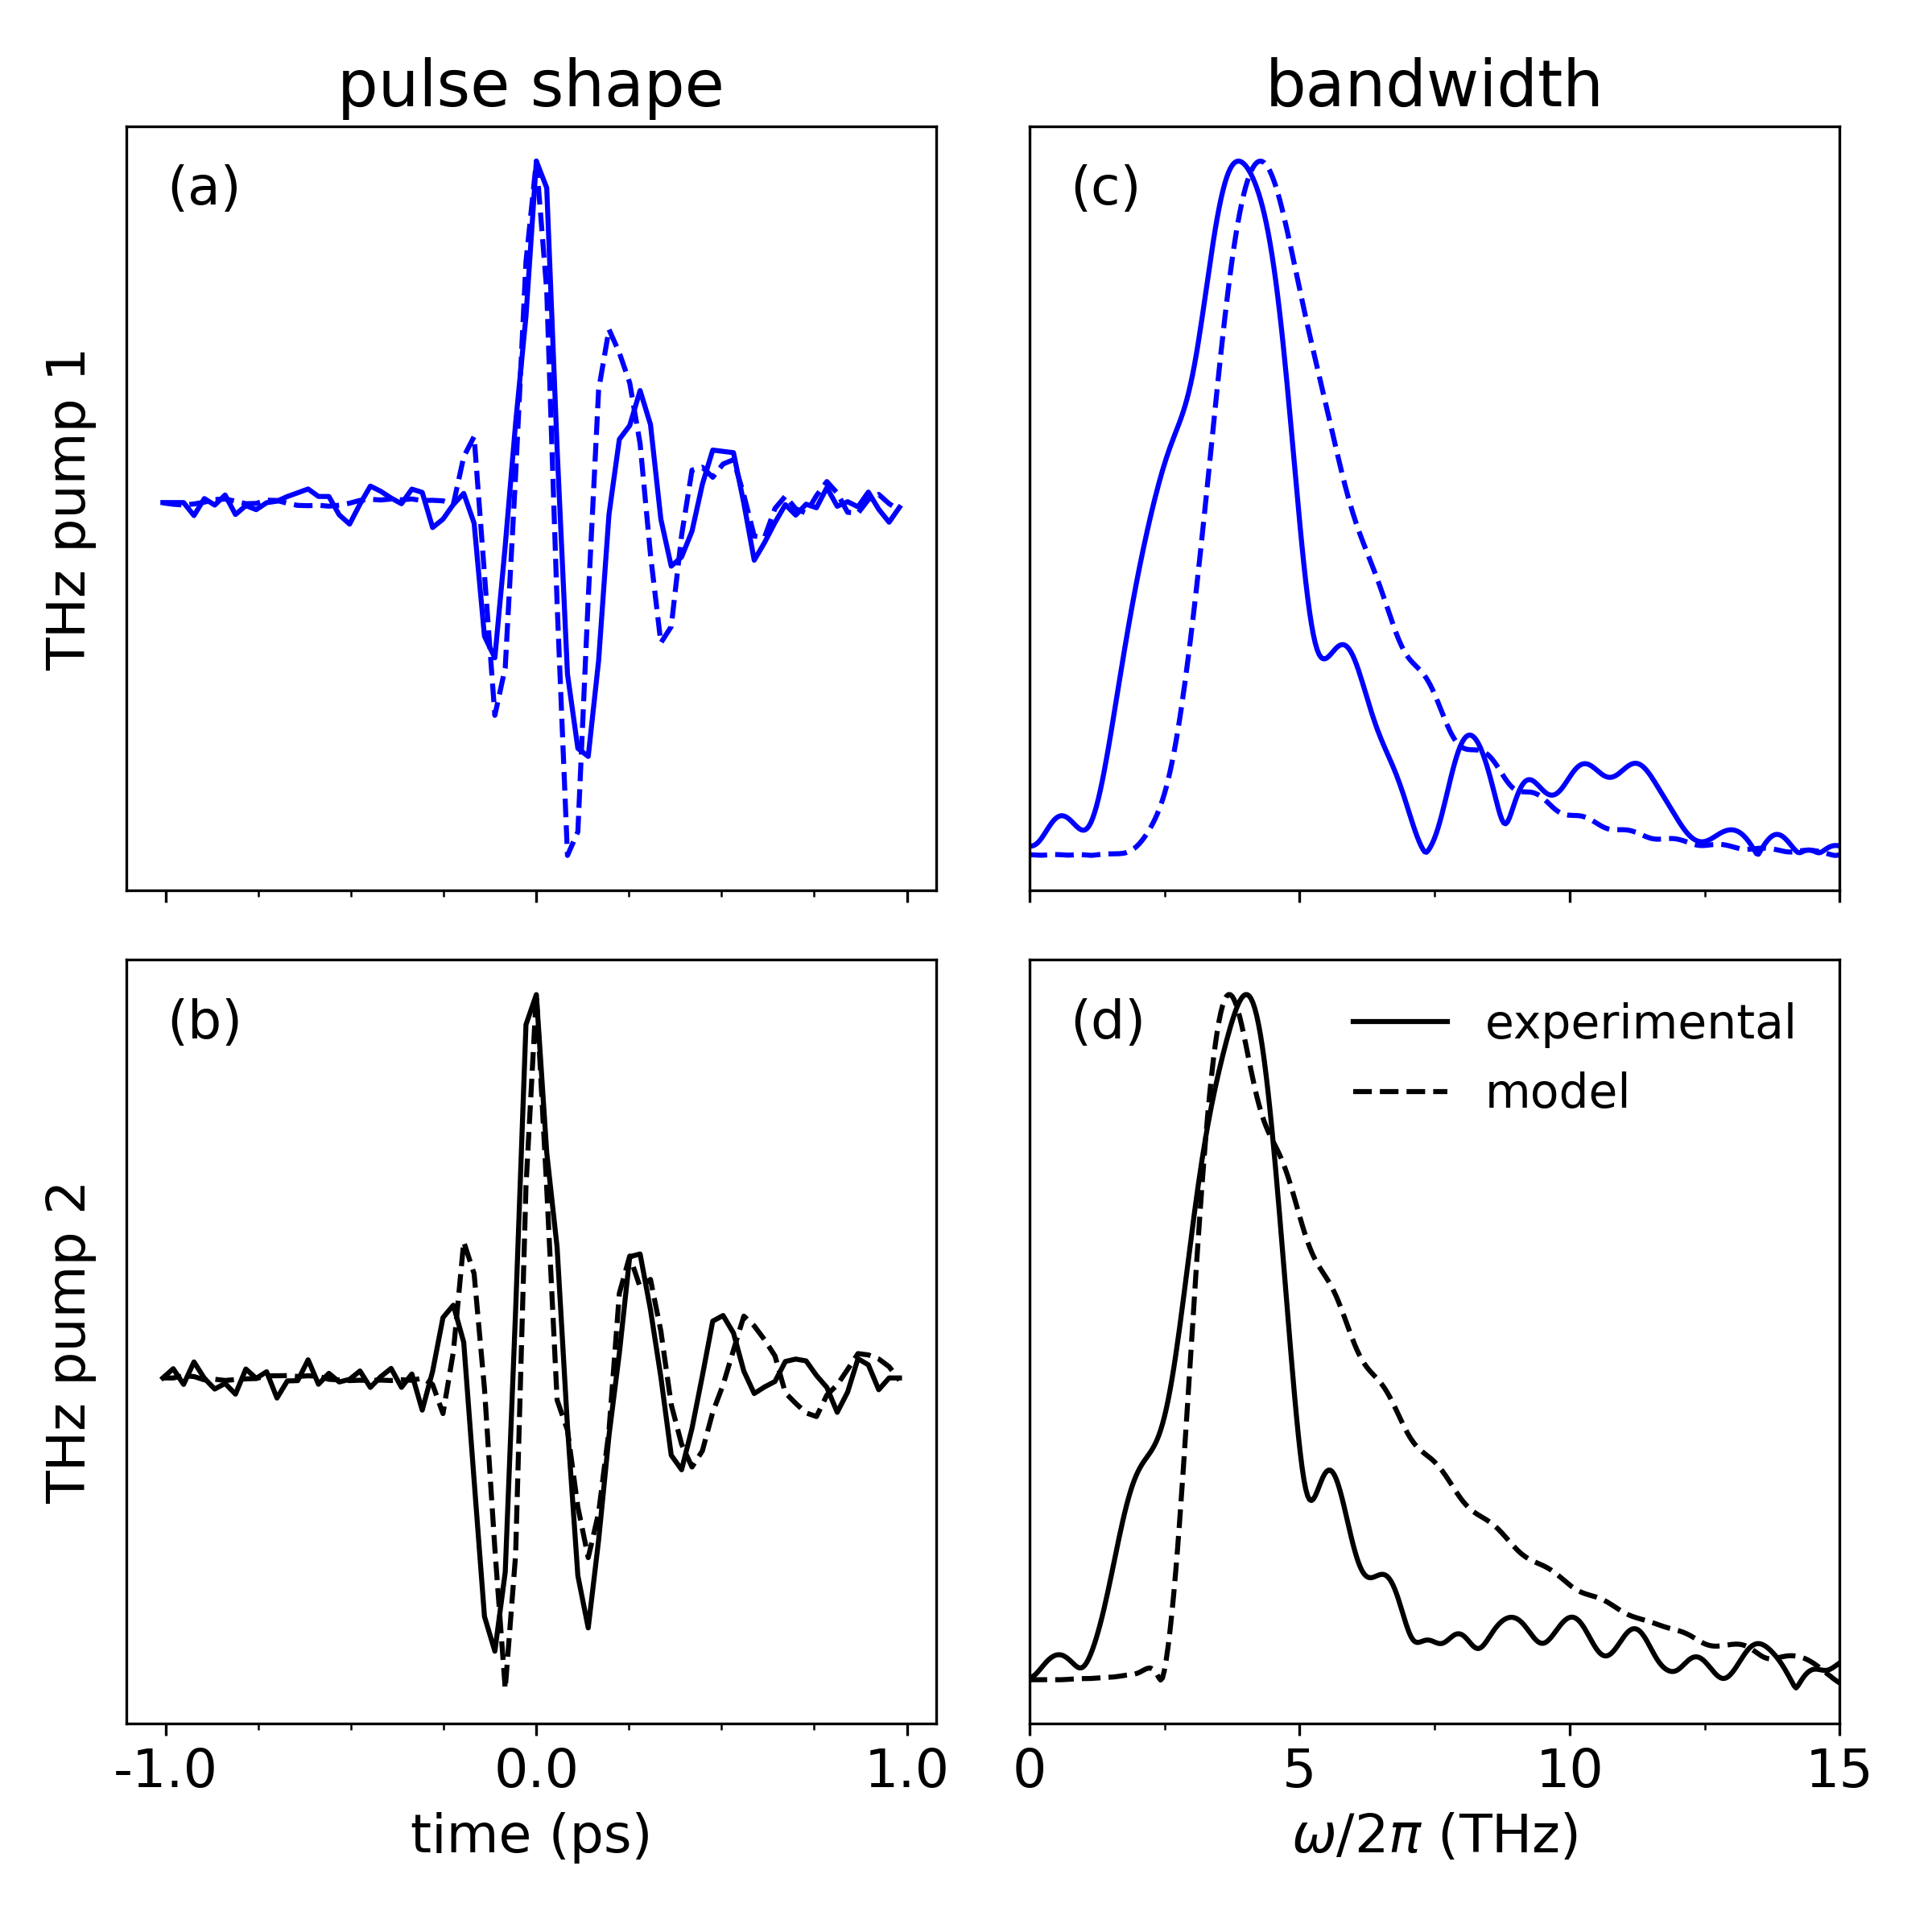
We study the impact of IRF convolution in two ways. First, we generate a time-domain model IRF (Fig. 3) using model THz field profiles (Fig. 6) that closely resemble experimental pulse shapes (see SI for details). An instantaneous SF process gives a molecular response which is a delta function in the time-domain () and a flat response in the corresponding frequency domain (). In 2D-TTR, this amounts to a flat response along the axis, and a delta functions along the axis centered at the eigenmode frequencies of the molecular sample. Multiplication of this molecular response with the IRF yields the final measured signal. This results in simply selecting a slice of the IRF along at the eigenmode frequency. Using this simple model we find excellent agreement with the experimental spectra.
Second, we use the same THz field profiles that produce the IRF model as inputs to RDM simulations that consider sum-frequency excitation processes (SF-RDM). Again, we find near-quantitative agreement between the experimental data and theoretical simulations. Critically, no electrical or mechanical non-linearities are required to reach excellent agreement between the data and the IRF model/RDM simulations. The SF-RDM results precisely reproduce the experimental time-domain (Fig. 3) and frequency-domain (Fig. 4) responses, substantiating the claim that SF processes dominate the 2D-TTR response of HMs.
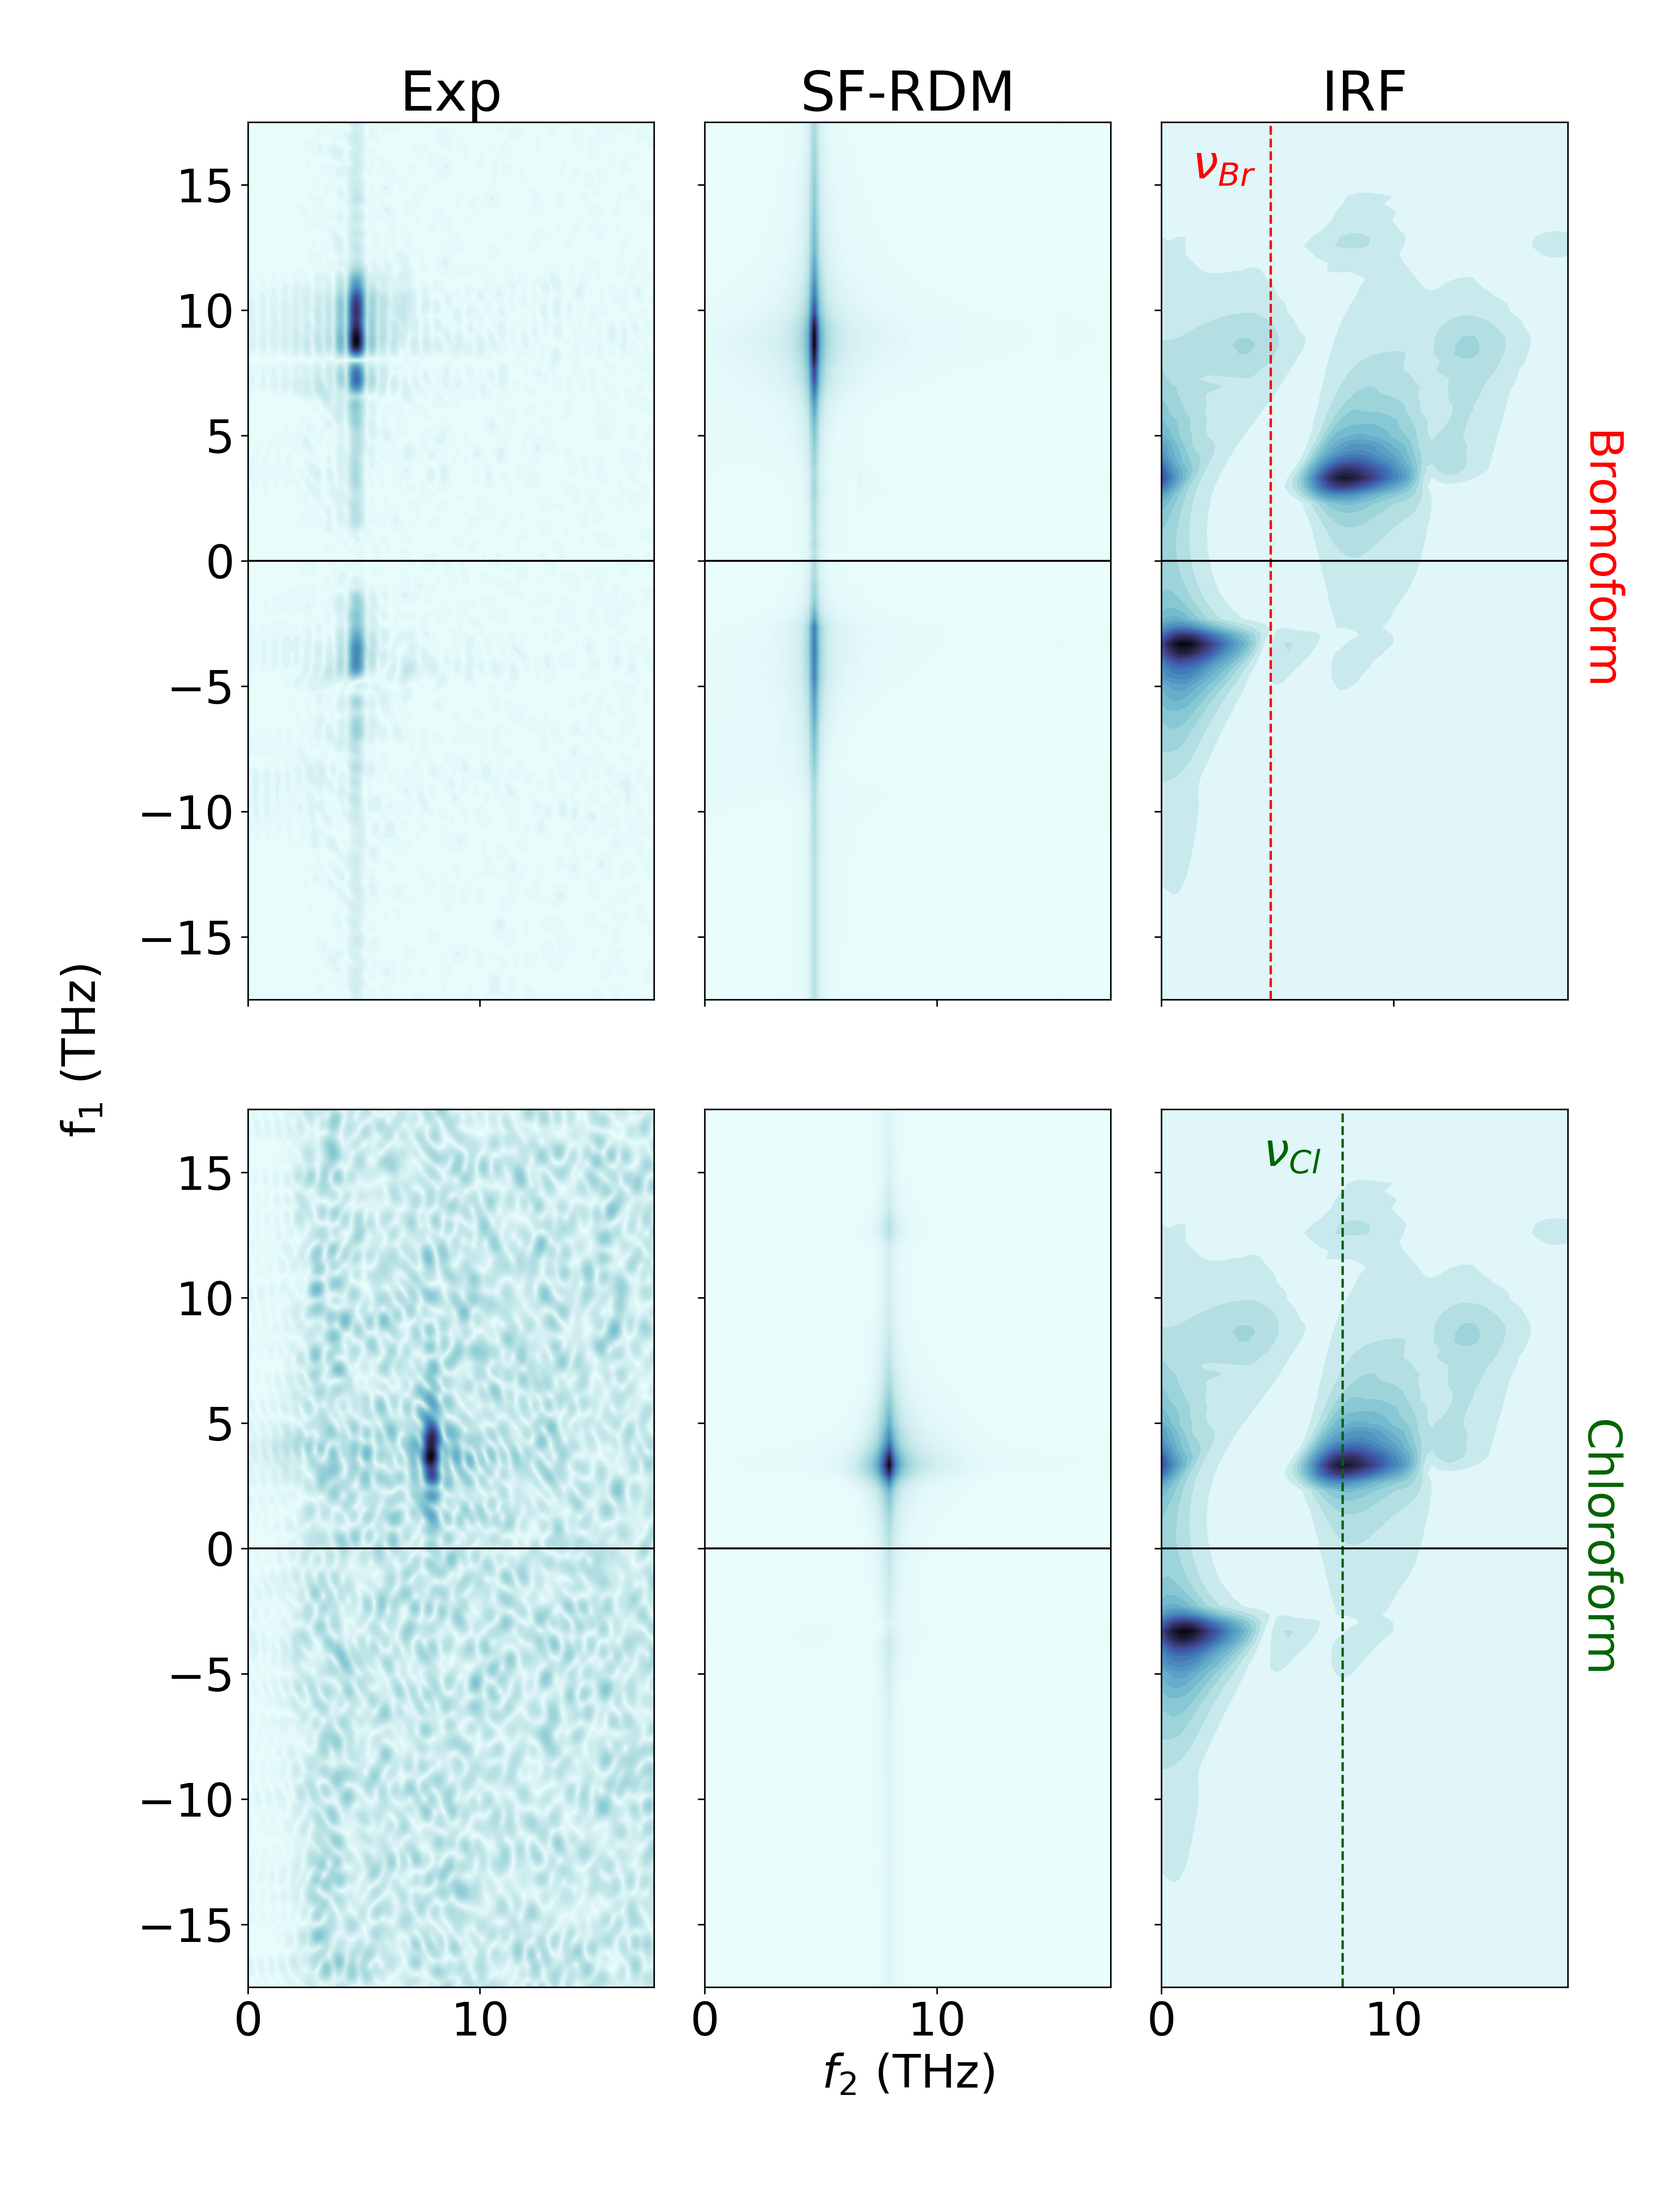
The agreement between experiment, SF-RDM, and model IRF are shown in Fig. 5. While bromoform and chloroform have different intra-molecular vibrational energies, we reproduce both spectra by slicing the same model IRF at their respective eigenmode frequencies along . Crucially, this model mimics the non-specific sum-frequency excitation of vibrational coherences by the THz electric field. Unlike previous interpretations, here we do not invoke Feynman diagram pathways involving multi-quanta transitions between several vibrational modes; instead, the experimental IRF filtered through a single SF excitation pathway explains our observations.
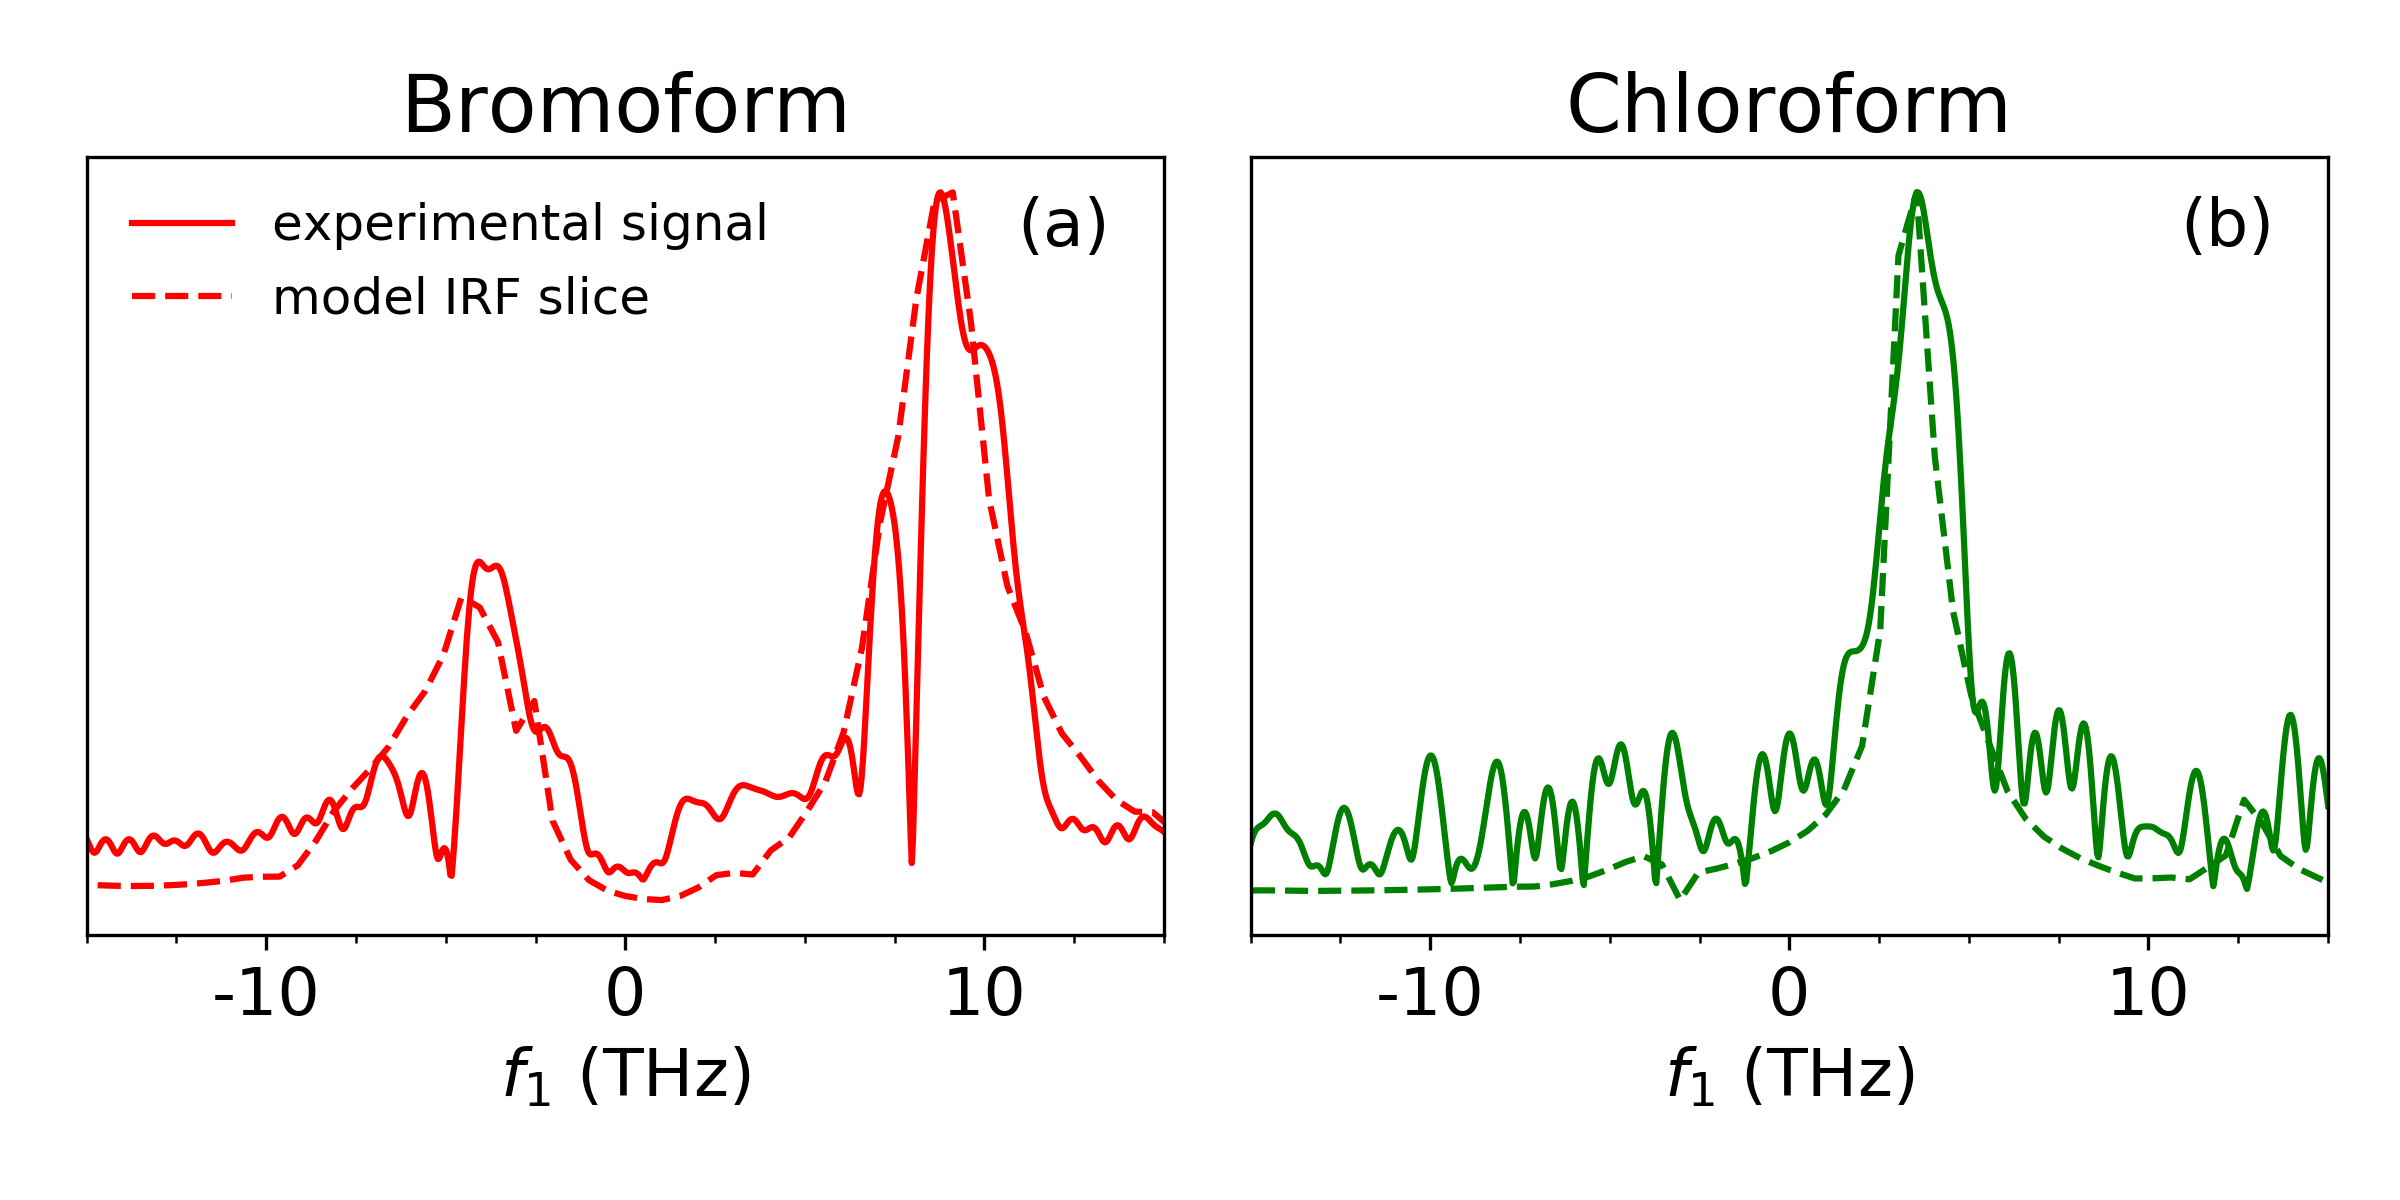
That a two-quanta sum-frequency excitation pathway is predominantly responsible for vibrational coherences observed in 2D-TTR is also supported by estimations of chloroform and bromoform’s transition dipole moments. From THz-TDS measurements and FT-IR literature, the bromoform and chloroform mode’s molar extinction coefficients were , suggestive of a vanishingly small transition dipole moment. Ab initio calculations similarly arrive at transition dipole elements in the few milliDebye range. As a result, it would be very difficult to observe resonant excitation of these HM modes, even in the absence of interfering SF pathways. For comparison, 2D-IR spectroscopy on proteins is often performed by resonantly pumping the amide I stretch at THz, which have 200-400 M-1cm-1. Not only are these oscillators intrinsically orders of magnitude stronger than HM vibrational modes, but the IR excitation field’s is also substantially narrower, which helps to selectively and resonantly generate the desired coherences while suppressing any SF contribution. Common sources of high intensity, sub-ps THz pulses (organic emitters, LiNbO3, etc) all have and thus both Res and SF pathways must be considered when analyzing responses in the overlapping pump field region.
Finally, we would like to note that our conclusions regarding the excitation mechanism of intra-molecular vibrational modes of HMs in 2D-TTR spectroscopy likely do not alter analyses performed on similar systems in the complementary 2D-TRT and 2D-RTT experiments.11 Those measurements attributed spectral features that remained post-deconvolution to couplings between a Raman-excited vibrational coherence and a resonant one-quanta interaction with bath modes of the liquid. Our conclusions are consistent with their observation that the IRF strongly determines the observed multi-dimensional experimental response.
In this work we provide extensive new experimental and theoretical data that leads to a simple reinterpretation of previous 2D-TTR measurements of HMs. With this new analysis, we explain the entire spectrum of both bromoform and chloroform through a convolution of the experiment’s THz fields with the molecules’ intra-molecular vibrational modes. No coherence pathways outside of the SF-TKE process in Fig. 2 are required. The new analysis is also fully consistent with the observed magnitudes of transition dipole moments and molecular polarizabilities.
Moving forward, there are two keys lessons. First, large transition dipoles are crucial for performing truly resonant 2D-TTR experiments. Halogenated methanes unfortunately do not satisfy this requirement, and the bright, complex signals observed can easily be mis-attributed to resonant processes. Second, nearly transform-limited half-cycle THz fields would maximize the field strengths achievable, greatly simplify the experimental IRF structure, and reduce ambiguities in the analysis of dynamics in molecular systems.
References
- Mcmorrow et al. 1988 Mcmorrow, D.; Lotshaw, W. T.; Kenney-Wallace, G. A. Femtosecond Optical Kerr Studies on the Origin of the Nonlinear Responses in Simple Liquids. IEEE Journal of Quantum Electronics 1988, 24, 443–454
- Cho et al. 1993 Cho, M.; Du, M.; Scherer, N. F.; Fleming, G. R.; Mukamel, S. Off-resonant transient birefringence in liquids. Journal of Chemical Physics 1993, 99, 2410
- Tokmakoff et al. 1997 Tokmakoff, A.; Lang, M.; Larsen, D.; Fleming, G.; Chernyak, V.; Mukamel, S. Two-Dimensional Raman Spectroscopy of Vibrational Interactions in Liquids. Phys. Rev. Lett. 1997, 79, 2702–2705
- Blank et al. 1999 Blank, D. A.; Kaufman, L. J.; Fleming, G. R. Fifth-order two-dimensional Raman spectra of CS2 are dominated by third-order cascades. Journal of Chemical Physics 1999, 111, 3105–3114
- Kubarych et al. 2002 Kubarych, K. J.; Milne, C. J.; Lin, S.; Astinov, V.; Miller, R. J. D. Diffractive optics-based six-wave mixing: Heterodyne detection of the full chi((5)) tensor of liquid CS2. Journal of Chemical Physics 2002, 116, 2016–2042
- Hattori 2010 Hattori, T. Classical theory of two-dimensional time-domain terahertz spectroscopy. Journal of Chemical Physics 2010, 133
- Ikeda et al. 2015 Ikeda, T.; Ito, H.; Tanimura, Y. Analysis of 2D THz-Raman spectroscopy using a non-Markovian Brownian oscillator model with nonlinear system-bath interactions Analysis of 2D THz-Raman spectroscopy using a non-Markovian Brownian oscillator model with nonlinear system-bath interactions. 2015, 212421, 0–15
- Savolainen et al. 2013 Savolainen, J.; Ahmed, S.; Hamm, P. Two-dimensional Raman-terahertz spectroscopy of water. Proc. Natl. Acad. Sci. U. S. A. 2013, 110, 20402–20407
- Shalit et al. 2017 Shalit, A.; Ahmed, S.; Savolainen, J.; Hamm, P. Terahertz echoes reveal the inhomogeneity of aqueous salt solutions. Nat. Chem. 2017, 9, 273
- Hamm and Shalit 2017 Hamm, P.; Shalit, A. Perspective: Echoes in 2D-Raman-THz spectroscopy. J. Chem. Phys. 2017, 146, 130901
- Ciardi et al. 2019 Ciardi, G.; Berger, A.; Hamm, P.; Shalit, A. Signatures of Intra- And Intermolecular Vibrational Coupling in Halogenated Liquids Revealed by Two-Dimensional Raman-Terahertz Spectroscopy. Journal of Physical Chemistry Letters 2019, 10, 4463–4468
- Allodi et al. 2015 Allodi, M. A.; Finneran, I. A.; Blake, G. A. Nonlinear terahertz coherent excitation of vibrational modes of liquids. Journal of Chemical Physics 2015, 143, 234204
- Finneran et al. 2016 Finneran, I. A.; Welsch, R.; Allodi, M. A.; Miller III, T. F.; Blake, G. A. Coherent two-dimensional terahertz-terahertz-Raman spectroscopy. Proceedings of the National Academy of Sciences 2016, 113, 6857–6861
- Finneran et al. 2017 Finneran, I. A.; Welsch, R.; Allodi, M. A.; Miller, T. F.; Blake, G. A. 2D THz-THz-Raman Photon-Echo Spectroscopy of Molecular Vibrations in Liquid Bromoform. Journal of Physical Chemistry Letters 2017, 8, 4640–4644
- Magdău et al. 2019 Magdău, I. B.; Mead, G. J.; Blake, G. A.; Miller, T. F. Interpretation of the THz-THz-Raman Spectrum of Bromoform. The Journal of Physical Chemistry A 2019, acs.jpca.9b05165
- Mead et al. 2019 Mead, G.; Katayama, I.; Takeda, J.; Blake, G. A. An echelon-based single shot optical and terahertz Kerr effect spectrometer. Review of Scientific Instruments 2019, 90, 053107
- Maehrlein et al. 2017 Maehrlein, S.; Paarmann, A.; Wolf, M.; Kampfrath, T. Terahertz Sum-Frequency Excitation of a Raman-Active Phonon. Physical Review Letters 2017, 119, 1–6
- Juraschek and Maehrlein 2018 Juraschek, D. M.; Maehrlein, S. F. Sum-frequency ionic Raman scattering. Physical Review B 2018, 97, 1–8
- Shishkov et al. 2019 Shishkov, V. Y.; Andrianov, E. S.; Pukhov, A. A.; Vinogradov, A. P.; Lisyansky, A. A. Enhancement of the Raman Effect by Infrared Pumping. Physical Review Letters 2019, 122, 153905
- Sidler and Hamm 2019 Sidler, D.; Hamm, P. Feynman diagram description of 2D-Raman-THz spectroscopy applied to water. Journal of Chemical Physics 2019, 150