Scaling Graph Clustering with Distributed Sketches††thanks: This work was performed under the auspices of the U.S. Department of Energy by Lawrence Livermore National Laboratory under Contract DE-AC52-07NA27344 (LLNL-CONF-812693) and was supported by the LLNL-LDRD Program under Project No. 20-FS-037. Experiments were performed at the Livermore Computing Facility.
Abstract
The unsupervised learning of community structure, in particular the partitioning vertices into clusters or communities, is a canonical and well-studied problem in exploratory graph analysis. However, like most graph analyses the introduction of immense scale presents challenges to traditional methods. Spectral clustering in distributed memory, for example, requires hundreds of expensive bulk-synchronous communication rounds to compute an embedding of vertices to a few eigenvectors of a graph associated matrix. Furthermore, the whole computation may need to be repeated if the underlying graph changes some low percentage of edge updates. We present a method inspired by spectral clustering where we instead use matrix sketches derived from random dimension-reducing projections. We show that our method produces embeddings that yield performant clustering results given a fully-dynamic stochastic block model stream using both the fast Johnson-Lindenstrauss and CountSketch transforms. We also discuss the effects of stochastic block model parameters upon the required dimensionality of the subsequent embeddings, and show how random projections could significantly improve the performance of graph clustering in distributed memory.
1 Introduction
Analysts working in applications as widely ranging as biology, sociology, network science, computer science, telecommunications, and others deal regularly with graph-expressible data where a major task of interest is to find structure, usually defined as a partitioning of “like” vertices into clusters. Although many graph clustering algorithms have arisen in the literature, and several works make important contributions to improving their distributed versions (Que et al., 2015; Halappanavar et al., 2017; Ghosh et al., 2019; Liu et al., 2019), applying them to scales that require distributed implementations on modern systems (topology data is near PetaScale, say 100B edges) remains challenging.
We will center our focus in this paper to accelerating algorithms in the form of spectral clustering (Von Luxburg, 2007). In the most generic form, spectral clustering computes approximate eigenpairs of a graph-dependent matrix (commonly adjacency, Laplacian, or a centered/normalized variant). Then, extremal eigenvectors form an embedding of the vertices into . Some downstream conventional clustering algorithm (e.g. -means (Lloyd, 1982) or dbscan (Hahsler et al., 2019)) then partitions the vertices using their embedded locations. Often recursion is employed, where the initial embedding reveals several of the best partitions (strongest communities) and reapplying the process on much smaller sub-partitions to further resolve community structure.
Although spectral clustering is a popular method and reasonably performant (log-linear cost and storage in input data) for real-world serial applications, it is not currently employed at extreme scales. State-of-the-art eigensolvers such as Krylov/Lanczos methods are iterative methods, relying on sparse linear algebraic kernels (primarily sparse matvec, dot-product, and their block vector variants), for which high-quality scientific computing packages are available (Hernandez et al., 2005; Baker et al., 2009). Recent work develops these linear algebra kernels and others for challenging graph topology (Buluç & Gilbert, 2011). Distributed memory implementations of eigensolvers require hundreds of resource-hungry bulk-synchronous operations (sequences of sparse matvecs). Numerical stopping criteria are also poorly understood for general, large real-world graphs. Finally, conventional spectral embedding algorithms are not efficient in evolving graph applications, where an update of a few edges (say those connecting previously poorly connected partitions) can cause previous solutions to take longer to iteratively improve than random initial guesses would.
In this document we present an alternative method relying upon a cheaper and more scalable embedding procedure using linear sketches: dimension-reducing linear projections drawn from a carefully-chosen distribution. Random sketch matrices allow us to approximately preserve row inner products and norms of an arbitrary matrix in a much lower dimension with high probability. Our method replaces an expensive spectral embedding with an efficient - though coarse - linear sketch embedding. In addition to gaining computational efficiency, linear sketches are designed for the turnstile streaming data model - i.e. they are indifferent to the order in which matrix items are received, and are robust to changes in the underlying matrix. Thus, our method produces a vertex embedding that features (1) computation and communication linear in the number of edge updates, (2) a simple distributed memory implementation, and (3) natural robustness to dynamic data.
Others have broadly applied matrix sketches throughout numerical linear algebra, often with an emphasis on matrix multiplication, regression, or low-rank approximation (Woodruff et al., 2014). Ailon & Chazelle (2009) introduced a fast formulation of the classic Johnson-Lindenstrauss transform (JLT, (Johnson & Lindenstrauss, 1984)) with the fast approximation of nearest neighbors in the embedding space as a motivating example. Traganitis et al. (2015) devised a library of tools SkeVa that utilize sampling to produce approximate -means clustering on high-dimensional data. Our approach is partially inspired by Gilbert et al. (2012), who used JLTs to directly, though coarsely, approximate the singular values and vectors of large matrices.
Many recent graph and matrix sketching applications make use of linear -sampling sketches (Jowhari et al., 2011) based upon precision sampling (Andoni et al., 2011). Ahn et al. (2012a; b; 2013) applied linear sampling sketches to estimate graph properties including approximating spectral sparsification, which Kapralov et al. (2017) improved with a single-pass algorithm. Ahn et al. (2018) described spectral clustering algorithms on hypergraphs, and used sampling sketches to accelerate their algorithms. Unfortunately, -sampling sketches are tricky to implement and are not considered efficient for large scale applications.
Others have utilized sketches as a means to accelerate spectral clustering. Fowlkes et al. (2004) describe a method using a Nyström low-rank approximation to the Laplacian by way of column sampling, and later using the eigenspectrum of the Nyström approximation to construct an embedding to be clustered in operations, where is the number of vertices, is the dimension of the Nyström approximation, and is the embedding dimension. Li et al. (2011) later improved the complexity to . We will describe a method that requires time, where is the number of nonzero elements in the graph matrix - i.e. twice the number of edges. Gittens et al. (2013) use a conventional power iteration method to coarsely approximate eigenvectors before utilizing JLTs to project into a small dimensional space. Our method avoids the expensive power iteration process. Additionally, unlike either of these methods, our embeddings scale naturally to the distributed model, take advantage of the sparsity structure in the graph matrix, and are fully robust to dynamic and streaming graphs.
We consider popular efficient random matrix projections in our analyses: the fast Johnson-Lindenstrauss transform based upon the Walsh-Hadamard transform (FWHT) (Ailon & Chazelle, 2009), and the CountSketch transform (CST) (Clarkson & Woodruff, 2017). We will produce results comparing the performance of FWHT- and CST-based embeddings of stochastic block model (SBM) vertices into lower-dimension space. In our experiments, we employ UMAP (McInnes et al., 2018) to perform an additional non-linear dimensionality reduction and HDBSCAN (McInnes et al., 2017) to cluster the resulting embeddings. We further present scaling results demonstrating that our linear embedding procedure can embed SBMs with tens of billions of edges in seconds on a modest compute cluster.
2 Notations and Background
We will assume throughout an undirected, unweighted, unsigned, connected and static graph with vertex and edge sets of size and , respectively. Spectral clustering methods generalize trivially to weighted graphs and other have extended them to handle signed graphs (Knyazev, 2018), dynamic graphs (Ning et al., 2007), and directed graphs (Van Lierde et al., 2018). The sketching methods we employ generalize to weighted, signed, dynamic, and directed graphs with much less complication, as the key operator is a simple linear projection. In cases where signal to noise ratio is high enough, the sketching approach likely provides scalability that is not possible in the existing approaches. For example, some directed graph methods involve complex-valued iterative eigensolvers, which are challenging to implement efficiently at scale on graph topologies. This is particularly the case for sketch-based dynamic graphs (Martin et al., 2017).
In particular, we will assume that is sampled from an undirected stochastic block model with communities (or blocks) with symmetric probability matrix and the community size vector . The th entry of indicates the pairwise probability that each of the vertices in community are neighbors with each of the vertices in community . In general, the diagonal entries of will be larger than the off-diagonal entries, which is meant to simulate the inter- and intra-connection densities of ground truth communities in empirical networks. The expected ratio between the diagonal entries of and and off-diagonal entries of are determined by additional parameters and , which parameterize the distributions from which the elements of are sampled.
A graph has adjacency matrix , where iff and is zero otherwise. We will embed the rows of the adjacency matrix because the SBMs we consider are nearly regular, and so little is gained by utilizing a Laplacian formulation.
We use pythonic notation for matrix rows and columns (the row vector corresponding to the neighborhood of vertex is and the -th column is ).
Canonical adjacency-based spectral embedding of dimension on is performed as follows:
-
1.
Let be the matrix whose columns are the eigenvector of associated with most positive eigenvalues.
-
2.
Identify with each vertex the row vector .
We call the rows of a spectral embedding of their corresponding vertices. The spectral clustering algorithm consists of computing a spectral embedding and executing a clustering algorithm on the embedded vectors, i.e. the rows of .
3 Matrix Sketching
Matrix sketching is a numerical linear algebraic tool with applications in, e.g., latent semantic indexing (Papadimitriou et al., 2000), low-rank approximation (Halko et al., 2011), and least-squares problems (Rokhlin & Tygert, 2008). A primary goal of matrix sketching is to embed a matrix , comprised of data points in a -dimensional feature space, in a lower dimensional space such that geometric properties of the original matrix are preserved to a desired level of fidelity. Mathematically, this typically entails the application of a linear operator with to form the sketch matrix .111Similar sketching procedures involving multiplication on the left-hand side of the argument, as well as those which embed both the row-space and column-space of (bi-linear sketches), can be defined analogously.
For the scope of this work, we seek sketching matrices that
-
1.
preserve pairwise distances between rows in to within a tolerance which we denote , with a constant failure probability;
-
2.
satisfy 1) by projecting into dimensions;
-
3.
admit scalable and sparse distributed memory implementations.
To this end we consider the FWHT, which satisfies conditions 1) and 2), but we will show that it struggles to satisfy our needs for condition 3). We also consider the CST and show that it exhibits superior distributed memory scaling as compared to FWHT, although it does not provide as strict a guarantee for condition 1). In particular, CST is not a Johnson-Lindenstrauss transform. However, it has been applied to great effect throughout the literature even with its less strict guarantee (Woodruff et al., 2014; Clarkson & Woodruff, 2017; Yang et al., 2020). We extensively show that CST and FWHT create embeddings of similar quality in our experiments in Section 4.
In rough terms, the Johnson-Lindenstrauss lemma states that there is distribution of linear operators that can embed any points in a dimensional feature space into dimensions such that all pairwise inner products are preserved to within a factor of with a constant probability of failure (Johnson & Lindenstrauss, 1984). That is, our embedding dimension is independent of the dimension of the feature space and logarithmically dependent on the number of points which we are embedding. The FWHT embeds a matrix as where is a diagonal matrix whose entries are i.i.d. with equal probability, is a Hadamard matrix, and is a sparse matrix whose nonzero entries are one to indicate uniform subsampling. In practice is assumed to be a power of two. This construction allows the FWHT to satisfy the Johnson-Lindenstrauss lemma with asymptotically lower complexity than prior JLT formulations.
, , and are never actually formed in practice, as their entries can be generated quickly as needed. In particular, embedding an element amounts to sampling column indices and generating a vector .
The CST was first developed for numerical linear algebra by Clarkson & Woodruff (2017) and was inspired by the celebrated CountSketch (Charikar et al., 2004). The sketch is computed as , where is a sparse matrix with 1 non-zero element per column that is with equal probability. The nonzero column indices and nonzero values are computable using 2-universal hash functions, obviating the expensive i.i.d. sampling requirements of the FWHT.
Importantly, computing CST requires only operations. Also important, the rows of preserve the sparsity of the rows of . FWHT embeddings will always be dense - even if the corresponding row has only 1 nonzero element! These features make CST particularly suited to distributed online sketching of graphs, in which edges arrive one-by-one into working memory simultaneously on a large number of processors as highly sparse vector updates. However, the FWHT satisfies more stringent theoretical guarantees, making it a useful baseline for comparison.
It is import to note that both FWHT and CST can be implemented in a fully-dynamic streaming fashion on arbitrary matrices that arrive in any order and can evolve during the process of performing the embedding. This makes FWHT and CST embeddings fully robust to changes in the underlying graph, a large advantage over the practical difficulties that face spectral methods in the streaming setting.
4 Clustering Experiments
4.1 Experimental Setup
In our experiments we implement an embedding-clustering pipeline similar to that of spectral clustering. In particular, we use a sketch transform to produce an embedding into some dimension , and then further sharpen the pairwise distances between communities by applying the nonlinear dimensionality reduction tool UMAP. We assume throughout that we know the ground truth number of communities for each graph considered, and so we use UMAP to reduce the embedding dimension from to . We then cluster the rows of the embedding in using HDBSCAN. We keep the parameters of both UMAP or HDBSCAN fixed at their default values in all experiments.
In our clustering experiments we assess the performance of our Sketch-UMAP-HDBSCAN pipeline using pairwise precision and recall (Kao et al., 2017) as our primary metrics. In particular, we determine the relationship between the parameter - which determines the fidelity to which inner products are preserved by our embedding - with the following SBM features:
-
1.
the ratio of on-diagonal to off-diagonal entries in the probability matrix ;
-
2.
the number of communities ;
-
3.
the number of vertices .
We test embeddings produced by both CST and FWHT, making the simplifying assumption that all SBMs have a probability matrix where diagonal elements equal and off-diagonal elements equal . We also assume that all blocks are equally-sized, i.e. that . We apply our methods to more sophisticated SBMs that violate these assumptions in the next section.
In our experiments, we track what we refer to as the maximum viable . We define this to be the largest value can achieve in a sketch embedding before either the pairwise recall or pairwise precision falls below a certain threshold. This maximum viable is related to the sketch dimension of the graph matrix in an inverse squared manner (Johnson & Lindenstrauss, 1984); e.g., a reduction of epsilon by a factor of 10 leads to a 100-fold increase in embedding dimension.
In the first experiment, we vary the on- versus off-diagonal ratio of to from to , fixing the number of vertices , the number of communities and community sizes to for each . The row sums of the generated matrix are set to be 0.5, and for each sketch/parameter combination we run 10 independent trials. In the second two experiments we fix and , varying in experiment two and in experiment three. In the second experiment, we fix while varying from 2 to 32. In the third experiment, we fix while varying from 512 to 8096. In all three experiments we set the thresholds for precision and recall (the metric threshold) to 0.90, 0.95, and 0.99. Our metric threshold dictates how large we can allow to grow while maintaining the given tolerance.
4.2 Results
Examining the first test case with results reported in Figure 1(a), we see that as the on-diagonal to off-diagonal ratio is increased, the maximum viable increases. This matches our intuition; if connections between different communities are unlikely relative to those within communities, low-dimensional embeddings more accurately preserve clustering features. This corresponds directly to looser bounds on ; if our clusters are more isolated from one another, the sketch embedding can be constructed such that it preserves geometric structure to a lesser extent. We also observe that the CST and FWHT perform nearly identically for all test cases, giving credibility to the use of the more distributed computationally-friendly CST in place of the more theoretically justified FWHT. Finally, as we decrease our metric thresholds from 0.99 to 0.90, we obtain a larger maximum viable ; when we decrease our demands on cluster quality, our embedding can be of lower fidelity.
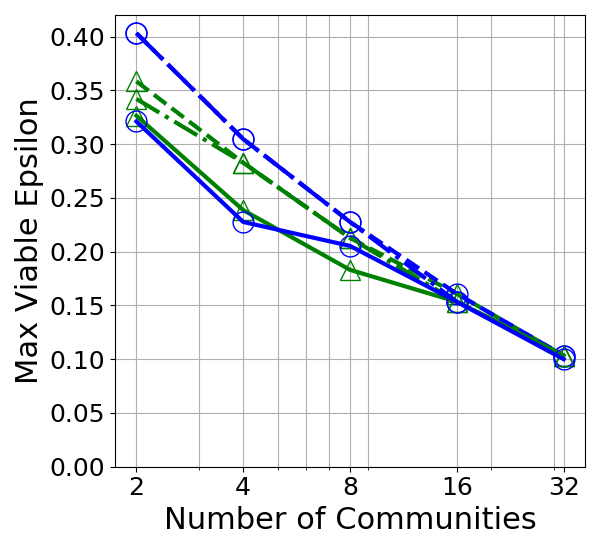
We now determine the dependence of the maximum viable on the number of communities in our SBM. We expect that, as we increase the number of communities with the number of vertices fixed at , achieving desired precision/recall will become more difficult. Consequently, our sketch will have to map into a higher embedding dimension to sufficiently capture the geometry of the original matrix, corresponding to a lower maximum viable . Our results shown in Figure 1(b) confirm this prediction; as we increase the number of communities in our SBM we see that the maximum viable grows smaller.
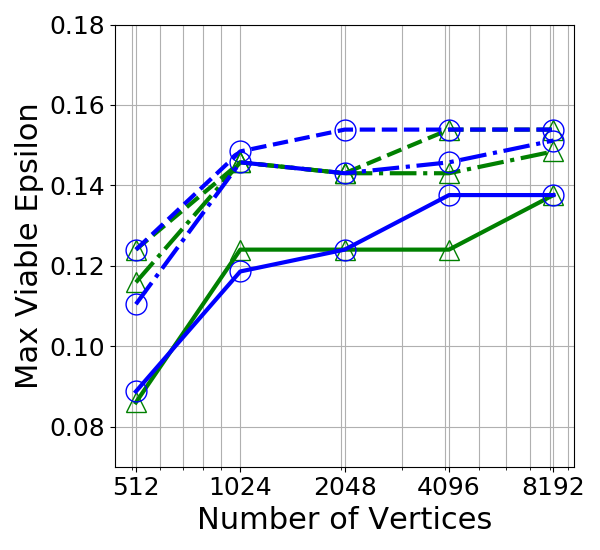
Finally, we fix the number of communities in our SBM while increasing the overall number of vertices in the SBM (hence we are increasing the number of vertices per community as well). Figure 1(c) shows that the maximum viable increases as the number of vertices increases Further, as the number of vertices increases, we observe a flattening out of the maximum viable , which indicates that our methods ought to scale well as we increase the size of the graphs we are clustering, assuming that the community count remains fixed.

Across all three experiments we observe some important trends. First, we see that increasing our metric threshold does not drastically decrease the value of necessary to embed our graph matrix. We therefore expect high performance from our methods at a relatively marginal cost. Further, the CST and FWHT achieve quite similar results in all test cases. Given that the CST is much faster and naturally implemented in a distributed setting while the FWHT satisfies more rigorous embedding properties, this is a particularly exciting result. Broadly, our results suggest that we ought to expect upper bounds on to be increase as the number of communities increases, as the number of vertices per community decreases, and as the overlap between communities increases. On the other hand, as clusters in a graph become less disparate, our sketch embedding must capture the properties of the full graph matrix to a higher degree of fidelity.
5 Scaling Experiments
We now analyze the quality of the embedding-clustering pipeline on large benchmark graphs and test the scalability of our distributed-memory implementation of the embedding procedure. We utilize a selection of open-source SBMs generated as a part of the HPEC graph challenge (Kao et al., 2017). Unlike our earlier experiments, these SBMs feature variable-sized communities and more complex probability matrices. Table 1 shows a selection of graph sizes, true cluster counts, and the values of used to produce a CST embedding, as well as the pair precision (PP), pair recall (PR), and accuracy averaged over 10 independent trials.222Results using FWHT were similar. In general, was chosen to obtain average PP and PR both . We note, however, than as the graphs grow in size and complexity, that also decreases. Figure 1(b) provides a likely explanation for this phenomenon, as community count serves as a damping factor on the maximum viable . Further, performant UMAP and HDBSCAN parameters most likely differ as SBMs vary in size and complexity.
| Pair Precision, Recall Parameters | |||||
| # Partitions | PP | PR | Accuracy | ||
| 500 | 8 | 0.96983 | 0.97719 | 0.986 | |
| 1000 | 11 | 0.95991 | 0.95301 | 0.976 | |
| 5000 | 19 | 0.97103 | 0.97395 | 0.9878 | |
| 20000 | 32 | 0.91305 | 0.90455 | 0.9588 | |
| 50000 | 44 | 0.55959 | 0.12414 | 0.73773 | |
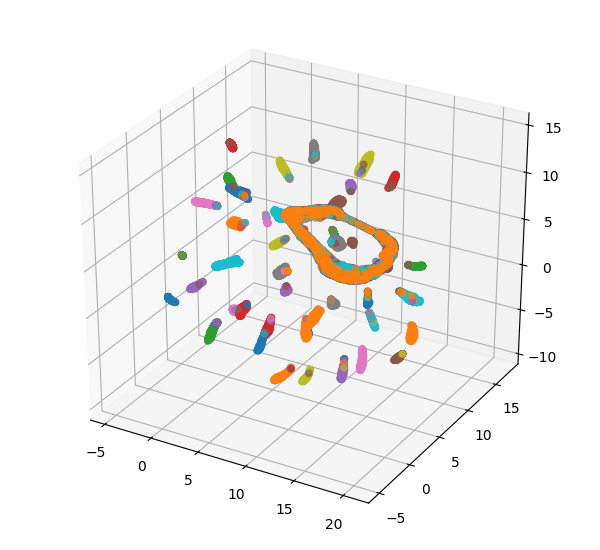
Figure 2 shows the largest of these SBM embeddings projected down into 3 dimensions and colored according to their ground truth communities. As we can see, even in the small dimensional space, the embedding manages to separate most of the clusters, some completely, others mixed into clusters of 2 or more communities. This suggests that our method, like most others at scale, will likely be best applied by hierarchically partitioning and refining subsets of vertices.
5.1 Distributed Sketching
A sketch embedding of dimension on a square graph matrix of is performed as follows:
-
1.
Choose a desired precision .
-
2.
Sample a sketch operator , with .
-
3.
Compute sketch .
-
4.
Identify with each vertex the row vector .
We distribute this procedure as follows. Assume a universe of processors , and further assume some arbitrary balanced partitioning of vertices to processors .333We use simple round-robin assignment in our experiments. We will abuse notation and refer to the set of vertices assigned to by as . Let be an arbitrary stream of edge updates defining , partitioned such that each receives the substream . Each maintains a sketch vector in corresponding to for each . On reading an edge , sends to and to . Upon receiving an edge , , processor updates appropriately. After having read over and cleared their communication buffers, has stored in distributed memory.
We examine the scaling limits of the embedding procedure by implementing our distributed sketches using the C++/MPI communication library YGM (Priest et al., 2019) and applying them to very large SBMs generated with GraphChallenge 2017 parameters, which we fit with constrained regression. We use
where is the number of communities, are the parameters used for sampling community sizes, and are internal/external edge density parameters used in the SBM generation. All of our distributed experiments were performed on a cluster of Intel Xeon E5-2695 processors each featuring 36 cores.
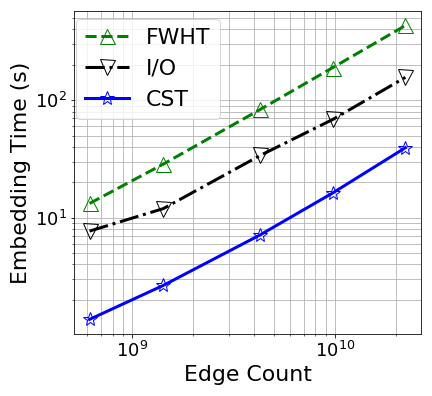
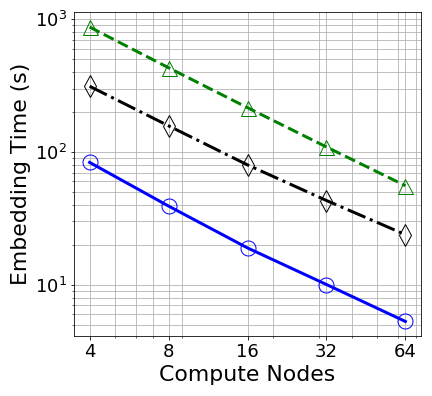
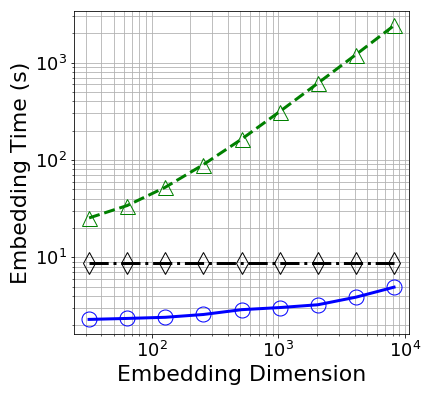
Figure 3(a) shows the wall time scaling of our codes with a fixed number of processors as graph size increases. Figure 3(b) shows the wall time where instead the graph to be embedded is fixed and we increase the number of compute nodes. Finally, Figure 3(c) shows the scaling where only the embedding dimension increases - i.e. decreases. These scaling studies reinforce our assertion of the fitness of CST for generating high quality low-dimensional embeddings for clustering applications, and highlight the weaknesses of the more disciplined but also more cumbersome FWHT. In particular, we find that our implementation scales at a rate no worse than reading the graph into memory.
6 Conclusions and Future Work
We have demonstrated a scalable vertex embedding procedure using linear sketches, and have validated its utility and scalability on partitioning SBMs. We have shown that this approach provides an algorithmic workflow similar to spectral clustering at a fraction of the cost, and with the benefit of much higher scalability.
A major limiting factor to our analysis at scale is that we have limited our scope to local-parallelism-only implementations of clustering algorithms. However, we have shown that our embedding algorithm features excellent scalability in distributed memory, and is able to embed graphs with tens of billions of edges in seconds on modest hardware. Further, our sensitivity experiments suggest that for a fixed desired precision, we find embeddings that yield clusters whose quality has at most a small dependence upon , although the dependance upon the number of true communities and their size variance warrants further investigation. In future work we will demonstrate the scalability of the full clustering pipeline to distributed memory data scales by the introduction of novel distributed clustering algorithms.
It is further important to recall that, though SBMs feature convenient analytical properties, they do not reflect many properties of real graphs found in applications. Indeed, one of the largest challenges associated with distributed graph algorithms is managing the communication and computation bottlenecks introduced by the presence of high-degree vertices in scale-free graphs. Degree-Corrected Stochastic Block Models (DCSBMs) generalize SBMs with power-law degree distributions so as to more accurately simulate this feature. Detection of large dense regions (degree-corrected quasi-cliques) injected into real-world graphs would also be an important validation step. We will augment our algorithms in future work to manage high-degree vertices via vertex delegation (Pearce et al., 2014) and sparse sketch storage.
Vertex embedding has many applications within graph machine learning beyond clustering. For example, recent vertex representation learning efforts such as node2vec (Grover & Leskovec, 2016) utilize deep neural networks to construct an embedding of vertices into low-dimensional latent space. Scaling to massive graph sizes, however, remains challenging. We believe that linear sketch-based embedding such as what we have proposed could significantly scale such nonlinear embeddings at a negligible cost to the representation quality.
Acknowledgements
The authors would like to thank Van Emden Henson for helpful comments and discussion.
References
- Ahn et al. (2012a) Kook Jin Ahn, Sudipto Guha, and Andrew McGregor. Analyzing graph structure via linear measurements. In Proceedings of the twenty-third annual ACM-SIAM symposium on Discrete Algorithms, pp. 459–467. SIAM, 2012a.
- Ahn et al. (2012b) Kook Jin Ahn, Sudipto Guha, and Andrew McGregor. Graph sketches: sparsification, spanners, and subgraphs. In Proceedings of the 31st ACM SIGMOD-SIGACT-SIGAI symposium on Principles of Database Systems, pp. 5–14. ACM, 2012b.
- Ahn et al. (2013) Kook Jin Ahn, Sudipto Guha, and Andrew McGregor. Spectral sparsification in dynamic graph streams. In Approximation, Randomization, and Combinatorial Optimization. Algorithms and Techniques, pp. 1–10. Springer, 2013.
- Ahn et al. (2018) Kwangjun Ahn, Kangwook Lee, and Changho Suh. Hypergraph spectral clustering in the weighted stochastic block model. IEEE Journal of Selected Topics in Signal Processing, 12(5):959–974, 2018.
- Ailon & Chazelle (2009) Nir Ailon and Bernard Chazelle. The fast Johnson–Lindenstrauss transform and approximate nearest neighbors. SIAM Journal on computing, 39(1):302–322, 2009.
- Andoni et al. (2011) Alexandr Andoni, Robert Krauthgamer, and Krzysztof Onak. Streaming algorithms via precision sampling. In Foundations of Computer Science (FOCS), 2011 IEEE 52nd Annual Symposium on, pp. 363–372. IEEE, 2011.
- Baker et al. (2009) C. G. Baker, U. L. Hetmaniuk, R. B. Lehoucq, and H. K. Thornquist. Anasazi software for the numerical solution of large-scale eigenvalue problems. ACM Trans. Math. Softw., 36(3), July 2009. ISSN 0098-3500. doi: 10.1145/1527286.1527287. URL https://doi.org/10.1145/1527286.1527287.
- Buluç & Gilbert (2011) Aydın Buluç and John R Gilbert. The combinatorial BLAS: Design, implementation, and applications. The International Journal of High Performance Computing Applications, 25(4):496–509, 2011.
- Charikar et al. (2004) Moses Charikar, Kevin Chen, and Martin Farach-Colton. Finding frequent items in data streams. Theoretical Computer Science, 312(1):3–15, 2004.
- Clarkson & Woodruff (2017) Kenneth L Clarkson and David P Woodruff. Low-rank approximation and regression in input sparsity time. Journal of the ACM (JACM), 63(6):1–45, 2017.
- Fowlkes et al. (2004) Charless Fowlkes, Serge Belongie, Fan Chung, and Jitendra Malik. Spectral grouping using the Nyström method. IEEE transactions on pattern analysis and machine intelligence, 26(2):214–225, 2004.
- Ghosh et al. (2019) S. Ghosh, M. Halappanavar, A. Tumeo, and A. Kalyanarainan. Scaling and quality of modularity optimization methods for graph clustering. In 2019 IEEE High Performance Extreme Computing Conference (HPEC), pp. 1–6, 2019.
- Gilbert et al. (2012) Anna C Gilbert, Jae Young Park, and Michael B Wakin. Sketched SVD: Recovering spectral features from compressive measurements. arXiv preprint arXiv:1211.0361, 2012.
- Gittens et al. (2013) Alex Gittens, Prabhanjan Kambadur, and Christos Boutsidis. Approximate spectral clustering via randomized sketching. Ebay/IBM Research Technical Report, 2013.
- Grover & Leskovec (2016) Aditya Grover and Jure Leskovec. node2vec: Scalable feature learning for networks. In Proceedings of the 22nd ACM SIGKDD international conference on Knowledge discovery and data mining, pp. 855–864, 2016.
- Hahsler et al. (2019) Michael Hahsler, Matthew Piekenbrock, and Derek Doran. dbscan: Fast density-based clustering with r. Journal of Statistical Software, 91(1):1–30, 2019.
- Halappanavar et al. (2017) M. Halappanavar, H. Lu, A. Kalyanaraman, and A. Tumeo. Scalable static and dynamic community detection using grappolo. In 2017 IEEE High Performance Extreme Computing Conference (HPEC), pp. 1–6, 2017.
- Halko et al. (2011) Nathan Halko, Per-Gunnar Martinsson, and Joel A Tropp. Finding structure with randomness: Probabilistic algorithms for constructing approximate matrix decompositions. SIAM review, 53(2):217–288, 2011.
- Hernandez et al. (2005) Vicente Hernandez, Jose E. Roman, and Vicente Vidal. SLEPc: A scalable and flexible toolkit for the solution of eigenvalue problems. ACM Trans. Math. Software, 31(3):351–362, 2005.
- Johnson & Lindenstrauss (1984) William B Johnson and Joram Lindenstrauss. Extensions of Lipschitz mappings into a Hilbert space. Contemporary mathematics, 26(189-206):1, 1984.
- Jowhari et al. (2011) Hossein Jowhari, Mert Sağlam, and Gábor Tardos. Tight bounds for lp samplers, finding duplicates in streams, and related problems. In Proceedings of the thirtieth ACM SIGMOD-SIGACT-SIGART symposium on Principles of database systems, pp. 49–58. ACM, 2011.
- Kao et al. (2017) Edward Kao, Vijay Gadepally, Michael Hurley, Michael Jones, Jeremy Kepner, Sanjeev Mohindra, Paul Monticciolo, Albert Reuther, Siddharth Samsi, William Song, et al. Streaming graph challenge: Stochastic block partition. In 2017 IEEE High Performance Extreme Computing Conference (HPEC), pp. 1–12. IEEE, 2017.
- Kapralov et al. (2017) Michael Kapralov, Yin Tat Lee, CN Musco, CP Musco, and Aaron Sidford. Single pass spectral sparsification in dynamic streams. SIAM Journal on Computing, 46(1):456–477, 2017.
- Knyazev (2018) Andrew Knyazev. On spectral partitioning of signed graphs. In 2018 Proceedings of the Seventh SIAM Workshop on Combinatorial Scientific Computing, pp. 11–22. SIAM, 2018.
- Li et al. (2011) Mu Li, Xiao-Chen Lian, James T Kwok, and Bao-Liang Lu. Time and space efficient spectral clustering via column sampling. In CVPR 2011, pp. 2297–2304. IEEE, 2011.
- Liu et al. (2019) X. Liu, J. S. Firoz, M. Zalewski, M. Halappanavar, K. J. Barker, A. Lumsdaine, and A. H. Gebremedhin. Distributed direction-optimizing label propagation for community detection. In 2019 IEEE High Performance Extreme Computing Conference (HPEC), pp. 1–6, 2019.
- Lloyd (1982) Stuart Lloyd. Least squares quantization in PCM. IEEE transactions on information theory, 28(2):129–137, 1982.
- Martin et al. (2017) Lionel Martin, Andreas Loukas, and Pierre Vandergheynst. Fast approximate spectral clustering for dynamic networks, 2017.
- McInnes et al. (2017) Leland McInnes, John Healy, and Steve Astels. hdbscan: Hierarchical density based clustering. Journal of Open Source Software, 2(11):205, 2017.
- McInnes et al. (2018) Leland McInnes, John Healy, and James Melville. UMAP: Uniform manifold approximation and projection for dimension reduction. arXiv preprint arXiv:1802.03426, 2018.
- Ning et al. (2007) Huazhong Ning, Wei Xu, Yun Chi, Yihong Gong, and Thomas S. Huang. Incremental spectral clustering with application to monitoring of evolving blog communities. In Proceedings of the Seventh SIAM International Conference on Data Mining, April 26-28, 2007, Minneapolis, Minnesota, USA, pp. 261–272. SIAM, 2007. doi: 10.1137/1.9781611972771.24. URL https://doi.org/10.1137/1.9781611972771.24.
- Papadimitriou et al. (2000) Christos H Papadimitriou, Prabhakar Raghavan, Hisao Tamaki, and Santosh Vempala. Latent semantic indexing: A probabilistic analysis. Journal of Computer and System Sciences, 61(2):217–235, 2000.
- Pearce et al. (2014) Roger Pearce, Maya Gokhale, and Nancy M Amato. Faster parallel traversal of scale free graphs at extreme scale with vertex delegates. In High Performance Computing, Networking, Storage and Analysis, SC14: International Conference for, pp. 549–559. IEEE, 2014.
- Priest et al. (2019) Benjamin Priest, Trevor Steil, Roger Pearce, and Geoff Sanders. You’ve Got Mail: Building missing asynchronous communication primitives. In Proceedings of the 2019 International Conference on Supercomputing, pp. 8. ACM, 2019.
- Que et al. (2015) X. Que, F. Checconi, F. Petrini, and J. A. Gunnels. Scalable community detection with the Louvain algorithm. In 2015 IEEE International Parallel and Distributed Processing Symposium, pp. 28–37, 2015.
- Rokhlin & Tygert (2008) Vladimir Rokhlin and Mark Tygert. A fast randomized algorithm for overdetermined linear least-squares regression. PNAS, 105(36):13212–13217, 2008.
- Traganitis et al. (2015) Panagiotis A Traganitis, Konstantinos Slavakis, and Georgios B Giannakis. Sketch and validate for big data clustering. IEEE Journal of Selected Topics in Signal Processing, 9(4):678–690, 2015.
- Van Lierde et al. (2018) Hadrien Van Lierde, Tommy W S Chow, and Jean-Charles Delvenne. Spectral clustering algorithms for the detection of clusters in block-cyclic and block-acyclic graphs. Journal of Complex Networks, 7(1):1–53, 05 2018. ISSN 2051-1329. doi: 10.1093/comnet/cny011. URL https://doi.org/10.1093/comnet/cny011.
- Von Luxburg (2007) Ulrike Von Luxburg. A tutorial on spectral clustering. Statistics and computing, 17(4):395–416, 2007.
- Woodruff et al. (2014) David P Woodruff et al. Sketching as a tool for numerical linear algebra. Foundations and Trends® in Theoretical Computer Science, 10(1–2):1–157, 2014.
- Yang et al. (2020) Fan Yang, Sifan Liu, Edgar Dobriban, and David P Woodruff. How to reduce dimension with PCA and random projections? arXiv preprint arXiv:2005.00511, 2020.