SADet: Learning An Efficient and Accurate Pedestrian Detector
Abstract
Although the anchor-based detectors have taken a big step forward in pedestrian detection, the overall performance of algorithm still needs further improvement for practical applications, e.g., a good trade-off between the accuracy and efficiency. To this end, this paper proposes a series of systematic optimization strategies for the detection pipeline of one-stage detector, forming a single shot anchor-based detector (SADet) for efficient and accurate pedestrian detection, which includes three main improvements. Firstly, we optimize the sample generation process by assigning soft tags to the outlier samples to generate semi-positive samples with continuous tag value between and , which not only produces more valid samples, but also strengthens the robustness of the model. Secondly, a novel Center- loss is applied as a new regression loss for bounding box regression, which not only retains the good characteristics of IoU loss, but also solves some defects of it. Thirdly, we also design Cosine-NMS for the postprocess of predicted bounding boxes, and further propose adaptive anchor matching to enable the model to adaptively match the anchor boxes to full or visible bounding boxes according to the degree of occlusion, making the NMS and anchor matching algorithms more suitable for occluded pedestrian detection. Though structurally simple, it presents state-of-the-art result and real-time speed of FPS for VGA-resolution images () on challenging pedestrian detection benchmarks, i.e., CityPersons, Caltech, and human detection benchmark CrowdHuman, leading to a new attractive pedestrian detector.
Index Terms:
pedestrian detection, anchor-based detector, efficient, one-stage.I Introduction
Pedestrian detection is a fundamental and essential step for many pedestrian related applications, e.g., person re-identification[1, 2, 3], human gait recognition[4, 5], and is of great requirement to both accuracy and efficiency. Following the milestone work of Viola-Jones[6], most of the early works focus on designing robust features[7, 8] and training effective classifiers[9, 10]. But these approaches rely heavily on the non-robust hand-crafted features and optimize each component separately, making pedestrian detection pipeline sub-optimal.
Recent years have witnessed the remarkable success achieved by convolutional neural network (CNN)[11], ranging from image classification[12, 13, 14, 15] to object detection[16, 17, 18, 19], which also inspires pedestrian detection. R-CNN[20] firstly applies CNN to object detection based on proposals generated by Selective Search[21]. Following R-CNN, Region Proposal Network (RPN) integrated with pre-defined anchors are designed to generate candidate proposals in a unified framework, forming the two-stage detector Faster R-CNN[16], which is the originator of anchor-based methods. Beyond the success achieved by Faster R-CNN on generic object detection, numerous extensions to this framework have been proposed and demonstrate superior performance on pedestrian detection, e.g., Adapted Faster R-CNN[22]. Nevertheless, these two-stage anchor-based detectors are still far from practical applications for the low run-time efficiency caused by the time-consuming two-stage processing, including proposal generation and classification of RoI pooling features.
Alternatively, aiming at higher run-time efficiency, the one-stage method (e.g., SSD[17]) discards the second stage of Faster R-CNN and directly detects objects by regular and dense sampling over locations, scales and aspect ratios. Though faster, one-stage detector has not presented competitive results on common pedestrian detection benchmarks (e.g., CityPersons[23] and Caltech[24]). Afterwards, although some improved versions (e.g., ALFNet[4]) based on one-stage framework with multi-step regression are proposed to find a better balance between accuracy and efficiency, the final performance of these detectors are still not that satisfactory, which gets even worse when compared with the newly anchor-free detectors (e.g., CSP[25]).
In pursuit of a better balance between accuracy and efficiency for the anchor-based detector, a series of systematic optimizations are adopted for the detection pipeline of one-stage detector, including sample generation, bounding box regression loss function, Non-Maximum Suppression (NMS) algorithm and anchor matching algorithm, forming a systematic and effective framework for pedestrian detection, which can be easily extended to other anchor-based pedestrian detector. The concerns may generally come as follows: 1) In common paradigm of sample generation process, two threshold values {, } are usually pre-defined to determine whether the anchor boxes are positive or negative, the anchor boxes with jaccard overlap between and will be discarded subsequently, which makes the model sensitive to the thresholds and cannot fully utilize all valid samples. 2) The distance losses such as and -norms are generally applied as the training objective for bounding box regression, however, as mentioned in [26], there exists a gap between optimizing the commonly used distance losses for regressing the parameters of a bounding box and maximizing the evaluation metric (), which makes pedestrian localization not accurate enough. 3) In the existing pedestrian detection pipeline, both NMS algorithm and anchor matching algorithm are directly adopted from general object detector, which is not applicable to the occlusion problem in pedestrian detection.
To handle these challenging issues, this paper proposes a series of improvements to the detection pipeline of pedestrian detector, which can be summarized as follows: 1) We optimize the sample generation process by assigning soft tags ranging from to to these outlier samples according to their jaccard overlap, and further add these semi-positive samples to the training objective as well. In this way, not only more valid samples are generated, but also the robustness of detector is strengthened. 2) A novel Center- loss is specially designed as a new regression loss for more precise pedestrian localization, which not only retains the good characteristics of loss, but also solves some defects of it. 3) We design Cosine-NMS for the postprocess of predicted bounding boxes to reduce false detections of the adjacent overlapping pedestrians, and further propose adaptive anchor matching algorithm to enable the model to adaptively match the anchor boxes to full or visible bounding boxes according to the degree of occlusion, making the Non-Maximum Suppression (NMS) and anchor matching algorithms more suitable for occluded pedestrian detection. To better verify the effectiveness of the above methods, the relevant experiments are directly conducted on a very strong baseline ALFNet[4], which owns great performance on pedestrian detection. Notably, the aforementioned optimization strategies are systematic improvements to the detection pipeline of one-stage pedestrian detector, which can also be applied to any anchor-based pedestrian detector, including one-stage and two-stage methods.
In conclusion, this paper proposes a single shot anchor-based pedestrian detector (SADet) to achieve efficient and accurate pedestrian detection. Though structurally simple, the proposed SADet presents state-of-the-art result and real-time speed of FPS for VGA-resolution images () on challenging pedestrian detection benchmarks, i.e., CityPersons[23], Caltech[24], and human detection benchmark CrowdHuman[27], which demonstrates the supreme generalization capacity and effectiveness of our method.
For clarity, the main contributions of this work can be summarized as follows:
-
•
We introduce a new design of soft label to sample generation process to fully utilize all valid samples and improve the robustness of model.
-
•
We propose a novel Center- loss as the training objective for bounding box regression, which not only retains the good characteristics of loss, but also solves some defects of it.
-
•
We design Cosine-NMS for the postprocess of predicted bounding boxes to reduce false detections of the adjacent overlapping pedestrians, by assigning a higher penalty to the highly overlapped detections.
-
•
We propose adaptive anchor matching to enable the model to adaptively match the anchor boxes to full or visible bounding boxes according to the degree of occlusion, making the anchor matching algorithm more suitable for occluded pedestrian detection.
II Related work
II-A Traditional detector
As an important research topic in computer vision field, pedestrian detection has obtained considerable interests with extensive applications in decades. The traditional solution to this problem is training a discriminative pedestrian detector that exhaustively operates on the sub-images across all locations and scales. Dalal and Triggs[28] apply the histograms of oriented gradient (HOG) descriptors along with SVM (Support Vector Machine) classifier[29] to human detection. Paisitkriangkrai et al.[30] propose a simple yet effective feature extraction method based on spatially pooled low-level visual features, and directly optimize the partial area under the ROC curve for better performance. Yan el al.[31] introduce deformable part model (DPM)[32] into pedestrian detection task and further propose several techniques to solve the speed bottleneck of DPM, while maintaining the accuracy. ACF[33], LDCF[34] extend the paradigm of Viola and Jones[6] to exploit various filters on Integral Channel Features (ICF)[35] with the sliding window strategy. Zhang et al.[36] systematically explore different filter banks and show that they provide means for important improvements for pedestrian detection.
II-B Anchor-based detector
Afterwards, coupled with the prevalence of deep learning techniques, the anchor-based methods originated from Faster R-CNN[16] rapidly dominate this field. One key component of anchor-based detectors is the pre-defined anchor boxes with fixed scales and aspect ratios around a low-resolution image grid, which will be further refined in a unified framework to get the final predictions. As the pioneering work of anchor-based methods, Faster R-CNN[16] generates candidate proposals and further classifies and refines these proposals in a two-step regression framework. In contrast, one-stage detectors, popularized by SSD[17], remove the proposal generation step and achieve a great balance between accuracy and efficiency. In terms of pedestrian detection, the anchor-based detectors dominate. RPN+BF[22] adapts the original RPN in Faster-RCNN to generate proposals, then learns boosted forest classifiers on top of these proposals. MS-CNN[37] also applies the two-stage framework but generates proposals on multi-scale feature maps. Zhang et al.[23] present an effective pipeline for pedestrian detection via RPN followed by boosted forests. RepLoss[38] and OR-CNN[39] focus on the design of regression losses to tackle the occluded pedestrian detection in crowded scenes. ALFNet[4] stacks a series of predictors to directly evolve the default anchor boxes of SSD step by step into improving the detection results. Adaptive NMS[40] applies a dynamic suppression strategy to optimize the postprocess of predictions. Pang et al.[41] propose a Mask-Guided Attention Network (MGAN) for occluded pedestrian detection, which produces a pixel-wise attention map using visible-region information, thereby highlighting the visible body region while suppressing the occluded part of the pedestrian.
II-C Anchor-free detector
Considering the tedious design of anchors, the anchor-free detectors bypass this stage and directly make predictions on an image. DenseBox[42] first proposes a unified end-to-end fully convolutional framework that directly predicts bounding boxes. UnitBox[43] proposes an Intersection over Union () loss function for better box regression. YOLO[44] appends fully-connected layers to parse the final feature maps of a network into class confidence scores and box coordinates. Recently, with the successful application of FPN[45], the anchor-free methods have ushered in a period of rapid development. CornerNet[46] proposes to detect an object bounding box as a pair of corners, leading to a high performance single-shot detector. TLL[47] proposes to detect an object by predicting the top and bottom vertexes, which achieves significant improvement on Caltech[24]. CenterNet[48] models an object as a single point, applies keypoint estimation to find center points and regresses to all other object properties, such as size, 3D location, orientation, and even pose. Similarly, CSP[25] simplifies pedestrian detection as a straightforward center and scale prediction task through convolutions and presents great performance on pedestrian detection benchmarks CityPersons[23] and Caltech[24].
III Approach
This section introduces the details of the SADet that enable the detector to be accurate and efficient on pedestrian detection, including detection pipeline, anchor design, soft label design, Center- loss, Cosine-NMS and adaptive anchor matching, as well as some other implementation details for training and inference.
III-A Detection pipeline
In anchor-based detectors, multiple feature maps with different resolutions are extracted from a backbone network, which can be defined as follows:
| (1) |
where is the input image, represents the th layer and is the generated feature map. On top of these multi-scale feature maps, detection can be formulated as:
| (2) |
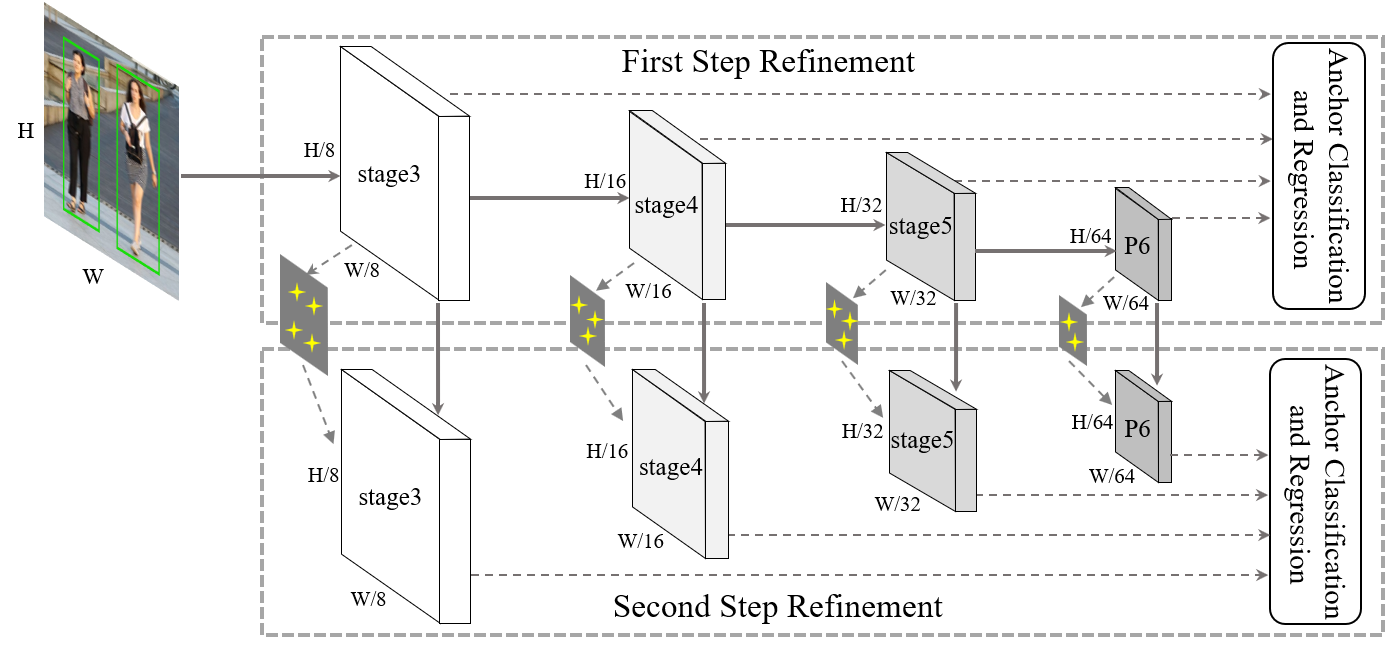
where is the anchor box pre-defined in the detection layer, is the detection result of th feature map, which consists of two elements, the classification scores and the related parameters for anchor box regression. Following [4], we stack a series of predictors on these anchor boxes to construct a two-step refinement framework for anchor boxes to improve the performance of one-stage detectors, which is depicted in Figure 1. Therefore, the above equation can be re-formulated as:
| (3) |
This detection pipeline contains a two-step refinement of anchor boxes, the first step is used to coarsely adjust the locations and sizes of anchors to provide better initialization for the subsequent regressor, then the second step takes the refined anchors as the input from the former to further improve the regression and classification process, and outputs the final predictions.
For the detection module, a set of convolutional layers are deployed to extract features from detection layers for pedestrian/non-pedestrian classification and bounding box regression, as depicted in Figure 2.

III-B Anchor design
Anchor-based object detectors with reasonable design of anchors in different feature maps have proven to be effective to handle objects with different scales[49]. Our SADet applies ALFNet[4] as a baseline and uses ResNet-[12] as the backbone network of the detector, which is pictorially illustrated in Figure1.
Table I presents the detailed anchor design of our SADet. The last layers of stage3, stage4, stage5 in ResNet- and an additional convolutional layer P6 attached at the end are selected as the detection layers with sizes downsampled by , , , respectively, which are then associated with anchor boxes with width of (, ), (, ), (, ), (, ) pixels and a single aspect ratio of . Notably, the above settings of anchor boxes will be generally applied to all datasets without further adjustments in our experiments, including CityPersons[23], Caltech[24] and CrowdHuman[27] datasets.
| Detection Layer | Stride | Width | Aspect Ratio |
|---|---|---|---|
| stage3 | 8 | 16, 24 | 0.41 |
| stage4 | 16 | 32, 48 | 0.41 |
| stage5 | 32 | 64, 96 | 0.41 |
| P6 | 64 | 128, 160 | 0.41 |
III-C Soft label design
In common paradigm of sample generation process of anchor-based methods, two threshold values {, } are usually pre-defined to determine whether the samples should be included in the training phase. During anchor matching phase, the anchors with (Intersection-over-Union) ratio higher than with any ground-truth boxes will be assigned a positive label as the positive samples, and a negative label will be sent to a non-positive anchor if its ratio is lower than for all ground-truth boxes, which is defined as a negative sample. Meanwhile, the anchors that are neither positive nor negative (with ratio between and ) will be ignored subsequently and do not contribute to the training objective, which makes the model sensitive to the pre-defined thresholds and cannot fully utilize all valid samples. Furthermore, the design of binary class label {, } is also not conducive to the model training, making the predictions of the model not robust enough.
Therefore, we propose a new design of soft label to utilize these ignored anchors by assigning labels ranging from to to these anchors according to their ratios with ground-truth boxes, and further add these samples to the training objective as well. The assignment of soft label is defined as follows.
| (4) |
where represents the highest Intersection-over-Union () ratio between anchor and all ground-truth boxes, and , are pre-defined threshold values. An anchor with higher than will be assigned a positive label , or else a negative label if value lower than . The rest of anchor boxes will also be assigned a soft label between and in accordance with their ratio. Intuitively, the more overlap between the anchor boxes and the ground-truth boxes, the larger the corresponding label value will be. Thus, a series of training samples with continuous label values from to are generated.
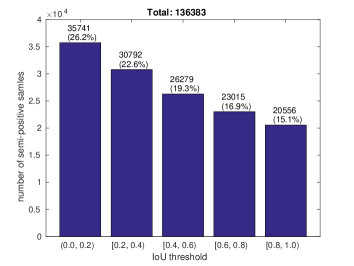
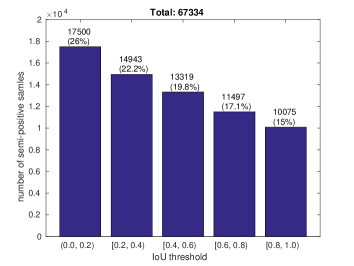
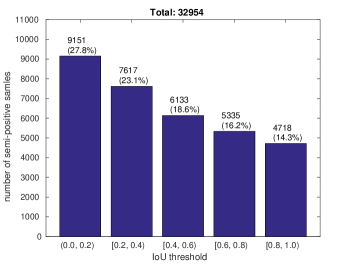
We define these samples with soft label as semi-positive samples and calculate the number of positive and semi-positive samples generated under different threshold settings in CityPersons[23] training set, i.e., {, }, {, } and {, } for respectively, which is summarized in Table II. It is clearly that incorporated with the design of soft label, although the difference between and is only set to , the number of semi-positive samples generated still exceeds the number of positive samples by a large margin. Strengthening the use of these samples can not only increase the number of samples available, but also enhance the robustness of the model for labels. Figure 3 depicts the distribution of labels of the semi-positive samples under different threshold settings, i.e., {, }, {, } and {, } for . The number of semi-positive samples decreases with the increase of label value naturally. We empirically choose {, } and {, } for the two-step refinement of anchor boxes, which achieves the lowest MR-2 in our experiments.
| , | Positive | Semi-positive | Total |
|---|---|---|---|
| {, } | |||
| {, } | |||
| {, } |
In this way, for classification branch of network, the optimization objective is transformed from binary classification of and to a regression process of label learning with value ranging from to . Therefore, not only more valid positive samples are generated, but also the robustness of detector is strengthened.
III-D Center- loss
Intersection-over-Union () is the most popular evaluation metric used in the object detection benchmarks. However, as illustrated in [26], there exists a gap between optimizing the commonly used distance losses for regressing the parameters of a bounding box and maximizing this metric value. To alleviate the aforementioned problem, some improved versions such as loss[26] and Distance- loss[50] are proposed as the bounding box regression loss functions to replace the commonly used -norm loss or loss. In this paper, the loss is selected as the optimization benchmark, and the definition of this loss function is as follows.
| (5) |
where and are the ground-truth and predicted bounding boxes, respectively. is the smallest rectangular box enclosing both and . is the ratio of these two bounding boxes. represents the volume (area) occupied by excluding and .
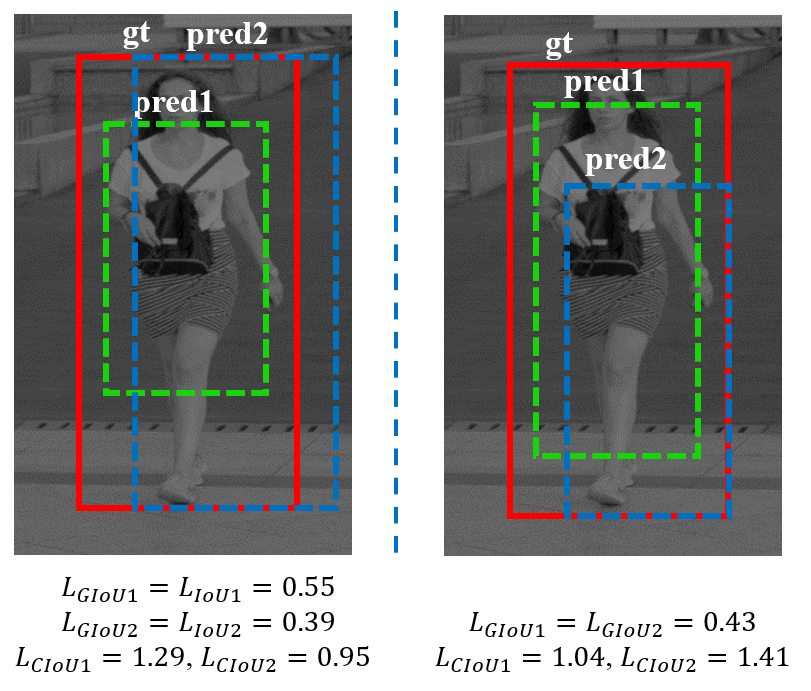
Although the loss has achieved great improvements, some problems still exist. As illustrated in Figure 4, the red rectangular box represents the ground-truth box, the green and blue dotted boxes are two different prediction results. On one hand, the left image depicts that if the predicted box is completely enclosed by the ground-truth box, or these two boxes are in parallel state, the value of term will fixed to and the loss will then degenerate into a common loss. On the other hand, for the right image in Figure 4, we can find that no matter how we move the position of the predicted box, the loss is always a fixed value on the premise that the predicted box are fully covered by the ground-truth box. As a result, this unconstrained deviation will undoubtedly produce more false negatives for adjacent overlapping pedestrians, especially for occluded pedestrian detection.
To handle these problems, we propose a new bounding box regression loss, named Center- loss. The definition of this loss function is detailed in Equation. 6 and 7.
| (6) |
| (7) |
where [38] is a smoothed function which is continuously differentiable in (, ), and [, ) is the smooth parameter to adjust the sensitiveness of the regression loss to the outliers. The regression term represents the area occupied by excluding the intersection of and . and are vectors representing the parameterized center point coordinates of the predicted and ground-truth box, respectively. The distance regression term is the robust distance loss function defined in [51], which is applied to enforce the predicted box locate closer to the center of ground-truth box, and thus reduce the deviation. As shown in Figure 4, our Center- loss can easily handle the hard examples for loss, which proves the superiority of our method.
The proposed Center- loss is an organic combination of coordinate regression and regression, which not only retains the good characteristics of loss, but also solves some defects of it, enabling the regression process more suitable for pedestrian detection.
III-E Cosine-NMS
Non-Maximum Suppression (NMS) is an integral part of the object detection pipeline, which recursively selects the detection box with the maximum score and remove the repeated predictions. However, this greedy NMS algorithm still has some problems. Applying NMS with a low threshold like may increase the miss-rate, especially in crowd scenes. On the contrary, a high threshold like may also increase false positives as many neighboring proposals that are overlapped often have correlated scores. Therefore, for the task of pedestrian detection, the weight function design in NMS needs to meet the following demands to better detect occluded pedestrians.
For the detection boxes which are far away from (), they have a smaller likelihood of being false positives and they should thus be retained with no penalty imposed, so as to reduce the false negatives caused by non-maximum suppression in the postprocess of occluded pedestrian detection.
For the highly overlapped neighboring detection boxes (), they have a higher likelihood of being false positives, the penalty should be higher to quickly reduce the score of these predictions. Furthermore, for the fully overlapped detection boxes (), the classification score of them should be reduced to since these detections have a high probability of being repeated predictions.
To meet these requirements, we propose a novel Cosine-NMS for the postprocess of predictions based on the design of Soft-NMS[52]. The pruning step of this algorithm can be written as a re-scoring function as follows.
| (8) |
where is the pre-defined threshold, is an overlap based weighting function to change the classification score of a box which has a high overlap with . For the detection boxes with ratio lower than , they are more likely to be true positives and thus no processing is done to them, otherwise a penalty term will be applied to decay their scores. As for the design of weighting function, we propose a new weighting function based on cosine function to make the NMS algorithm more suitable for pedestrian detection, which is detailed as follows.
| (9) |
In soft-NMS, either the Linear version or Gaussian version also decays the scores of detections as an increasing function of overlap with . In order to explain the superiority of the weighting function proposed in this paper, we depict the comparison curves of the three weighting functions in Figure 5. The horizontal axis represents the ratio, and the vertical axis is the corresponding weight value.
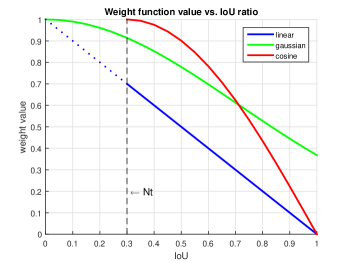
The line in blue is the Linear function in Soft-NMS, it is not continuous in terms of overlap with a fixed gradient and a sudden penalty is applied when a NMS threshold of is reached, making the NMS algorithm extremely sensitive to the threshold and the decay of score is not smooth enough for the detections whose value is around . Meanwhile, the line in green is the Gaussian function in Soft-NMS, it is continuous in terms of overlap, but the penalty term is introduced to any prediction box overlaps with ground-truth box and is too small for the highly overlapped boxes. Particularly, for the fully overlapped detection boxes (), the decayed classification score of them is still high and cannot reach , which may cause false positives in the postprocess of detections. Therefore, these two weighting functions cannot meet the requirements of pedestrian detection, which need further optimization.
For comparison, the line in red is the proposed Cosine penalty function for NMS, it is continuous in terms of overlap when the ratio is higher than threshold . For the detection boxes with ratio lower than , they are more likely to be true positives and thus no processing is done to them, otherwise a penalty term will be applied to decay their scores. Besides, it is also clear that scores for detection boxes which have a higher overlap with will be decayed more with a higher penalty, as they have a higher likelihood of being false positives. Particularly, for the fully overlapped detection boxes (), the decayed classification score of them will be further decayed to to reduce false positives of the detector. Notably, the proposed Cosine-NMS has no additional parameters and can be directly applied to the post-processing of any pedestrian detectors.
III-F Adaptive anchor matching
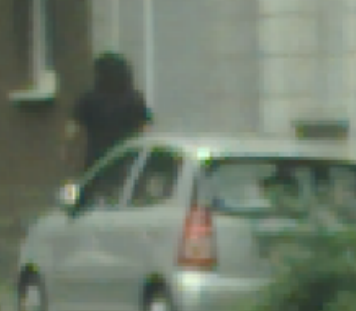
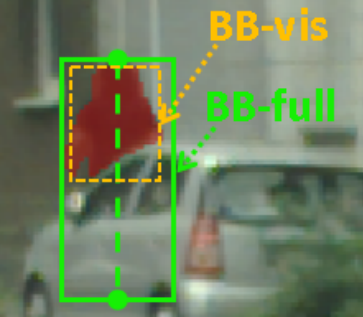
In common paradigm of anchor matching, the ratios are usually calculated between pre-defined anchor boxes and full ground-truth bounding boxes based on the jaccard overlap. However, as shown in Figure 6, for the occluded pedestrian, the visible bounding box for each instance is only part of full bounding box, which contains a lot of redundant background information and makes it invalid to directly match the anchor to the full bounding box. To obtain a better result, we propose adaptive anchor matching to optimize this process as follows.
For ground-truth boxes with visible ratio lower than threshold , apply the visible bounding boxes to match the anchor boxes to reduce the interference of background information. The visible ratio is defined as the ratio of the visible bounding box and full bounding box, i.e. .
For ground-truth boxes with visible ratio higher than threshold , directly apply the full bounding boxes to match the anchor boxes to make full use of the context information to assist pedestrian detection.
After the anchor matching, the regression target of anchor box is still the full bounding box of ground-truth in both cases mentioned above. The threshold is fixed to in all datasets, which presents the best MR-2 in our experiments.
III-G Other implementations
Training. Anchors are assigned as positives if the with any ground truth are above a threshold , and negatives if the lower than a threshold . Those anchors with in [, ) are also assigned as semi-positives with label value ranging from to and sent to the training objective as well, which is detailed in Section. III-C. We assign different threshold sets {, } for different regression steps with {0.4, 0.5} for step and {0.5, 0.6} for step .
At each regression step , the convolutional predictor is optimized by a multi-task loss function combining two objectives, which is illustrated as follows.
| (10) |
where is the index of an anchor, and are the predicted probability and ground-truth label of anchor . is a vector representing the parameterized coordinates of the predicted locations of pedestrian, while is the corresponding ground-truth box parameters associated with a non-negative anchor. The regression loss is the proposed Center- loss detailed in Section. III-D. means the bounding box regression loss is activated only for non-negative anchors. The classification loss is an optimized Focal Loss[53] for positive, negative and semi-positive samples, which is formulated as:
| (11) | ||||
where and are the focusing parameters, which are set to and as suggested in [53]. The first and third terms in loss function is the traditional Focal Loss for binary classification of positive and negative samples. While the second term is the specially designed loss function for semi-positive samples with balancing parameter fixed to , which assigns greater weights to the samples with higher label value since these samples are more important for model training to alleviate the positive-negative imbalance problem.
The classification loss and regression loss are then normalized by and , and further weighted by balancing parameter . In our implementation, the term is normalized by the number of positive, negative and semi-positive anchors, and the term is normalized by the number of non-negative anchors.
Data augmentation. To increase the robustness of training data, each training image is sequentially processed by color distortion and horizontal flipping with a probability of . For CityPersons[23] and Caltech[24] datasets, we randomly crop a patch with the size of [, ] of the original image and further resize it so that the shorter side has pixels ( for CityPersons and for Caltech), while keeping the aspect ratio of the image. As for CrowdHuman[27] dataset, since the images of this dataset are collected from Web sites with various sizes. We randomly crop a square patch with the size of [, ] of the short size of the original image, and then resize it to pixels as the final training image in our experiments.
Inference. SADet simply involves feeding forward an image through the network. For each level, we get the regressed anchor boxes from the final predictor and hybrid confidence scores from all predictors. We first filter out most boxes by a confidence threshold of and keep the top boxes before applying NMS, then all remaining boxes are merged with the proposed Cosine Non-Maximum Suppression (Cosine-NMS) with a threshold of , and the top boxes will be selected as the output.
| Method | Framework | Backbone | Reasonable | Bare | Partial | Heavy | Test Time |
|---|---|---|---|---|---|---|---|
| Adapted Faster RCNN[23] | Two-stage | VGG-16 | 15.4 | - | - | - | - |
| OR-CNN[39] | Two-stage | VGG-16 | 12.8 | 6.7 | 15.3 | 55.7 | - |
| Adaptive-NMS[40] | Two-stage | VGG-16 | 11.9 | 6.2 | 12.6 | 55.2 | - |
| TLL+MRF[47] | Two-stage | ResNet-50 | 14.4 | 9.2 | 15.9 | 52.0 | - |
| Repulsion Loss[38] | Two-stage | ResNet-50 | 13.2 | 7.6 | 16.8 | 56.9 | - |
| ALFNet-2s[4] | One-stage | ResNet-50 | 12.0 | 8.4 | 11.4 | 51.9 | 0.27s/img |
| CSP(w/o offset)[25] | Anchor-free | ResNet-50 | 11.4 | 8.1 | 10.8 | 49.9 | 0.33s/img |
| CSP(with offset)[25] | Anchor-free | ResNet-50 | 11.0 | 7.3 | 10.4 | 49.3 | 0.33s/img |
| APD[54] | Anchor-free | ResNet-50 | 10.6 | 7.1 | 9.5 | 49.8 | - |
| SADet-1step | One-stage | ResNet-50 | 11.5 | 6.7 | 10.7 | 56.4 | 0.24s/img |
| SADet-2step | One-stage | ResNet-50 | 9.7 | 5.7 | 9.8 | 52.8 | 0.26s/img |
IV Experiments
IV-A Experimental setup
Our method is implemented in the Keras[55] library, with GTX TITAN X GPUs for model training. A mini-batch contains images per GPU. The Adam[56] solver is applied. For CityPersons[23], the backbone network is pre-trained on ImageNet[57] and all added layers are randomly initialized with the “” method[58]. The network is totally trained for epoches, with the initial learning rate of and decreased by a factor of after and epoches. For Caltech[24], we also include experiments with the model initialized from CityPersons as done in [4] and totally trained for epoches with the learning rate of . For CrowdHuman[27], the network is totally trained for epoches with the base learning rate and divided by after and epoches. The backbone network is ResNet- unless otherwise stated.
IV-B CityPersons dataset
The CityPersons[23] dataset is built upon the semantic segmentation dataset Cityscapes to provide a new dataset of interest for pedestrian detection, which contains images ( for training, for validation, and for testing) with about manually annotated persons plus ignore region annotations. Both the bounding boxes and visible parts of pedestrians are provided and there are approximately pedestrians in average per image.
Following the evaluation protocol in CityPersons, we train our detector on the training set, and evaluate it on the validation sets. The log miss rate averaged over the false positive per image (FPPI) range of [, 1] (MR-2) is used to measure the detection performance (lower score indicates better performance).
| Component | SADet | ||||
|---|---|---|---|---|---|
| Center- | |||||
| Soft Label | |||||
| Cosine-NMS | |||||
| Adaptive | |||||
| Reasonable | 16.0 | 15.2 | 13.4 | 12.9 | 11.5 |
| Bare | 11.3 | 10.0 | 8.7 | 8.2 | 6.7 |
| Partial | 14.8 | 14.2 | 12.9 | 12.1 | 10.7 |
| Heavy | 52.5 | 52.0 | 51.7 | 51.5 | 56.4 |
IV-B1 Ablation study
To have a better understanding of how each proposed component affects the final performance, we construct four variants and evaluate them on CityPersons validation dataset, shown in Table IV. Our baseline model is the same as ALFNet[4], with smooth loss for bounding box regression and Focal Loss for classification.
Center-IoU Loss. Firstly, the smooth loss for bounding box regression applied in ALFNet is replaced with the novel Center- loss, which helps promote the accuracy of localization and contributes to the reduce of MR-2 by on Reasonable subset. Besides, the improvement still holds for pedestrians with different degrees of occlusion, including Bare (occlusion ), Partial ( occlusion ) and Heavy ( occlusion) subsets. To better demonstrate the superiority of the Center- loss, we further train the model using different bounding box regression losses, including smooth [17], [59], [26] and Distance-[50] losses, as well as our proposed Center- loss, which is detailed in Table V, where represents the smooth loss, , and are , and Distance- losses respectively, is our Center- loss. Notably, for a fair comparison, we ablate all the other unrelated modules, and directly conduct the experiments on our base model. As shown in Table V, the proposed Center- loss surpasses all the other losses by a large margin, achieving obvious improvements of , , and MR-2 compared with smooth , , and Distance- losses, respectively.
| Loss | |||||
|---|---|---|---|---|---|
| MR | 15.2 |
Soft Label Design. Secondly, we incorporate the soft label design to sample generation process to fully utilize all valid samples and smooth the predictions of the model. The comparison between the third and fourth columns in Table IV indicates that our soft label design effectively improves the performance, especially for Reasonable subset with MR-2 reduced from to .
| NMS | greedy | soft- | soft- | cosine |
|---|---|---|---|---|
| MR | 15.4 |
Cosine-NMS. Thirdly, we substitute the proposed Cosine-NMS for the commonly used greedy-NMS to make the Non-Maximum Suppression algorithm more suitable for pedestrian detection. The result in Table IV validates the effectiveness of Cosine-NMS, with MR-2 decreased by , , and on Reasonable, Bare, Partial and Heavy subsets. In Table VI, we compare our Cosine-NMS with traditional NMS and Soft-NMS on CityPersons dataset, where means the greedy-NMS, soft- and soft- are the Linear and Gaussian versions of Soft-NMS, represents the proposed Cosine-NMS. Similarly, we also ablate all the other unrelated modules, and conduct the experiments on our base model directly. Table VI shows that our Cosine-NMS method achieves the best MR-2 of on the base model, outperforming all the other Non-Maximum Suppression algorithms, which demonstrates the effectiveness of the proposed method in pedestrian detection.
| Method | Scale | Hardware | Test time | MR-2 | |
| IoU=0.5 | IoU=0.75 | ||||
| CompACT-Deep[60] | Tesla K40 | s/img | |||
| RPN+BF[22] | Tesla K40 | s/img | |||
| SA-FastRCNN[61] | Titan X | s/img | |||
| F-DNN[62] | Titan X | s/img | |||
| Zhang et al.[23] | |||||
| Repulsion Loss[38] | |||||
| ALFNet[4] | GTX Ti | s/img | |||
| SADet-1step | GTX Ti | s/img | |||
| SADet-2step | GTX Ti | s/img | 3.8 | 16.3 | |
Adaptive Anchor Matching. The last contribution of SADet is the proposed adaptive anchor matching, which deals with the the problem of poor matching between anchor boxes and ground-truth boxes in crowded scenes. As reported in Table IV, the improvements on Reasonable, Bare, Partial subsets are , and respectively. Meanwhile, the performance under Heavy subset deteriorates to some extent, since the pedestrians under heavy occlusion are matched with anchors with small sizes, making it harder to regress to the full bounding boxes. Overall, this module is still an excellent selection for the improvement of pedestrian detection, especially for the scenes with non-heavy occlusion.
IV-B2 Evaluation results
We compare the proposed SADet with the state-of-the-art detectors on CityPersons in Table III. Detection results tested on the original image size are presented. Notably, SADet-step represents the model with steps refinement to anchor boxes.
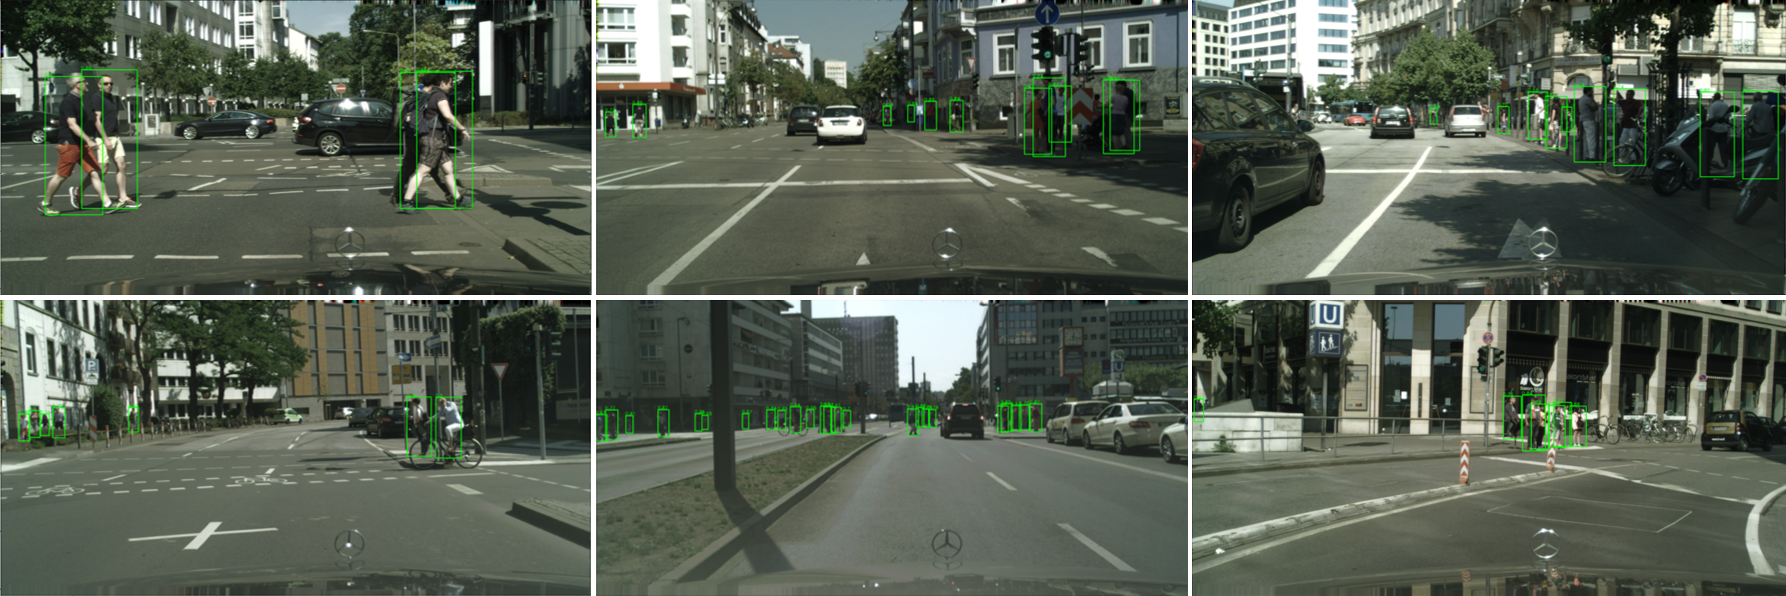
Without any additional supervision like semantic labels or auxiliary regression loss, our SADet achieves state-of-the-art results on the validation set of CityPersons by reducing MR-2 with scale, surpassing all published anchor-based and anchor-free methods, which demonstrates the superiority of the proposed method in pedestrian detection. Furthermore, following the strategy in [38], we also test our method on three subsets with different occlusion levels, i.e. Bare, Partial and Heavy. Our method also presents the best or comparable performance in term of different levels of occlusions, demonstrating the self-contained ability of our method to handle occlusion issues in crowded scenes. In addition, we can further conclude from the table that the performance of the anchor-based detector is better on the subsets with low occlusion, i.e., Reasonable and Bare, while the anchor-free method is more capable of detecting occluded pedestrians with higher performance on Partial and Heavy subsets. Some qualitative results are depicted in Figure. 8, threshold is set to .
Furthermore, these optimization strategies proposed in this paper are systematic improvements to the detection pipeline of one-stage pedestrian detector, which can be also applied to any anchor-based pedestrian detector, including one-stage and two-stage methods. To validate the generalization capacity and effectiveness of our method, we further conduct the ablative experiments based on different baselines, including one-stage detector SSD[17] and two-stage detector Faster R-CNN[16]. For SSD detector, we only adjust the aspect ratio of anchors to , and other settings are consistent with the original algorithm. Meanwhile, for Faster R-CNN detector, we follow the adjustments of Adaptive Faster R-CNN[22] to make the algorithm more suitable for pedestrian detection. Then the optimization strategies proposed in this paper are further applied to the RPN module, and the Fast R-CNN module remains unchanged. In the experiment, both these two detectors apply ResNet- as the backbone network, and the baselines of SSD and Faster R-CNN are and MR-2, respectively. Detection results tested on the original image size ( on CityPersons) are reported on Table VIII. By sequentially introducing the proposed four modules to the base models, we receive significant improvements with MR-2 decreases sharply on different detectors, i.e., for SSD and for Faster R-CNN, which fully proves the generalization capacity and effectiveness of our method.
| Component | Result | ||||
|---|---|---|---|---|---|
| Center- | |||||
| Soft Label | |||||
| Cosine-NMS | |||||
| Adaptive | |||||
| SSD | 17.2 | 16.5 | 15.8 | 15.2 | 13.4 |
| Faster R-CNN | 15.9 | 15.3 | 14.6 | 14.0 | 12.5 |
IV-C Caltech dataset
The Caltech[24] is one of the most popular and challenging datasets for pedestrian detection, which comes from approximately hours Hz VGA video recorded by a car traversing the streets in the greater Los Angeles metropolitan area. We use the new high quality annotations provided by [23] to evaluate the proposed method. The training and testing sets contains and frames, respectively. Following [24], the log-average miss rate over points ranging from to FPPI is used to evaluate the performance of the detector.
We directly fine-tune the detection models pre-trained on CityPersons[23] of the proposed SADet on the training set in Caltech. Similar to [38], we evaluate the SADet on the Reasonable subset of the Caltech dataset, and compare it to other state-of-the-art methods in Figure 7. Notably, the Reasonable subset (occlusion ) only includes the pedestrians with at least pixels tall, which is widely used to evaluate the pedestrian detectors.
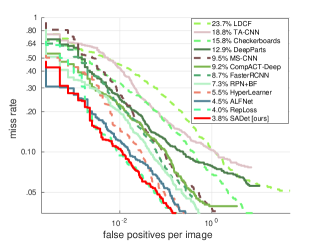
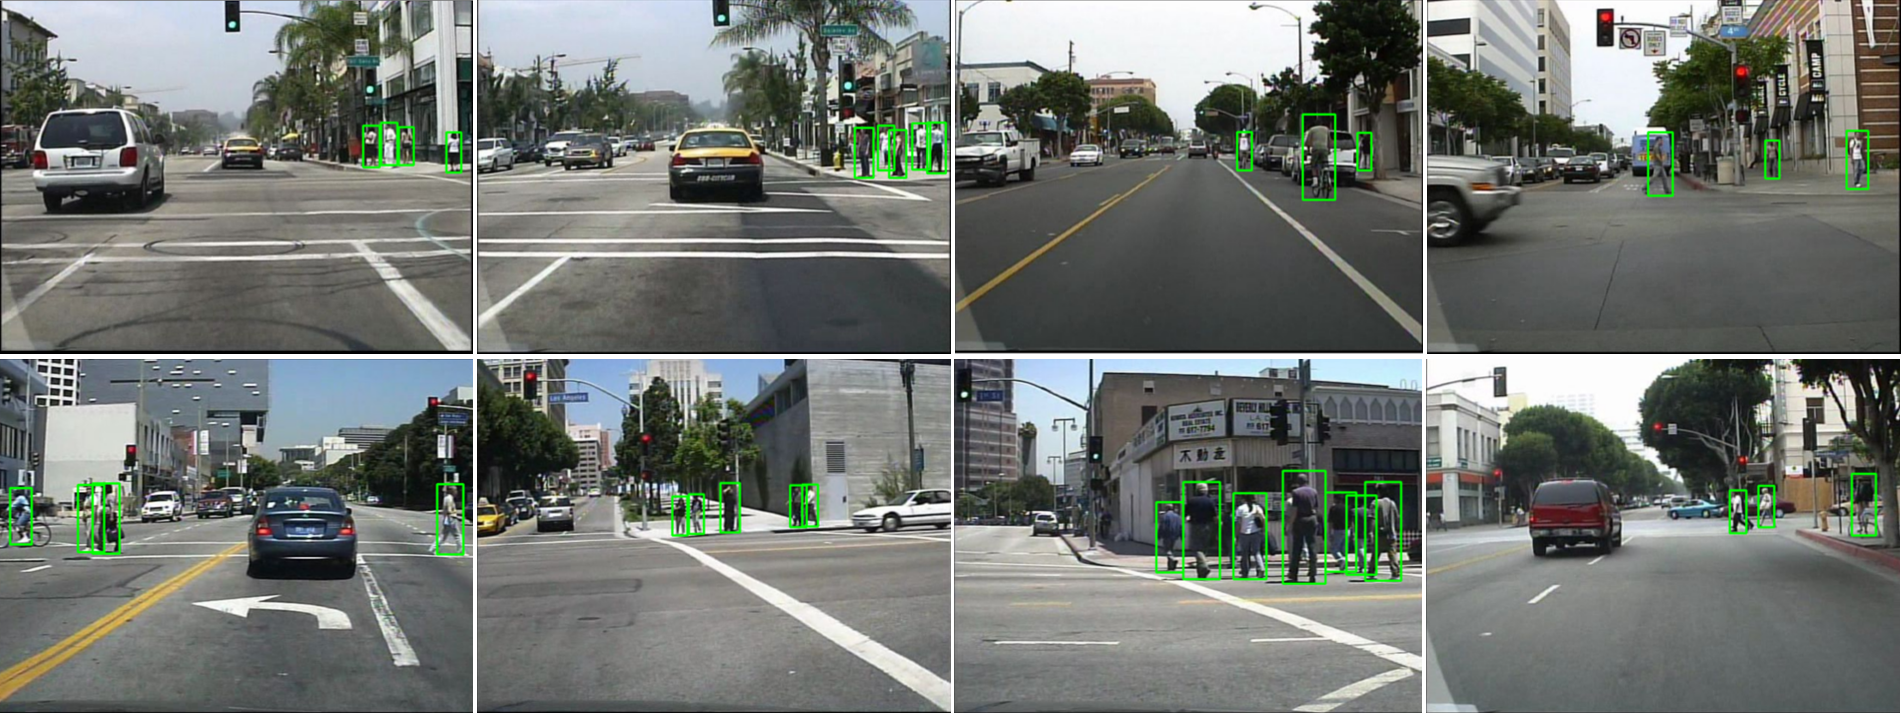
As shown in Figure 7, the proposed SADet performs competitively with the state-of-the-art result[63, 64, 65, 66, 67, 4, 38] on the Caltech dataset, surpassing all one-stage and two-stage detectors. Besides, the inference time of different methods on Caltech are also reported in Table VII, our SADet achieves a MR-2 of with real-time speed of FPS for VGA-resolution images (), which presents the effectiveness of our method in pedestrian detection. Some qualitative results are depicted in Figure. 9, threshold is set to .
IV-D CrowdHuman dataset
Given that the size of CityPersons[23] and Caltech[24] datasets are not particularly large, we further carry out experiments on the newly released CrowdHuman[27] dataset to validate the generalization capacity of the proposed method.
| Dataset | CityPersons | Caltech | CrowdHuman |
|---|---|---|---|
| images | 42,782 | ||
| persons | 339,565 | ||
| ignore regions | 99,267 | ||
| person/image | 22.64 |
As illustrated in Table IX, the CrowdHuman is a large and rich-annotated human detection dataset, which contains , and images collected from the Internet for training, validation and testing respectively. The number is more than boosted compared with previous challenging pedestrian detection dataset like CityPersons. The total number of persons is also noticeably larger than the others with person and ignore region annotations in the CrowdHuman training subset.We follow the evaluation protocol in CityPersons, denoted as MR-2. All the experiments are trained in the CrowdHuman training set and evaluated in the validation set.
To reduce the influence of irrelevant variables on the experiments, we still use the same backbone and settings of design parameters applied in the experiments of CityPersons[23] and Caltech[24], such as anchor ratio and detection layers. Besides, we follow the settings of [27] to improve the baseline result by employing the Feature Pyramid Network (FPN) in our model. As a result, our base model finally achieves a MR-2 of on CrowdHuman dataset.
| Component | SADet | ||||
|---|---|---|---|---|---|
| Center- | |||||
| Soft Label | |||||
| Cosine-NMS | |||||
| Visibility | |||||
| MR-2 | 67.64 | 66.22 | 64.78 | 64.32 | 62.96 |
Table X presents the ablative results of proposed method under the same settings of ablative experiments conducted in CityPersons dataset. By sequentially introducing the proposed four modules to our base model, we receive significant improvements with MR-2 decreased by , , and respectively, achieving MR-2 on CrowdHuman dataset with one step regression, which shows the effectiveness of the proposed method.
| Method | MR-2 | Recall | AP |
|---|---|---|---|
| RetinaNet[53] | 63.33 | 93.80 | 80.83 |
| ALFNet[4] | 64.37 | 92.10 | 80.13 |
| RFBNet[40] | 65.22 | 94.13 | 78.33 |
| RFBNet-adaptive[40] | 63.03 | 94.77 | 79.67 |
| Baseline | 67.64 | 90.14 | 77.23 |
| SADet-1step | 62.96 | 94.22 | 80.01 |
| SADet-2step | 60.13 | 95.02 | 82.14 |
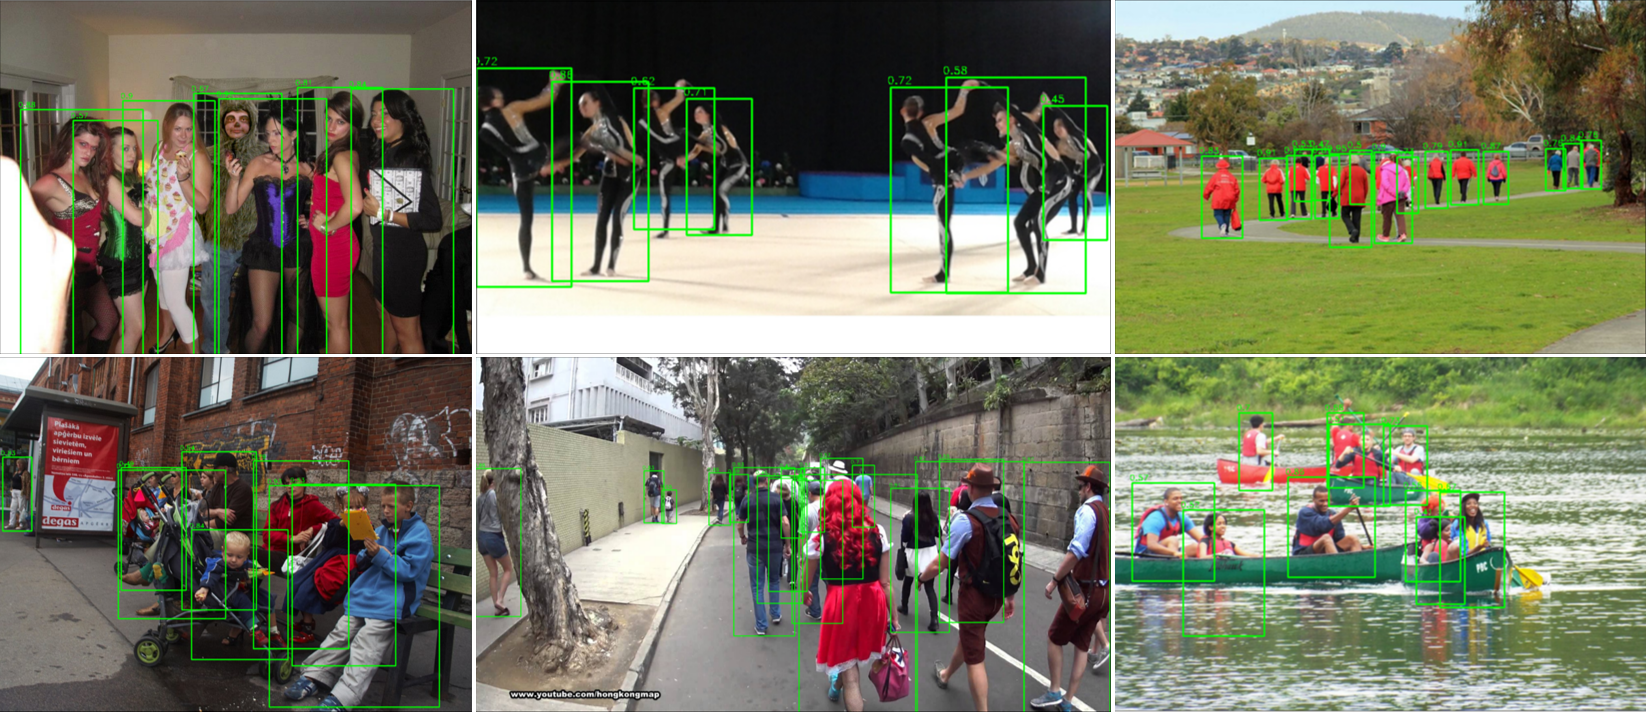
The results of the proposed SADet and other state-of-the-art methods on CrowdHuman dataset are reported in Table XI. Based on the two-step regression structure, our SADet outperforms all the other one-stage detectors with MR-2, Recall and AP on CrowdHuman, which not only demonstrates the superiority of our method, but also verifies its generalization capacity to other scenarios, i.e., human detection. Some qualitative results are depicted in Figure. 10, threshold is set to .
V Conclusion
In this paper, we propose a series of systematic optimization strategies for the detection pipeline of one-stage detector, forming a single shot anchor-based detector (SADet) for efficient and accurate pedestrian detection. Specifically, we first introduce a new design of soft label to the sample generation process to make full use of all valid samples and improve the robustness of classification. Then we optimize the design of loss and further propose a new bounding box regression loss, named Center- loss, which not only alleviates the defects of loss, but also enforces the predicted bounding boxes to be close to the associated objects and locate compactly, which is helpful to the precision improvement of bounding box regression. Meanwhile, for occluded pedestrian detection, we design Cosine-NMS for the postprocess of predictions to reduce false detections of the adjacent overlapping pedestrians, by assigning a higher penalty to the highly overlapped detections. Besides, the adaptive anchor matching is also proposed to enable the model to adaptively match the anchor boxes to full or visible bounding boxes according to the degree of occlusion, which further strengthens the ability of detecting occluded pedestrians. Our method is trained in an end-to-end fashion and achieves state-of-the-art accuracy on challenging pedestrian detection benchmarks, i.e., CityPersons[23], Caltech[24], and human detection benchmark CrowdHuman[27] with real-time speed of FPS for VGA-resolution images.
References
- [1] S. Li, X. Liu, W. Liu, H. Ma, and H. Zhang, “A discriminative null space based deep learning approach for person re-identification,” in 2016 4th International Conference on Cloud Computing and Intelligence Systems (CCIS). IEEE, 2016, pp. 480–484.
- [2] J. Wu, Y. Yang, H. Liu, S. Liao, Z. Lei, and S. Z. Li, “Unsupervised graph association for person re-identification,” in Proceedings of the IEEE International Conference on Computer Vision, 2019, pp. 8321–8330.
- [3] W. Li, X. Zhu, and S. Gong, “Harmonious attention network for person re-identification,” in Proceedings of the IEEE conference on computer vision and pattern recognition, 2018, pp. 2285–2294.
- [4] W. Liu, S. Liao, W. Hu, X. Liang, and X. Chen, “Learning efficient single-stage pedestrian detectors by asymptotic localization fitting,” in European Conference on Computer Vision, 2018, pp. 618–634.
- [5] H. Arshad, M. A. Khan, M. Sharif, M. Yasmin, and M. Y. Javed, “Multi-level features fusion and selection for human gait recognition: an optimized framework of bayesian model and binomial distribution,” International Journal of Machine Learning and Cybernetics, vol. 10, no. 12, pp. 3601–3618, 2019.
- [6] P. Viola and M. J. Jones, “Robust real-time face detection,” International journal of computer vision, vol. 57, no. 2, pp. 137–154, 2004.
- [7] D. G. Lowe, “Distinctive image features from scale-invariant keypoints,” International journal of computer vision, vol. 60, no. 2, pp. 91–110, 2004.
- [8] Q. Zhu, M.-C. Yeh, K.-T. Cheng, and S. Avidan, “Fast human detection using a cascade of histograms of oriented gradients,” in Proceedings of the IEEE Conference on Computer Vision and Pattern Recognition, vol. 2. IEEE, 2006, pp. 1491–1498.
- [9] R. Benenson, M. Mathias, T. Tuytelaars, and L. Van Gool, “Seeking the strongest rigid detector,” in Proceedings of the IEEE Conference on Computer Vision and Pattern Recognition, 2013, pp. 3666–3673.
- [10] J. Yan, Z. Lei, D. Yi, and S. Z. Li, “Multi-pedestrian detection in crowded scenes: A global view,” in Proceedings of the IEEE Conference on Computer Vision and Pattern Recognition. IEEE, 2012, pp. 3124–3129.
- [11] A. Krizhevsky, I. Sutskever, and G. E. Hinton, “Imagenet classification with deep convolutional neural networks,” in Advances in neural information processing systems, 2012, pp. 1097–1105.
- [12] K. He, X. Zhang, S. Ren, and J. Sun, “Deep residual learning for image recognition,” in Proceedings of the IEEE conference on computer vision and pattern recognition, 2016, pp. 770–778.
- [13] K. Simonyan and A. Zisserman, “Very deep convolutional networks for large-scale image recognition,” arXiv preprint arXiv:1409.1556, 2014.
- [14] C. Szegedy, V. Vanhoucke, S. Ioffe, J. Shlens, and Z. Wojna, “Rethinking the inception architecture for computer vision,” in Proceedings of the IEEE conference on computer vision and pattern recognition, 2016, pp. 2818–2826.
- [15] A. G. Howard, M. Zhu, B. Chen, D. Kalenichenko, W. Wang, T. Weyand, M. Andreetto, and H. Adam, “Mobilenets: Efficient convolutional neural networks for mobile vision applications,” arXiv preprint arXiv:1704.04861, 2017.
- [16] S. Ren, K. He, R. Girshick, and J. Sun, “Faster r-cnn: Towards real-time object detection with region proposal networks,” in Advances in neural information processing systems, 2015, pp. 91–99.
- [17] W. Liu, D. Anguelov, D. Erhan, C. Szegedy, S. Reed, C.-Y. Fu, and A. C. Berg, “Ssd: Single shot multibox detector,” in European conference on computer vision. Springer, 2016, pp. 21–37.
- [18] C. Zhuang, S. Zhang, X. Zhu, Z. Lei, J. Wang, and S. Z. Li, “Fldet: A cpu real-time joint face and landmark detector,” in IAPR International Conference on Biometrics (ICB). Crete, Greece, 2019.
- [19] R. Girshick, “Fast r-cnn,” in Proceedings of the IEEE international conference on computer vision, 2015, pp. 1440–1448.
- [20] R. Girshick, J. Donahue, T. Darrell, and J. Malik, “Rich feature hierarchies for accurate object detection and semantic segmentation,” in Proceedings of the IEEE conference on computer vision and pattern recognition, 2014, pp. 580–587.
- [21] J. R. Uijlings, K. E. Van De Sande, T. Gevers, and A. W. Smeulders, “Selective search for object recognition,” International journal of computer vision, vol. 104, no. 2, pp. 154–171, 2013.
- [22] L. Zhang, L. Lin, X. Liang, and K. He, “Is faster r-cnn doing well for pedestrian detection?” in European conference on computer vision. Springer, 2016, pp. 443–457.
- [23] S. Zhang, R. Benenson, and B. Schiele, “Citypersons: A diverse dataset for pedestrian detection,” in Proceedings of the IEEE Conference on Computer Vision and Pattern Recognition, 2017, pp. 3213–3221.
- [24] P. Dollar, C. Wojek, B. Schiele, and P. Perona, “Pedestrian detection: An evaluation of the state of the art,” IEEE transactions on pattern analysis and machine intelligence, vol. 34, no. 4, pp. 743–761, 2011.
- [25] W. Liu, S. Liao, W. Ren, W. Hu, and Y. Yu, “High-level semantic feature detection: A new perspective for pedestrian detection,” in Proceedings of the IEEE Conference on Computer Vision and Pattern Recognition, 2019, pp. 5187–5196.
- [26] H. Rezatofighi, N. Tsoi, J. Gwak, A. Sadeghian, I. Reid, and S. Savarese, “Generalized intersection over union: A metric and a loss for bounding box regression,” in Proceedings of the IEEE Conference on Computer Vision and Pattern Recognition, 2019, pp. 658–666.
- [27] S. Shao, Z. Zhao, B. Li, T. Xiao, G. Yu, X. Zhang, and J. Sun, “Crowdhuman: A benchmark for detecting human in a crowd,” arXiv preprint arXiv:1805.00123, 2018.
- [28] N. Dalal and B. Triggs, “Histograms of oriented gradients for human detection,” in Proceedings of the IEEE Conference on Computer Vision and Pattern Recognition, 2005.
- [29] J. A. Suykens and J. Vandewalle, “Least squares support vector machine classifiers,” Neural processing letters, vol. 9, no. 3, pp. 293–300, 1999.
- [30] S. Paisitkriangkrai, C. Shen, and A. Van Den Hengel, “Strengthening the effectiveness of pedestrian detection with spatially pooled features,” in European conference on computer vision. Springer, 2014, pp. 546–561.
- [31] J. Yan, Z. Lei, L. Wen, and S. Z. Li, “The fastest deformable part model for object detection,” in Proceedings of the IEEE Conference on Computer Vision and Pattern Recognition, 2014, pp. 2497–2504.
- [32] P. Felzenszwalb, D. McAllester, and D. Ramanan, “A discriminatively trained, multiscale, deformable part model,” in Proceedings of the IEEE conference on computer vision and pattern recognition. IEEE, 2008, pp. 1–8.
- [33] P. Dollár, R. Appel, S. Belongie, and P. Perona, “Fast feature pyramids for object detection,” IEEE transactions on pattern analysis and machine intelligence, vol. 36, no. 8, pp. 1532–1545, 2014.
- [34] W. Nam, P. Dollár, and J. H. Han, “Local decorrelation for improved pedestrian detection,” in Advances in Neural Information Processing Systems, 2014, pp. 424–432.
- [35] P. Dollár, Z. Tu, P. Perona, and S. Belongie, “Integral channel features,” 2009.
- [36] S. Zhang, R. Benenson, B. Schiele et al., “Filtered channel features for pedestrian detection.”
- [37] Z. Cai, Q. Fan, R. S. Feris, and N. Vasconcelos, “A unified multi-scale deep convolutional neural network for fast object detection,” in European Conference on Computer Vision. Springer, 2016, pp. 354–370.
- [38] X. Wang, T. Xiao, Y. Jiang, S. Shao, J. Sun, and C. Shen, “Repulsion loss: Detecting pedestrians in a crowd,” in Proceedings of the IEEE Conference on Computer Vision and Pattern Recognition, 2018, pp. 7774–7783.
- [39] S. Zhang, L. Wen, X. Bian, Z. Lei, and S. Z. Li, “Occlusion-aware r-cnn: detecting pedestrians in a crowd,” in European Conference on Computer Vision, 2018, pp. 637–653.
- [40] S. Liu, D. Huang, and Y. Wang, “Adaptive nms: Refining pedestrian detection in a crowd,” in Proceedings of the IEEE Conference on Computer Vision and Pattern Recognition, 2019, pp. 6459–6468.
- [41] Y. Pang, J. Xie, M. H. Khan, R. M. Anwer, F. S. Khan, and L. Shao, “Mask-guided attention network for occluded pedestrian detection,” in Proceedings of the IEEE International Conference on Computer Vision, 2019, pp. 4967–4975.
- [42] L. Huang, Y. Yang, Y. Deng, and Y. Yu, “Densebox: Unifying landmark localization with end to end object detection,” arXiv preprint arXiv:1509.04874, 2015.
- [43] J. Yu, Y. Jiang, Z. Wang, Z. Cao, and T. Huang, “Unitbox: An advanced object detection network,” in Proceedings of the 24th ACM international conference on Multimedia. ACM, 2016, pp. 516–520.
- [44] J. Redmon, S. Divvala, R. Girshick, and A. Farhadi, “You only look once: Unified, real-time object detection,” in Proceedings of the IEEE conference on computer vision and pattern recognition, 2016, pp. 779–788.
- [45] T.-Y. Lin, P. Dollár, R. Girshick, K. He, B. Hariharan, and S. Belongie, “Feature pyramid networks for object detection,” in Proceedings of the IEEE conference on computer vision and pattern recognition, 2017, pp. 2117–2125.
- [46] H. Law and J. Deng, “Cornernet: Detecting objects as paired keypoints,” in European Conference on Computer Vision, 2018, pp. 734–750.
- [47] T. Song, L. Sun, D. Xie, H. Sun, and S. Pu, “Small-scale pedestrian detection based on topological line localization and temporal feature aggregation,” in European Conference on Computer Vision, 2018, pp. 536–551.
- [48] K. Duan, S. Bai, L. Xie, H. Qi, Q. Huang, and Q. Tian, “Centernet: Keypoint triplets for object detection,” in Proceedings of the IEEE International Conference on Computer Vision, 2019, pp. 6569–6578.
- [49] S. Zhang, X. Zhu, Z. Lei, H. Shi, X. Wang, and S. Z. Li, “S3fd: Single shot scale-invariant face detector,” in Proceedings of the IEEE International Conference on Computer Vision, 2017, pp. 192–201.
- [50] Z. Zheng, P. Wang, W. Liu, J. Li, R. Ye, and D. Ren, “Distance-iou loss: Faster and better learning for bounding box regression,” arXiv preprint arXiv:1911.08287, 2019.
- [51] H. Wang, F. Nie, and H. Huang, “Robust distance metric learning via simultaneous l1-norm minimization and maximization,” in International conference on machine learning, 2014, pp. 1836–1844.
- [52] N. Bodla, B. Singh, R. Chellappa, and L. S. Davis, “Improving object detection with one line of code,” in Proceedings of the IEEE international conference on computer vision, 2017, pp. 5561–5569.
- [53] T.-Y. Lin, P. Goyal, R. Girshick, K. He, and P. Dollár, “Focal loss for dense object detection,” in Proceedings of the IEEE international conference on computer vision, 2017, pp. 2980–2988.
- [54] J. Zhang, L. Lin, Y. Li, Y.-c. Chen, J. Zhu, Y. Hu, and S. C. Hoi, “Attribute-aware pedestrian detection in a crowd,” arXiv preprint arXiv:1910.09188, 2019.
- [55] F. Chollet et al., “Keras: Deep learning library for theano and tensorflow,” URL: https://keras. io/k, vol. 7, no. 8, p. T1, 2015.
- [56] D. P. Kingma and J. Ba, “Adam: A method for stochastic optimization,” arXiv preprint arXiv:1412.6980, 2014.
- [57] J. Deng, W. Dong, R. Socher, L.-J. Li, K. Li, and L. Fei-Fei, “Imagenet: A large-scale hierarchical image database,” in Proceedings of the IEEE conference on computer vision and pattern recognition. Ieee, 2009, pp. 248–255.
- [58] X. Glorot and Y. Bengio, “Understanding the difficulty of training deep feedforward neural networks,” in Proceedings of the thirteenth international conference on artificial intelligence and statistics, 2010, pp. 249–256.
- [59] S. Kosub, “A note on the triangle inequality for the jaccard distance,” Pattern Recognition Letters, vol. 120, pp. 36–38, 2019.
- [60] Z. Cai, M. Saberian, and N. Vasconcelos, “Learning complexity-aware cascades for deep pedestrian detection,” in Proceedings of the IEEE International Conference on Computer Vision, 2015, pp. 3361–3369.
- [61] J. Li, X. Liang, S. Shen, T. Xu, J. Feng, and S. Yan, “Scale-aware fast r-cnn for pedestrian detection,” IEEE Transactions on Multimedia, vol. 20, no. 4, pp. 985–996, 2017.
- [62] X. Du, M. El-Khamy, J. Lee, and L. Davis, “Fused dnn: A deep neural network fusion approach to fast and robust pedestrian detection,” in 2017 IEEE winter conference on applications of computer vision (WACV). IEEE, 2017, pp. 953–961.
- [63] B. Yang, J. Yan, Z. Lei, and S. Z. Li, “Convolutional channel features,” in Proceedings of the IEEE international conference on computer vision, 2015, pp. 82–90.
- [64] Y. Tian, P. Luo, X. Wang, and X. Tang, “Pedestrian detection aided by deep learning semantic tasks,” in Proceedings of the IEEE Conference on Computer Vision and Pattern Recognition, 2015, pp. 5079–5087.
- [65] J. Mao, T. Xiao, Y. Jiang, and Z. Cao, “What can help pedestrian detection?” in Proceedings of the IEEE Conference on Computer Vision and Pattern Recognition, 2017, pp. 3127–3136.
- [66] Y. Tian, P. Luo, X. Wang, and X. Tang, “Deep learning strong parts for pedestrian detection,” in Proceedings of the IEEE international conference on computer vision, 2015, pp. 1904–1912.
- [67] A. Daniel Costea and S. Nedevschi, “Semantic channels for fast pedestrian detection,” in Proceedings of the IEEE Conference on Computer Vision and Pattern Recognition, 2016, pp. 2360–2368.