Measuring internal forces in single-stranded DNA: Application to a DNA force clamp
Abstract
We present a new method for calculating internal forces in DNA structures using coarse-grained models and demonstrate its utility with the oxDNA model. The instantaneous forces on individual nucleotides are explored and related to model potentials, and using our framework, internal forces are calculated for two simple DNA systems and for a recently-published nanoscopic force clamp. Our results highlight some pitfalls associated with conventional methods for estimating internal forces, which are based on elastic polymer models, and emphasise the importance of carefully considering secondary structure and ionic conditions when modelling the elastic behaviour of single-stranded DNA. Beyond its relevance to the DNA nanotechnological community, we expect our approach to be broadly applicable to calculations of internal force in a variety of structures – from DNA to protein – and across other coarse-grained simulation models.
keywords:
American Chemical Society, LaTeXHarvard] School of Engineering and Applied Sciences, Harvard University, 29 Oxford Street, Cambridge MA, 02138, USA \alsoaffiliationRudolf Peierls Centre for Theoretical Physics, University of Oxford, 1 Keble Road, Oxford, OX1 3NP, UK Venice] Dipartimento di Scienze Molecolari e Nanosistemi, Universitá Ca Foscari di Venezia, Via Torino 155, 30172, Venezia Mestre, Italy OxPhys] Rudolf Peierls Centre for Theoretical Physics, University of Oxford, 1 Keble Road, Oxford, OX1 3NP, UK OxChem] Department of Chemistry, University of Oxford, South Parks Road, Oxford, OX1 3QZ, UK \abbreviationsIR,NMR,UV
1 Introduction
The communication of force is central to cellular function. Force propagation through DNA features in transcription and translation, as special molecules forcibly open the DNA helix to access its contents 1, 2; in the dense packaging that enables metres of DNA to be stored in a 6 -diameter nucleus1; and even in gene expression, which is is modulated by the mechanical state of the nucleus 3. Force plays a role in manifold other biological mechanisms, as well: mechanosensitive ion channels open in response to specific tension in cellular membranes 4, 5; the catalytic activity of enzymes can be altered by the application of force 4; and the cytoskeleton and extracellular matrix are tensegrity networks that propagate forces within, between, and among cells 6. Additionally, force and torque are important to the functioning of molecular machines, from the transport molecule kinesin to ATP synthase, the energy production factory of all cells 7. Because of their critical role in diverse processes, from embryogenesis 8 to immune response 9, 10 and tumour metastasis 11, probing forces at the molecular level is a key scientific aim.
The advent of DNA nanotechnology 12, 13 has enabled the fabrication of DNA-based nanoscale devices capable of sensing 14, 15, 16 and exerting 17, 18, 16, 2 forces in the biologically relevant regime of 0-20 19. DNA force sensors have already been profitably applied to study integrin proteins that connect cells to extracellular filaments 20; the forces involved in nucleosome association21; and DNA repair proteins 14. Force-generating DNA devices have been used to investigate the binding of transcription factors under tension 17, 2 and to mimic the function of molecular motors in transporting cargo 18. These devices exploit the mechano-elastic properties of DNA in its single- and double-stranded forms. Some sense forces using the known rupture forces of double-stranded DNA (dsDNA) in unzipping or shearing geometries 22. Others use the unfolding thermodynamics of DNA hairpins 23, 24, 25, 26, 27: when hairpins unfold in response to an applied load, it is inferred that the force exceeds F1/2, the force at which a hairpin has a 50% chance of being unfolded at equilibrium. In computing F1/2, elastic polymer models are typically employed to calculate the free energy of stretching single-stranded DNA (ssDNA). Polymer models are also invoked to calibrate nanodevices that capitalize on the entropic spring behaviour of ssDNA, which resists any decrease in configurational entropy: circumscribing the end-to-end distance of ssDNA by even a few leads to forces in the range 28, 29. Sensors use the end-to-end distances of ssDNA to report forces 19, 21, and other devices exert predefined forces on targets by constraining the end-to-end distance of ssDNA 17, 30, 31, 2.
Many nanotechnological applications beyond force sensors and probes require knowledge of the mechano-elastic properties of ssDNA: in so-called DNA wireframe architectures like polyhedra and buckyballs 32, 33, flexible ssDNA strands act as vertices that link stiff double-stranded regions to achieve designed shapes. Some tensegrity structures – like DNA origami 34 tensegrity prisms and kites – feature ssDNA as the mediator of constant stress in the design 35, 36. Liedl et al. demonstrated the ability of DNA helix bundles in these structures to assemble against a force of 14 applied by ssDNA linkers. ssDNA springs have been used to introduce flexibility into DNA origami crank-slider joints 37; to act as hinges in nanocages designed for drug delivery 38; and as components of nanotubes capable of the controlled release of gold nanoparticles 39. Finally, many computational models utilised to refine and design DNA nanostructures employ polymer models of ssDNA 40, 41, rendering the importance of accurate mechanical models of DNA far-reaching.
To determine the forces exerted on or applied by ssDNA in biological and nanotechnological contexts, two general routes have been employed: experimental calibration and simplified polymer models 15. In the former case, single-molecule force spectroscopy (SMFS), for example via magnetic tweezers, is used to characterise the force response of the tension sensor in question 19, 25. SMFS experiments are prone to instrumental artefacts, however, including convolution of tension probe with the instrument response function and the fact that bond rupture forces depend on loading rates42, 43 used during calibration. These issues complicate the interpretation of forces and lead to uncertainties of at least a few 19, 25.
Alternatively, because ssDNA has been widely described by simplified polymer models – typically the worm-like chain (WLC) 44 or the extensible freely-jointed chain (exFJC) 45 model – the majority of DNA tension probes are calibrated by applying such models with previously-measured parameters.
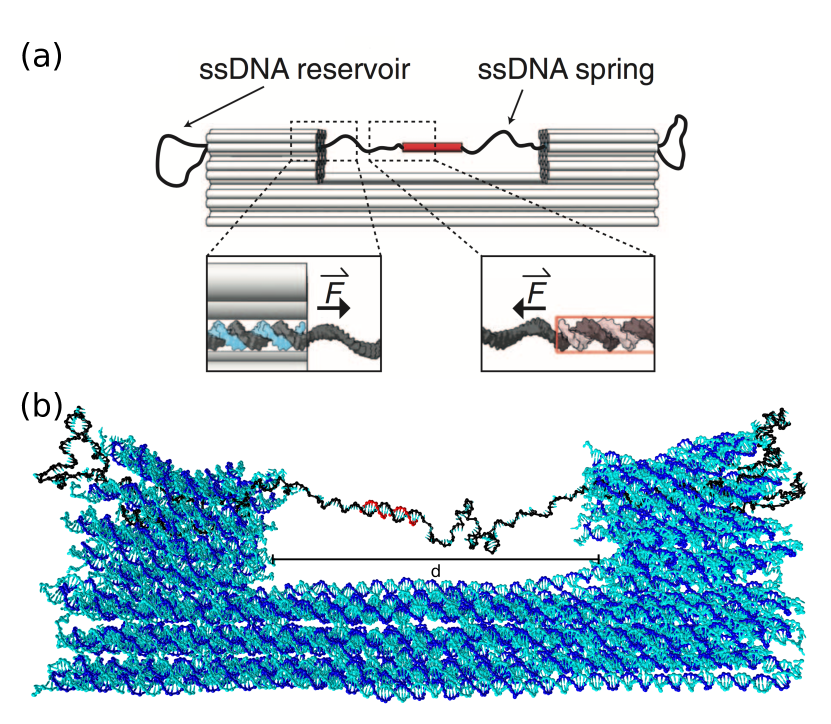
One example of a DNA tension probe calibrated using simplified polymer models is the recently-proposed DNA origami force clamp of Nickels et al. 17, shown in Figure 1. Force is applied to a molecule of interest bound to the centre of a ssDNA spring suspended between rigid origami blocks; the magnitude of this force can be tuned by adjusting the spring’s length. In practice, this is achieved by altering the internal origami staple sequences slightly to thread portions of ssDNA ‘reservoirs’ on either end of the origami into or out of the central gap. As we will detail below, potential problems with common calibration procedures like the one employed by Nickels et al. 17 include the fact that it is not clear how to map ssDNA straightforwardly to existing polymer models, as well as the existence of secondary structures in ssDNA which they do not account for.
Given the challenge of calculating ssDNA internal forces precisely and the relevance of doing so to manifold biological and nanotechnological applications, simulations have a clear role in complementing and refining experiments. However, an explicit procedure for calculating these forces in coarse-grained simulations has not been delineated elsewhere. Here, we present a novel method for calculating internal forces in coarse-grained simulations. We then use this framework to analyse the nanoscopic force clamp of Nickels et al. 17, which allows us to highlight crucial pitfalls associated with using continuum polymer models to calibrate internal forces in ssDNA.
To achieve our end of providing accurate internal force estimates in a DNA nanostructure, a computational model of DNA is needed that is detailed enough to capture DNA mechanics well, but sufficiently coarse-grained that it can be simulated on long enough time scales to (i) sample all relevant ssDNA secondary structure and (ii) achieve a converged average over instantaneous forces that may have large variance. Here, we use oxDNA 46, 47, 48, a single-nucleotide-level coarse grained DNA model that has enjoyed extensive validation at multiple levels of description. Basic DNA biophysical properties, including structure, persistence length 46, 48, 47, torsional modulus 49, 50, and the force-extension curves of single- and double-stranded DNA 47 are well-captured by oxDNA, which also successfully modelled force-induced dsDNA overstretching 51. Additionally, oxDNA has successfully described large DNA origami designs both structurally – capturing the opening angles of DNA origami hinges 52, 53 and the full 3D structure of a cryo-EM characterised origami 54 – and mechanically, reproducing experimental origami force unfolding behaviour 55. Finally, oxDNA has repeatedly been shown to capture the thermodynamics of DNA hybridization and hairpin formation reactions well 46, 47, 48. Since these are the crucial processes relevant to ssDNA secondary structure formation, we are confident that oxDNA is capable of sampling secondary structures realistically; indeed, previous studies have validated this ability explicitly through deriving ssDNA secondary-structure-dependent quantities that matched closely with experimental values 51, 56. By combining oxDNA molecular dynamics (MD) simulations of the aforementioned force clamp with our method for calculating internal forces, we demonstrate the importance of simulation-aided force calibration for DNA nanotechnological applications.
2 Methods
2.1 oxDNA Simulations
The oxDNA model has been extensively described previously 46, 47, 48. Briefly, oxDNA represents nucleotides as rigid bodies featuring three interaction sites for backbone, stacking, and hydrogen-bonding interactions. Parameters in oxDNA were obtained using a “top-down” approach: the model was fitted to experimental results for structural, thermodynamic, and elastic properties of DNA. Nucleotides interact via pairwise potentials chosen to incorporate salient physical interactions, and the full potential energy function for the most recent version of the model, oxDNA2, contains terms for backbone connectivity, stacking, hydrogen bonding, cross stacking (i.e. stacking between bases on opposite duplex strands), excluded volume, coaxial stacking (i.e. stacking between contiguous bases on different strands, as across a nick), and electrostatic (according to Debye-Hückel theory) interactions. While the model can capture salt, temperature, and sequence-dependence, it cannot represent the detailed interactions of DNA with solvent ions, though this shortcoming is not expected to affect the current work significantly. One additional, important caveat is that oxDNA currently cannot represent non-canonical base pairing, which could potentially affect its ability to model ssDNA secondary structures accurately. We do not believe this limitation to be consequential to our results, however, as detailed further below.
We performed MD simulations with oxDNA, using the velocity Verlet algorithm to integrate Newton’s equations of motion with an integration time step of 15.2 . Solvent in oxDNA is implicit, and we simulated our systems in the canonical NVT ensemble. Coupling between the system of interest and a heat bath was imitated using an Andersen-like thermostat 57, 58, where velocities were redrawn from a Maxwell-Boltzmann distribution every 1.55 . The particle translational diffusion coefficient was set to 2.5, or – which is about 2 orders of magnitude faster than in experiment 59 – to accelerate diffusive dynamics and improve sampling. This change in the effective diffusion coefficient does not affect the equilibrium properties that we are calculating in this paper 60. For the simulations of the full origami structure shown in Figure 1, GPUs were used; otherwise, simulations were performed on CPU.
Before collecting data for analysis, all systems simulated in this work were equilibrated until the potential energy reached a stable value. Simulations were performed at 21 and at varying monovalent salt concentrations, as detailed below. Complete simulation parameters used can be found in Table S1 in the Supporting Information.
2.2 Calculating forces
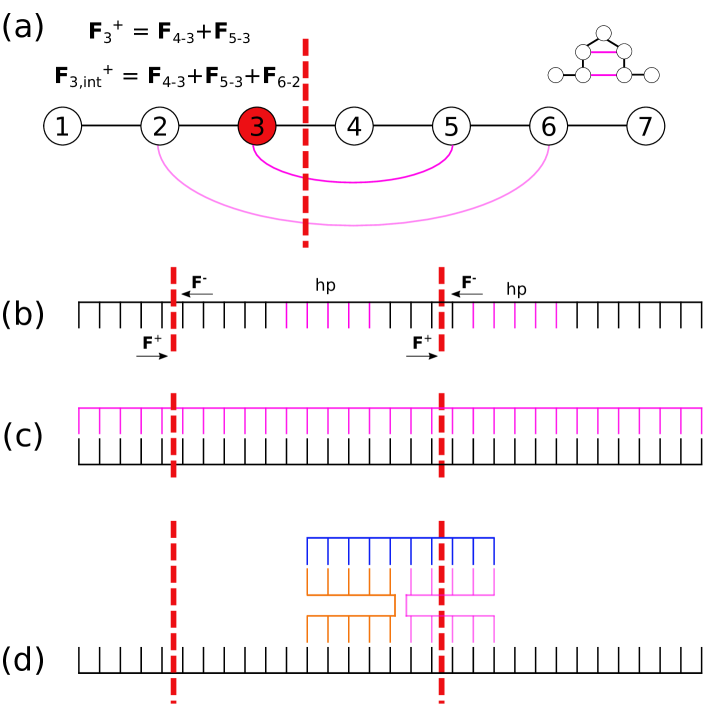
In order to calculate the internal tension in a polymer using a coarse-grained simulator such as oxDNA, some average over the pairwise particle forces must be taken. Because nucleotides can interact with more than just their nearest neighbours, the correct way to find the average force at any point in the chain is to draw a ‘topological interface’ between two nucleotides in the DNA structure (for example, the red dashed lines in Figure 2) and sum forces exerted by all nucleotides topologically downstream of the interface on all nucleotides topologically upstream of the interface. On average and at equilibrium, the force directed topologically upstream downstream will be equal in magnitude to the force directed topologically downstream upstream, and will be the net tension in the chain. In this and subsequent sections, we refer to the force calculated in one topological direction (upstream downstream or vice versa) the ‘one-sided’ force. In principle, given sufficient sampling, the one-sided force will be the same regardless of where in the DNA structure one draws the interface. Note that the sum of oppositely-directed one-sided forces at any interface should give zero at equilibrium for a polymer at rest.
To see this more clearly, consider the ssDNA schematic in Figure 2(a) of a single strand featuring a small hairpin. For simplicity, consider only the backbone interactions – modelled in oxDNA by a finitely extensible nonlinear elastic (FENE) potential and indicated by straight lines – and hydrogen bonding interactions – indicated by the pink curved lines. A naive approach to calculating the tension in the strand connecting nucleotides 3 and 4, for instance, is to find the total one-sided force on nucleotide 3 from ‘upstream’: the sum of the forces exerted on it by nucleotides 4 and 5, in Fig. 2(a). This general strategy yields inconsistent forces across the polymer, with very large forces in regions of secondary structure, apparent in Figure 4(b). Because we expect a constant one-sided tension throughout the polymer chain at equilibrium, it is clear that a different approach is needed. In the case of the example of Figure 2(a), the force exerted by nucleotide 6 on nucleotide 2 by virtue of their hydrogen bond must also be included, to correctly counterbalance the complex force propagation dynamics in the hairpin; this yields in Fig. 2(a). The example discussed in reference to Figure 4 below confirms that this is the correct approach where one desires to compute the spatially-constant net internal tension across a polymer chain. Figure 2(b)–(d) illustrate example topological interfaces for a single strand with a hairpin, a double strand, and a single strand containing a Holliday junction, respectively. Here and in subsequent sections, we use the notational convention that () indicates the one-sided force directed topologically downstream upstream (topologically upstream downstream) at a given nucleotide or interface location in the polymer. Note that the topological direction must be distinguished from the physical direction of the force. We indicate components of the force along particular physical axes using subscripts; for example, is the -component of the topologically downstream upstream one-sided force on nucleotide (for calculations involving the naive method) or across interface (for calculations involving the topological interface method).
In the sections that follow, we find the internal strand tension for test cases of a poly-T strand, ssDNA with a hairpin, and the nanoscopic force clamp of Nickels et al. 17 that was discussed above.
3 Test systems
3.1 poly-T ssDNA
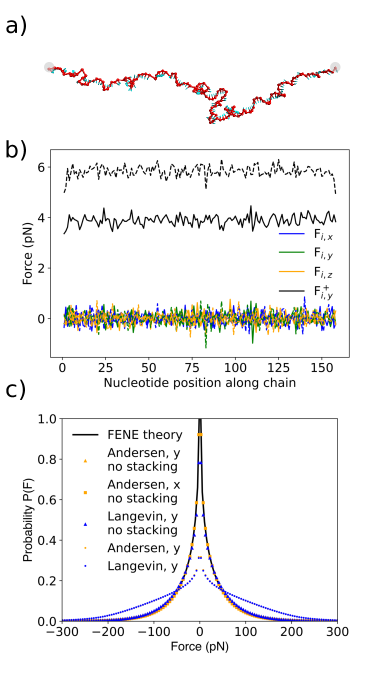
Consider first a simple test case of a single 160-nucleotide (nt) poly-T strand whose ends are trapped in harmonic potentials, shown in Figure 3(a). Constraining the endpoints should give rise to a nonzero tension in the strand. In this case, a naive attempt to compute this tension by summing the forces on a given nucleotide exerted by all other nucleotides topologically upstream of it yields similar values all along the chain: Figure 3(b) displays in black the component of the one-sided force along the axis of constraint, here the y-axis, labelled ‘’, and equal to 3.84 when averaged over all 160 nucleotides. The average one-sided force component along each of the axes perpendicular to the axis of constraint is 0 . Additionally, the net force on each nucleotide () averages to 0 , as as expected, given that the chain is in equilibrium and therefore is experiencing no net acceleration. Simulations were repeated with the base stacking interaction turned off; the resulting average force of 5.79 , shown by the dashed black line in Figure 3(b), is higher than with stacking turned on. This is physically reasonable: a stacked chain has a longer Kuhn length than an unstacked one, and has fewer phase space conformations available to it; thus, its internal tension is lower.
We can compare this force to the prediction of the exFJC model:
| (1) |
where and are the force and average extension, respectively; is a stretching modulus; is the contour length of the chain; and is the usual thermal energy. Under our simulation conditions, and using the frequently-cited parameters reported by Smith et al. 28: Kuhn length , contour length 160 nt 0.56 , and elastic modulus , the exFJC model predicts an entropic tension in the chain of 4.4 . That this is higher than the simulated result reflects that the experimental fits of Smith et al. 28 are averaging over secondary structure, which is not present in the poly-T.
We note that the effective force shown in Fig. 3(b) is an average, and that instantaneous forces can be much larger. We can consider this in more detail by looking at the distribution of forces experienced by an individual nucleotide along the chain, shown in Fig. 3(c) (averaged over all 160 nucleotides in the chain) for two directions: along the axis of constraint () and orthogonal to the axis of constraint (), and for two different thermostats: Andersen-like and Langevin (described on pages 1-2 in the Supporting Information). Data for the and axes are in good agreement, as are data for the two thermostats, which confirms that the distributions are not artefacts of a particular thermostat choice. The first thing to notice is that the distributions are very broad, with instantaneous forces over 100 in magnitude being common; therefore, averages must be computed over lots of data to derive sensible average force estimates (the values in Figure 3(b) represent averages over 3.8 MD timesteps, or 0.6 .111In oxDNA, simulation time units can be converted to physical units based on simulation energy and length scales; this conversion yields 3.0310-12 per time unit. The simulations performed in this work used 200 MD steps per time unit, corresponding to 15 per MD step. However, comparison of coarse-grained MD timescales to actual physical timescales must be done cautiously, due to the fact that coarse-graining reduces timescale separations between different processes 61. This can be done in general by comparing the physical (experimental) and simulation timescales for a relevant process 62.). Secondly, they are non-Gaussian. Finally, force distributions corresponding to the full simulations (circles) are broader than those with stacking turned off (triangles and squares). In both cases, the considerable magnitude of the forces and the shapes of the distributions can be rationalised by looking in detail at the underlying oxDNA potentials.
For a single poly-T strand of DNA, the primary mechanisms available for internucleotide force transfer are propagation along the backbone, mediated by the FENE potential, and stacking interactions between bases. The force probability distribution expected if interactions are due solely to the FENE potential can be derived; see pages 2-4 of the Supporting Information for details. The resulting is plotted in black in Fig. 3(c), and matches well the data from simulations with stacking interactions suppressed.
To discover why the stacking interaction broadens the force distributions, we can make a simple argument based on the form of the stacking potential in oxDNA. A rough estimate of representative forces at equilibrium due to each of the FENE and stacking potentials is given by the derivatives of these potentials (considering only the radial term of the stacking potential for simplicity) evaluated at the thermal energy that the system is expected to possess in equilibrium according to equipartition, ; see pages 4-6 of the Supporting Information for details. Using oxDNA parameters, representative radially-directed forces are are and , which, after taking into account that only one component of the force is plotted in Fig. 3(c), match the distribution widths well.
3.2 ssDNA with hairpin
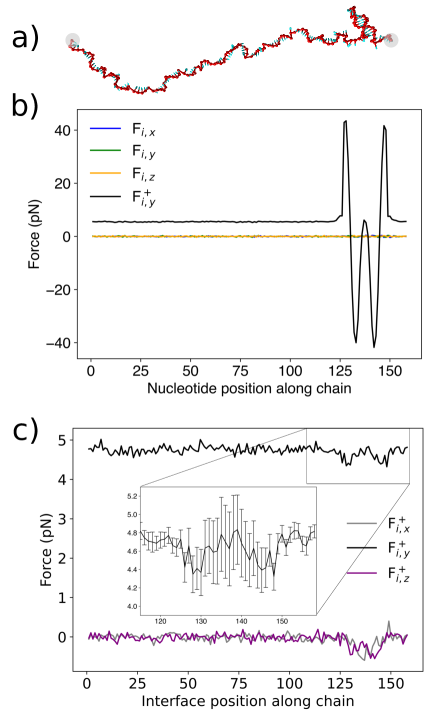
Consider now a more complex arrangement: a 160-nt strand that is poly-T save for a hairpin with a 10-bp stem and a 4-T loop near to the 5’ end of the strand; see Figure 4(a). Applying the method of section 2.2 to calculate internal tension no longer works, as revealed by Figure 4(b). The net force exerted on each nucleotide is still on average, as it should be. However, while one expects the average one-sided force on each nucleotide along the direction of constraint to be approximately constant and equal to the entropic tension in the strand, this is not the case in the vicinity of the hairpin. Clearly, when analyzing tension in a DNA chain when secondary structure is involved, it is no longer sufficient to simply calculate the forces exerted on each nucleotide by all nucleotides topologically ‘upstream’ or ‘downstream’ of it, as force propagation in that case is mediated by a more complex network of interactions – including hydrogen bonding and cross-stacking – that communicate tension through the chain in a non-trivial manner. That the deviations in forces in the hairpin region are so large partly reflects the features of the oxDNA potential, which in turn are capturing the physical frustration inherent to DNA interactions. In particular, bases in the hairpin stem cannot simultaneously minimize hydrogen-bonding, stacking, FENE, and cross-stacking potentials, regardless of whether there is a net tension in the strand; this is evidenced by the fact that, for example, a stacked single strand has a tighter helix than dsDNA 63 and that base-paired nucleotides have a small propeller twist 64. Because they are displaced from the minima of one of more of these potentials, the average individual inter-nucleotide forces in the vicinity of the hairpin can be large; hence, when only a subset of the forces across a topological interface are taken into account, there will be large deviations from the true force being transmitted through the chain.
The approach described above in Methods, however – adding all forces directed topologically upstream downstream across a given interface – recovers the expected results: see Fig. 4(c). In this case, the tension averaged across all nucleotides along the axis of constraint is (higher than in the poly-T case previously considered because the hairpin has shortened the effective contour length), and the force behaves reasonably in the vicinity of the hairpin, though errors in that region are larger due to the greater magnitude of pairwise nucleotide forces.
3.3 Nanoscopic force clamp
With some improved understanding of the mechanisms of force propagation in oxDNA simulations and the appropriate methods for calculating internal forces in hand, we turn our attention to the more interesting case of the nanoscopic force clamp of Nickels et al. 17, described in the Introduction.
Their design solves many of the issues with traditional force spectroscopy apparatus like atomic force microscopes and laser optical tweezers, and is a powerful addition to the toolbox used to investigate mechanical processes in the cell. In particular, because it is instrument-free, many of the artefacts that plague single molecule force spectroscopy (SMFS) experiments – for example, convolution with long linker handles 65 – are not a concern. Additionally, the nanostructure is highly scalable, so single-molecule experiments can be carried out in parallel in large numbers; this can be contrasted with the fundamentally serial nature – and consequently poorer statistics – of other experimental SMFS strategies. Finally, the need for attachment to microscopes prevents traditional SMFS experiments from being performed in vivo, while no such limitation exists in theory for nanoscopic force clamps.
Nickels et al. used their force clamp to study the Holliday junction 66 and the tension-dependent binding of the TATA protein 17. The precise forces exerted on the systems of interest were calculated as follows:
-
•
the origami was assumed to be completely rigid;
-
•
the ssDNA was replaced with an exFJC polymer with end-to-end distance given by the designed gap size minus the average extension of the molecule of interest;
-
•
parameters for Kuhn length, contour length, and elastic modulus derived from previous experiments were plugged into the exFJC force-extension equation and combined with the end-to-end distance estimates to yield forces.
Three potential problems with this procedure, elements of which many DNA tension probe studies share 26, 20, 27, 35, 24, 23, 2, bear consideration. Firstly, while dsDNA is well-described by the WLC67, 68, 69, ssDNA behaviour is difficult to capture with simplified polymer models. Authors have used both WLC and exFJC to fit ssDNA in different regimes, dependent on ionic conditions and force 70, 71. At low ionic concentrations, electrostatic repulsion fosters increased rigidity of ssDNA, so the WLC model may be preferable to the exFJC, which works better at higher salt concentrations 70. Both models, however, neglect excluded volume and stacking interactions between ssDNA bases. Difficulties inherent in mapping ssDNA to a WLC or exFJC emerge when comparing elastic parameters obtained from experiments performed at zero force (where bases are free to stack) and force-pulling experiments (featuring higher forces at which stacking is less favourable) that feature a clear stacked unstacked transition 72, 71. A dependence of fit parameter on experimental regime is widespread in the literature 28, 73, 71, 74, but interestingly this has not been extensively acknowledged.
A second issue with force probe calibration using polymer models is the existence of sequence-dependent secondary structures in ssDNA, which reduce the effective contour length of ssDNA and elevate internal forces. One of the most widely-used sets of ssDNA elastic parameters is that derived by Smith et al. 28, who fitted force-extension curves of -DNA to the exFJC. These parameters represent an average over -DNA secondary structure and are thus not transferrable to different ssDNA sequences.
Finally, assumptions about the rigidity of the origami portion of the force clamp could introduce errors into the force estimates. DNA origami, of course, have some degree of flexibility 75, but the elastic mechanical properties have only been characterized for a limited number of rod-like origami.76, 77
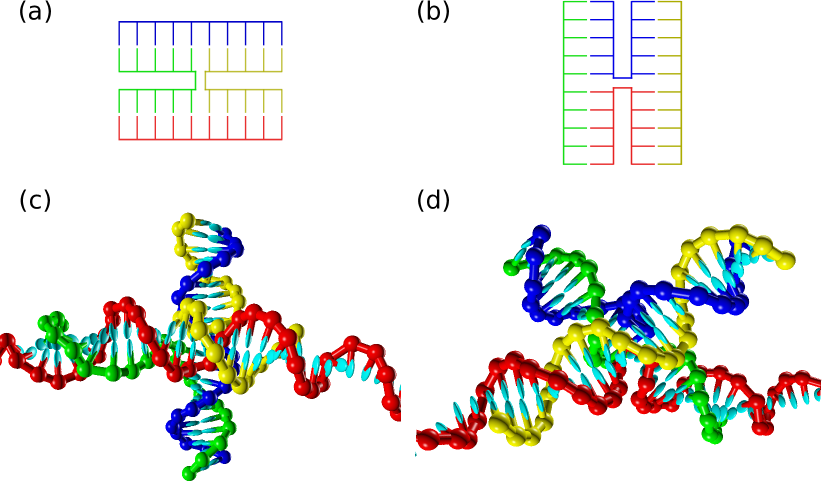
As mentioned, Nickels et al. 17 demonstrate the operation of their nanoscopic force clamp by studying the four-way Holliday junction 66(HJ), a fundamental component of DNA origami designs. HJs are comprised of 4 strands hydrogen-bonded to each other and arranged in an ‘X’ shape. In the presence of salt, the strands coaxially stack (i.e. bases belonging to two separate strands stack with one another) to adopt one of two possible isomeric conformations, illustrated in Figure 5. In Fig. 5(a) and (c), the green and yellow strands are coaxially stacked, and the blue and red strands are regularly stacked such that they are straight; the reverse is true in Fig. 5(b) and (d). The population ratio between the isomeric states can be altered via the application of external force; pulling on either end of the red strand in Fig. 5, for example, will favour the isomer in which the red strand is straight. Nickels et al. 17 refer to this more favourable isomeric state as ‘IsoII’, and the less favourable isomer, in which the tension-bearing strand is bent, as ‘IsoI’, drawing their nomenclature from the low (IsoI) and high (IsoII) FRET states for a particular geometry of donor/acceptor dyes on the chosen HJ sequence, following Hohng et al. 66. We adopt here the same convention.
To illustrate the force-dependence of the population ratios of IsoI and IsoII, Nickels et al. 17 construct three versions of the origami force clamp. The designs were named according to the forces the authors calculate the ssDNA springs to exert on the molecule of interest: 4.0 , 2.5 , and 1.2 . Values for these designed forces were derived from the exFJC model, Eq. 1, using the Kuhn length and stretch modulus parameters reported by Smith et al. 28; the number of nucleotides spanning the central gap in each design (160, 4.0 ; 226, 2.5 ; 422, 1.2 ) minus the 22 nucleotides corresponding to the HJ region; a contour length per base pair of 0.63 , derived from crystallographic experiments 78; and the designed central gap width of 42.84 – labelled in Fig. 1 – minus the average end-to-end extension of the HJ as the polymer end-to-end distance, . Notably, the magnesium ion concentration at which the force clamp experiments were performed – 100 [Mg2+] – represents much higher electrostatic screening than the salt concentration used in the experiments of Smith et al. 28, 150 [Na+], because Mg2+ has been estimated to have an effect that is 20-100 stronger than Na+ 79, 71, depending on the property that is being studied. High ionic strengths are often used in DNA origami experiments to facilitate origami assembly.
3.3.1 Simulation strategy
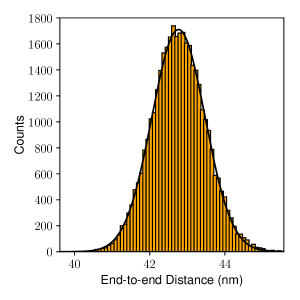
For our purposes of determining the internal forces in the single-stranded section of the origami force clamp, it was not necessary to simulate the full origami structure in the force-measurement simulations. Instead, we simulated only the ssDNA strand in the central gap of the force clamp and represented the constraints placed on the single strand by the origami with harmonic traps (where the stiffness and separation of the traps were extracted from simulations of the full origami), thus vastly improving the statistics we were able to collect in our available simulation time. To achieve this, we first performed an MD simulation of the origami force clamp with no connecting single strand, and monitored the end-to-end distance between scaffold nucleotides on either end of the clamp; the results are shown in Figure S2. The resulting distribution was fit to a Gaussian form:
| (2) |
to extract the mean and variance . Note that is approximately equal to the value used by Nickels et al. 17 based on simple geometrical arguments: 42.84 . The values for and can be reproduced by two 3-dimensional harmonic traps of stiffness and trap separation acting on the end nucleotides of the tension-bearing single strand (the approach used to obtain these values is detailed on pages 6-7 of the Supporting Information). We note that by only simulating the force-bearing strand, we are ignoring potential interactions between this section and the rest of the origami (aside from these 3D harmonic traps on its ends). These interactions will be predominantly due to the excluded volume, but given the design (e.g. the clearance above bridging section) we don’t expect their effects to be significant.
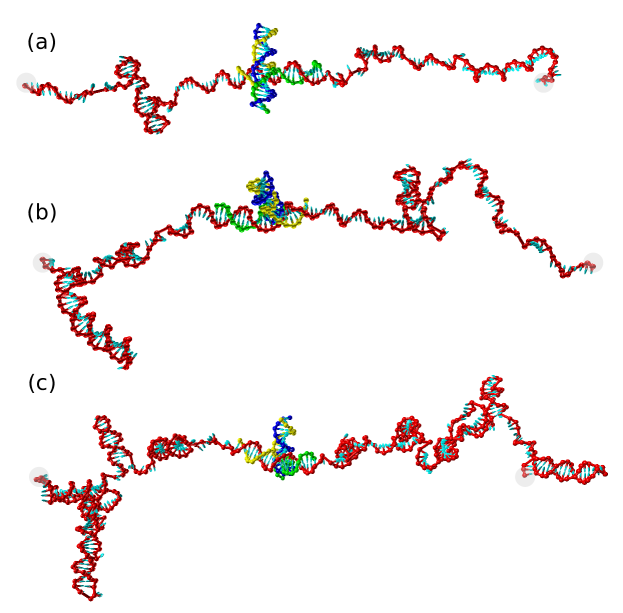
We performed MD simulations on the ssDNA + HJ system, with end nucleotides harmonically trapped, for the three different force designs of Nickels et al. 17; see Figure 6. Including the two trapped endpoint nucleotides, the main ssDNA strands comprised 162-nt, 228-nt, and 424-nt for the 4.0 , 2.5 , and 1.2 designs, respectively. Clearly, secondary structure is present for this ssDNA sequence, shortening the effective contour length of the ssDNA. We used the same temperature as Nickels et al. and a monovalent salt concentration of [Na+]=5 in order to mimic their high experimental [Mg2+] concentration. To explore the effect of origami compliance on the force in the structure (the exFJC model used by Nickels et al. 17 assumes fixed endpoints), we also performed simulations on the 4.0 system using harmonic trap stiffnesses an order of magnitude larger and smaller than . Finally, to explore the effect of salt concentration on the results, we performed additional simulations on the 4.0 system at [Na+]=0.15 , 0.5 , and 1.0 . In all instances, we simulated the strands both with secondary structure and without allowing secondary structure to form. Transitions between HJ IsoI and IsoII conformations are very rare on the timescale of our simulations222Over cumulative MD simulation steps (7 ), only 14 transitions were observed, and in each case, the HJ never reverted. This was reasonable given that the experimentally-observed transition times are on the order of tens of milliseconds. 17, so we were unable to probe the effect of force on transition frequency, but we simulated each isomer separately and report results for both.
It is important to ensure that our simulations are sampling all relevant secondary structure, a potentially difficult task given both the possibility of the system becoming trapped in local minima for long stretches of simulation time and the large number of potential different secondary structures. To gauge whether we had sampled secondary structure sufficiently, we split our simulation output for each system in half and tracked which bases formed hydrogen bonds throughout the simulations (see Supporting Figures S3-S5). The hydrogen-bonding pattern looked similar enough between the two simulation halves to give us confidence that our secondary structure sampling is sufficient in the present case; see pages 8-11 of the Supporting Information for details. An additional consideration is oxDNA’s inability to capture non-canonical base pairing, as mentioned in the Introduction. To explore this further, we ran our sequences through the Quadruplex forming G-Rich Sequences (QGRS) Mapper 80 to determine whether G quartets can form in our system. For the 162-nt and 228-nt designs, no G quartets are expected. For the 424-nt design, however, five G-quartet motifs (each with 2 stacked G tetrads) are theoretically possible. The consistency of the trends observed in our results across all three systems, detailed below, give us confidence that this limitation is not significant to our central results, however.
3.3.2 Results
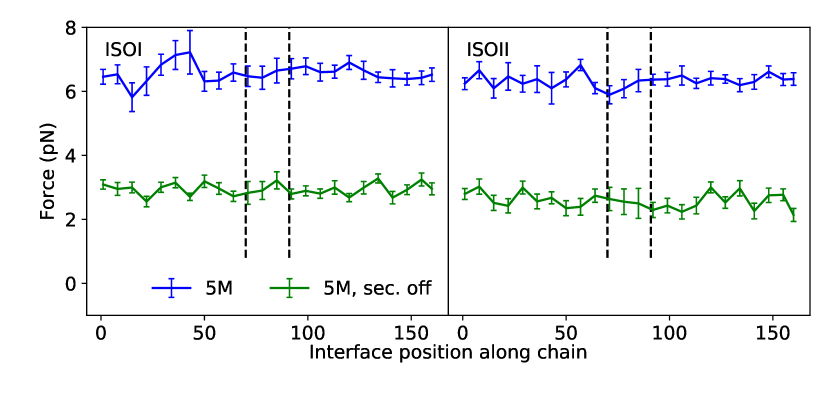
The full results of our simulations are reported in Supporting Table S1. Figure 7 shows some representative one-sided forces crossing several interfaces along the ssDNA strand for the 4.0 design, where the interfaces are located immediately topologically upstream of the nucleotides indicated in the abscissa. Larger errors likely correlate with regions with an enhanced tendency to form secondary structure, because of the larger magnitude of the (positive and negative) forces across the interfaces in those regions; this effect was observed in Fig. 4. Only the projection of the force onto the direction of the trap separation is shown; forces along the orthogonal directions average to zero, as expected.
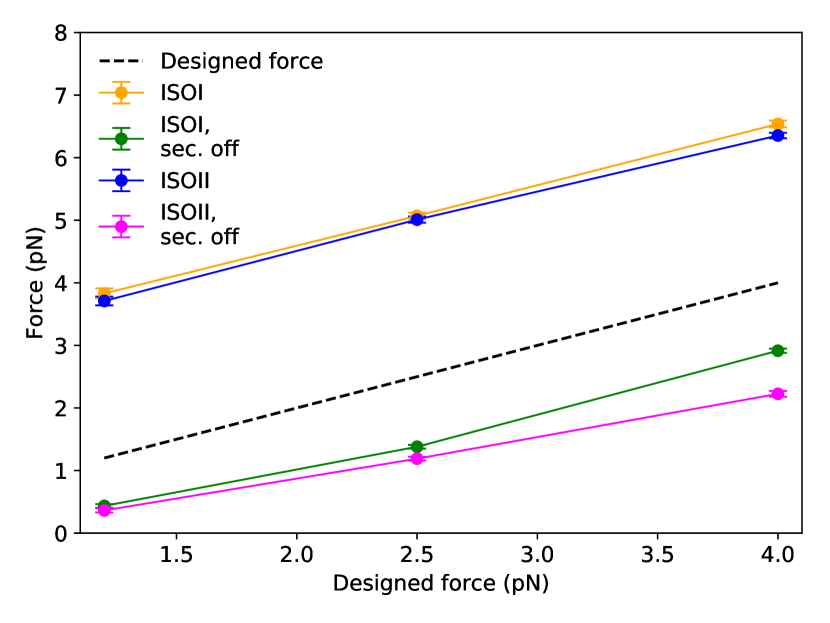
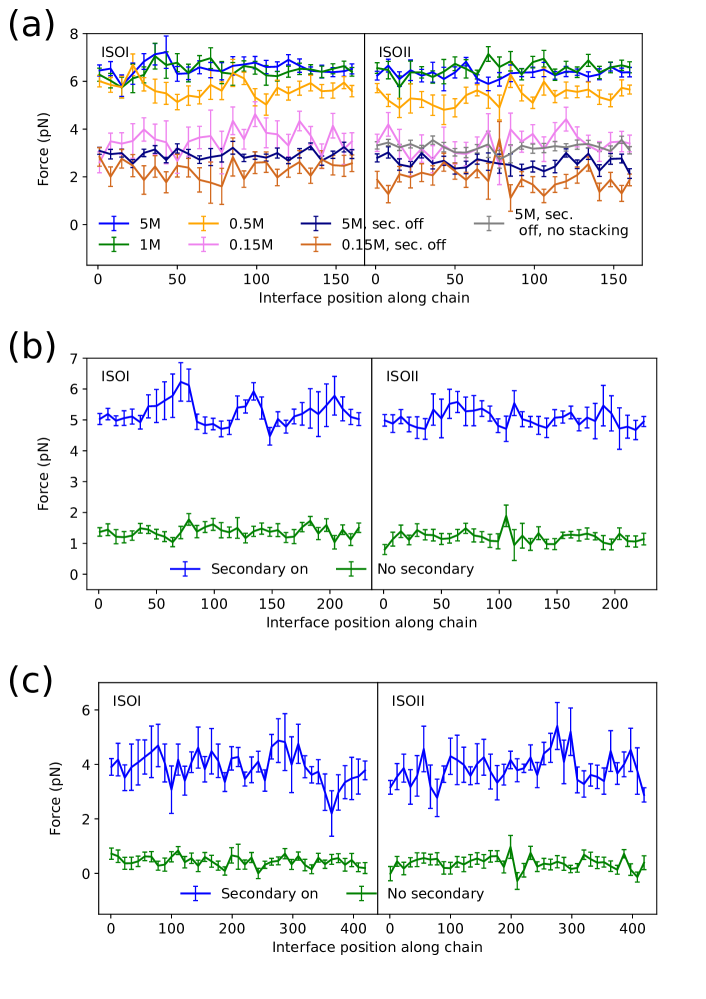
Figures 8-9 contain results for forces averaged over 24, 33, and 39 different interfaces distributed along the strand for the 4.0 2.5 , and 1.2 designs, respectively; error bars represent the standard error of a weighted mean. Immediately evident in Fig. 8 is the substantial discrepancy between the forces as measured in simulation (blue and yellow curves) and both the Smith et al. 28 exFJC force predictions (black dashed line; 2.5 average discrepancy) and the forces in the absence of secondary structure (3.6 average discrepancy). Here, just as in the case of the simple 160-nt poly-T strand, forces in the absence of secondary structure are lower than the exFJC estimates; as aforementioned, this can be understood by considering that the fits performed by Smith et al. 28 averaged over secondary structure inherent to -phage ssDNA.
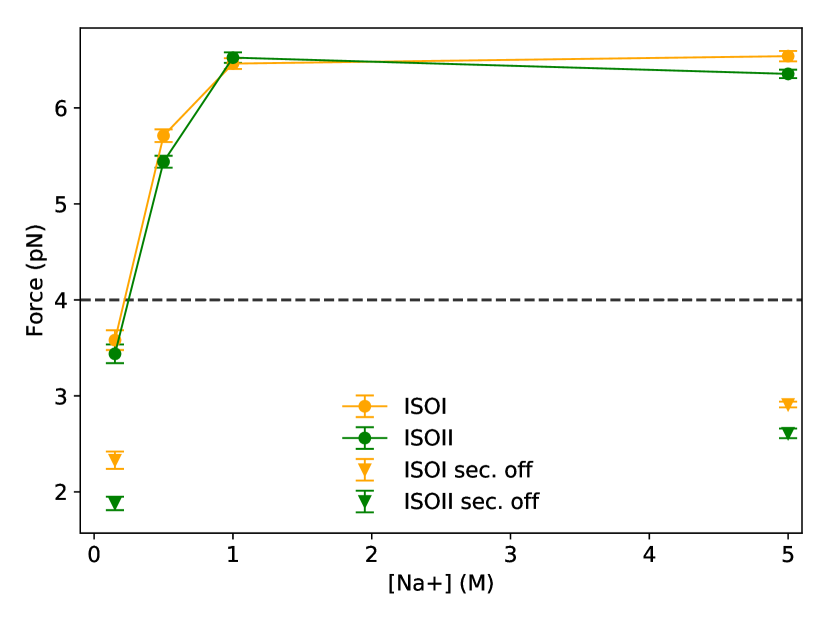
While it is clear that secondary structure has a significant effect on internal force, another key driver of the disparity between measured forces and exFJC predictions in this case may simply be the different salt concentrations under which the experiments of Smith et al. 28 and Nickels et al. 17 were performed. Figure 9 shows the average forces for the 4.0 design at four different salt concentrations; at the lowest of these, [Na+]=0.15 – equivalent to the concentration at which Smith et al. 28 performed their fits – the measured force is 3 lower than at the higher salt concentrations used by Nickels et al. 17, and much closer to the estimate of 4.0 obtained using Smith et al. 28’s parameters. Caution is clearly needed when translating ssDNA elastic fit results performed under different conditions. When secondary structure is suppressed, the difference in force between the highest and lowest ionic strengths is only 0.7 , underscoring secondary structure formation as the main driver of force variation with ion concentration. The remaining difference is attributable to the tendency of ssDNA to form more compact coils at higher salt concentration as increased screening reduces inter-phosphate repulsion 72.
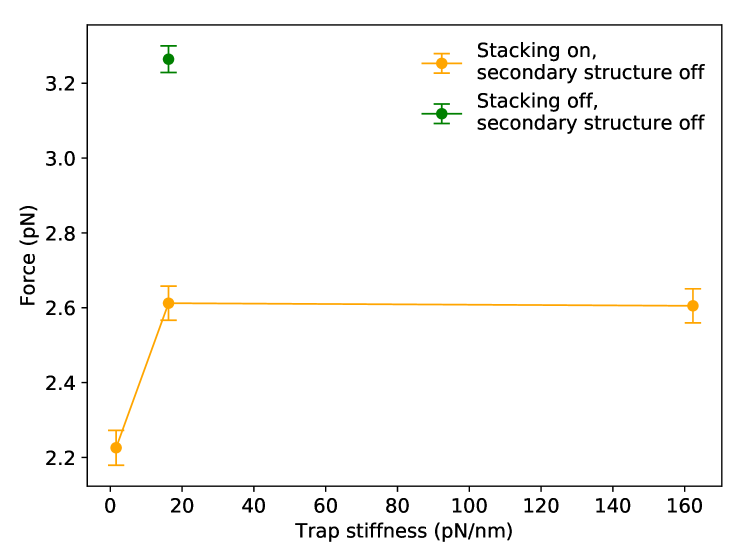
We also explored the effect of the compliance of the attachment points on internal ssDNA forces; see Figure S7 in the Supporting Information for full details. In summary, while decreasing the trap stiffness by an order of magnitude (from 16.32 to 1.632 ) decreases the force by about 0.2 , increasing the stiffness by an order of magnitude has no discernible effect. As oxDNA has been elsewhere shown to reproduce the elastic properties of DNA origami well 52, 81, we can conclude that for these designs the assumption of Nickels et al. 17 that the origami is rigid does not affect the force estimate.
As a final note, we point out that the difference in force between the two HJ isomers is in all cases rather small: 0.1-0.5 , with the IsoI conformation leading to higher (or the same within error) forces than IsoII, as expected. We do not expect to perfectly reproduce this difference, however, as the oxDNA model cannot fully capture the magnitude of the twist angle between the HJ arms 54.
4 Conclusion
We have demonstrated a method for calculating the internal forces in ssDNA to high statistical precision (0.05 ). While systematic errors intrinsic to the oxDNA coarse-grained model can be expected to affect the absolute accuracy of our force calculations, oxDNA has elsewhere captured the mechanical behaviour of ssDNA and dsDNA well 46, 82, 83, which gives us confidence that our predictions are much more realistic than those of simplified polymer model fits. Further, given the limited precision of experimental calibration methods (2-5 19, 25), we argue that oxDNA predictions supply a viable alternative – or at least complement – to these approaches. In addition to its utility in computing forces in ssDNA-based force sensors, force clamp devices, and tensegrity nanostructures, our method can be expanded to calculate forces in more complex structures, such as DNA minicircles 84, 85. Furthermore, the method is general enough to be adapted to calculate forces in alternative coarse-grained models, including for non-DNA polymers like proteins.
A few caveats should be noted. Firstly, the current work has assumed that origami structures were perfectly assembled – with all staples present and no topologically incorrect strand routings – despite the possibility of defects occurring experimentally which could compromise the effective stiffness of the origami or alter the length of the ssDNA spring. Furthermore, oxDNA has been parametrized to capture the [Na+] dependence of secondary structure thermodynamics. To describe experiments featuring [Mg2+], we relied on a mapping to an equivalent [Na+]. In the current work, this was not problematic, as experiments were carried out in a high-salt regime where the predicted force had reached its limiting value, but for lower [Mg2+], comparison of simulation and experiment may be less straightforward. Another consideration to bear in mind is the neglect of secondary structures involving non-canonical base pairs when calculating force averages. In systems where such motifs are expected to be relevant, deriving very accurate force estimates may necessitate the use of a coarse-grained model parameterized to treat non-Watson Crick base pairing. Lastly, it is possible that for high internal forces or low ionic strengths, the ssDNA tension may lead to non-elastic yielding events within origami designs. To capture such effects, the DNA origami would need to be simulated in its entirety.
Simulating precise experimental sequences under relevant conditions is crucial for obtaining accurate estimates of internal force, as using previously-obtained fit parameters with WLC and exFJC theoretical models can lead to incorrect estimates due to differences in secondary structure, stacking propensities, salt concentration, and stiffness of the endpoint traps, as well as fundamental deficiencies in the WLC and exFJC models, such as their neglect of excluded volume and base stacking. In particular, our results demonstrate that ignoring the difference between the experimental ionic solution conditions and those at which fit parameters were derived is a significant driver of errors in ssDNA force estimates for the nanoscopic force clamp of Nickels et al. 17. Future applications seeking to precisely determine internal forces of DNA, whether for the purposes of computationally modelling DNA elastic behaviour 86, 40 or for understanding biomechanical systems 2, would benefit from the force estimates provided by oxDNA or similar coarse-grained models.
MCE thanks the Rhodes Trust, the Natural Sciences and Engineering Research Council of Canada (NSERC), and Schmidt Science Fellows, in partnership with the Rhodes Trust, for financial support. We are grateful to the UK Materials and Molecular Modelling Hub for computational resources, which is partially funded by EPSRC (EP/P020194/1). Part of this work was performed using resources provided by the Cambridge Service for Data Driven Discovery (CSD3) operated by the University of Cambridge Research Computing Service (www.csd3.cam.ac.uk), provided by Dell EMC and Intel using Tier-2 funding from the Engineering and Physical Sciences Research Council (capital grant EP/P020259/1), and DiRAC funding from the Science and Technology Facilities Council (www.dirac.ac.uk). We are also grateful to Philipp Nickels and Tim Liedl for very helpful discussions.
-
•
full simulation details, including further information about the oxDNA thermostats and potentials;
-
•
complete derivations for procedures outlined in the main text;
-
•
details of the procedure to ensure adequate sampling over secondary structures;
-
•
complete, tabulated simulation results; and
-
•
additional figures highlighting simulated results.
References
- Alberts et al. 2008 Alberts, B.; Johnson, A.; Lewis, J.; Raff, M.; Roberts, K.; Walter, P. Molecular Biology of the Cell, 5th ed.; Garland Science, 2008
- Kramm et al. 2020 Kramm, K.; Schröder, T.; Gouge, J.; Vera, A. M.; Gupta, K.; Heiss, F. B.; Liedl, T.; Engel, C.; Berger, I.; Vannini, A.; Tinnefeld, P.; Grohmann, D. DNA Origami-Based Single-Molecule Force Spectroscopy Elucidates RNA Polymerase III Pre-Initiation Complex Stability. Nat Commun 2020, 11, 2828
- Uhler and Shivashankar 2017 Uhler, C.; Shivashankar, G. V. Regulation of Genome Organization and Gene Expression by Nuclear Mechanotransduction. Nat. Rev. Mol. Cell Biol. 2017, 18, 717–727
- Ingber 2006 Ingber, D. E. Cellular Mechanotransduction: Putting All the Pieces Together Again. FASEB J. 2006, 20, 811–827
- Árnadóttir and Chalfie 2010 Árnadóttir, J.; Chalfie, M. Eukaryotic Mechanosensitive Channels. Annu. Rev. Biophys. 2010, 39, 111–137
- Wang 2017 Wang, N. Review of Cellular Mechanotransduction. J. Phys. D: Appl. Phys. 2017, 50, 233002
- Bustamante et al. 2004 Bustamante, C.; Chemla, Y. R.; Forde, N. R.; Izhaky, D. Mechanical Processes in Biochemistry. Annu. Rev. Biochem. 2004, 73, 705–748
- Poh et al. 2014 Poh, Y.-C.; Chen, J.; Hong, Y.; Yi, H.; Zhang, S.; Chen, J.; Wu, D. C.; Wang, L.; Jia, Q.; Singh, R.; Yao, W.; Tan, Y.; Tajik, A.; Tanaka, T. S.; Wang, N. Generation of Organized Germ Layers from a Single Mouse Embryonic Stem Cell. Nat. Commun. 2014, 5, 4000
- Kim et al. 2009 Kim, S. T.; Takeuchi, K.; Sun, Z.-Y. J.; Touma, M.; Castro, C. E.; Fahmy, A.; Lang, M. J.; Wagner, G.; Reinherz, E. L. The T Cell Receptor Is an Anisotropic Mechanosensor. J. Biol. Chem. 2009, 284, 31028–31037
- Spillane and Tolar 2017 Spillane, K. M.; Tolar, P. B Cell Antigen Extraction Is Regulated by Physical Properties of Antigen-Presenting Cells. J. Cell Biol. 2017, 216, 217–230
- Levental et al. 2009 Levental, K. R.; Yu, H.; Kass, L.; Lakins, J. N.; Egeblad, M.; Erler, J. T.; Fong, S. F.; Csiszar, K.; Giaccia, A.; Weninger, W.; Yamauchi, M.; Gasser, D. L.; Weaver, V. M. Matrix Crosslinking Forces Tumor Progression by Enhancing Integrin Signaling. Cell 2009, 139, 891–906
- Seeman 1982 Seeman, N. C. Nucleic Acid Junctions and Lattices. J. Theor. Biol. 1982, 99, 237–247
- Seeman and Sleiman 2018 Seeman, N. C.; Sleiman, H. F. DNA Nanotechnology. Nat. Rev. Mater. 2018, 3, 17068
- Gu et al. 2010 Gu, H.; Yang, W.; Seeman, N. C. DNA Scissors Device Used to Measure MutS Binding to DNA Mis-Pairs. J. Am. Chem. Soc. 2010, 132, 4352–4357
- Cost et al. 2015 Cost, A.-L.; Ringer, P.; Chrostek-Grashoff, A.; Grashoff, C. How to Measure Molecular Forces in Cells: A Guide to Evaluating Genetically-Encoded FRET-Based Tension Sensors. Cel. Mol. Bioeng. 2015, 8, 96–105
- Blanchard and Salaita 2019 Blanchard, A. T.; Salaita, K. Emerging Uses of DNA Mechanical Devices. Science 2019, 365, 1080–1081
- Nickels et al. 2016 Nickels, P. C.; Wunsch, B.; Holzmeister, P.; Bae, W.; Kneer, L. M.; Grohmann, D.; Tinnefeld, P.; Liedl, T. Molecular Force Spectroscopy with a DNA Origami–Based Nanoscopic Force Clamp. Science 2016, 354, 305–307
- Thubagere et al. 2017 Thubagere, A. J.; Li, W.; Johnson, R. F.; Chen, Z.; Doroudi, S.; Lee, Y. L.; Izatt, G.; Wittman, S.; Srinivas, N.; Woods, D.; Winfree, E.; Qian, L. A Cargo-Sorting DNA Robot. Science 2017, 357, eaan6558
- Shroff et al. 2005 Shroff, H.; Reinhard, B. M.; Siu, M.; Agarwal, H.; Spakowitz, A.; Liphardt, J. Biocompatible Force Sensor with Optical Readout and Dimensions of 6 Nm3. Nano Lett. 2005, 5, 1509–1514
- Brockman et al. 2018 Brockman, J. M.; Blanchard, A. T.; Pui-Yan, V.; Derricotte, W. D.; Zhang, Y.; Fay, M. E.; Lam, W. A.; Evangelista, F. A.; Mattheyses, A. L.; Salaita, K. Mapping the 3D Orientation of Piconewton Integrin Traction Forces. Nat. Methods 2018, 15, 115–118
- Funke et al. 2016 Funke, J. J.; Ketterer, P.; Lieleg, C.; Schunter, S.; Korber, P.; Dietz, H. Uncovering the Forces between Nucleosomes Using DNA Origami. Sci. Adv. 2016, 2, e1600974
- Wang and Ha 2013 Wang, X.; Ha, T. Defining Single Molecular Forces Required to Activate Integrin and Notch Signaling. Science 2013, 340, 991–994
- Blakely et al. 2014 Blakely, B. L.; Dumelin, C. E.; Trappmann, B.; McGregor, L. M.; Choi, C. K.; Anthony, P. C.; Duesterberg, V. K.; Baker, B. M.; Block, S. M.; Liu, D. R.; Chen, C. S. A DNA-Based Molecular Probe for Optically Reporting Cellular Traction Forces. Nat. Methods 2014, 11, 1229–1232
- Zhang et al. 2014 Zhang, Y.; Ge, C.; Zhu, C.; Salaita, K. DNA-Based Digital Tension Probes Reveal Integrin Forces during Early Cell Adhesion. Nat. Commun. 2014, 5, 5167
- Dutta et al. 2018 Dutta, P. K.; Zhang, Y.; Blanchard, A. T.; Ge, C.; Rushdi, M.; Weiss, K.; Zhu, C.; Ke, Y.; Salaita, K. Programmable Multivalent DNA-Origami Tension Probes for Reporting Cellular Traction Forces. Nano Lett. 2018, 18, 4803–4811
- Liu et al. 2016 Liu, Y.; Blanchfield, L.; Ma, V. P.-Y.; Andargachew, R.; Galior, K.; Liu, Z.; Evavold, B.; Salaita, K. DNA-Based Nanoparticle Tension Sensors Reveal That T-Cell Receptors Transmit Defined pN Forces to Their Antigens for Enhanced Fidelity. Proc. Natl. Acad. Sci. U.S.A. 2016, 113, 5610–5615
- Ma et al. 2019 Ma, R.; Kellner, A. V.; Ma, V. P.-Y.; Su, H.; Deal, B. R.; Brockman, J. M.; Salaita, K. DNA Probes That Store Mechanical Information Reveal Transient Piconewton Forces Applied by T Cells. Proc. Natl. Acad. Sci. U.S.A. 2019, 116, 16949–16954
- Smith et al. 1995 Smith, S. B.; Cui, Y.; Bustamante, C. Overstretching B-DNA: The Elastic Response of Individual Double-Stranded and Single-Stranded DNA Molecules. Science 1995, 271, 795–799
- Camunas-Soler et al. 2016 Camunas-Soler, J.; Ribezzi-Crivellari, M.; Ritort, F. Elastic Properties of Nucleic Acids by Single-Molecule Force Spectroscopy. Annu. Rev. Biophys. 2016, 45, 65–84
- Zocchi 2009 Zocchi, G. Controlling Proteins Through Molecular Springs. Annu. Rev. Biophys. 2009, 38, 75–88
- Meng and Sachs 2011 Meng, F.; Sachs, F. Visualizing Dynamic Cytoplasmic Forces with a Compliance-Matched FRET Sensor. J. Cell Sci. 2011, 124, 261–269
- Goodman et al. 2005 Goodman, R. P.; Schaap, I. A. T.; Tardin, C. F.; Erben, C. M.; Berry, R. M.; Schmidt, C. F.; Turberfield, A. J. Rapid Chiral Assembly of Rigid DNA Building Blocks for Molecular Nanofabrication. Science 2005, 310, 1661–1665
- He et al. 2008 He, Y.; Ye, T.; Su, M.; Zhang, C.; Ribbe, A. E.; Jiang, W.; Mao, C. Hierarchical Self-Assembly of DNA into Symmetric Supramolecular Polyhedra. Nature 2008, 452, 198–201
- Rothemund 2006 Rothemund, P. W. K. Folding DNA to Create Nanoscale Shapes and Patterns. Nature 2006, 440, 297–302
- Liedl et al. 2010 Liedl, T.; Högberg, B.; Tytell, J.; Ingber, D. E.; Shih, W. M. Self-Assembly of Three-Dimensional Prestressed Tensegrity Structures from DNA. Nat. Nanotechnol. 2010, 5, 520–524
- Simmel et al. 2014 Simmel, S. S.; Nickels, P. C.; Liedl, T. Wireframe and Tensegrity DNA Nanostructures. Acc. Chem. Res. 2014, 47, 1691–1699
- Marras et al. 2015 Marras, A. E.; Zhou, L.; Su, H.-J.; Castro, C. E. Programmable Motion of DNA Origami Mechanisms. Proc. Natl. Acad. Sci. U.S.A. 2015, 112, 713–718
- Douglas et al. 2012 Douglas, S. M.; Bachelet, I.; Church, G. M. A Logic-Gated Nanorobot for Targeted Transport of Molecular Payloads. Science 2012, 335, 831–834
- Lo et al. 2010 Lo, P. K.; Karam, P.; Aldaye, F. A.; McLaughlin, C. K.; Hamblin, G. D.; Cosa, G.; Sleiman, H. F. Loading and Selective Release of Cargo in DNA Nanotubes with Longitudinal Variation. Nat. Chem. 2010, 2, 319–328
- Kim et al. 2012 Kim, D.-N.; Kilchherr, F.; Dietz, H.; Bathe, M. Quantitative Prediction of 3D Solution Shape and Flexibility of Nucleic Acid Nanostructures. Nucleic Acids Res. 2012, 40, 2862–2868
- Reshetnikov et al. 2018 Reshetnikov, R. V.; Stolyarova, A. V.; Zalevsky, A. O.; Panteleev, D. Y.; Pavlova, G. V.; Klinov, D. V.; Golovin, A. V.; Protopopova, A. D. A Coarse-Grained Model for DNA Origami. Nucleic Acids Res. 2018, 46, 1102–1112
- Evans and Ritchie 1997 Evans, E.; Ritchie, K. Dynamic Strength of Molecular Adhesion Bonds. Biophys. J. 1997, 72, 1541–1555
- Bullerjahn et al. 2014 Bullerjahn, J. T.; Sturm, S.; Kroy, K. Theory of Rapid Force Spectroscopy. Nat. Commun. 2014, 5, 4463
- Odijk 1995 Odijk, T. Stiff Chains and Filaments under Tension. Macromolecules 1995, 28, 7016–7018
- Rubinstein and Colby 2003 Rubinstein, M.; Colby, R. Polymer Physics; Oxford University Press, 2003
- Ouldridge et al. 2011 Ouldridge, T. E.; Louis, A. A.; Doye, J. P. K. Structural, Mechanical, and Thermodynamic Properties of a Coarse-Grained DNA Model. J. Chem. Phys. 2011, 134, 085101
- Šulc et al. 2012 Šulc, P.; Romano, F.; Ouldridge, T. E.; Rovigatti, L.; Doye, J. P. K.; Louis, A. A. Sequence-Dependent Thermodynamics of a Coarse-Grained DNA Model. J. Chem. Phys. 2012, 137, 135101
- Snodin et al. 2015 Snodin, B. E. K.; Randisi, F.; Mosayebi, M.; Šulc, P.; Schreck, J. S.; Romano, F.; Ouldridge, T. E.; Tsukanov, R.; Nir, E.; Louis, A. A.; Doye, J. P. K. Introducing Improved Structural Properties and Salt Dependence into a Coarse-Grained Model of DNA. J. Chem. Phys. 2015, 142, 234901
- Matek et al. 2015 Matek, C.; Šulc, P.; Randisi, F.; Doye, J. P. K.; Louis, A. A. Coarse-Grained Modelling of Supercoiled RNA. J. Chem. Phys. 2015, 143, 243122
- Skoruppa et al. 2018 Skoruppa, E.; Nomidis, S. K.; Marko, J. F.; Carlon, E. Bend-Induced Twist Waves and the Structure of Nucleosomal DNA. Phys. Rev. Lett. 2018, 121, 088101
- Romano et al. 2013 Romano, F.; Chakraborty, D.; Doye, J. P. K.; Ouldridge, T. E.; Louis, A. A. Coarse-Grained Simulations of DNA Overstretching. J. Chem. Phys. 2013, 138, 085101
- Sharma et al. 2017 Sharma, R.; Schreck, J. S.; Romano, F.; Louis, A. A.; Doye, J. P. K. Characterizing the Motion of Jointed DNA Nanostructures Using a Coarse-Grained Model. ACS Nano 2017, 11, 12426–12435
- Shi et al. 2017 Shi, Z.; Castro, C. E.; Arya, G. Conformational Dynamics of Mechanically Compliant DNA Nanostructures from Coarse-Grained Molecular Dynamics Simulations. ACS Nano 2017, 11, 4617–4630
- Snodin et al. 2019 Snodin, B. E. K.; Schreck, J. S.; Romano, F.; Louis, A. A.; Doye, J. P. K. Coarse-Grained Modelling of the Structural Properties of DNA Origami. Nucleic Acids Res. 2019, 47, 1585–1597
- Engel et al. 2018 Engel, M. C.; Smith, D. M.; Jobst, M. A.; Sajfutdinow, M.; Liedl, T.; Romano, F.; Rovigatti, L.; Louis, A. A.; Doye, J. P. K. Force-Induced Unravelling of DNA Origami. ACS Nano 2018, 12, 6734–6747
- Schreck et al. 2015 Schreck, J. S.; Ouldridge, T. E.; Romano, F.; Šulc, P.; Shaw, L. P.; Louis, A. A.; Doye, J. P. DNA Hairpins Destabilize Duplexes Primarily by Promoting Melting Rather than by Inhibiting Hybridization. Nucleic Acids Res. 2015, 43, 6181–6190
- Andersen 1980 Andersen, H. C. Molecular Dynamics Simulations at Constant Pressure and/or Temperature. J. Chem. Phys. 1980, 72, 2384–2393
- Russo et al. 2009 Russo, J.; Tartaglia, P.; Sciortino, F. Reversible Gels of Patchy Particles: Role of the Valence. J. Chem. Phys. 2009, 131, 014504
- Sulc 2014 Sulc, P. Coarse-Grained Modelling of Nucleic Acids. Ph.D. thesis, Oxford University, UK, 2014
- Frenkel and Smit 2002 Frenkel, D.; Smit, B. In Understanding Molecular Simulation (Second Edition), second edition ed.; Frenkel, D., Smit, B., Eds.; Academic Press: San Diego, 2002; pp 139–163
- Padding and Louis 2006 Padding, J. T.; Louis, A. A. Hydrodynamic Interactions and Brownian Forces in Colloidal Suspensions: Coarse-Graining over Time and Length Scales. Phys. Rev. E 2006, 74, 031402
- Snodin et al. 2016 Snodin, B. E. K.; Romano, F.; Rovigatti, L.; Ouldridge, T. E.; Louis, A. A.; Doye, J. P. K. Direct Simulation of the Self-Assembly of a Small DNA Origami. ACS Nano 2016, 10, 1724–1737
- Chen and Li 2007 Chen, P.; Li, C. M. Nanopore Unstacking of Single-Stranded DNA Helices. Small 2007, 3, 1204–1208
- Calladine 2004 Calladine, C. R., Ed. Understanding DNA the Molecule & How It Works., 3rd ed.; Elsevier Academic Press: Amsterdam ;, 2004
- Woodside and Block 2014 Woodside, M. T.; Block, S. M. Reconstructing Folding Energy Landscapes by Single-Molecule Force Spectroscopy. Annu. Rev. Biophys. 2014, 43, 19–39
- Hohng et al. 2007 Hohng, S.; Zhou, R.; Nahas, M. K.; Yu, J.; Schulten, K.; Lilley, D. M. J.; Ha, T. Fluorescence-Force Spectroscopy Maps Two-Dimensional Reaction Landscape of the Holliday Junction. Science 2007, 318, 279–283
- Marko and Siggia 1995 Marko, J. F.; Siggia, E. D. Stretching DNA. Macromolecules 1995, 28, 8759–877–
- Gross et al. 2011 Gross, P.; Laurens, N.; Oddershede, L. B.; Bockelmann, U.; Peterman, E. J. G.; Wuite, G. J. L. Quantifying How DNA Stretches, Melts and Changes Twist under Tension. Nat. Phys. 2011, 7, 731–736
- Nomidis et al. 2017 Nomidis, S. K.; Kriegel, F.; Vanderlinden, W.; Lipfert, J.; Carlon, E. Twist-Bend Coupling and the Torsional Response of Double-Stranded DNA. Phys. Rev. Lett. 2017, 118, 217801
- Huguet et al. 2010 Huguet, J. M.; Bizarro, C. V.; Forns, N.; Smith, S. B.; Bustamante, C.; Ritort, F. Single-Molecule Derivation of Salt Dependent Base-Pair Free Energies in DNA. Proc. Natl. Acad. Sci. U.S.A. 2010, 107, 15431–15436
- Bosco et al. 2014 Bosco, A.; Camunas-Soler, J.; Ritort, F. Elastic Properties and Secondary Structure Formation of Single-Stranded DNA at Monovalent and Divalent Salt Conditions. Nucleic Acids Res. 2014, 42, 2064–2074
- McIntosh et al. 2014 McIntosh, D. B.; Duggan, G.; Gouil, Q.; Saleh, O. A. Sequence-Dependent Elasticity and Electrostatics of Single-Stranded DNA: Signatures of Base-Stacking. Biophys. J. 2014, 106, 659–666
- Laurence et al. 2005 Laurence, T. A.; Kong, X.; Jager, M.; Weiss, S. Probing Structural Heterogeneities and Fluctuations of Nucleic Acids and Denatured Proteins. Proc. Natl. Acad. Sci. U.S.A. 2005, 102, 17348–17353
- Jacobson et al. 2017 Jacobson, D. R.; McIntosh, D. B.; Stevens, M. J.; Rubinstein, M.; Saleh, O. A. Single-Stranded Nucleic Acid Elasticity Arises from Internal Electrostatic Tension. Proc. Natl. Acad. Sci. U.S.A. 2017, 114, 5095–5100
- Lei et al. 2018 Lei, D.; Marras, A. E.; Liu, J.; Huang, C.-M.; Zhou, L.; Castro, C. E.; Su, H.-J.; Ren, G. Three-Dimensional Structural Dynamics of DNA Origami Bennett Linkages Using Individual-Particle Electron Tomography. Nat. Commun. 2018, 9, 592
- Kauert et al. 2011 Kauert, D. J.; Kurth, T.; Liedl, T.; Seidel, R. Direct Mechanical Measurements Reveal the Material Properties of Three-Dimensional DNA Origami. Nano Lett. 2011, 11, 5558–5563
- Pfitzner et al. 2013 Pfitzner, E.; Wachauf, C.; Kilchherr, F.; Pelz, B.; Shih, W. M.; Rief, M.; Dietz, H. Rigid DNA Beams for High-Resolution Single-Molecule Mechanics. Angew. Chem. Int. Ed. 2013, 52, 7766–7771
- Murphy et al. 2004 Murphy, M.; Rasnik, I.; Cheng, W.; Lohman, T. M.; Ha, T. Probing Single-Stranded DNA Conformational Flexibility Using Fluorescence Spectroscopy. Biophys. J. 2004, 86, 2530–2537
- Martin and Dietz 2012 Martin, T. G.; Dietz, H. Magnesium-Free Self-Assembly of Multi-Layer DNA Objects. Nat. Commun. 2012, 3, 1103
- Kikin et al. 2006 Kikin, O.; D’Antonio, L.; Bagga, P. S. QGRS Mapper: A Web-Based Server for Predicting G-Quadruplexes in Nucleotide Sequences. Nucleic Acids Res. 2006, 34, W676–W682
- Tortora et al. 2020 Tortora, M. M. C.; Mishra, G.; Presern, D.; Doye, J. P. K. Chiral Shape Fluctuations and the Origin of Chirality in Cholesteric Phases of DNA Origamis. Sci. Adv. 2020, 6, eaaw8331
- Mosayebi et al. 2015 Mosayebi, M.; Louis, A. A.; Doye, J. P. K.; Ouldridge, T. E. Force-Induced Rupture of a DNA Duplex: From Fundamentals to Force Sensors. ACS Nano 2015, 9, 11993–12003
- Nomidis et al. 2019 Nomidis, S. K.; Skoruppa, E.; Carlon, E.; Marko, J. F. Twist-Bend Coupling and the Statistical Mechanics of the Twistable Wormlike-Chain Model of DNA: Perturbation Theory and Beyond. Phys. Rev. E 2019, 99, 032414
- Sutthibutpong et al. 2016 Sutthibutpong, T.; Matek, C.; Benham, C.; Slade, G. G.; Noy, A.; Laughton, C.; Doye, J. P. K.; Louis, A. A.; Harris, S. A. Long-Range Correlations in the Mechanics of Small DNA Circles under Topological Stress Revealed by Multi-Scale Simulation. Nucleic Acids Res. 2016, 9121–9130
- Joffroy et al. 2018 Joffroy, B.; Uca, Y. O.; Prešern, D.; Doye, J. P. K.; Schmidt, T. L. Rolling Circle Amplification Shows a Sinusoidal Template Length-Dependent Amplification Bias. Nucleic Acids Res. 2018, 46, 538–545
- Castro et al. 2011 Castro, C. E.; Kilchherr, F.; Kim, D.-N.; Shiao, E. L.; Wauer, T.; Wortmann, P.; Bathe, M.; Dietz, H. A Primer to Scaffolded DNA Origami. Nat. Methods 2011, 8, 221–229
Supporting Information
S1 Additional Simulation Details
The 160-nucleotide poly-T strands were simulated at 21 and [Na+]=10 , and their endpoints were held in 285 3D harmonic traps whose centres were 41.9 apart. For all simulations, the oxDNA parameters shown in Table S1 were used.
| Parameter | Value |
|---|---|
| newtonian_steps | 103 |
| diff_coef | 2.50 |
| thermostat | john |
| dt | 0.005 |
| verlet_skin | 0.2 |
| use_edge | false |
S1.1 Langevin thermostat
oxDNA provides the option of using a Langevin thermostat, which mimics coupling to a thermal bath through the addition of a frictional damping term and a random forcing term to Newton’s equations of motion 1. The strength of the random forces is related to the magnitude of the frictional damping through the ‘fluctuation-dissipation relation’, which guarantees evolution in the canonical NVT ensemble 1. Because oxDNA simulations are somewhat slower when the Langevin, rather than Andersen-like, thermostat is used, it makes only a brief appearance in the main text.
S1.2 Derivation of FENE force distribution
The expected force probability distribution for a polymer chain with only backbone interactions implemented can be derived by considering the finitely extensible nonlinear elastic (FENE) potential in oxDNA, which is given by
| (S1) |
where (0.21 nm); kBT* with T* a reduced temperature, 3000K; and (0.644 nm) for oxDNA 2.0 3 in its internal unit system. This potential is shown in Figure S1. The probability of finding bases separated by is
| (S2) |
and the free energy, , as a function of is
| (S3) |
The force experienced by nucleotides separated by distance is
| (S4) |
and is directed along the backbone. If we let , the probability density function for observing a force , , can be found by noting , or , where is given by equation S2 and is found by inverting equation S4:
| (S5) |
Only the solution featuring the negative square root is bounded. Therefore,
| (S6) |
From equation S5,
| (S7) |
While keeping track of force components , , (and thus force magnitude, ) is straightforward in oxDNA, the vector direction is not as easily accessible, and indeed will be different for all nucleotides along the chain. Therefore, for simplicity, instead of working with (where is defined by ), we derive , the probability distribution for a single component of the force. To do so, we note that for a random variable defined as the product of two other random variables, , the probability density distributions of each of the three variables are related thus 2:
| (S8) |
Since , we can use equation S8 with , , and to obtain
| (S9) |
We assume for simplicity that the instantaneous force vector is equally likely to point in all directions; namely, we assume . In this isotropic case, , and the probability density distribution for is given by
| (S10) |
Now, we adjust the integration limits of Eq. S9 to reflect the fact that by definition:
S1.3 Stacking potential
To discover why the stacking interaction broadens the force distributions in Fig. 3(c) in the main text, we can make a simple argument based on the form of the stacking potential in oxDNA.
For simplicity, we consider only the radial part of the stacking potential:
| (S12) |
where , , , and for oxDNA 2.0 3 in its internal unit system.
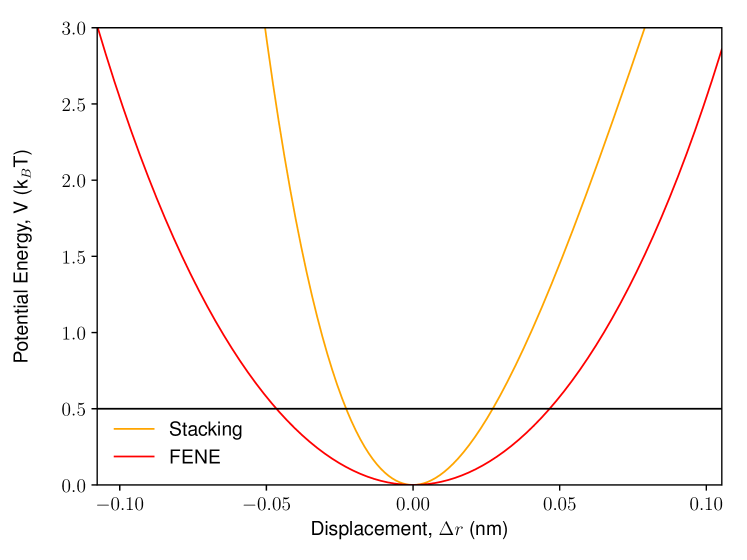
Figure S1 shows this potential alongside the radial part of the FENE potential, with the minima of the potentials shifted to the origin. The black line indicates the thermal energy that the system is expected to possess in equilibrium according to equipartition, i.e. , at T=21 . We can evaluate the force, , at the intersection of each potential with the thermal energy, which occurs at radial displacements from equilibrium of and for the FENE and stacking potentials, respectively. pN and pN for these displacements, which, after taking into account that only one component of the force is plotted in Fig. 3(c) of the main text, match the observed distribution widths well. We can thus confidently attribute the form of the observed force distributions to the oxDNA potentials, and the substantial force distribution width associated with stacking interactions to the steepness – and thus, large instantaneous forces – of the stacking potential.
S1.4 Calculation of effective trap stiffness
Consider two nucleotides separated along the axis – the long axis of the force clamp – by . We assume each nucleotide moves in an isotropic 3D harmonic potential for simplicity, such that the Boltzmann probability of observing position for nucleotide 1, positioned at the origin, is
| (S13) |
and for nucleotide 2 is
| (S14) |
where is the inverse thermal energy and is the stiffness of each trap. The distance between the two nucleotides is , so the mean and values are given by (where ):
| (S15) |
| (S16) |
where the joint probability distribution is simply the product
since the variables are independent. Equations S15 and S16 give the mean and variance () of the distribution, and can be numerically integrated with different values of until the observed parameters are obtained. Doing so yields an effective trap stiffness of and separation of . These values are only slightly different from the results obtained by neglecting position fluctuations in and altogether, assuming , and taking the variance of to be the sum , with the individual variances equal and determined using the equipartition theorem. Under these assumptions, and . For origami geometries with smaller ratios, however, this more accurate method for calculating effective stiffness may prove necessary.
S2 Additional Results
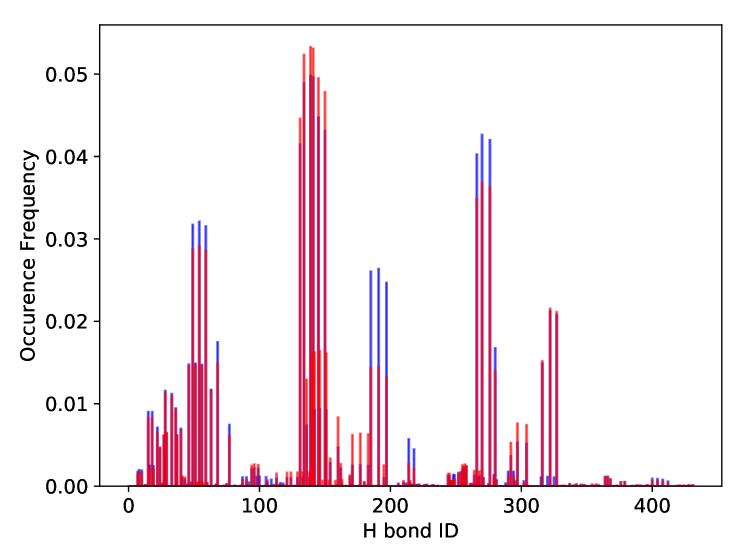
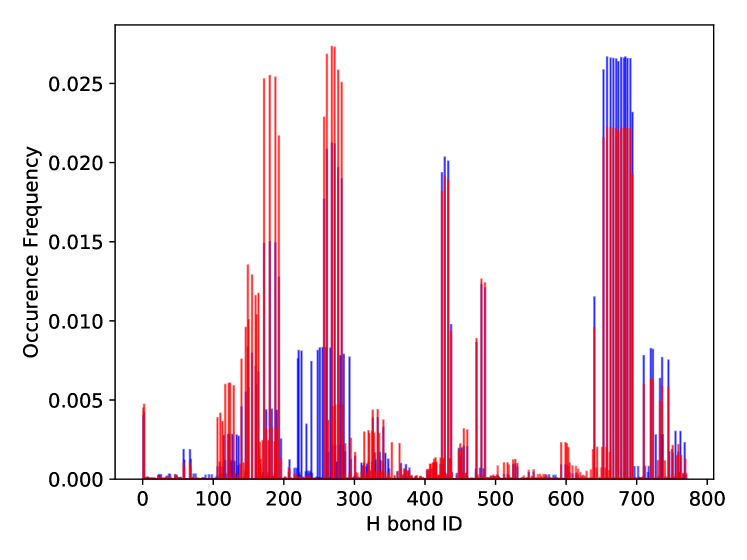
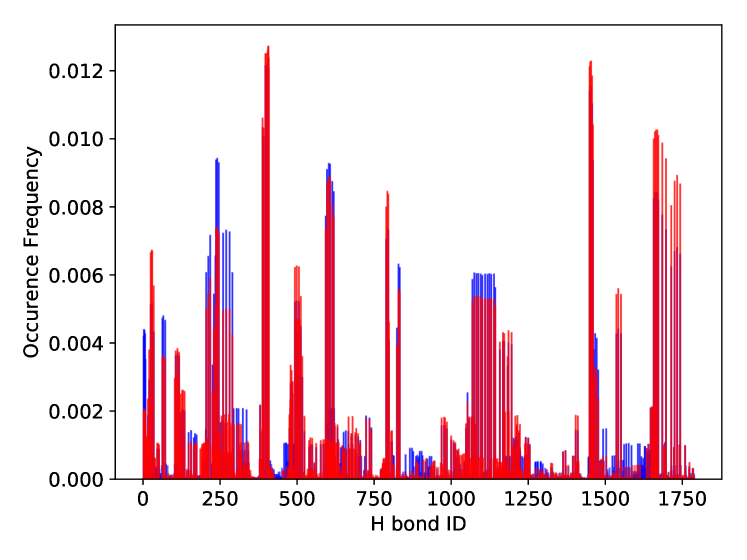
As explained in the main text, it is important to ensure that our simulations are sampling all relevant secondary structures. To gauge whether we had sampled secondary structures sufficiently, we split our simulation output for each system in half and computed histograms of which bases formed hydrogen bonds throughout the simulation, shown in Figures S3-S5 for all three designed forces. Only IsoII results at the highest salt concentration simulated, 5 [Na+], are pictured, as secondary structures become less favourable at lower ionic strengths due to electrostatic repulsion and secondary structure sampling is therefore most difficult at high salt. Though well over 10 000 possible pairs of bases exist for these strands, the figures show only those hydrogen bonds which were actually observed and assigns a numeric ID to each unique bond. The amount of overlap between blue and red histograms is taken as a proxy of how well secondary structures were sampled. For the 4.0 design, the main patterns of secondary structures visited are the same for both histograms, and we conclude that 1 MD steps ( 24 replicas) is an appropriate simulation length for this system. We expect equilibration over secondary structures to be easier at higher internal forces, since force helps to destabilize secondary structures. Indeed, the histogram overlap is less for the larger 2.5 and 1.2 designs, and more different pairs of bases are seen to interact via hydrogen bonding as the designed force decreases (there are also combinatorially more possibilities for the longer strands). The results reported for these low-force systems should be treated correspondingly more cautiously. While the accuracy of the results can be improved with longer simulations, we observed the same qualitative trends for all three force designs, and thus have confidence in the results even for the 2.5 and 1.2 systems.
The complete results for all systems simulated can be found in Table S2. Figure S6 contains the forces measured at various interfaces along the strand containing the Holliday junction at different salt concentrations, for all three force designs, and with and without secondary structures permitted. The results of simulations of the 4.0pN design with different harmonic trap stiffnesses are summarised in Figure S7; above , the stiffness doesn’t appreciably affect the force, so the assumption of fixed endpoints is reasonable. However, for other origami structures, the compliance may be relevant.
| Design | Isomer |
|
|
|
|
|
|
||||||||||||||
| 4.0 | IsoI | On | 16.32 | 5 |
|
85 | 6.540.05 | ||||||||||||||
| 1 | 113 | 6.460.06 | |||||||||||||||||||
| 0.5 | 96 | 5.710.07 | |||||||||||||||||||
| 0.15 |
|
102 | 3.60.1 | ||||||||||||||||||
| Off | 16.32 | 5 | 104 | 2.910.03 | |||||||||||||||||
| 0.15 |
|
103 | 2.330.09 | ||||||||||||||||||
| IsoII | On | 16.32 | 5 | 113 | 6.350.04 | ||||||||||||||||
| 1 | 113 | 6.520.05 | |||||||||||||||||||
| 0.5 | 96 | 5.430.06 | |||||||||||||||||||
| 0.15 | 130 | 3.40.1 | |||||||||||||||||||
| Off | 1.632 | 5 | 64 | 2.230.05 | |||||||||||||||||
| 16.32 | 5 | 64 | 2.610.05 | ||||||||||||||||||
| 0.15 | 131 | 1.880.07 | |||||||||||||||||||
| 163.2 | 5 | 64 | 2.610.05 | ||||||||||||||||||
| Off, no stacking | 16.32 | 5 | 59 | 3.260.04 | |||||||||||||||||
| 2.5 | IsoI | On | 16.32 | 5 | 148 | 5.070.05 | |||||||||||||||
| Off | 16.32 | 5 |
|
131 | 1.380.03 | ||||||||||||||||
| IsoII | On | 16.32 | 5 | 169 | 5.010.05 | ||||||||||||||||
| Off | 16.32 | 5 |
|
131 | 1.190.03 | ||||||||||||||||
| 1.2 | IsoI | On | 16.32 | 5 | 180 | 3.830.08 | |||||||||||||||
| Off | 16.32 | 5 |
|
155 | 0.430.03 | ||||||||||||||||
| IsoII | On | 16.32 | 5 | 180 | 3.710.07 | ||||||||||||||||
| Off | 16.32 | 5 | 40 | 0.360.03 |
References
- Allen and Tildesley 2017 Allen, M.; Tildesley, D. Computer Simulation of Liquids; OUP Oxford, 2017
- Rohatgi 1976 Rohatgi, V. An Introduction to Probability Theory and Mathematical Statistics; Wiley Series in Probability and Mathematical Statistics; Wiley, 1976
- Snodin et al. 2015 Snodin, B. E. K.; Randisi, F.; Mosayebi, M.; Šulc, P.; Schreck, J. S.; Romano, F.; Ouldridge, T. E.; Tsukanov, R.; Nir, E.; Louis, A. A.; Doye, J. P. K. Introducing Improved Structural Properties and Salt Dependence into a Coarse-Grained Model of DNA. J. Chem. Phys. 2015, 142, 234901
- Nickels et al. 2016 Nickels, P. C.; Wunsch, B.; Holzmeister, P.; Bae, W.; Kneer, L. M.; Grohmann, D.; Tinnefeld, P.; Liedl, T. Molecular Force Spectroscopy with a DNA Origami–Based Nanoscopic Force Clamp. Science 2016, 354, 305–307