Klein-Nishina effect and the cosmic ray electron spectrum
Abstract
Radiative energy losses are very important in regulating the cosmic ray electron and/or positron (CRE) spectrum during their propagation in the Milky Way. Particularly, the Klein-Nishina (KN) effect of the inverse Compton scattering (ICS) results in less efficient energy losses of high-energy electrons, which is expected to leave imprints on the propagated electron spectrum. It has been proposed that the hardening of CRE spectra around 50 GeV observed by Fermi-LAT, AMS-02, and DAMPE could be due to the KN effect. We show in this work that the transition from the Thomson regime to the KN regime of the ICS is actually quite smooth compared with the approximate treatment adopted in some previous works. As a result, the observed spectral hardening of CREs cannot be explained by the KN effect. It means that an additional hardening of the primary electrons spectrum is needed. We also provide a parameterized form for the accurate calculation of the ICS energy-loss rate in a wide energy range.
Introduction.—Precise measurements of the energy spectra of cosmic ray electrons and/or positrons (CREs) have achieved big progresses in recent years Chang et al. (2008); Aharonian et al. (2008); Abdo et al. (2009); Adriani et al. (2011); Aguilar et al. (2014); Ambrosi et al. (2017); Adriani et al. (2017); Abdollahi et al. (2017); Aguilar et al. (2019a, b), which are very important in probing the origin and propagation of CREs, as well as new physics such as the annihilation of dark matter. Several features have been revealed in the energy spectra of CREs, including a softening around several GeV Adriani et al. (2011); Aguilar et al. (2014), a hardening at GeV, and a softening again at TeV Aharonian et al. (2008); Ambrosi et al. (2017). These features have interesting and important implications on the origin of CREs. Together with the positron excesses Adriani et al. (2009); Aguilar et al. (2013), a three-component scenario of electrons and positrons is generally established, which includes the primary electrons accelerated by CR sources such as supernova remnants (SNRs), the secondary electrons and positrons produced by the inelastic collisions between CR nuclei and the interstellar medium, and the additional electrons and positrons accounting for the high-energy excesses (see e.g., Yuan and Feng (2018)).
One prominent effect of the CRE propagation in the Milky Way is the radiative energy losses. The synchrotron and inverse Compton scattering (ICS) losses are dominant for CREs with energies GeV Atoyan et al. (1995); Strong and Moskalenko (1998), which result in an energy-loss rate with . However, the form for the ICS process is only valid in the Thomson regime, when , where is the energy of the target photon, is the mass of electron, and is the speed of light. At higher energies (either the CRE or the target photon has a high enough energy), the ICS cross section takes the full Klein-Nishina (KN) form, which gets suppressed compared with the Thomson cross section, resulting in a smaller energy-loss rate. The KN effect is expected to be important even for CREs below TeV energies, from the scattering with the ultraviolet(UV)-optical and infrared components of the interstellar radiation field (ISRF). The reduction of the ICS loss rate is expected to give higher equilibrium CRE fluxes, leaving more complex features on the CRE spectrum than the case of Thomson approximation Blumenthal and Gould (1970).
Recently, Ref. Evoli et al. (2020a) argued that the GeV hardening of the CRE spectrum can be fully explained with the KN effect. However, the KN correction of the ICS loss adopted in Ref. Evoli et al. (2020a) is a simple analytical approximation Schlickeiser and Ruppel (2010), which is not accurate enough to correctly describe fine structures of the CRE spectrum. Here we will show that considering the exact form of the KN cross section of the ICS, the transition from the Thomson regime to the KN regime is much smoother than the analytical approach of Ref. Schlickeiser and Ruppel (2010). Taking the realistic ISRF distribution in the Milky Way into account, we will show that the observed spectral break of the CRE spectrum at GeV by Fermi-LAT, AMS-02, and DAMPE should not be explained by the KN loss effect. Therefore, to properly account for the observed spectral feature, a hardening of the primary electron spectrum is still necessary Yuan and Bi (2013); Cholis and Hooper (2013); Lin et al. (2015); Li et al. (2015).
Energy-loss rate of ICS.—Due to the efficient radiative energy losses, high energy CREs can only travel a short distance in the Milky Way. Typically for CREs above GeV, the energy-loss effect dominates over the escape effect and becomes essential for determining the spectral shape of the propagated CREs. The synchrotron radiation and ICS dominate the energy losses of high-energy CREs. If both the accelerated electron spectrum and the energy dependence of the energy-loss rate have power-law forms and the CRE sources are homogeneously distributed at an infinite thin disk, the propagated primary electron spectrum should also be a power-law in high energy Kobayashi et al. (2004); Delahaye et al. (2010). However, for the ICS, the KN suppression of the cross section leads to correction of the conventional form of the energy-loss rate in the Thomson limit. As a result, the propagated CRE spectrum should deviate from a simple power-law, as has been studied in many works Kobayashi et al. (2004); Stawarz et al. (2010); Schlickeiser and Ruppel (2010); Delahaye et al. (2010); Blies and Schlickeiser (2012); Evoli et al. (2020a).
Using the Lorentz factor as variable, the ICS energy-loss rate of a single electron with energy can be written as Schlickeiser and Ruppel (2010)
| (1) |
where is the Thomson cross section, is the energy of the target photon, is the differential number density of an isotropic photon field, , and
| (2) |
which is derived from the exact KN formula Jones (1968); Blumenthal and Gould (1970).
For electrons propagating in the Milky Way, the target photon field includes the ISRF and the cosmic microwave background (CMB). We adopt the ISRF averaged over 2 kpc around the Sun as a benchmark Delahaye et al. (2010), which consists of five gray-body components, with temperatures of 23209.0 K, 6150.4 K, 3249.3 K, 313.3 K, 33.1 K, and energy densities of 0.12 eV cm-3, 0.23 eV cm-3, 0.37 eV cm-3, 0.055 eV cm-3, 0.25 eV cm-3, respectively. The temperature and energy density of the CMB are 2.725 K and 0.26 eV cm-3 Fixsen (2009).
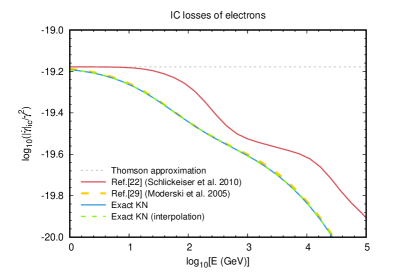
We show the exact ICS loss rate from a numerical integration of Eq. (1) in Fig. 1 with blue solid line. Compared with the result computed in the Thomson limit, the KN effect appears for GeV. We also compare the ICS loss rate obtained with the approximated KN correction given in Ref. Schlickeiser and Ruppel (2010). It is shown that there is remarkable difference of the approximation from the numerical computation. Particularly, the numerical result shows less prominent features due to the KN scattering off different ISRF components. The transition from the Thomson regime to the extreme KN regime is actually broader and shallower than the approximation.
Eq. (1) needs a two-dimensional numerical integration, and is inconvenient for general-purpose use. We therefore try to find a proper parameterized approximation of the exact result. For a gray-body photon field with temperature and energy density , Eq. (1) can be rewritten as
| (3) |
where
| (4) | ||||
with being the Boltzmann constant. Setting , we can easily find that the integral Eq. (4) depends only on the variable . It means that for a gray-body photon field, there is a degeneracy between and for the computation of the ICS loss rate. It is evident that corresponds to the Thomson regime, while corresponds to the extreme KN regime. We find that for and , can be approximated by the analytical formulae in the Thomson and the KN limits within an accuracy of 1%. In the intermediate regime, we use a six-order polynomial function in the log-log space to describe . Then we obtain the expression of in the whole range as
| (5) |
The coefficients of the polynomial function are listed in Table 1. This approach ensures an accuracy of in the whole energy range. The ICS loss rate calculated with Eq. (5) is also shown in Fig. 1, which is well consistent with the numerical calculation.
The approximated KN correction provided by Ref. Moderski et al. (2005) also yields an accurate ICS loss rate (yellow dashed line in Fig. 1). However, numerical integration over the background photon energy is still needed in that approach.
Impact on the electron spectrum.—Before calculating the CRE spectrum, we discuss the energy dependency of the energy-loss rate by defining
| (6) |
We would like to highlight that this quantity directly reflects the impact on the CRE spectrum due to the radiative losses: The decrease of corresponds to hardening of the CRE spectrum and vice versa. The total energy-loss rate for high-energy CREs is , where is the synchrotron loss rate:
| (7) |
We take G as a benchmark interstellar magnetic field strength. The proportion of the synchrotron component in the energy-loss term may also affect the spectral features of CREs, as pointed out in Ref. Agaronyan and Ambartsumyan (1985). However, given the typical magnetic field strength of the Milky Way, the synchrotron loss may only be important at much higher energies (for example, TeV).
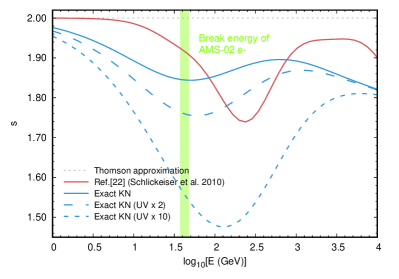
Fig. 2 shows the quantity calculated using the exact KN correction (blue solid line) and the approximated approach given in Refs. Schlickeiser and Ruppel (2010) (red solid line). It can be seen that the approximated approach gives significantly different features. The latest measurement of the electron spectrum by AMS-02 indicates a spectral hardening at GeV Aguilar et al. (2019b). It has been proposed that this hardening feature can be explained as the decrease of the ICS loss rate due to the KN effect on the UV backgrounds Evoli et al. (2020a). The reason should be ascribed to the use of the approximation given by Ref. Schlickeiser and Ruppel (2010). Under this approximation, has a sharp drop at GeV, which coincidentally results in a good accommodation to the CRE spectral feature. However, as indicated by the exact calculation, the KN effect actually appears at much lower energies. We find that the exact in Eq. (5) deviates from the result of the Thomson approximation by when reaches 0.02. For typical energy of UV photons (1 eV), this criteria corresponds to GeV. The quantity keeps decreasing to about 50 GeV, and then increases for GeV. Physically, the UV component of the ICS loss rate begins to lose the dominance at 50 GeV, where the KN effects for the infrared and CMB components are still not significant. Thus, in the range from 50 GeV to 700 GeV, increases due to the dominance of the infrared and CMB components. It means that the primary electron spectrum should become softer rather than harder at 50 GeV.
For the energy range we are interested in, the KN effect on the UV background is the main factor of the spectral variation due to the radiative energy losses, so we adjust the energy density of the UV component to discuss the impact from the uncertainties in the ISRF model. In Fig. 2, we show the cases with a two times and a ten times stronger UV component compared with that given by Ref. Delahaye et al. (2010), respectively. For the “UV2” case, the KN effect still cannot predict spectral hardening above GeV. Although there is spectral hardening above GeV in the “UV10” case, the hardening effect begins at much lower energies due to the nature of KN correction, which obviously cannot explain the observed spectral break at GeV.
In Ref. Evoli et al. (2020b), a follow-up work of Ref. Evoli et al. (2020a), the authors argued that the CRE spectral hardening at 50 GeV can still be explained by the KN effect if the UV component of the ISRF is two times stronger than that used in Ref. Evoli et al. (2020a). However, after checking the left panel of their Fig. 11, we find that the spectrum of the “SNR+secondary” component becomes harder for GeV and then softer for GeV, which is consistent with that predicted by the “UV2” case of the present work. The hardening above 50 GeV in the total electron spectrum of their Fig. 11 is very likely due to the hard component from the pulsar wind nebulae, which does not support their own argument.
Now we discuss the CRE spectrum after propagation. First we adopt a simple semi-analytical model to compare the effects of the different KN corrections. The propagation of CREs in the Galaxy can be expressed by the diffusion-energy-loss equation:
| (8) |
where is the differential number density of CREs, is the diffusion coefficient, is the energy-loss rate, and is the source function. The diffusion coefficient is adopted as , which is consistent with the B/C data (e.g., Ref. Yuan et al. (2017)). We assume a power-law source spectrum as . For the spatial distribution of the CRE sources, we adopt the radial distribution of SNRs Green (2015) and assume all the sources are located at an infinite thin disk. The rate of the Galactic supernova explosion is assumed to be 3 per century. We obtain the stationary solution of Eq. (8) using the Green’s function method. A cylinder geometry of the diffusion zone is assumed. The half-height of the cylinder is set to be 5 kpc Yuan et al. (2017).
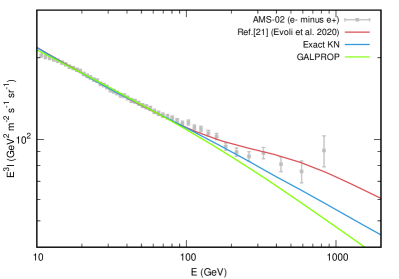
The propagated primary electron spectra are given in Fig. 3. We also show the electron-minus-positron spectrum of AMS-02 which is the proper amount for the comparison with the calculated primary electron spectra Li et al. (2015) (the flux difference between the secondary electrons and positrons is negligible compared with that of the primary electrons). The blue solid line and the red solid line are associated with the cases with the same color in Fig. 1 (or Fig. 2), respectively. The latter is obtained with the identical ICS loss rate used in Ref. Evoli et al. (2020a). We adjust the injection spectral indices so that these two spectra can both fit the low energy data ( for the former and for the latter). The difference is significant in high energy. It is entirely due to the different KN corrections of these two methods: the KN correction used by Ref. Evoli et al. (2020a) predicts spectral hardening above GeV, while the exact KN correction predicts spectral softening.
We also show the primary electron spectrum calculated by GALPROP111https://galprop.stanford.edu/ in Fig. 3. GALPROP is an ideal tool for the calculation of the electron spectrum as it considers the spatial dependency of the ISRF, which should be the more realistic picture than the homogeneous ISRF used above. We adopt the same diffusion coefficient and height of the diffusion zone as the above calculations and assume a single power-law injection spectrum with . As can be seen, the result of GALPROP indicates further spectral softening in high energy, which is caused by the thickness of the source distribution in the vertical direction and also the spatially dependent ISRF. Therefore, an extra hardening for the primary electron spectrum is needed to fit the data as pointed out by the previous works using GALPROP Yuan and Bi (2013); Cholis and Hooper (2013); Lin et al. (2015); Li et al. (2015).
Conclusion.— The radiative energy loss is crucial to determining the spectra of CREs during their propagation. Due to the KN effect of the ICS, the CRE spectrum is expected to deviate from a simple power-law form. We note that in some works the approximation of the ICS energy-loss rate in the intermediate range between the Thomson and KN limits is not accurate enough, which may lead to the incorrect explanation to the spectral hardening of CREs at GeV found by several experiments. We show that the transition from the Thomson regime to the KN regime is actually broader and shallower under the exact calculation. Due to the nature of KN correction, the observed spectral break cannot be explained with the KN effect, even considering the uncertainties in the ISRF. For the convenience of practical use, we further give a polynomial form to describe the ICS loss rate in the intermediate region between the Thomson and extreme KN limits.
The source of the positron excess should contribute partly to the observed CRE spectral hardening, as it is assumed to generate equal amount of electrons. To remove the effect of the extra positron source, we compare the calculated primary electron spectrum with the electron-minus-positron spectrum of AMS-02. As the calculated spectrum keeps softening above several tens of GeV, a spectral hardening of the primary electron spectrum is needed to fit the data. Physically the origin could be due to the spectral fluctuation brought by the discrete distribution of cosmic ray acceleration sources (e.g., Shen (1970); Aharonian et al. (1995); Di Mauro et al. (2014); Fang et al. (2017)). The precise measurements of the energy spectra of electrons and positrons thus do reveal the properties of the CRE sources.
Acknowledgements.
This work is supported by the National Key Research and Development Program of China (No. 2016YFA0400203, 2016YFA0400204), the National Natural Science Foundation of China (Nos. 11722328, U1738205, U1738203, 11851303, 11851305), the 100 Talents program of Chinese Academy of Sciences, and the Program for Innovative Talents and Entrepreneur in Jiangsu.References
- Chang et al. (2008) J. Chang, J. H. Adams, H. S. Ahn, et al., Nature 456, 362 (2008).
- Aharonian et al. (2008) F. Aharonian, A. G. Akhperjanian, U. Barres de Almeida, et al., Phys. Rev. Lett. 101, 261104 (2008), arXiv:0811.3894 [astro-ph] .
- Abdo et al. (2009) A. A. Abdo, M. Ackermann, M. Ajello, et al., Phys. Rev. Lett. 102, 181101 (2009), arXiv:0905.0025 [astro-ph.HE] .
- Adriani et al. (2011) O. Adriani, G. C. Barbarino, G. A. Bazilevskaya, et al., Phys. Rev. Lett. 106, 201101 (2011), arXiv:1103.2880 [astro-ph.HE] .
- Aguilar et al. (2014) M. Aguilar, D. Aisa, B. Alpat, et al., Phys. Rev. Lett. 113, 221102 (2014).
- Ambrosi et al. (2017) G. Ambrosi, Q. An, R. Asfandiyarov, et al., Nature 552, 63 (2017), arXiv:1711.10981 [astro-ph.HE] .
- Adriani et al. (2017) O. Adriani, Y. Akaike, K. Asano, et al., Phys. Rev. Lett. 119, 181101 (2017), arXiv:1712.01711 [astro-ph.HE] .
- Abdollahi et al. (2017) S. Abdollahi, M. Ackermann, M. Ajello, et al., Phys. Rev. D 95, 082007 (2017), arXiv:1704.07195 [astro-ph.HE] .
- Aguilar et al. (2019a) M. Aguilar, L. Ali Cavasonza, G. Ambrosi, et al., Phys. Rev. Lett. 122, 041102 (2019a).
- Aguilar et al. (2019b) M. Aguilar, L. Ali Cavasonza, B. Alpat, et al., Phys. Rev. Lett. 122, 101101 (2019b).
- Adriani et al. (2009) O. Adriani, G. C. Barbarino, G. A. Bazilevskaya, et al., Nature 458, 607 (2009), arXiv:0810.4995 [astro-ph] .
- Aguilar et al. (2013) M. Aguilar, G. Alberti, B. Alpat, et al., Phys. Rev. Lett. 110, 141102 (2013).
- Yuan and Feng (2018) Q. Yuan and L. Feng, Science China Physics, Mechanics, and Astronomy 61, 101002 (2018), arXiv:1807.11638 [astro-ph.HE] .
- Atoyan et al. (1995) A. M. Atoyan, F. A. Aharonian, and H. J. Völk, Phys. Rev. D 52, 3265 (1995).
- Strong and Moskalenko (1998) A. W. Strong and I. V. Moskalenko, Astrophys. J. 509, 212 (1998), arXiv:astro-ph/9807150 [astro-ph] .
- Blumenthal and Gould (1970) G. R. Blumenthal and R. J. Gould, Reviews of Modern Physics 42, 237 (1970).
- Evoli et al. (2020a) C. Evoli, P. Blasi, E. Amato, and R. Aloisio, Phys. Rev. Lett. 125, 051101 (2020a), arXiv:2007.01302 [astro-ph.HE] .
- Schlickeiser and Ruppel (2010) R. Schlickeiser and J. Ruppel, New Journal of Physics 12, 033044 (2010), arXiv:0908.2183 [astro-ph.HE] .
- Yuan and Bi (2013) Q. Yuan and X.-J. Bi, Physics Letters B 727, 1 (2013), arXiv:1304.2687 [astro-ph.HE] .
- Cholis and Hooper (2013) I. Cholis and D. Hooper, Phys. Rev. D 88, 023013 (2013), arXiv:1304.1840 [astro-ph.HE] .
- Lin et al. (2015) S.-J. Lin, Q. Yuan, and X.-J. Bi, Phys. Rev. D 91, 063508 (2015), arXiv:1409.6248 [astro-ph.HE] .
- Li et al. (2015) X. Li, Z.-Q. Shen, B.-Q. Lu, et al., Physics Letters B 749, 267 (2015), arXiv:1412.1550 [astro-ph.HE] .
- Kobayashi et al. (2004) T. Kobayashi, Y. Komori, K. Yoshida, and J. Nishimura, Astrophys. J. 601, 340 (2004), arXiv:astro-ph/0308470 [astro-ph] .
- Delahaye et al. (2010) T. Delahaye, J. Lavalle, R. Lineros, F. Donato, and N. Fornengo, Astron. Astrophys. 524, A51 (2010), arXiv:1002.1910 [astro-ph.HE] .
- Stawarz et al. (2010) Ł. Stawarz, V. Petrosian, and R. D. Blandford, Astrophys. J. 710, 236 (2010), arXiv:0908.1094 [astro-ph.GA] .
- Blies and Schlickeiser (2012) P. Blies and R. Schlickeiser, Astrophys. J. 751, 71 (2012).
- Jones (1968) F. C. Jones, Physical Review 167, 1159 (1968).
- Fixsen (2009) D. J. Fixsen, Astrophys. J. 707, 916 (2009), arXiv:0911.1955 [astro-ph.CO] .
- Moderski et al. (2005) R. Moderski, M. Sikora, P. S. Coppi, and F. Aharonian, Mon. Not. Roy. Astron. Soc. 363, 954 (2005), arXiv:astro-ph/0504388 [astro-ph] .
- Agaronyan and Ambartsumyan (1985) F. A. Agaronyan and A. S. Ambartsumyan, Astrophysics 23, 650 (1985).
- Evoli et al. (2020b) C. Evoli, E. Amato, P. Blasi, and R. Aloisio, arXiv e-prints , arXiv:2010.11955 (2020b), arXiv:2010.11955 [astro-ph.HE] .
- Yuan et al. (2017) Q. Yuan, S.-J. Lin, K. Fang, and X.-J. Bi, Phys. Rev. D 95, 083007 (2017), arXiv:1701.06149 [astro-ph.HE] .
- Green (2015) D. A. Green, Mon. Not. Roy. Astron. Soc. 454, 1517 (2015), arXiv:1508.02931 [astro-ph.HE] .
- Shen (1970) C. S. Shen, Astrophys. J. Lett. 162, L181 (1970).
- Aharonian et al. (1995) F. A. Aharonian, A. M. Atoyan, and H. J. Voelk, Astron. Astrophys. 294, L41 (1995).
- Di Mauro et al. (2014) M. Di Mauro, F. Donato, N. Fornengo, R. Lineros, and A. Vittino, J. Cosmol. Astropart. Phys. 2014, 006 (2014), arXiv:1402.0321 [astro-ph.HE] .
- Fang et al. (2017) K. Fang, B.-B. Wang, X.-J. Bi, S.-J. Lin, and P.-F. Yin, Astrophys. J. 836, 172 (2017), arXiv:1611.10292 [astro-ph.HE] .