The Dynamics of Globular Clusters and Elliptical Galaxies
Abstract
Equations of motion are generated for an idealised model spherical galaxy or globular cluster evolving from the epoch of galactic separation until it attains a semi-equilibrium state through gravitational collapse. The theoretical radial surface density is computed and compared with two globular clusters, M15 and M80, and shows a good fit to observational data. The model is contrasted with King’s model, and mean cycle time and velocity are computed. The velocity-radius curve is developed, and Gaussian RMS values derived from which half-light radius vs. mass are plotted for 735 spherical objects, including 544 normal ellipticals and compact, massive, and intermediate mass objects. These latter show a linear mean log-log slope of , equivalent to a Faber-Jackson slope of over a mass range of 7 decades. and a slope of on a semi-log plot of . Globular clusters, dwarf elliptical and dwarf spherical galaxies show a distinct anomaly on these plots, consistent with the ellipticals containing a supermassive black hole (SMBH) whose mass increases as the velocity dispersion increases, compared with the remaining types of spherical or irregular galaxies without a massive core.
keywords:
galaxies: formation – galaxies: star clusters: general – galaxies: elliptical – quasars: supermassive black holes1 Introduction
Globular clusters (GCs) are spherical collections of stars that orbit a galactic core as a satellite. They are fairly common structures, with over 150–157 currently known in the Milky Way (MW) (Harris, 1996; Fromart, 2011). GCs are tightly bound by gravity, giving them their spherical shapes and relatively high stellar densities toward their centres. They all approximate to a similar pattern with spherical symmetry, a core concentration of stars, a reasonably well defined edge to the star field, and can contain a high density of stars: on average about 0.4 stars per cubic parsec, increasing to 100–1000 stars per cubic parsec in the core of the cluster (Talpur, 1997), with a typical distance between stars of about 1 light year (Chandrasekhar, 1942; Smail, 2020). They may be categorised according to the degree of concentration the system has toward the core, ranging from the most highly concentrated as Class I (e.g. M75), through successively diminishing concentrations to Class XII (e.g. Palomar 12).
Generally, GCs are free of gas and dust and do not display active star formation, being composed of old, metal-poor stars containing hydrogen and helium, but not much else. They contain some of the oldest stars in the galaxy, estimated to be at least 10–13 billion years old, with an abundance of low-mass red stars and intermediate-mass yellow stars and a lack of O and B type stars, an indication of their great age (Chaisson & McMillan, 1999). Although the formation of GCs remains poorly understood, they contain some of the earliest stars to be produced, consistent with the idea that they are among the oldest objects in the Galaxy, with most of the stars at approximately the same stage in stellar evolution, suggesting that they formed at about the same time (Chaboyer, 2001).
These globular star clusters may contain members, making detailed star-by-star simulations too complex for simple analysis, although approximate N-body simulations with several thousand particles have been performed (Deiters et al., 2001). In practice, however, the deviations from a true thermodynamic equilibrium are often not that large, and N-body simulations show a relatively smooth behaviour of the approximately thermodynamic parameters as a function of time. The spherical Jeans Equation provides a good thermodynamic analysis for the motion of stars in 3-dimensions, but a specific solution is difficult (Binney & Tremaine, 2008). For this reason, various approximation methods, such as Fokker-Planck treatments and conducting gas sphere models, have worked well (Hut, 1997). By making some carefully chosen assumptions, we have analysed the density distribution and kinetic parameters of an idealised GC to build an analytic model, and in this paper we demonstrate it is consistent with observations for a number of GCs, and is comparable with a simple Jeans Equation.
1.1 Chronology of GCs
The absolute age of the Universe is Gyrs based on the microwave background and Hubble constant (Planck Collaboration, 2018), which must fix a maximum constraint on the ages of all objects including early stars and GCs. The early epochs of the universe are now well understood in terms of nucleosynthesis and the partition of energy up to the epoch of decoupling, when hydrogen ions became neutral and transparent to light at a redshift (379,000 years after the Big Bang). Finer details of the anisotropies in the background radiation have become apparent with the increasing sensitivity of COBE, the Wilkinson Microwave Anisotropy Probe (WMAP) satellite project, and the Planck cosmology probe (Hinshaw et al., 2009; Planck Collaboration, 2016), giving hints of early structure and consequent galactic separation, possibly through the amplification of quantum fluctuations within the proto-universe itself. Reionisation occurred relatively quickly as objects began to condense in the early universe and became sufficiently energetic to re-ionise neutral hydrogen. The most recent results from the Planck mission, yield an instantaneous reionisation redshift of (Planck Collaboration, 2018).
Quasars are extremely luminous active galactic nuclei (AGN), with a supermassive black hole ranging from millions to billions of times the mass of the Sun. The most distant quasar currently known is ULAS J134208.10+092838.61 at when the universe was only 690 Myrs old (Schmidt et al., 1995), and it is likely that these massive objects were the first to condense, due to their high mass. However, these ages are confounded by the age of HD 140283, a bright, unreddened subgiant in the solar neighbourhood. HD 140283 is extremely metal-deficient, with a well-determined chemical composition and a location on the Hertzsprung–Russell diagram where absolute magnitude is most sensitive to stellar age, avoiding many of the issues of age determinations for GCs. It has an inferred age of Gyr, one of the oldest stars discovered, but uncertainties in the stellar parameters and chemical composition may extend the total errors, yielding an age of Gyr (Bond et al., 2013), putting its minimum age at 110 Myrs after the Big Bang. Protostars of stellar mass are thought to form from their parent gas clouds within 500,000 years (Dunham et al., 2014), and within the errors the age of HD 140283 does not conflict with the age of the Universe. Nevertheless these ages are all uncomfortably close to the epoch of decoupling, suggesting that stars of the earliest GCs formed rapidly from the condensing gas clouds against the expanding universe.
Globular clusters are generally considered to be old structures, with ages comparable to the age of the universe. The oldest galactic GCs have a mean age of Gyr, with a maximum age of 16.0 Gyr (99% confidence) and an absolute minimum age of 10.5 Gyr (99% confidence) (Jimenez, 1998). Other papers have determined their ages to range from Gyr (Chaboyer, 2001) to Gyr for M4 ( error) (Hansen et al., 2002). One of the oldest galaxies with an age of 13.39 Gys () has been identified by a continuum Ly break just 400 Myr after the Big Bang, suggesting that galaxy build-up was well underway early in the reionization epoch (Oesch et al., 2016).
The origin of the supermassive black holes (SMBHs) that power distant quasars remains uncertain, and their rapid formation presents a paradox (Woods et al., 2019), because the ages of the oldest quasars, stars and GCs extends into the period before reionisation. It is generally accepted that the expanding Universe differentiated into gas clouds that subsequently collapsed, but the formation of quasars of mass M⊙ and readshifts would require an accretion time greater than their age at that epoch. This has suggested new mechanisms such as supra-exponential accretion (Alexander & Natarajan, 2014), although the timescale of early formation of these old GCs and ancient stars, galaxies, and quasars is consistent with fissuring of the hot plasma itself as the Universe expanded rather than re-condensation of the expanding hot gas.
1.2 The core of globular clusters
A number of mechanisms account for the paucity of massive stars in GCs: (1) the initial number of massive stars (i.e. M⊙) was probably low as a statistical consequence of the GCs being small systems with few stars; (2) the age of GCs implies that no early stars with initial mass M⊙ will still be present in a small GC, as they will have formed supernovae shortly after the formation of the GC; (3) the low mass of GCs may have prevented their retention of secondary elements formed by the early supernovae, and hence any consequent population I secondary star formation will have been suppressed; (4) conversely, stars with very low mass ( M⊙) may not have ignited, and were possibly sling-shot out from their parent GC.
The possible existence of a black hole at the centre of GCs has been considered by a number of theoreticians (e.g. Gerssen et al., 2002), though some theoretical models suggested that GCs do not require a black hole core. However, a recent spectroscopic search of 25 Galactic GCs discovered a binary system in NGC 3201, one component of which is a detached stellar-mass black hole with a minimum mass of M⊙ (Giesers et al., 2018).
The cross sectional area of a star of stellar mass is m2. Assuming a total stellar mass for M15 of M⊙ and radius of 25 pc suggests that the mean distance between stars in the core of even a large GC such as M15 is m, with a mean cross sectional area per star of m2. The ratio of areas between this and the star is then , implying a low probability for accretion of core stars onto a black hole. The binary black hole in NGC 3201 may therefore have a similar age to its component stars.
1.3 Assumptions of the model
The virial theorem is a powerful tool for analysing the motion of stars in an idealised galaxy, wherein the potential energy () is generally taken to be the of a mass brought from infinity – which defines the zero point for – towards a self-gravitating galaxy of total mass . Assuming that is at a radial distance from the centre, then from Newton all mass within the sphere defined by is equivalent to a point mass at the galactic centre and all mass external to that sphere may be ignored. The usual gravitational force may then be applied and the standard equations of motion for the star system derived. However, in the early universe (defined here as the epoch of galaxy separation, ), this standard analysis for may not be applicable because, at this epoch of separation, the density of the universe was approximately uniform, with the exception of the assumed local fluctuations.
We consider the expanding Universe to have separated relatively quickly into islands of matter, in a three-dimensional analogy to a sheet of tissue paper being stretched apart before tearing along fault lines of relative weakness. Where the density was a little above the average, we may expect nucleation to have occurred as a precursor to the massive core at galactic centres. Where the density was a little lower than average, the continuing expansion of the universe may be thought of as ripping through the distribution of matter, as though the protogalaxies were being torn apart from each other due to the expansion of space at a time . Thus it does not make sense to talk of bringing a mass from infinity, as the mean gravitational field was everywhere zero at this moment.
The model presented in this paper for the distribution of matter in spherical galaxies therefore takes a modified approach to the definition of by assuming that individual masses within each galaxy did not come from infinity, but were set in place during the expansion of the universe until galactic separation was sufficient for them to become self-gravitating at the era of separation. Neighbouring galaxies would then have had reducing mutual gravitational influence, and the initial for each would have continued to increase asymptotically towards its theoretical value had been brought in from infinity, thus driving gravitational collapse.
At , it may be debated whether the matter of the universe was in the form of gas or if early star formation had already occurred, but for the purpose of this model it may be assumed that the protogalaxies were populated by young, uniform stars, each of mass . The uniform density of the universe at the epoch of galaxy separation, , may be defined as , and the mean radius of each protogalaxy as , containing a mass . Although the individual masses had been separating from each other as a consequence of the overall expansion, at the epoch of galaxy separation it is assumed that the individual masses would cease expanding away from each other relative to the proto-centre of their new galaxy, and the mean kinetic energy within each galaxy at this instant was therefore zero. Thus the total mechanical energy of the system was derived ultimately from the separation of mass by the initial expansion of space, and the potential energy of these masses began to increase asymptotically as neighbouring galaxies drew away. As separation continued, the masses began to infall through mutual self-gravitational collapse into the local gravitational field generated by the protogalaxy.
This model assumes that self-gravitational infalling would continue with the newly acquired initial potential energy converted into kinetic energy as the masses accelerated inwards. The motion of each individual star is highly chaotic, and equipartition of throughout the system is assumed through gravitational interactions such that the masses reach dynamic stability, finally moving with a mean radial velocity, . At this time, it is shown that a state of equilibrium would be reached in which the stars would undergo periodic motion, traversing a path across a sphere of final radius .
The model makes a number of assumptions:
-
•
Radial symmetry about the centre.
-
•
No angular momentum.
-
•
The equations of motion depend wholly on Newtonian gravitation in standard form.
-
•
The galaxy starts at time (the epoch of galactic separation) from a collapsing, self-gravitational sphere of radius .
-
•
The sphere collapses to a final equilibrium radius, .
-
•
The initial state of the protogalactic sphere may have been in the form of gas, but as this collapsed in on itself, star systems spontaneously formed which are now approximately the age of the GC.
-
•
The whole system may therefore be treated as though it were initially composed of stars of mean mass , with an initially uniform distribution of mass with initial density .
-
•
Equipartition of energy such that, over sufficient time (but a time much shorter than the observed age of the galaxy), the total energy of the system is partitioned equally within each spherical shell, as a function of radius.
-
•
Conservation of mass: The mass of the galaxy remains throughout.
-
•
Conservation of energy: the loss in potential energy in collapsing from to is converted entirely into kinetic energy of motion of the stars.
2 Equation of motion in a uniform spherical galaxy
We assume the GC density (stars+gas) was approximately uniform at the epoch of galactic separation. The mean gravitational field within an infinite uniform distribution of mass is zero, but after the epoch of galactic separation each island galaxy became increasingly isolated, with a defined centre. Thereafter, a typical galaxy became a self-gravitating sphere of particles, such as a star field, with initial radius and initial uniform mean mass density , which was the density of the Universe at the era of galactic separation.
2.1 Initial potential energy of a spherically symmetrical galaxy
The gravitational force on a test mass is:
| (1) |
where is the mass internal to :
| (2) |
The potential energy () of the mass is defined as the work done in bringing the mass from infinity to , and is the radial path integral of :
| (3) |
Hence for a thin shell at , of mass and thickness , will be:
| (4) |
| (5) |
| (6) |
and the total initial is:
| (7) |
But the total mass of the galaxy is ,
| (8) |
| (9) |
2.2 Final potential energy
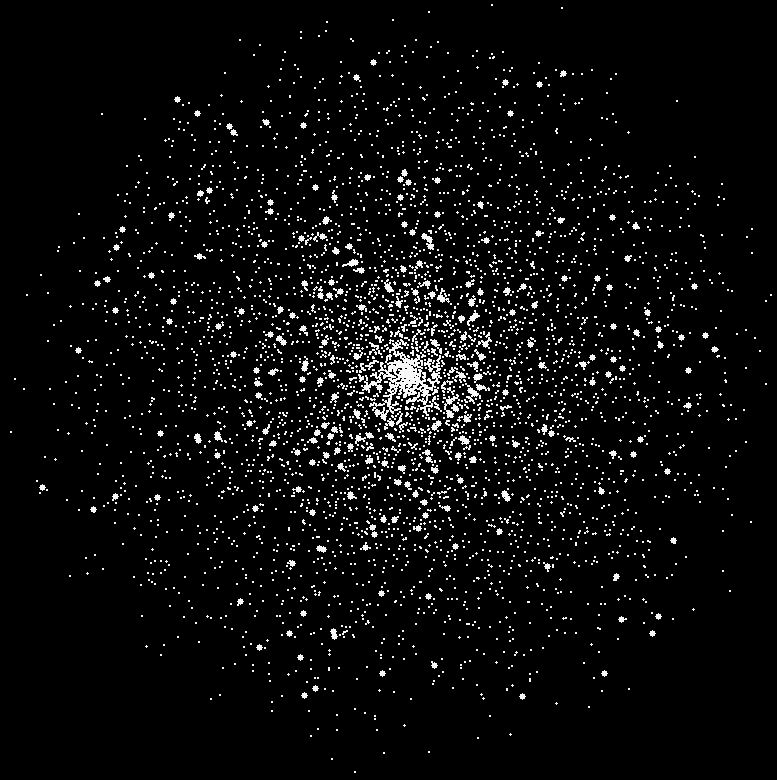
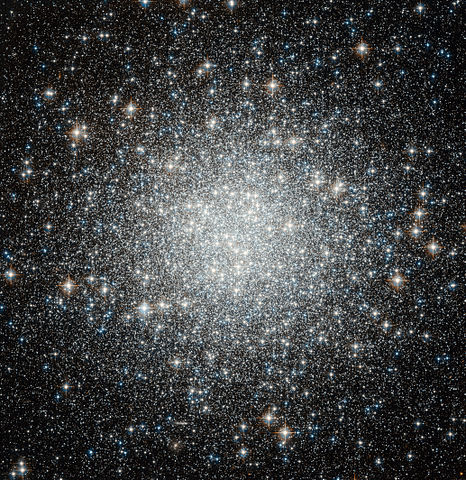
Making the assumption that GCs began as spheres of uniform density, these would have been dynamically unstable leading to collapse of the sphere. At the initial uniform density each shell would have contained a mass of stars , but at equilibrium the flux of stars moving into and out of a shell must exactly balance. This implies that the number density of stars in each shell should be as visualised in a Monte Carlo simulation using this distribution for 5000 stars with a simple Salpeter IMF (Fig. 1). This is seen in the distribution of visible stars in globular cluster M53 (Fig. 2) which, although now reclassified as external to the MW, provides a good representation of a classical GC.
Let us define a density function as:
| (10) |
where is a characteristic final density at the surface of the galaxy, at final radius . The total mass is then:
| (11) |
| (12) |
| (13) |
where and are the initial radius and initial mean mass density respectively. Substituting
| (14) |
| (15) |
into equation 4 for the potential energy of a shell at , thickness , then:
| (16) |
The final total is:
| (17) |
and the change of is therefore:
| (18) |
2.3 Kinetic energy
The total kinetic energy for stars of mean mass at equilibrium is:
| (19) |
Assuming full equipartition of energy amongst the stars in each shell, we may consider a mean velocity at equilibrium such that:
| (20) |
where . Equating total with the decrease in :
| (21) |
2.4 Periodic motion of stars within a sphere with increasing density
The equation of motion of a star of mass within a gravitational sphere of density is given by:
| (22) |
| (23) |
where .
This may be solved analytically by considering the change in of as it falls across the sphere, which is the work done in bringing the test mass towards the centre against the gravitational field, . Defining the zero of to be at the galactic surface, , and to be the change in in moving from to , then,
| (24) |
| (25) |
Using the conservation of energy, ,
| (26) |
Rearranging, and using ,
| (27) |
which has a standard integral solution,
| (28) |
where is the integral of the Gaussian distribution,
| (29) |
which is a continuous and complete function. Noting that , and , the time for to fall towards the centre (a quarter cycle) is therefore,
| (30) |
where is the time for a full cycle.
The emergence of the error function in this integral might be anticipated from remembering that the velocity of any particle in a system at thermal equilibrium will have a normal distribution due to the maximum entropy principle.
Although this simplistic approach ignores relativistic effects as the mass accelerates towards the centre, in practice the motion is highly chaotic through the action of gravitational interactions, and from any non-radial component inherited from the time of galaxy formation. This therefore causes the star to swing past the centre, apart from very rare encounters with the event horizon at a Schwarzschild radius if a black hole core is present. There is therefore a low probability of any individual star experiencing relativistic encounters.
The mean velocity is then , and the mean square velocity is:
| (31) |
But from equation 21:
| (32) |
| (33) |
Substituting and solving for :
| (34) |
This is a remarkable result, implying that all simple spherical galaxies expand to have a stable maximum radius of times their initial radius at the epoch of galactic separation. Although physically larger, the majority of the mass is internal to the initial radius and the total potential energy has decreased, while equipartition of kinetic energy ensures that this concentration of mass is built by more massive stars congregating towards the centre of the GC (Binney & Tremaine, 2008). Conversely, this may result in any dark matter (DM) being concentrated in a thin external halo, increasing the effective radius beyond the optically visible radius.
2.5 Time-distance and velocity-radius curves for M15
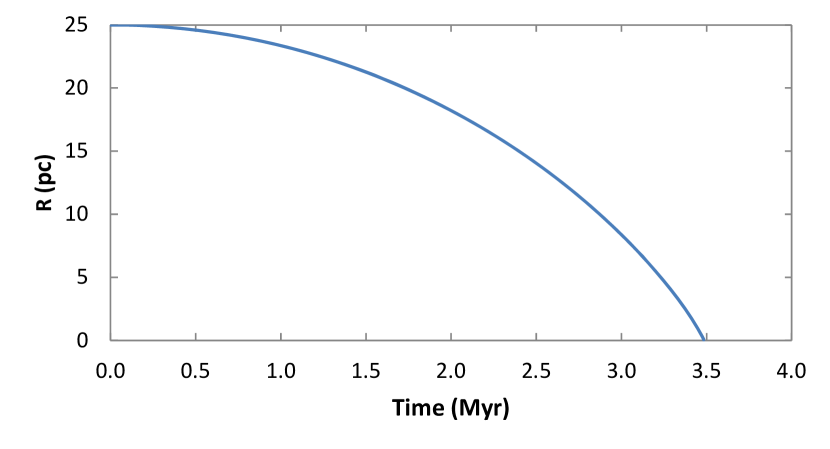
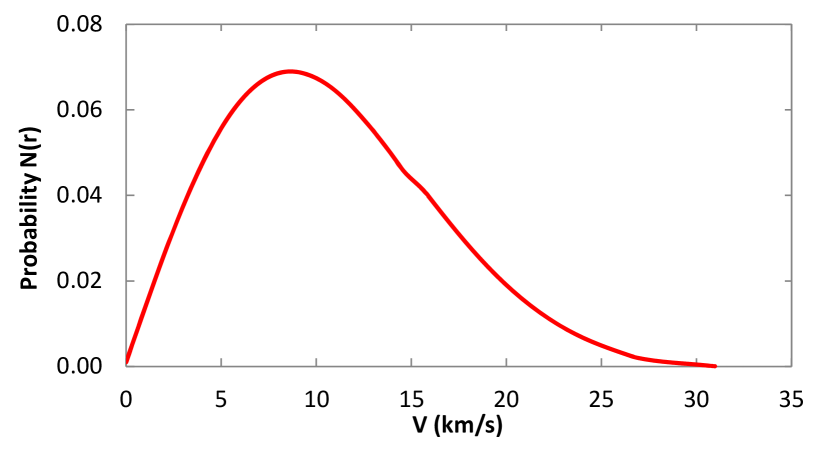
Figure 3 shows the mean time-distance curve from equation 29 for a typical star in galaxy M15, assuming a radius of 25 pc and a total mass of , while the probability of finding a star with any given velocity increment is shown in Fig. 4, normalised so that the area under the curve is 1 (i.e. certainty). This theoretical LoS probability curve across the centre of the galaxy is broadly in agreement with the observational velocity probability curve presented by McNamara et al. (2004), and has similarities to a Rayleigh distribution, suggesting the distribution has a maximum Cumulative Residual Entropy (Baratpour & Khodadadi, 2012). More realistic curves to match observational values would introduce a mass distribution function for the stars, but although more complex, the fundamental dynamics would not be changed.
2.6 The IMF and globular clusters
The Initial Mass Function (IMF) for the stellar component of early galaxies has been debated for more than 50 years, since Salpeter proposed his initial model function: , where is the number of stars in the mass range to (Salpeter, 1955; Chabrier, 2005). Detailed analysis of the different models has been provided by Bolzonella et al. (2000) who opted for the model of Miller & Scalo (1979) with a 4-part segmentation of for ranging from . Because of the rapid decline in number counts of more massive stars in this model, 52% of the mass resides in stars with a mass , and 91% of the mass is in stars with a mass .
Applying an IMF function to the mass distribution of the dynamic model of Section 1 with equipartition of energy among the mass components will change the characteristics of the density, radius and velocity profiles. There is an increase in core density and a more rapid reduction in shell density with radius; the core velocity is decreased slightly, whilst the final galactic radius is increased by the faster moving low mass components. However, although the exact profiles are IMF-dependent, the overall picture remains well described by the simpler analysis using a single value for the mean stellar mass.
3 Cross-sectional density
Emission profiles of galaxies map surface luminosity per unit area as a function of galactic radius. These profiles are dependent on the volume density, but also on the mass-luminosity function and obscuration. With the assumption of uniform individual brightness profiles and no obscuration of deeper stars by dust, the number of stars per unit area as a function of radius in a galaxy of uniform density , radius is simply:
| (35) |
where is the number density of stars observed per unit area.
A more realistic relationship for globular clusters (GC) with density increasing towards the centre was initially described by King (1962). He presented an empirical formula that represented the density from centre to edge in globular clusters of the form:
| (36) |
where is the number of star counts per unit area, is a constant, is a scale factor that may be called the core radius, and is the value of at which the surface density . With these three parameters, a good correlation was demonstrated between this curve and the observed number/radius counts for several globular clusters.
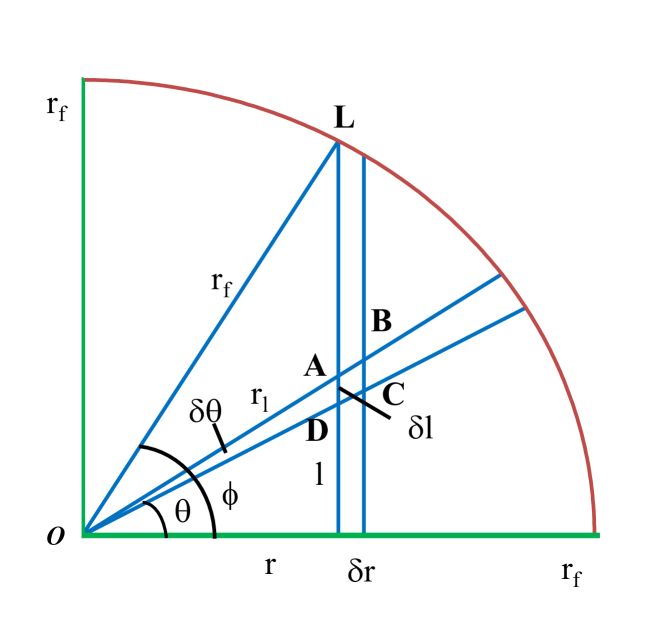
Referring to Fig. 5, the number density of stars observed, , across a chord of the GC in a core of depth , unit area , at a distance from the centre is:
| (37) |
where is the density of the star field at radius from the centre.
Note that for , and for the limit this simplifies to:
| (40) |
which is a simple power curve with log-log slope . The implied limit as is not a physical reality; in practice, observed stars have a finite resolvable disk whose diameter is set by the resolving power of the telescope. In addition, it may be assumed that the star number density cannot increase beyond a certain limiting threshold, beyond which individual stars may conjoin, possibly as a central black hole. This sets an upper bound to the number of stars that can be distinguished in any given star field. If we define this radius to be , this represents a lower bound for in equation 39, from which we may generate the limiting curve:
| (41) |
The curve has three parameters, , , and , and superficially resembles that of King but differs in concept. King’s curves were constructed ad hoc to fit the observational data, whereas the curve described in equation 41 was generated from a model of the behaviour of stars in a relaxed spherical galaxy and its shape differs in detail.
3.1 Limitations of the model
In common with King’s model equations, equation 41 assumes a definite maximum radius, , a limiting edge density , and a defined core radius, . Implicit also is the assumption that kinetic energy is partitioned equally within each shell, and that all stars have identical masses. This latter is the least plausible assumption, and a better model might be created using an idealised initial mass function (IMF) such as that of Salpeter. This presents an empirical IMF , where is the probability of observing stars of given mass .
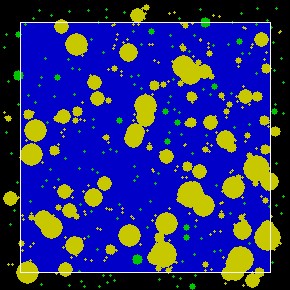
One practical limitation for accurate number counts of stars in a crowded field is from overlapping of the optical disks. Figure 8 represents the simulated field of view of a plate arc minutes2, with a true star density of 100 stars arc min-2. Unobscured stars are shown in green; the yellow stars represent an overlap of the optical disks, with the degree of overlap ranging from brushing edges to complete masking, and this clearly affects the final counts. The stars outside the plate area are included in the figure to allow for completeness in the algorithm for assessing visible star counts. A majority of star disks show some degree of overlap but, by pixel counting in the plate area, an estimate may be drawn for the degree of overlap for any given star density and distribution of apparent radii.
The formal analysis of the equations of motion for stars of differing masses within globular clusters is complex, but by using an IMF of simplified Salpeter form such as , we may derive a modified function for the predicted number counts per unit area (equation 42):
| (42) |
3.2 Ratio of mean galactic separation to mean galactic radius
At the era of separation, , proto-galaxies had expanded to a radius . corresponds approximately to the epoch of decoupling, and its value will probably approximate to this epoch ( yrs) with an upper limit at the age of the oldest red-shift galaxy thus far discovered (UDFy-38135539) of years at (Lehnert et al., 2010), or the age of M15 at 13.2 Gyr. BP (McNamara et al., 2004). At that time, galactic expansion as a consequence of the expansion of the Universe stopped and galactic separation began and it may be asserted that the proto-galaxy had a mean stellar motion of zero relative to the centre of the proto-galaxy. The present day separation distance between galaxies is influenced by both the continual expansion of space between them after individual galaxies separated leading to the familiar Hubble’s Law of red-shift with distance, and by mutual gravitational attraction between neighbouring galaxies with the infalling galactic clusters leading to galactic interactions or ultimately to complex galactic mergers.
Taking the present age of the universe Gyr. (Planck Collaboration, 2018), let the mean separation of galaxies at be , the present mean separation between galactic centres be , and taking an upper limit to the epoch of galaxy formation () as yrs, then through Hubble separation. Substituting (from equation 34) suggests a present ratio of mean galaxy separation distance to mean galactic diameter of .
4 The Jeans Equation and Faber-Jackson relationship
The first proposition of the Jeans theorum states: Any steady-state solution of the collisionless Boltzmann equation depends on the phase-space cordinates only through integrals of motion in the galactic potential. Any function of the integrals yields a steady-state solution of the collisionless Botlzmann equation (Binney & Tremaine, 2008).
Since we rarely know more than three integrals, this definition is often modified to the second proposition of Jeans theorum, that: Any function of integrals solves the collisionless Boltzmann equation (equation 43):
| (43) |
where position , is the velocity, is the gravitational potential, is the local density at time , and is the velocity dispersion tensor (Binney & Tremaine, 2008, adapted from eq. 4-27) .
We have derived a function for total mass rather than luminosity, and from equation 31 we may estimate the total mass as:
| (44) |
Equation 44 is similar to the spherical Jeans equation in one dimension assuming spherical hydrostatic equilibrium and isotropy. The velocity dispersion tensor, , is then: . But the galaxy may not be spherically symmetrical and may also be anisotropic with radial velocities as well as tangential ones. In addition, spherical galaxies, especially fainter ones, don’t possess clearly defined boundaries making the final radius, , difficult to measure.
Wolf et al. (2010) show that the integrated mass within a characteristic radius, , where the log-slope of the 3D density profile is , is largely insensitive to velocity dispersion anisotropy and for a wide range of stellar light distributions that describe dispersion-supported galaxies, is close to the 3D de-projected half-light radius . We therefore define as a multiple of the effective half-light radius (), or the radius containing half the galaxy’s luminosity. This may be related by
| (45) |
Because the graph of – is plotted on a log-log scale, the precise value of is less critical and a commonly accepted approximation is used.
Elliptical galaxies are generally smooth, featureless systems containing Population II stars and little or no gas or dust, giving them some similarities to GCs. They are denoted by their degree of eccentricity from the most spherical, , to , the most elongated, but because we see only their brightness distribution it is impossible to tell directly if they are axisymmetric or triaxial (Binney & Tremaine, 2008).
4.1 Spherical and elliptical galaxies
The Faber–Jackson (F-J) relation provides a power-law relation between luminosity and the central stellar velocity dispersion of elliptical galaxies. Their relation can be expressed mathematically as:
| (46) |
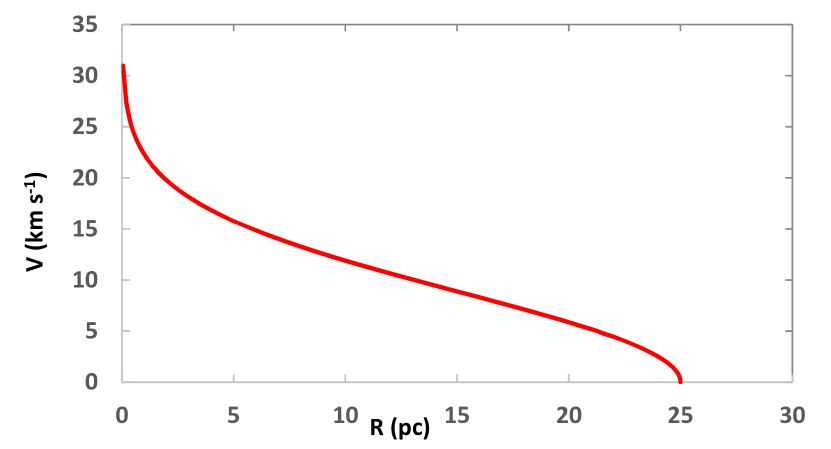
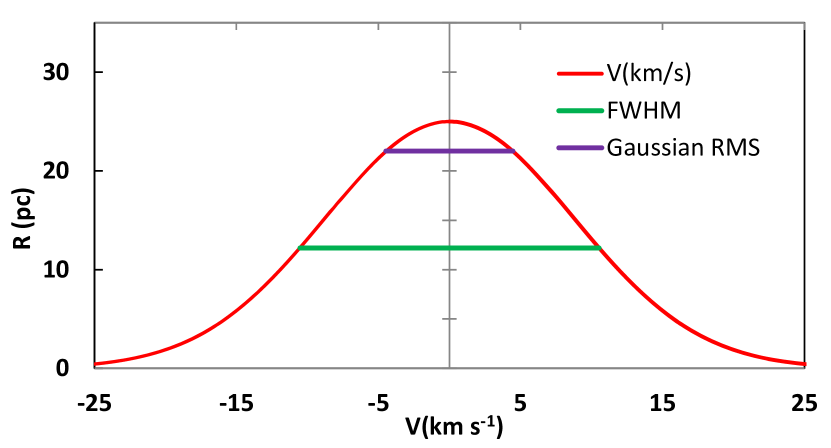
The F-J relation linking the mass and luminosity of an elliptical galaxy to its velocity dispersion specifically refers to the rms width of the Gaussian distribution function of the line-of-sight velocity from a selected range of absorption bands (Faber & Jackson, 1976). In contrast to in the F-B relation, (equation 31) is a mean velocity across the whole system, and better refers to the Full Width at Half Maximum (FWHM) value. The velocity/radius curve for a typical star in M15 is shown in Fig. 9. By switching axes, Fig. 10 shows the velocity distribution across the whole M15 galaxy which approximates to the expected Gaussian distribution. Fig. 10 also shows the rms and FWHM values which are related by:
| (47) |
The total dynamic mass may therefore be estimated from equation 44 as:
| (48) |
where is the rms line-of-sight velocity dispersion of the galaxy, and is the half-light radius.
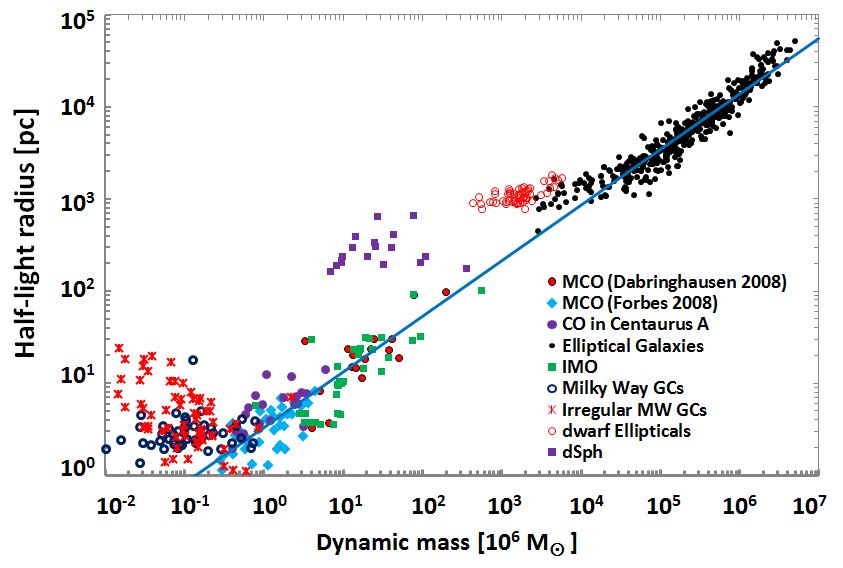
The parameters and are listed in many catalogues for a wide range of galactic masses and types. Fig. 11 plots the derived log-log dynamic mass vs. half-light radius for 735 spherical objects spanning more than 8 decades of mass. Data for these plots and the number in each class, [n], were taken for: dwarf ellipticals (dE) [58] and ordinary ellipticals [437] (Forbes et al., 2008); Massive Compact Objects (MCO) [55] (Forbes et al., 2008; Dabringhausen et al., 2008); Compact Objects (CO) [20] in Centaurus A (Dabringhausen et al., 2008); Intermediate Mass Objects (IMO) [32] (Forbes et al., 2008); MW GCs [48] (Forbes et al., 2008); Irregular, low mass or very faint MW GCs [67] (Baumgardt & Hilker, 2018); and dwarf spherical galaxies (dSph) [18] (Mateo et al., 1993; Forbes et al., 2008).
Models assuming structural homology, such as de Vaucouleurs’ model, cannot establish changing trends in their slope (Graham, 2013). The F-J slope of 4 represents the average slope over a restricted luminosity range to what is a curved or broken distribution, with the slope becoming 2 at lower luminosities. Also shown in Fig. 11 is the linear best fit to the normal ellipticals and compact objects (excluding dwarf ellipticals, dSphs and GCs). This has a mean log-log slope of , equivalent to an F-J slope of over a range of 7 decades. Despite the good fit to a majority of the galaxies in Fig. 11, there are some noted anomalies with the dwarf ellipticals, dSphs and GCs branching from the main line.
4.2 Anomolous groups
Dwarf elliptical galaxies (dE) have blue absolute magnitudes within the range mag mag, fainter than ordinary elliptical galaxies. Objects with masses intermediate between massive GCs and dwarf ellipticals have masses of M⊙ and relatively compact sizes. They are usually referred to as Ultra Compact Dwarfs (UCDs), with sizes intermediate between elliptical galaxies and globular clusters. Forbes et al. (2008) argue that most of these intermediate mass objects have similar properties to massive GCs, i.e. IMOs are essentially massive star clusters. The dSphs have luminosities of order L⊙, and are characterised by their low surface brightnesses.
In a galaxy formation theory based on the cold dark matter (DM) model, low-luminosity, low-mass galaxies such as dSphs are considered to be among the first bound luminous objects and are therefore expected to contain DM, and current data for dSph galaxies are consistent with these systems having similar DM halos, with total masses in the range M⊙ (Mateo et al., 1993). A "discontinuity" is seen at M⊙. This has been interpreted as the threshold for the gas in dSphs to be blown away by successive supernovae (Hirashita et al., 1998). The large mass ratio of DM to baryonic matter is therefore reached in a low mass dSph through gas depletion.
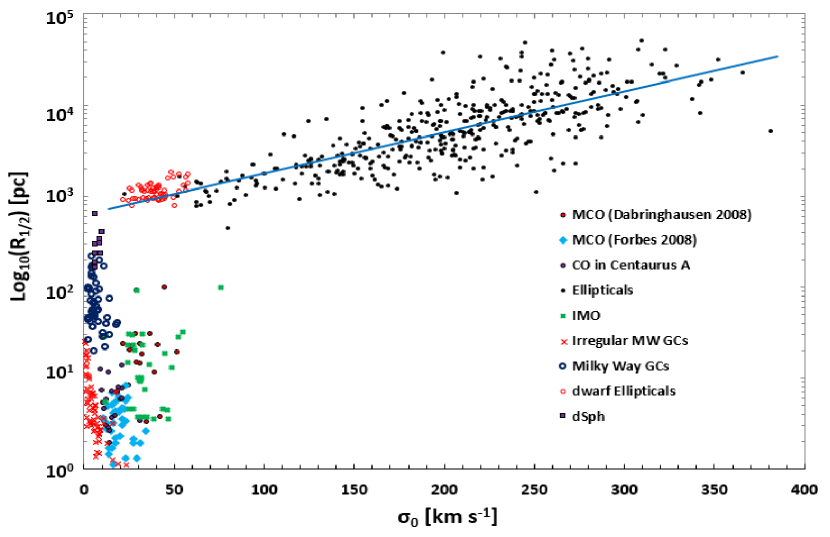
In contrast to the F-J diagram of Fig. 11, Fig. 12 is a semi-log plot of –. The elliptical and dwarf ellipticals galaxies now form a slowly increasing continuum over approximately two decades of as increases over a range of km sec-1. This is in marked distinction from the other groups of galaxies, where increases by nearly three decades while remains low, never being km sec-1. This contrasting pattern is consistent with the ellipticals containing a black hole core whose mass increases as the velocity dispersion increases, compared with the remaining types of spherical or irregular galaxies which have an absent or low-mass core.
Metz & Kroupa (2007) have shown that modelling tidal dwarf galaxies (TDGs) results in objects that resemble known dSphs after a Hubble time of dynamical evolution. During each close galactic passage, energy is pumped into the dSph leading to an expansion of the satellite, leaving a quasi-stable remnant that matches many of the dSphs of the MW and Andromeda. Such mechanisms may also account for the irregular Milky Way GCs apparent in Fig. 12.
Dwarf ellipticals present another anomaly on the graph, with a gradual break away from the trend line at M⊙. In contrast, their good fit to the rms trend line for ellipticals in Fig. 12 suggests they are a continuation of the ellipticals, and reexpansion after mass loss (either by a supernova-driven wind or by ram-pressure stripping) may account for their anisotropic velocity dispersions. Alternately, the proto-systems from which dwarf ellipticals formed might not have isotropized their velocity dispersions due to very low initial density and, in consequence, a low collision rate within the molecular cloud system (Bender et al., 1992).
5 Discussion
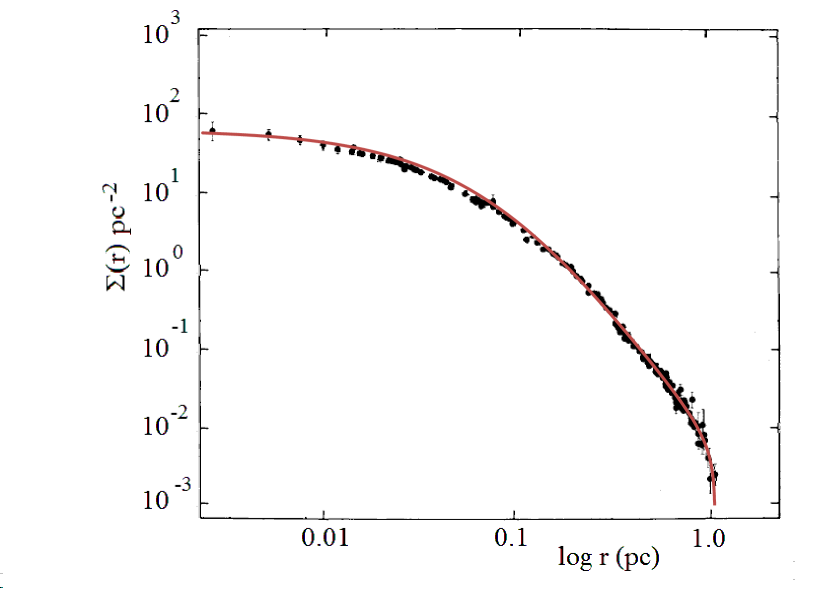
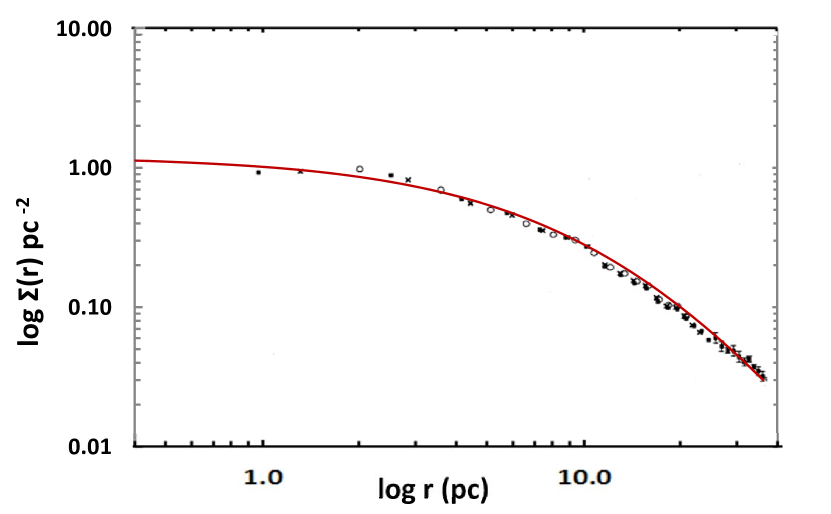
This paper presents an idealised model for a typical GC to reach stability from the time of its formation from an initially uniform state before its separation from the expanding Universe. The velocity-radius relationship was plotted, and the resulting log-log surface density-radius curves compare well with observations for two typical GCs. Given the velocity dispersion and half-light radius, the model enables the dynamical mass to be computed, and the model was extended to plot this theoretical mass against the half-light radius for 735 spherical objects spanning more than eight decades of mass (Fig. 11).
The absolute age of the Universe is a cosmological limit setting a maximum age to all objects within it. The epoch of decoupling (379,000 years after the Big Bang) sets a further age limit because, apart from the small ripples recently observed in the MWB, the whole Universe was then at a state of equilibrium (Planck Collaboration, 2018). This is uncomfortably close to the ages of some observed components of the Universe, such as some of the oldest GCs, some supermassive black hole (SMBH) quasars, and some of the oldest stars (Section 1.1), leaving a very short time for them to have condensed from the expanding hot gas field. Gravitational instability then acted upon minor perturbations within this medium, allowed the separation of individual pro-galactic units that went on to collapse through their own self gravity against the background of an expanding universe. This caused the mean separation of galactic centres to continue to increase even as the galaxies themselves contracted in size. Current theory states that the initial separation occurred from the gaseous state after decoupling, but the determined ages of objects such as primordial stars, and the short time available for the collapse of early SMBHs, are consistent with separation beginning within the plasma itself before the era of decoupling, and such differentiation, even at the size of a SMBH, would still be too small to register on the large scale primordial ripples of the CMB.
Whatever the mechanism for the formation of individual galaxies, it is generally accepted that they must have condensed out of a medium that was, at least initially, approximately homogeneous, and that all massive galaxies host a SMBH at their centres. There is also increasing evidence that these SMBHs co-evolved with their host galaxies, with an empirical scaling relation between the SMBH mass and galaxy properties such as the stellar velocity dispersion (Asmus et al., 2020). Disc galaxies appear to have a universal spin parameter (Binney & Tremaine, 2008; Marr, 2015, 2020). However, if disc galaxies obtained their angular momentum early in their evolution, this may have been greater than they could sustain. They could then attain a stable spin by removing both mass and angular momentum from the primary disc, leading to the ejection of a number of distinct and separate orbiting satellite galaxies, including GCs and dSphs (Marr, 2020), implying that these GCs are coequal in age to their massive parent proto-disc galaxies.
Modelling globular clusters suggests they attain a stable final maximum radius that is universally times their initial radius at the epoch of galactic separation with a predicted density and velocity distribution that match observational data reasonably well, and it is demonstrated that the ratio of mean separation distance:galactic radius is a constant for a given epoch, with a plausible present day value. These may contain DM to without requiring DM halos or modification to Newtonian gravitation.
A number of theoretical predictions suggest the existence of DM to make up missing mass both from the universe and from within galaxies, and the model presented in this paper does not preclude the existence of DM in GCs, but it does suggest that the distribution of any DM follows the distribution of the observed stellar masses. It is not the purpose of this paper to consider missing DM candidates or their detailed behaviour; however, it is proposed that any DM particles will be gravitationally bound by their own GC or galaxy. Within a GC, such particles will behave as the ’particles’ of the star systems, i.e. they will exchange potential for kinetic energy as they move towards the centre under gravity, and they will gravitationally react with other particles to exchange momentum in an elastic, non-dissipative manner to reach thermal equilibrium. With the congregation of more massive objects towards the centre, the DM may be confined to a thin, undetected DM halo which would increase the effective radius of the GC.
References
- Alexander & Natarajan (2014) Alexander T., Natarajan P., 2014, Science, 345, 1330
- Asmus et al. (2020) Asmus D., et al., 2020, MNRAS, 494, 1784
- Baratpour & Khodadadi (2012) Baratpour S., Khodadadi A., 2012, J. Statist. Res. Iran, 9, 115
- Baumgardt & Hilker (2018) Baumgardt H., Hilker M., 2018, MNRAS, 478, 1520
- Bender et al. (1992) Bender R., Burstein D., Faber S. M., 1992, ApJ, 399, 462
- Binney & Tremaine (2008) Binney J., Tremaine S., 2008, Galactic Dynamics: Second Edition. Princeton U. Press, Princeton N.J.
- Bolzonella et al. (2000) Bolzonella M., Miralles J. M., Pelló R., 2000, A&A, 363, 476
- Bond et al. (2013) Bond H. E., Nelan E. P., VandenBerg D. A., Schaefer G. H., Harmer D., 2013, ApJ, 765, L12
- Chaboyer (2001) Chaboyer B., 2001, in von Hippel T., Simpson C., Manset N., eds, Astronomical Society of the Pacific Conference Series Vol. 245, Astrophysical Ages and Times Scales. p. 162
- Chabrier (2005) Chabrier G., 2005, The Initial Mass Function: From Salpeter 1955 to 2005. Astrophysics and Space Science Library, p. 41, doi:10.1007/978-1-4020-3407-7_5
- Chaisson & McMillan (1999) Chaisson E. J., McMillan S., 1999, Astronomy Today, 3rd edn. Prentice Hall, p. 832
- Chandrasekhar (1942) Chandrasekhar J., 1942, Principles of Stellar Dynamics, 1st edn. Dover Publications, New York, N.Y, p. 313
- Dabringhausen et al. (2008) Dabringhausen J., Hilker M., Kroupa P., 2008, MNRAS, 386, 864
- Deiters et al. (2001) Deiters S., Fuchs B., Just A., Spurzem R., Wielen R., 2001, in Dynamics of Star Clusters and the Milky Way. ASPC Conference Series 228
- Djorgovski & King (1984) Djorgovski S., King I. R., 1984, ApJ, 277, L49
- Dunham et al. (2014) Dunham M. M., et al., 2014, in Beuther H., Klessen R. S., Dullemond C. P., Henning T., eds, Protostars and Planets VI. p. 195 (arXiv:1401.1809), doi:10.2458/azu_uapress_9780816531240-ch009
- Faber & Jackson (1976) Faber S. M., Jackson R. E., 1976, ApJ, 204, 668
- Forbes et al. (2008) Forbes D. A., Lasky P., Graham A. W., Spitler L., 2008, MNRAS, 389, 1924
- Fromart (2011) Fromart H., 2011, Milky Way Globular Clusters, http://spider.seds.org/spider/MWGC/mwgc.html
- Gerssen et al. (2002) Gerssen J., van der Marel R. P., Gebhardt K., Guhathakurta P., Peterson R. C., Pryor C., 2002, AJ, 124, 3270
- Giesers et al. (2018) Giesers B., et al., 2018, Monthly Notices of the Royal Astronomical Society: Letters, 475, L15
- Graham (2013) Graham A. W., 2013, Elliptical and Disk Galaxy Structure and Modern Scaling Laws. Springer Netherlands, p. 91, doi:10.1007/978-94-007-5609-0_2
- Hansen et al. (2002) Hansen B. M. S., et al., 2002, ApJ, 574, L155
- Harris (1996) Harris W. E., 1996, AJ, 112, 1487
- Hinshaw et al. (2009) Hinshaw G., et al., 2009, ApJS, 180, 225
- Hirashita et al. (1998) Hirashita H., Takeuchi T. T., Tamura N., 1998, The Astrophysical Journal, 504, L83
- Hut (1997) Hut P., 1997, Complexity, 3, 1
- Jimenez (1998) Jimenez R., 1998, Proceedings of the National Academy of Sciences, 95, 13
- King (1962) King I., 1962, AJ, 67, 471
- Lehnert et al. (2010) Lehnert M. D., et al., 2010, Nature, 467, 940
- Marr (2015) Marr J. H., 2015, MNRAS, 453, 2214
- Marr (2020) Marr J. H., 2020, Galaxies, 8, 12
- Mateo et al. (1993) Mateo M., Olszewski E. W., Pryor C., Welch D. L., Fischer P., 1993, AJ, 105, 510
- McNamara et al. (2004) McNamara B. J., Harrison T. E., Baumgardt H., 2004, The Astrophysical Journal, 602, 264
- Metz & Kroupa (2007) Metz M., Kroupa P., 2007, MNRAS, 376, 387
- Miller & Scalo (1979) Miller G. E., Scalo J. M., 1979, ApJS, 41, 513
- NASA & ESA/Hubble (2020) NASA ESA/Hubble 2020, Messier 53, http://spacetelescope.org/images/potw1140a/
- Newell et al. (1976) Newell B., Da Costa G. S., Norris J., 1976, ApJ, 208, L55
- Oesch et al. (2016) Oesch P. A., et al., 2016, ApJ, 819, 129
- Planck Collaboration (2016) Planck Collaboration 2016, A&A, 594, A13
- Planck Collaboration (2018) Planck Collaboration 2018, arXiv e-prints, p. arXiv:1807.06209
- Salpeter (1955) Salpeter E. E., 1955, ApJ, 121, 161
- Schmidt et al. (1995) Schmidt M., Schneider D. P., Gunn J. E., 1995, AJ, 110, 68
- Smail (2020) Smail I., 2020, The Hertzsprung-Russell Diagram of a Globular Cluster, http://community.dur.ac.uk/ian.smail/gcCm/gcCm_summ.html
- Talpur (1997) Talpur J., 1997, A Guide to Globular Clusters, https://www.astro.keele.ac.uk/workx/globulars/globulars.html
- Wolf et al. (2010) Wolf J., Martinez G. D., Bullock J. S., Kaplinghat M., Geha M., Muñoz R. R., Simon J. D., Avedo F. F., 2010, MNRAS, 406, 1220
- Woods et al. (2019) Woods T. E., et al., 2019, Publ. Astron. Soc. Australia, 36, e027