LOW ALBEDO SURFACES OF LAVA WORLDS
Abstract
Hot super Earths are exoplanets with short orbital periods ( 10 days), heated by their host stars to temperatures high enough for their rocky surfaces to become molten. A few hot super Earths exhibit high geometric albedos ( 0.4) in the Kepler band (420-900 nm). We are motivated to determine whether reflection from molten lava and quenched glasses (a product of rapidly cooled lava) on the surfaces of hot super Earths contributes to the observationally inferred high geometric albedos. We experimentally measure reflection from rough and smooth textured quenched glasses of both basalt and feldspar melts. For lava reflectance values, we use specular reflectance values of molten silicates from non-crystalline solids literature. Integrating the empirical glass reflectance function and non-crystalline solids reflectance values over the dayside surface of the exoplanet at secondary eclipse yields an upper limit for the albedo of a lava-quenched glass planet surface of 0.1. We conclude that lava planets with solid (quenched glass) or liquid (lava) surfaces have low albedos. The high albedos of some hot super Earths are most likely explained by atmospheres with reflective clouds (or, for a narrow range of parameter space, possibly Ca/Al oxide melt surfaces). Lava planet candidates in TESS data can be identified for follow-up observations and future characterization.
1 Introduction
With over 4000 exoplanets discovered to date111https://exoplanetarchive.ipac.caltech.edu/docs/counts_detail.html, exoplanet research is moving towards characterizing classes of exoplanets. The pioneering Kepler telescope transformed our understanding of exoplanets with discoveries of new planet categories and planetary systems. Some of Kepler’s discoveries include: terrestrial-sized planets are common; mini Neptunes/super Earths are the most common planet size; and compact multiple planet systems. In this work we pursue hot super Earths.
Super Earths are a subset of the exoplanet population with masses of 110 M⊕. The term super Earth used in this context refers to a primarily rocky planet without a significant envelope (Seager et al., 2007). Hot super Earths are exoplanets with short orbital periods ( 10 days) that are strongly irradiated by their host stars, which leads to high surface temperatures. Because temperatures on some hot super Earths are high enough for their rocky surfaces to become molten, hot super Earths can be further categorized into lava-ocean planets (Léger et al., 2009, 2011).
Lava-ocean planets are compelling to study for the insight they provide into the behaviors of materials at extreme temperatures, volatile cycling, and Earth’s early history.
1.1 Lava-Ocean Planets
Lava-ocean planets are short period ( 10 days), rocky planets (Rp 1.6 R⊕)(Rogers, 2015) that are expected to be tidally locked, and have their orbits circularized by tidal interactions due to their close proximity to their host stars.
Lava-ocean planets have been previously theorized. The first two potential lava-ocean planets were Kepler-10 b (Rp = 1.47 R⊕, P = 0.8374907 days) (Dumusque et al., 2014) and CoRoT-7 b (Rp = 1.58 0.1 R⊕, P = 0.85359 days) (Léger et al., 2011).
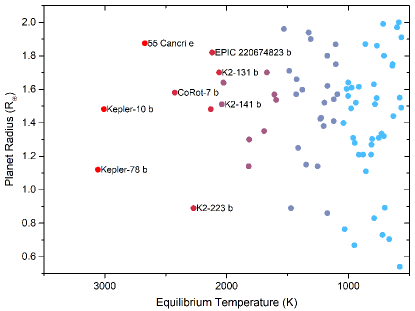
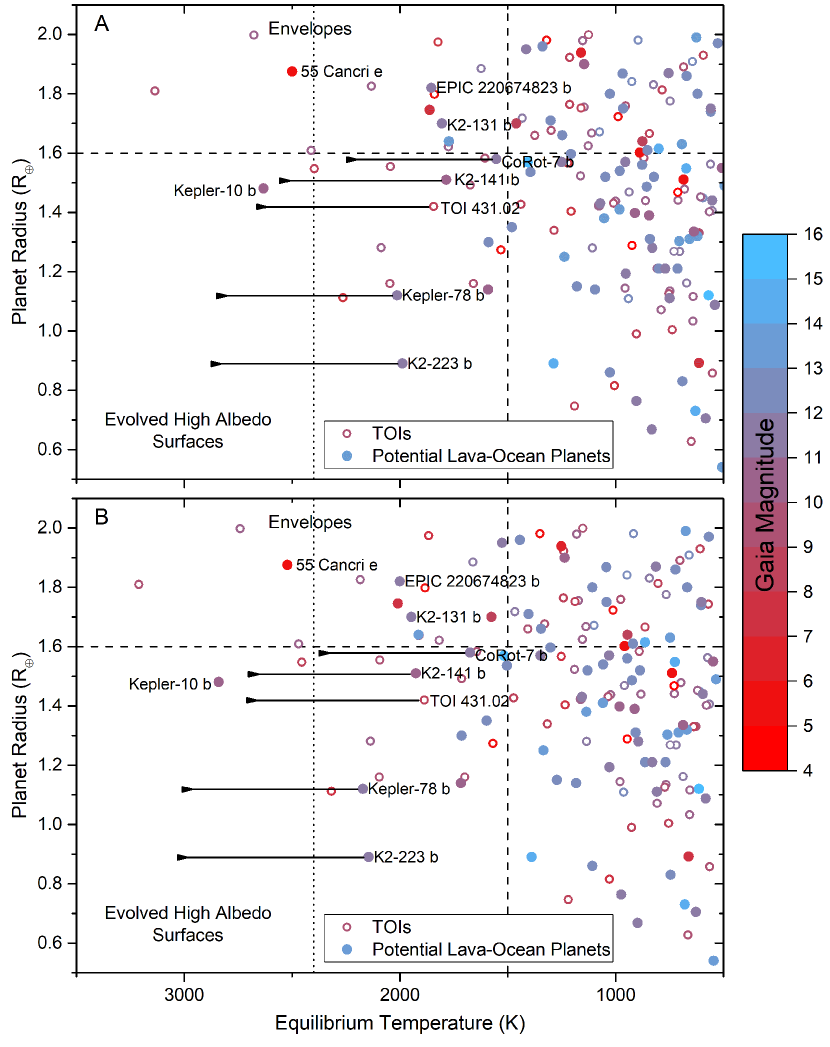
Lava-ocean planets are expected to have cloudless, low pressure atmospheres consisting of rocky vapors, large day-night temperature differences, and an ocean of molten refractory rocks on the strongly irradiated dayside of the planet (Léger et al., 2011). Surface temperatures on lava-ocean planets must be greater than 850 K in order to sustain the molten lava ocean on the dayside hemisphere, assuming a planetary crust composition similar to Earth222Assuming an Earth-like crustal composition, the lower limit of 850 K on the surface temperature of lava-ocean exoplanets is related to the melting points of silicate rocks on Earth. Silicate rocks begin melting at 850 K, and all silicate rocks are molten above 1473 K (Lutgens et al., 2014).. Currently known lava-ocean planet candidates are shown in Figure 1.
1.2 Secondary Eclipse Measurements
Secondary eclipse measurements are the best way to identify and characterize lava-ocean planets in the near future. Due to their close proximity to their host stars, short-period exoplanets receive large amounts of incident stellar flux which increases their detectable reflected and thermal emission, making them particularly well-suited to secondary eclipse measurements. Short orbital periods also enable several eclipses to be captured within a short observing time frame (Alonso, 2018).
Indeed, a few potential lava-ocean planets show a significant secondary eclipse signal. For some planets, the signal is interpreted as a high geometric albedo in the Kepler band (420900 nm). The hot super Earths considered have median geometric albedos ranging from 0.16 to 0.30 (Demory, 2014). Further, there are a small number of exoplanets including Kepler-10 b and Kepler-21 b that have geometric albedos 0.4 (Batalha et al., 2011; Demory, 2014).
A degeneracy exists between reflected light and thermal emission when interpreting broadband observations of the secondary eclipse depth of short period exoplanets. The total planetary flux, , is a combination of thermal emission and reflected light. The reflected light component of the secondary eclipse depth is given by:
| (1) |
where is the stellar flux, is the geometric albedo, is the planet radius, is the semi-major axis/orbital distance, and is the phase function (Section 2.3).
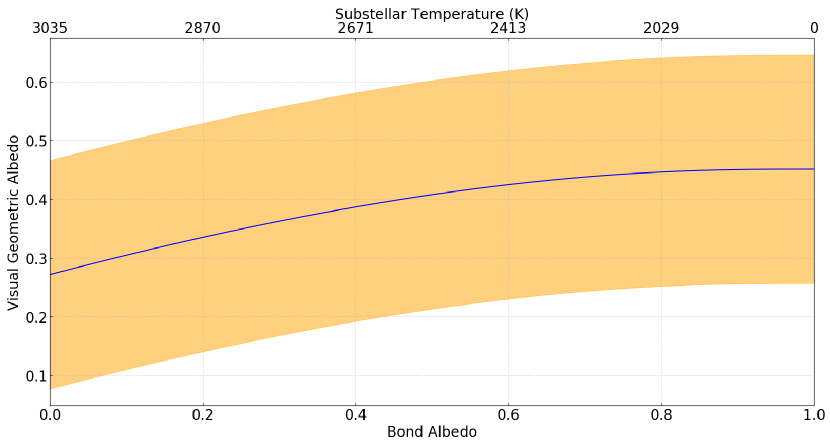
Lava-ocean exoplanets and other short period planets are typically heated to temperatures of 10003000 K, which causes an observable thermal flux at visible wavelengths, as well as a reflected light component. This leads to a range of geometric albedos and planet substellar temperatures that could result in the measured secondary eclipse depth (Figure 2).
The total planetary flux needs to be decontaminated from thermal emission before calculating the geometric albedo by removing the estimated blackbody thermal emission contribution (Demory, 2014). The thermal emission can be estimated by the blackbody thermal emission contribution:
| (2) |
where is the radius of the star, and and are the blackbody emissions (Planck distribution functions) of the star and the planetary dayside at brightness temperatures of and , respectively (Alonso, 2018).
1.3 Quenched Planetary Glasses as a Possible Source of Reflection
In this study, we aim to determine whether reflection from molten lava and quenched glasses (a product of rapidly cooled lava) on the surfaces of hot super Earths may be sources of reflected light that contribute to the high geometric albedos.
Quenched glasses, more specifically silicate glasses, are amorphous phases naturally formed through volcanism and hypervelocity impacts. A study by Cannon et al. (2017) measured VNIR spectra of synthetic glasses with different compositions. A small subset of the synthetic glasses formed under extremely low oxygen conditions and containing little/no iron had reflectance values as high as 75% at certain visible wavelengths. If cooled rapidly in relation to wind action, quenched glasses can have a very smooth texture, motivating us to consider reflection from their surfaces.
Lava-ocean exoplanets are assumed to have low pressure atmospheres with little to no volatile species (e.g. H, C, N) due to their close proximity to their host stars, which results in effective atmospheric stripping. Due to the low pressure atmosphere, we assume a steep temperature gradient on these planets, i.e., there is a rapid decrease in temperature as distance increases outward from the substellar point.
We assume that the planetary crust is melted to form lava at the substellar point. As the lava flows away from the substellar point, it rapidly cools to form quenched glass. We aim to measure the reflectivity of quenched glasses to determine if it significantly contributes to the high geometric albedos of some hot super Earths.
In Section 2, we describe our quenched glass sample preparation, experimental method to measure reflection from quenched glasses, and model the geometric albedo on the dayside hemisphere of the exoplanet. In Section 3, we present our experimental data, model fit results, and calculated geometric albedo values for reflection from lava and quenched glasses on the planetary surface. In Section 4, we discuss several topics including: reflectance simulations to support our experimental albedo estimates; the implications of our results for lava and quenched glasses as sources of reflection on lava-ocean exoplanets; how quenched glasses formed under lava-ocean exoplanet conditions may differ from the quenched glasses in this study; a description of other potential high albedo surfaces; and reflection in the atmospheres of hot super Earths. We discuss the challenges involved in measuring reflection from molten lava in the laboratory, and conclude with a description of the possibilities of lava-ocean planet candidates in TESS data for future characterization.
2 Methods
We describe our sample preparation procedure and experimental setup, and outline our model calculations.
2.1 Sample Preparation
Our samples of quenched glass were obtained by melting crushed basalt rock and soda feldspar powder, and allowing the melts to rapidly cool in air.
The basalt rock starting material used is ancient basalt (1.2 billion years old) from lava flows that were erupted in the Mid-Continent Rift, sourced from the Chengwatana Formation in Dresser Trap Rock Quarry, Wisconsin (Wirth et al., 1997). The feldspar starting material used is 200 mesh soda feldspar from Spruce Pine, North Carolina (Table 1).
| wt. % | Basalt | Feldspar |
| SiO2 | 49.03 1.77 | 68.60 6.52 |
| Fe2O3 | 14.82 1.15 | 0.06 0.002 |
| Al2O3 | 14.50 0.91 | 18.50 1.04 |
| Na2O | 2.93 0.97 | 6.50 0.60 |
| K2O | 1.07 0.47 | 4.10 0.25 |
| CaO | 8.24 0.95 | 1.50 0.15 |
| MgO | 5.52 1.14 | |
| MnO | 0.20 0.02 | |
| FeO | 0.00 | |
| P2O5 | 0.26 0.07 | |
| Cr2O3 | 0.02 0.01 | |
| TiO2 | 2.19 0.42 | |
| LOI* | 1.93 0.81 | 0.30 |
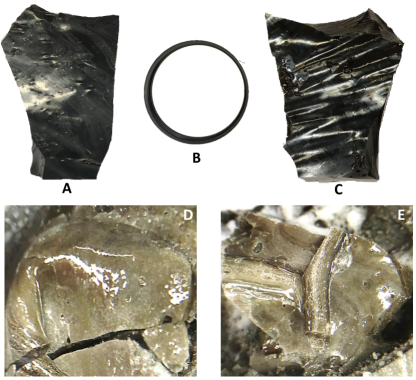
The basalt rock was melted in a blast furnace at 1200∘C at the Syracuse University Lava Project333http://lavaproject.syr.edu/making-lava/making.html. The melt was poured onto a dry sand slope outdoors and allowed to cool for 10 minutes in air. The rough textured basalt quenched glass formed by the melt running down the slope and exposure to wind before the melt solidified, creating the ripples in the glass (Figure 3, C). The smooth glass is the back of the rough glass sample, which was not subaerially exposed (Figure 3, A).
The feldspar powder was heated to 1300-1500∘C in a graphite crucible in an Inductotherm induction furnace444Merton C. Flemings Materials Processing Laboratory, MIT for 30 minutes to produce the molten rock/lava. The viscous feldspar melt was allowed to cool for 10 minutes in air to produce a smooth textured quenched glass sample (Figure 3, D). The rough textured feldspar quenched glass was created by streams of viscous melt poured over a flat, smooth layer of feldspar melt (Figure 3, E).
2.2 Experimental Determination of Reflection from Quenched Glasses
We conducted reflectance measurements on our quenched glass samples obtained from melting crushed basalt rock and soda feldspar powder (Figure 3). Reflectance measurements were performed on both the rough and smooth glass textures in order to determine whether surface roughness had a quantifiable effect on the reflectivity of the glasses.
The glass samples were illuminated by a 25 W white LED light source, allowing reflection from the samples to be measured across the visible spectrum (400 700 nm).
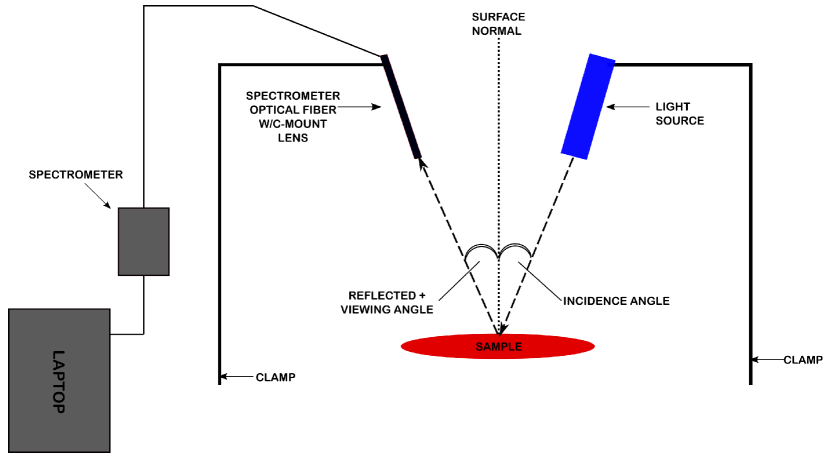
We designed our experimental setup to measure reflection along the specular reflection direction from both compositions of our rough and smooth glass samples. Specular reflection occurs when the angle of incidence of the incoming light is equal to the angle of reflection from the surface of interest, as measured from the surface normal, the incident and reflected directions are in the same plane, and on opposite sides of the surface normal. At secondary eclipse, the incidence angle and reflected angle are equal, but this is not specular reflection, as only the first of the three conditions is met. However, we measured reflectance at the specular reflection angle because it is easiest to measure and gives us an upper limit on the reflectance from the quenched glass samples, assuming that the specular reflection component is stronger than the retroreflective component. We then used the geometric albedo equation from SOBOLEV (1975) to get an upper limit on the planetary geometric albedo (Section 2.3, equation (9)). For more elaborate modeling, we used a Phong specular reflectance model to translate the reflectance measured in the specular direction into the reflectance measured in the direction a telescope would measure the reflectance from an exoplanet by multiplying the reflectance coefficient with a power of the cosine of the angle between the incident ray and the specular ray (see Section 4.1).
Though our experimental setup was designed to measure reflection along the specular reflection direction, reflection from most surfaces is always a combination of both specular and diffuse reflection, hence, the reflectance value we measure is a combination of specular and diffuse reflection.
We used an ASEQ instruments LR1 broad spectral range spectrometer (3001000 nm) to measure the reflected counts (intensity when calibrated) from quenched glass samples illuminated by the white LED light source. In order to calculate the reflectivity/albedo of a material, the reflected counts from the material must be divided by the reflected counts from a reference standard a material of known reflectivity illuminated by the same light source, under the same conditions. This results in a relative reflectivity value for the material. Multiplying the relative reflectivity by the known reflectivity of the reference standard yields the absolute reflectivity value of the material. We used a 99% white reflectance standard as our reference standard (Figure 3, B).
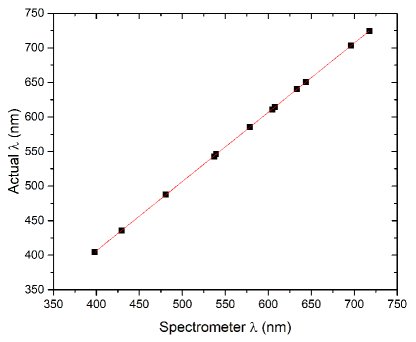
We calibrated the wavelength scale of the spectrometer in order to identify how the spectrometer shifts spectral lines. We used a fluorescent ceiling lamp, a TMN-2 crater point vacuum tube, and an INS-1 neon cold cathode vacuum tube lamp to cover the visible wavelength range for calibration. Using the NIST Atomic Spectra Database555https://www.nist.gov/pml/atomic-spectra-database, we identified the true wavelengths, , of the highest intensity spectral lines from the calibration sources with those wavelengths identified by the spectrometer, (Figure 4). We fit a linear function (1 uncertainties on parameter values) to the wavelength shift by the spectrometer:
| (3) |
The spectrometer optical fiber was attached to a 6-15 mm 1/3” F1.4 C-mount varifocal lens to spatially limit the reflected light entering the fiber. We focused the fiber collecting area on the glass samples illuminated by the center of the light beam for maximum incident intensity. The spectrometer fiber and light source were clamped and attached to support stands 45 cm above the work surface (Figure 5). The clamps can be rotated 360∘.
The spectrometer fiber and light source were clamped at the same angle with respect to the surface normal, so that the angle of incidence was equal to the viewing angle, in order to measure reflected light along the specular reflection direction. The incidence angle (and viewing angle) were varied from 0∘ to 60∘ in 5∘ increments, and reflected counts were measured at each angle for the rough glasses, smooth glasses and reference standard. The experiments were repeated three times.
The wavelength calibration was first applied to the reference standard and quenched glass data. The reflected counts were binned in 10 nm intervals in order to reduce the noise in the data. The reflected counts from the glass samples were divided by the reflected counts from the reference standard at the corresponding incidence angle and the reflectance/reflection coefficient value (Section 2.3) was calculated for each incidence angle. Finally, the spectrally-resolved reflectance measurements were averaged across the visible wavelength range (400700 nm) corresponding to the wavelength range of the white LED light source, and to compare to inferred albedo values from exoplanet observations (see Appendix). We assumed that the incidence angle, reflected angle and viewing angle were all equal, and plot average reflectance as a function of the cosine of the reflected angle (Figures 710).
2.3 Model
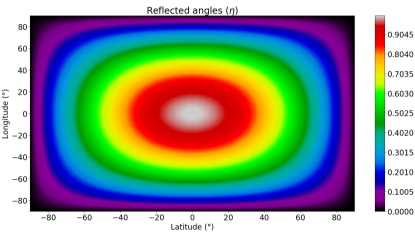
To find the total energy emerging from the exoplanet in the direction of the observer, we integrate over the visible portion of the planet - the dayside hemisphere - such that:
| (4) |
where is the reflection coefficient, is the cosine of the reflected angle, is the cosine of the incidence angle, is the azimuthal difference between the reflected and incident rays in the local horizontal plane, is the phase angle, and and are the longitude and latitude on the exoplanet, respectively (SOBOLEV, 1975).
If we consider the exoplanet to reflect light according to Lambert’s law, constant, and at secondary eclipse i.e. (assuming the planet is directly behind the star):
| (5) |
where is the phase function (SOBOLEV, 1975).
The geometric albedo, , is defined as the ratio of the planetary flux at secondary eclipse to the flux from a Lambert disk of the same cross sectional area. It follows that:
| (6) |
At secondary eclipse (), the reflected angle is equal to the incidence angle (), and . can then be written as:
| (7) |
| (8) |
In our experiments, we aligned our viewing angle in the direction of specular reflection and measure . We approximate by , and calculate the geometric albedo as:
| (9) |
We experimentally measure for our quenched glass samples, assuming the incidence angle, reflected angle and viewing angle are all equal. We fit a model to the data to obtain an equation for as a function of . We integrate the experimentally determined function for over all latitudes and longitudes i.e. all reflected angles on the dayside hemisphere of the planet (equation (9)) to obtain a value for due to rough and smooth, basalt and feldspar quenched glasses.
In order to calculate the geometric albedo of a planet with a combination of lava and quenched glass on the surface, we surveyed non-crystalline solids literature for specular reflectance values from molten silicates as a proxy for specular reflectance values for lava. Specular reflection values from molten silicates were measured at an incidence angle of 0∘ and have an average reflectance of 0.15 for compositions with major oxide proportions most similar to our basalt quenched glass sample’s composition (Zebger et al., 2005). The planet geometric albedo was calculated by varying the amounts of lava and quenched glass on the surface according to:
| (10) |
where represents the extent/amount of lava or glass on the surface based on regions of on the planet surface (Figure 6), is our experimentally determined reflection coefficient function for different quenched glasses, and 0.15 is the constant reflection coefficient for lava from non-crystalline solids literature. The integral is structured such that we assume lava originates at the substellar point and quenches to glass as the distance increases radially outward from the substellar point, and the quenched glass extends to the poles. When , there is an all lava dayside surface, and when , there is an all quenched glass (basalt or feldspar, rough or smooth) dayside surface.
We assume plane-parallel rays of incident light for lava-ocean planets however, for extremely close-in exoplanets like Kepler-10 b and CoRoT-7 b, incident light from the host star is in the finite angular size regime.
For plane-parallel incident light, the exoplanet is illuminated evenly into a dayside that comprises one hemisphere (50% of the planet surface) and a nightside. For extremely close-in exoplanets, the finite angular size of the star determines “illumination zones” on the planet surface a fully-illuminated zone and a penumbral zone on the dayside, and a nightside. The dayside of the planet will be 50% of the surface, and different reflected luminosities will be observed for the fully-illuminated zone and penumbral zone (Carter, 2019).
The difference in reflected luminosity between the fully-illuminated zone and penumbral zone is 18% (14 ppm) at secondary eclipse (Carter, 2019). The maximum photometric precision of Kepler and TESS are approximately 29 ppm and 60 ppm respectively (Gilliland et al., 2011; Ricker et al., 2014), hence the luminosity difference between the plane-parallel and finite angular size regimes is not detectable with current telescopes.
3 Results
We find that reflection from samples of rough and smooth quenched glass results in low planetary geometric albedos: 0.09 for basalt quenched glass, and 0.02 for feldspar quenched glass. Using specular reflectance values from molten silicates as a proxy for specular reflectance values for lava also results in low planetary geometric albedos ( 0.1).
3.1 Planetary Albedo: Quenched Glass
We consider two end-member quenched glass compositions derived from basalt (mafic) and feldspar (felsic) lavas. We find the albedo of a planet dayside surface covered entirely in rough or smooth basalt quenched glass is 0.09, and the albedo of a planet dayside surface covered entirely in rough or smooth feldspar quenched glass is 0.02.
The quenched glass reflectance data, measured along the specular reflection direction, are a natural combination of specular and diffuse reflection. The absolute specularity of the quenched glasses cannot be determined from the data because the angle between the specularly reflected ray and viewing angle is unconstrained. We model specular reflection and attempt to quantify the specularity of the quenched glasses in Section 4.1.
Reflection from quenched glasses has the greatest contribution to reflectance at small incidence angles ( 20∘) and has a negligible contribution when considered over the entire planet, even if the observer is aligned with the specular reflection direction. We find that reflectance does not vary significantly as a function of wavelength across the visible wavelength range, the shape of the reflectance curves do not change appreciably with incidence angle, and the amplitude of the reflectance curve decreases with increasing incidence angle (Figure A1).
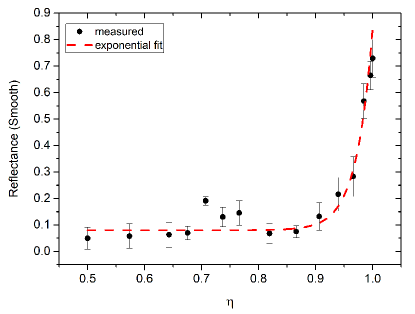
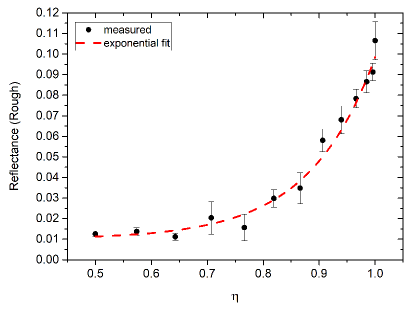
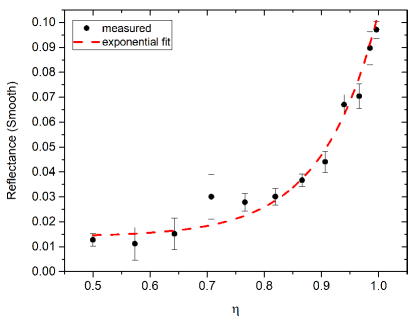
Surface roughness does not change our results away from a low planetary albedo. The fact that specular reflection from a rough surface scatters light into a cone with some angular extent, as compared to a smooth surface that scatters light in a single direction, does not increase the albedo. It is worth noting, however, that for our basalt quenched glass samples, there is a more rapid decrease in reflectance values for the smooth glass sample (Figure 8) and a more gradual decrease in reflectance values for the rough glass sample (Figure 7), because reflection from the rough glass sample can be seen at more angles.
3.1.1 Basalt Quenched Glass
We find the albedo of a planet dayside surface covered entirely in rough basalt quenched glass is , and smooth basalt quenched glass is . The calculated albedo values are from the model (Section 2.3, equation (9)), with our measured experimental data as input.
The measured experimental data are fitted by an exponential model of the form . An exponential model was chosen to account for the highly directional nature of specular reflection. Specular reflection can only be observed within a narrow range of angles around 0∘ and decays rapidly away from normal incidence, which agrees well with an exponential model. The model fit parameters and 1 uncertainties are shown in Table 2. The resulting planetary geometric albedo was calculated by integrating the exponential model fit to the basalt quenched glass reflectance data over all reflected angles according to equation (9).
| Basalt | R | A | C |
|---|---|---|---|
| Rough | 19.60 4.20 | -1.03 0.01 | 0.066 0.011 |
| Smooth | 35.39 6.06 | -1.008 0.006 | 0.080 0.022 |
Reflectance vs. data (incidence angles 060∘) of the rough basalt glass sample and smooth basalt glass sample are presented in Figure 7 and Figure 8, respectively666When measuring reflectance along the specular reflection direction, the incidence angle and reflected angle are equal so incidence angle () and reflected angle () can be used interchangeably..
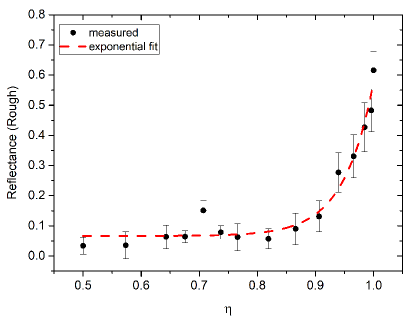
Notably for both our rough and smooth basalt quenched glass samples, there is a small but significant increase in reflectance at 45∘ (Figures 7, 8). The feature is present after multiple measurements and appears to be real. We have no conclusive explanation for the feature but are exploring possibilities related to off-specular reflection due to surface roughness (Torrance & Sparrow, 1967), or microscopic crystalline structure features in the samples.
3.1.2 Feldspar Quenched Glass
We find the albedo of a planet dayside surface covered entirely in rough feldspar quenched glass is , and smooth feldspar quenched glass is . The calculated albedo values are from the model (Section 2.3, equation (9)), with our measured experimental data as input.
The measured experimental data are fitted by an exponential model of the form . The model fit parameters and 1 uncertainties are shown in Table 3. The resulting planetary geometric albedo was calculated by integrating the exponential model fit to the feldspar quenched glass reflectance data over all reflected angles according to equation (9).
| Feldspar | R | A | C |
|---|---|---|---|
| Rough | 8.47 1.05 | -1.29 0.035 | 0.010 0.002 |
| Smooth | 10.12 1.32 | -1.24 0.030 | 0.014 0.003 |
Reflectance vs. data (incidence angles 060∘) of the rough feldspar glass sample and smooth feldspar glass sample are presented in Figure 9 and Figure 10, respectively.
The feldspar reflectance values are consistently low and the decrease in the reflectance values is gradual and inconsistent with the highly directional nature expected of specular reflection, where reflectance values decay rapidly away from normal incidence, as seen in the basalt quenched glass reflectance data (Figures 7, 8).
Both specular and diffuse reflection from quenched glasses, independent of glass composition, results in low planetary geometric albedos. We focus on describing reflectance results along the specular reflection direction, and measurements of diffuse reflection from quenched glasses of different cooled molten silicate compositions in other studies found low reflectance values ( 0.1) at visible wavelengths as well (Zebger et al., 2005; Nowack et al., 2001).
3.2 Planetary Albedo: Lava and Quenched Glass
Lava-ocean planets may have a combination of lava and quenched glass on their surfaces. Here we consider a planet covered in lava as an extreme end-member, as well as mixtures where lava is present near the substellar point and basalt/feldspar quenched glass is present beyond. We find that no matter the surface combination of lava and quenched glass, the dayside geometric albedo is always low, 0.1.
The amount/extent of lava and quenched glass on the surface was varied by varying the integral bound, , on the reflected angle in equation (10). The geometric albedo of a planet with a combination of lava and quenched glass (rough or smooth) on the surface is shown in Figure 11.
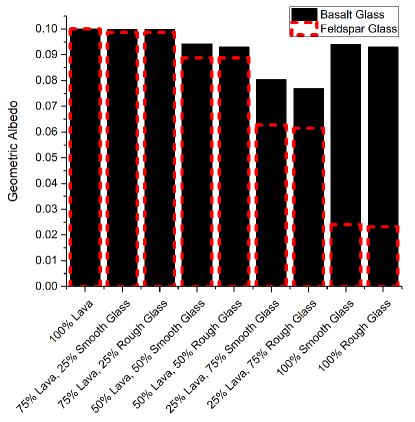
For a planet with a dayside hemisphere completely covered in lava, we find 0.1.
The albedo value for an all-lava planet was obtained from non-crystalline solids literature. Zebger et al. (2005) measured specular reflection from molten silicates, and varied the amounts of CaO, Fe2O3 and SiO2 to create different mixture compositions. We selected a molten silicate composition from Zebger et al. (2005) that was sufficiently similar to our basalt quenched glass composition as a proxy for lava. There were no feldspar equivalent molten silicate compositions so we conservatively assume the same reflectance value for both basalt and feldspar lavas.
The specular albedos are low ( 0.18) for all the molten silicate compositions considered in Zebger et al. (2005) at the measured VIS wavelengths. UV/VIS specular reflection measurements were obtained for the different molten silicate compositions at a single incidence and viewing angle of 0∘.
Since specular reflection from molten silicates was measured at a single angle, there is only one reflectance value for lava, and we had to set the reflection coefficient for lava to be this constant reflectance value ( 0.15). This effectively gives us an upper limit on the albedo of an all-lava dayside surface because we cannot determine the angular dependence of the reflection coefficient for lava.
4 Discussion
We support our results with simulations to constrain the reflectance from lava worlds, and discuss the implications of our results for lava and quenched glasses as sources of reflected light on lava-ocean exoplanets. We describe potential differences between quenched glasses in this study and quenched glasses formed under lava-ocean exoplanet conditions, other potential high albedo surfaces, and discuss reflection in the atmospheres of hot super Earths. We discuss the challenges involved in measuring reflection from molten lava in the laboratory, and conclude the discussion with possibilities of lava-ocean planet candidates in TESS data for future characterization.
4.1 Verification of Albedo Estimates via Reflectance Simulations
We performed simple reflectance simulations using a diffuse reflectance model and a Phong specular reflectance model (Phong, 1975) to verify our experimental quenched glass albedo estimates with regards to the geometric effects arising from extremely close-in lava planets and their host stars (finte angular size regime - Section 2.3).
We find that the difference between assuming plane-parallel incident light and incident light in the finite angular size regime produces a negligible effect on the calculated albedo values.
The Monte Carlo diffuse reflectance model produced albedos within 5% of our experimentally determined basalt quenched glass planetary albedo values (Table 4) by using the same measured reflectance parameters in equation (9). The basalt quenched glass reflectance data are not consistent with purely diffuse reflection, and are a combination of specular and diffuse reflection. The basalt glass data can be approximated by a Phong specular reflectance model with an empirical specular falloff value, , between 1 and 10, and a diffuse reflectance model. Specular reflection from the Phong reflectance model produced albedo values that were 1.6-1.8 times lower than our model values for (Table 4). The smoother the planet surface (i.e. the higher the specularity), the lower the albedo.
The feldspar quenched glass data and planetary albedo values can be approximated by a diffuse reflectance model (Table 4).
| CoRoT-7 b | Diffuse | Phong n=1 | Phong n=10 | Phong n=100 | Phong n=1000 |
| Basalt - Rough | 0.088 | 0.053 | 0.017 | 0.0023 | 0.0002 |
| Basalt - Smooth | 0.099 | 0.057 | 0.020 | 0.0030 | 0.0003 |
| Feldspar - Rough | 0.024 | 0.014 | 0.0037 | 0.0004 | 0.00005 |
| Feldspar - Smooth | 0.024 | 0.013 | 0.0037 | 0.0005 | 0.00005 |
We used Monte Carlo ray-tracing, and modeled the star as a disk where each point on the star has an equal probability of emitting a ray in the direction of the planet. No limb darkening was used. The observer was considered to be a disk with the same diameter as the planet, situated infinitely far away from the planet, with its surface normal directed towards the planet.
The quenched glass experimental albedo datasets were interpreted as the flux measured by the observer from the quenched glass sample () divided by the flux of a reference standard () placed at the same geometry, such that:
| (11) | |||
| (12) |
where is the measured reflectance, is the angle of incidence (angle between the planet surface normal and the ray connecting it with the point on the surface of the star), and is the incident light intensity.
We calculated the intensity of each ray reaching the observer based on both a Phong specular reflectance model and a diffuse reflectance model.
For specular reflectance, we calculate the specular intensity, , of a ray from the measured data using the Phong model (Phong, 1975) as:
| (13) |
where is the observer angle (angle between the observer ray and the surface normal), and is an empirical parameter specifying specular falloff (the larger the value of n, the smoother/shinier the surface). We varied the values of (between 1 and 1000) and to constrain the value of .
| (14) |
For diffuse reflectance, we calculated the intensity, , as:
| (15) | |||
| (16) |
4.2 Difference in Reflectivity of Basalt and Feldspar Quenched Glasses
Our feldspar quenched glass had lower albedos than our basalt quenched glass by 7%. The difference in reflectivity between the glasses can be attributed to the compositional differences between the materials used to produce the glasses. Basalt and feldspar rock powders were chosen to represent end-member mafic and felsic lavas respectively.
A possible explanation for the low reflectivity of our feldspar quenched glasses is the formation of the quenched glass crust. The viscosity of the melt/lava affects the formation of quenched glass. Felsic materials are silica rich ( 65% by weight), have lower melting points (1100 K) compared to silica poor/mafic materials ( 55% by weight; 1500 K melting point), and form highly viscous melts. Felsic materials are also light in color as compared to mafic materials due to their enrichment in potassium, sodium and aluminum (mafic materials are enriched in iron, calcium and magnesium) (Pidwirny, 2006).
The felsdpar powder used in our experiment resulted in a viscous melt containing large gas bubbles which disrupted the initial quenched glass crust that had formed by forcing molten material below to push through the crust. The disruption of the quenched glass crust formed over the feldspar melt could have slowed melt cooling, which may have resulted in partial solidification of the melt through crystallization rather than quenching (Griffiths, 2000). Crystallization affects surface roughness and could have reduced the reflectivity of the feldspar quenched glass.
The bubbles present in the feldspar quenched glass likely formed from H2O, CO2 or other organic gases present in the starting material.
4.3 Earth Experiments vs. Exoplanet Conditions
The quenched glasses produced in this study were at Earth’s surface pressures and atmospheric composition, and it is worth noting how quenched glasses formed under conditions on lava-ocean exoplanets may differ.
Lava-ocean exoplanets are expected to have low pressure atmospheres and hence low oxygen partial pressures (p). While volatile elements such as H, C, and S are expected to be lost from the atmosphere, mineral vapor atmospheres consisting of Na, K, O2, O, SiO etc. have been theorized on hot super Earths (Schaefer & Fegley, 2009; Ito et al., 2015).
Cannon et al. (2017) showed that quenched glass composition and p formation conditions strongly affect reflectance. At higher p, Fe3+ content increases and reflectance decreases due to the Fe2+-Fe3+ charge-transfer band (600 nm) absorption strength increasing (Nowack et al., 2001; Zebger et al., 2005; Cannon et al., 2017). An increase in log(p) by 4 units can decrease glass reflectance values by 15% at visible wavelengths (Cannon et al., 2017). Composition differences between glasses, particularly transition metal content (Fe and Ti have strong absorption features), can increase/decrease reflectance values by 10-50% (Cannon et al., 2017).
Although a small subset of glasses from Cannon et al. (2017) formed under extremely low oxygen conditions and containing little/no iron had high reflectance values, the glasses were synthetic and the conditions and composition of the synthetic glasses are unlikely to be the same on hot super Earth exoplanets when factoring in planet size, planet formation conditions etc. (Kite et al., 2016). Without observed spectra of hot super Earth atmospheres/surfaces, we cannot rule out a lack of oxygen in the atmosphere or iron on the surface. Cannon et al. (2017) notes that efforts should be made to use realistic glasses for a given planetary body, which we have attempted to do by using naturally occurring materials to create the quenched glasses in this study.
The reflectance values of molten silicates from non-crystalline solids literature (Nowack et al., 2001; Zebger et al., 2005) used as proxies for molten lava have substantial Fe2O3 content, and lavas with lower/higher total oxidized Fe content will have different reflectance values than the average value used in this study for molten silicates.
Earth’s atmosphere is highly oxidizing and basaltic quenched glasses produced in air can have Fe3+ values as high as 60% (Cannon et al., 2017). In contrast, quenched glasses formed in highly reducing atmospheres e.g. the Moon or Mercury, contain little or no Fe3+ (Cannon et al., 2017). Hot super Earth p levels can vary depending on the initial Fe2+/Fe3+ ratio of the planet, and atmospheric escape which can increase or decrease p levels depending on whether oxygen is concentrated in or removed from the atmosphere. Quenched glasses formed under lower p conditions (hence with lower Fe3+ content) on hot super Earths could have higher reflectance values than the quenched glasses produced in this study. Though the Fe2+/Fe3+ ratio of hot super Earths is unknown, it would indeed affect the reflectivity of quenched glasses formed on hot super Earths, producing glasses with higher/lower reflectance values than the quenched glasses in this study.
While quenched glasses formed on hot super Earths may have higher reflectance values than the quenched glasses in this study, we expect a 15-20% increase in reflectance values which will still result in low albedos ( 0.22 for basalt quenched glass and 0.16 for feldspar quenched glass) and not change the overall result of this study.
4.4 Evolved High Albedo Surfaces
We have shown that basalt and feldspar surfaces of molten lava or quenched glass have low albedos. Beyond these mafic and felsic surface compositions, there are a specific but narrow set of initial conditions that may lead to evolved high albedo surfaces composed of Ca/Al oxides (Kite et al., 2016). For completeness, we present a summary of the concept.
A hot super Earth’s surface may evolve due to fractional vaporization of melt on the surface, with winds removing the volatiles to the planet night side or out to space. As the more easily vaporized material is stripped away, less volatile but still molten crustal material remains. The final evolved surface composition results from a competition between the rate at which the volatiles are removed from the dayside of planet compared to the rate of mass recycling between the melt pool and solid interior (Kite et al., 2016).
Kite et al. (2016) finds a scenario that may lead to a high albedo molten surface. For substellar temperatures 2400 K, atmospheric transport dominates over melt pool overturning and the melt pool surface composition evolves away from bulk pool composition and leads to CaO-Al2O3 molten surfaces with geometric albedos of 0.5 (Rouan et al., 2011). Note that for planets with substellar temperatures 2400 K, melt-pool overturning circulation dominates over atmospheric transport of volatiles, and the melt pool surface composition is similar to the bulk pool composition. Rocky planets that may have CaO-Al2O3 molten surfaces include Kepler-10 b, Kepler-78 b and CoRoT-7 b (Figure 12).
One more controlling factor in the creation of evolved CaO-Al2O3 molten surfaces relates to the initial planetary bulk-silicate FeO concentration. High initial FeO concentration promotes stratification, which hinders overturn, making evolved molten CaO-Al2O3 surfaces more likely (Kite et al., 2016).
4.5 Reflection in Exoplanet Atmospheres
Atmospheres with reflective clouds may explain the high geometric albedos of some hot super Earths, provided the atmospheres have not been eroded.
A variety of atmospheric compositions have been proposed for hot super Earths, including CO and N2, which are stable against dissociation at high temperatures (Angelo & Hu, 2017). Once all atmospheric volatiles have been removed, the silicate surface composition of the planet dictates the composition of the thin-silicate atmosphere that forms. High opaque cloud layers are predicted, primarily consisting of alkali metals and silicon oxides (e.g. Schaefer & Fegley (2009); Miguel et al. (2011); Ito et al. (2015); Kite et al. (2016)).
Clouds consisting of alkalis and silicon oxide particles in the atmospheres of hot super Earths may result in high geometric albedos if the particles are smaller than the wavelength of the incident light. For spherical particles, scattering properties are determined mainly by the size of the particles and, to a lesser extent, their chemical composition. A particle’s relative size (small/large) is dependent on the wavelength of light incident on the particle. As a particle becomes more forward scattering, the geometric albedo decreases. In general, large cloud particles (particle radius ) correspond to lower geometric albedos (Pierrehumbert, 2010).
4.6 Experimental Measurements of Specular and Diffuse Reflection From Molten Lava
In order to confirm the low albedo result for lava and quenched glass planetary surfaces, the reflection coefficient function for lava must be measured for multiple incidence and viewing angles. The bidirectional reflectance distribution function (BRDF) defines the surface reflection of light from a material. It is a function of the incident light direction and viewing direction, parametrized by the azimuth angle and zenith angle of both directions in a hemisphere (Hapke, 1981). The functional form of the BRDF of a material captures the specular and diffuse reflection components of the material.
BRDF measurements of our quenched glass samples were not deemed necessary because reflection along the specular reflection direction gives us an upper limit on the reflectance from the quenched glass samples at secondary eclipse, which is the aim of this study. This allowed for a simpler experimental setup, more repeatable experiments, and required a significantly smaller number of individual measurements, also making data representation more concise.
Measuring the albedo of molten lava requires several engineering challenges to be overcome. These challenges include: keeping lava molten and preventing a quenched glass crust from forming; efficiently obtaining several reflectance measurements of the molten lava at different incidence and viewing angles; and keeping the equipment at a safe distance from the lava, which complicates light source and spectrometer fiber alignment.
Direct measurements of specular and diffuse reflection from molten lava would be useful to determine how appropriate values for molten silicates from non-crystalline solids literature are as reflectance proxies for lava.
4.7 Future Prospects For The Discovery and Characterization of Lava Worlds
There are a number of theories about the atmospheres and surfaces of lava-ocean planets. Characterizing the surfaces and atmospheres of hot super Earths in order to constrain sources of reflected light may help constrain these theories. The characterization of reflected light, however, requires bright host stars for high SNR data that has only recently become available.
Most lava-ocean planet candidates have been detected by Kepler, making follow-up observations of these planets difficult since Kepler planets orbit very faint stars ( 12th magnitude). We now have the opportunity with TESS to find more lava-ocean planet candidates amenable to follow-up observations, since TESS surveys the nearest and brightest stars ( 12th magnitude) (Ricker et al., 2014). TESS is expected to find 556 31 planets with radii 2 R⊕ during its primary mission, some of which will be lava-ocean planet candidates (Sullivan et al., 2015).
We identify potential lava-ocean planet candidates from the TESS Objects of Interest (TOI) list777https://exoplanetarchive.ipac.caltech.edu, as candidates for follow-up observations (Figure 12).
In order to sustain lava at the substellar point, lava-ocean planet candidates must have substellar temperatures 850 K. The equilibrium temperature of a planet, , is:
| (17) |
where is the effective temperature of the star, is the Bond albedo, is the heat redistribution factor, is the stellar radius, and is the semi-major axis/orbital distance (Burrows, 2014; De Pater & Lissauer, 2015).
In order to estimate the surface/substellar temperatures, , of the TOIs, we use equation (17), and assume a basalt/feldspar quenched glass albedo and uniform heat redistribution (). Uniform heat redistribution is a conservative estimate to avoid excluding potential lava planet candidates based on atmospheric assumptions. We calculate a range of equilibrium temperatures for a few lava planet candidates by varying the heat distribution factor from (uniform heat redistribution) to (no heat redistribution/instant re-radiation) (Figure 12) (Spiegel & Burrows, 2010).
is calculated as (Mansfield et al., 2019):
| (18) |
In order to characterize hot super Earths, the degeneracy between reflected light and thermal emission when interpreting the secondary eclipse depth of a planet in a single observation bandpass (Figure 2) must be broken. This can be achieved by obtaining secondary eclipse depth measurements in two different, preferably overlapping, bandpasses (Placek et al., 2016).
The James Webb Space Telescope (JWST), to be launched in 2021, has several spectroscopic instruments that can measure high resolution phase variations (Gardner et al., 2006). In particular, NIRCam has a wavelength range of 0.65 m, which overlaps with the TESS band (6001000 nm). NIRCam observations will contain a substantial thermal component but due to the overlap between the TESS and NIRCam bandpasses, a change in albedo between observations will help to break the degeneracy between reflected light and thermal emission (Samuel et al., 2014; Placek et al., 2016).
5 Summary and Conclusion
There are a few hot super Earths that have observationally inferred high geometric albedo values ( 0.4) in the Kepler band (420-900 nm). We considered molten lava and quenched glasses on the surfaces of hot super Earths as sources of reflected light that may contribute to the high albedo values.
We experimentally measured reflectance from rough and smooth textured basalt and feldspar quenched glasses along the specular reflection direction. To supplement our measurements, we used specular reflection literature values of molten silicates as a proxy for specular reflectance values for lava. We integrated the reflectance values in a planet hemisphere model.
We found that reflection from rough and smooth quenched glasses and lava results in low planetary geometric albedos ( 0.1). Reflection from quenched glasses has the greatest contribution to reflectance at small incidence angles ( 20∘) and is negligible when considered over the entire planet. We conclude that lava worlds with solid (quenched glass) or liquid (lava) surfaces have low albedos, and the high geometric albedos of hot super Earths are likely explained by atmospheres with reflective clouds or, for a narrow range of parameter space, possibly Ca/Al oxide melt surfaces.
The future of lava-ocean planet discovery and characterization lies in TESS data and follow-up observations with instruments like JWST.
Reflectance Spectra of Quenched Glasses
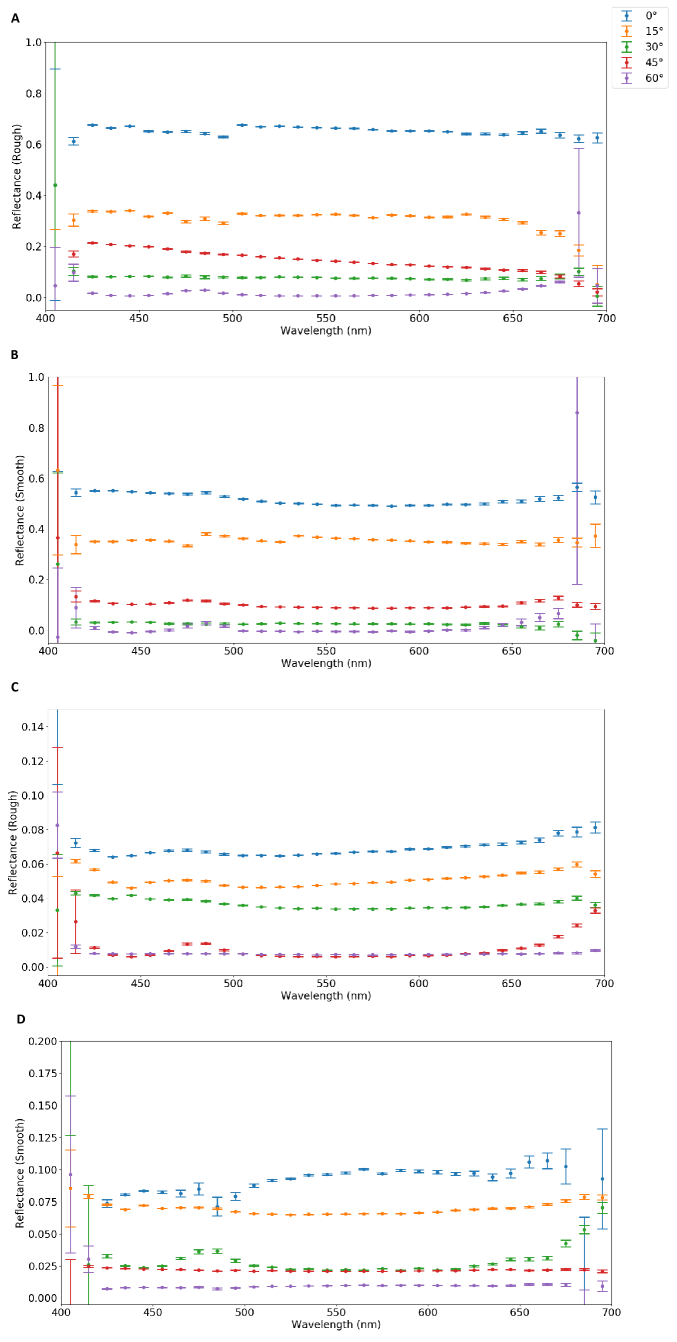
Spectrally-resolved reflectance measurements of our quenched glasses were converted into an average reflectance value for the visible wavelength range (Figures 710).
The reflected counts data from the reference standard and quenched glass samples were binned in 10 nm intervals in order to reduce the noise in the data, after wavelength calibration. The reflected counts from the glass samples were divided by the reflected counts from the reference standard at the corresponding incidence angle, and the reflectance value was calculated for each incidence angle. Finally, the spectrally-resolved reflectance measurements were averaged across the visible wavelength range (400700 nm) corresponding to the wavelength range of the white LED illumination source, and to compare to inferred albedo values from exoplanet observations.
We find that reflectance does not vary significantly as a function of wavelength across the visible wavelength range (Figure A1). Some reflectance measurements exhibit increased noise but do not change significantly with wavelength. The shape of the reflectance curves does not change appreciably with incidence angle. The amplitude of the reflectance curve decreases with increasing incidence angle, as shown for the integrated wavelength values in Figures 710.
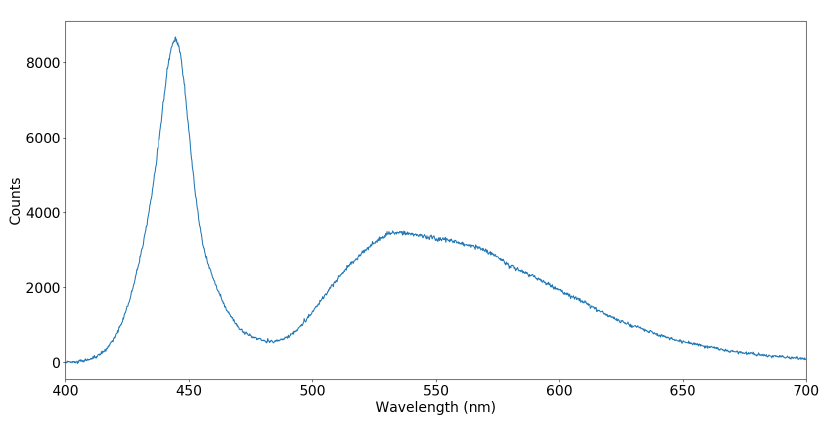
The increase in noise for reflectance values at the beginning and end of the visible wavelength range is systematic noise attributed to the white LED light source used to illuminate the quenched glass samples and reference standard. The light source does not emit enough light between 400410 nm and 680700 nm, leading to a measured signal close to/at the noise limit of the spectrometer (Figure A2). Since the measured signals are close to the noise limit at the beginning and end of the wavelength range, small fluctuations cause large changes in calculated reflectance values. The excess noise is present in both the individual spectra of the quenched glass samples and reference standard, implying that it is not a real effect unique to the glass samples.
References
- Alonso (2018) Alonso, R. 2018, Characterization of Exoplanets: Secondary Eclipses, ed. H. J. Deeg & J. A. Belmonte (Cham: Springer International Publishing), 1441–1467
- Angelo & Hu (2017) Angelo, I., & Hu, R. 2017, The Astronomical Journal, 154, 232
- Batalha et al. (2011) Batalha, N. M., Borucki, W. J., Bryson, S. T., et al. 2011, The Astrophysical Journal, 729, 27
- Burrows (2014) Burrows, A. S. 2014, Proceedings of the National Academy of Sciences, 111, 12601
- Cannon et al. (2017) Cannon, K. M., Mustard, J. F., Parman, S. W., et al. 2017, Journal of Geophysical Research: Planets, 122, 249
- Carter (2019) Carter, J. L. 2019, arXiv preprint arXiv:1901.01361
- De Pater & Lissauer (2015) De Pater, I., & Lissauer, J. J. 2015, Planetary sciences (Cambridge University Press)
- Demory (2014) Demory, B.-O. 2014, The Astrophysical Journal Letters, 789, L20
- Dumusque et al. (2014) Dumusque, X., Bonomo, A. S., Haywood, R. D., et al. 2014, The Astrophysical Journal, 789, 154
- Fulton et al. (2017) Fulton, B. J., Petigura, E. A., Howard, A. W., et al. 2017, The Astronomical Journal, 154, 109
- Gardner et al. (2006) Gardner, J. P., Mather, J. C., Clampin, M., et al. 2006, Space Science Reviews, 123, 485
- Gilliland et al. (2011) Gilliland, R. L., Chaplin, W. J., Dunham, E. W., et al. 2011, The Astrophysical Journal Supplement Series, 197, 6
- Griffiths (2000) Griffiths, R. W. 2000, Annual review of fluid mechanics, 32, 477
- Hapke (1981) Hapke, B. 1981, Journal of Geophysical Research: Solid Earth, 86, 3039
- Ito et al. (2015) Ito, Y., Ikoma, M., Kawahara, H., et al. 2015, The Astrophysical Journal, 801, 144
- Kite et al. (2016) Kite, E. S., Fegley Jr, B., Schaefer, L., & Gaidos, E. 2016, The Astrophysical Journal, 828, 80
- Léger et al. (2009) Léger, A., Rouan, D., Schneider, J., et al. 2009, Astronomy & Astrophysics, 506, 287
- Léger et al. (2011) Léger, A., Grasset, O., Fegley, B., et al. 2011, Icarus, 213, 1
- Lutgens et al. (2014) Lutgens, F. K., Tarbuck, E. J., & Tasa, D. G. 2014, Essentials of geology (Pearson Higher Ed)
- Malavolta et al. (2018) Malavolta, L., Mayo, A. W., Louden, T., et al. 2018, The Astronomical Journal, 155, 107
- Mansfield et al. (2019) Mansfield, M., Kite, E. S., Hu, R., et al. 2019, The Astrophysical Journal, 886, 141
- Miguel et al. (2011) Miguel, Y., Kaltenegger, L., Fegley, B., & Schaefer, L. 2011, The Astrophysical Journal Letters, 742, L19
- Nowack et al. (2001) Nowack, N., Okretic, S., Pfeifer, F., & Zebger, I. 2001, Journal of non-crystalline solids, 282, 30
- Phong (1975) Phong, B. T. 1975, Communications of the ACM, 18, 311
- Pidwirny (2006) Pidwirny, M. 2006, Characteristics of igneous rocks: fundamentals of physical geography, 2nd Edn. Date Viewed 30th December, 2012
- Pierrehumbert (2010) Pierrehumbert, R. T. 2010, Principles of planetary climate (Cambridge University Press)
- Placek et al. (2016) Placek, B., Knuth, K. H., & Angerhausen, D. 2016, Publications of the Astronomical Society of the Pacific, 128, 074503
- Ricker et al. (2014) Ricker, G. R., Winn, J. N., Vanderspek, R., et al. 2014, Journal of Astronomical Telescopes, Instruments, and Systems, 1, 014003
- Rogers (2015) Rogers, L. A. 2015, The Astrophysical Journal, 801, 41
- Rouan et al. (2011) Rouan, D., Deeg, H. J., Demangeon, O., et al. 2011, The Astrophysical Journal Letters, 741, L30
- Samuel et al. (2014) Samuel, B., Leconte, J., Rouan, D., et al. 2014, Astronomy & Astrophysics, 563, A103
- Schaefer & Fegley (2009) Schaefer, L., & Fegley, B. 2009, The Astrophysical Journal Letters, 703, L113
- Seager et al. (2007) Seager, S., Kuchner, M., Hier-Majumder, C., & Militzer, B. 2007, The Astrophysical Journal, 669, 1279
- SOBOLEV (1975) SOBOLEV, V. 1975, Light Scattering in Planetary Atmospheres, International Series in Natural Philosophy (Pergamon)
- Spiegel & Burrows (2010) Spiegel, D. S., & Burrows, A. 2010, The Astrophysical Journal, 722, 871
- Sullivan et al. (2015) Sullivan, P. W., Winn, J. N., Berta-Thompson, Z. K., et al. 2015, The Astrophysical Journal, 809, 77
- Torrance & Sparrow (1967) Torrance, K. E., & Sparrow, E. M. 1967, Josa, 57, 1105
- Wirth et al. (1997) Wirth, K. R., Naiman, Z. J., & Vervoort, J. D. 1997, Canadian Journal of Earth Sciences, 34, 536
- Zebger et al. (2005) Zebger, I., Pfeifer, F., & Nowack, N. 2005, Journal of non-crystalline solids, 351, 3443