See pages - of myfile.pdf
Supporting Information
Monomeric, Two-Dimensionally Ordered WO3 Clusters on Anatase TiO2(101)
Contents
1. a-TiO2(101) surface preparation
2. WO3 deposition methods
3. XPS of WO3/a-TiO2(101)
4. STM images of WO3/a-TiO2(101) at higher coverage
5. Distribution analysis of the M features
6. WO3 configurations calculated with DFT
7. Schematic models of the M, C and 3M features
8. WO3 powder deposition onto r-TiO2(110)
1 a-TiO2(101) surface preparation
Since large size anatase TiO2 single crystals are difficult to synthesize in the lab, mineral anatase TiO2 single crystals (SurfaceNet GmbH, Germany) are used in this study. The crystals are cut into a (mm) dimension and are mounted on Ta sample plates clamped by Ta and Au strips. Due to the natural origin, the mineral anatase TiO2 crystals contain certain amount of contaminates such as K, Fe, Nb, etc [1]. Newly received a-TiO2(101) crystals are subjected to at least 10 cycles of sputtering/annealing before STM images of good quality can be obtained. A typical cleaning cycle involves Ar+ (99.9995%, Linde) sputtering (1.3 keV, 6-15 minutes) and UHV annealing (580-610 ∘C, 20-40 minutes). The Ar+ sputtering position is carefully calibrated to avoid sputtering contaminants onto the sample. Annealing in O2 is found to be helpful in extracting contaminates and is performed occasionally to deplete contaminations in the near surface region. The annealing temperature is increased about 2 degrees per 10 cycles to facilitate the formation of large terraces. Gradually, the crystal becomes more reduced and the color of the sample changes from a semi-transparent orange color into non-transparent black color. Throughout this work, three a-TiO2(101) single crystals have been used. The STM images are collected on 2 different samples and the XPS data is obtained from the third crystal. No obvious changes in the morphology of supported WO3 were observed on the two a-TiO2 crystals. Thus, the influence of bulk reduction on the WO3 structure, if any, is considered to be negligible.
2 WO3 deposition methods
The WO3 powder (Sigma-Aldrich, 99.995%) is contained in an Al2O3 liner which is inserted in a Ta crucible mounted in a 4-pockets e-beam evaporator (EBE-4, Oxford Applied Research, UK). The deposition rate of WO3 from the powder source is about 0.03 ML/min, as estimated by STM. For the reactive deposition of WO3, a 2.0 mm W metal rod (99.99+%, Goodfellow, UK) with sharpened tip is used. During W evaporation, the chamber pressure remains in the low mbar range. O2 (99.9995%, Linde) is backfilled into the chamber to maintain a partial pressure of mbar during the growth of WO3. The reactive deposition rate of WO3 is calibrated to be around 0.06 ML/min. After the deposition of WO3, the sample is usually annealed at 500 K for 5 minutes to facilitate easier STM scanning.
3 XPS of WO3/a-TiO2(101)
XPS spectra of reactive deposited WO3 were collected at a commercial chamber (SPECS) with Al anode as the X-ray source (non-monochromatized) while the powder deposited WO3 were collected at the ASTRID2 synchrotron (MatLine) facility at Aarhus University. The Matline is equipped with an SX-700 monochromator and a SPECS Phoibos 150 electron energy analyzer, which was operated at a pass energy of 20 eV and a curved analyzer slit of 0.8 mm [2]. The beamline monochromator exit slit was set to a width of 30 m. The base pressure in the end-station was mbar. The O 1s core levels were collected with a photon energy of 651.15 eV and the W4f and Ti3p core levels were collected using 156.0 eV photon energy.
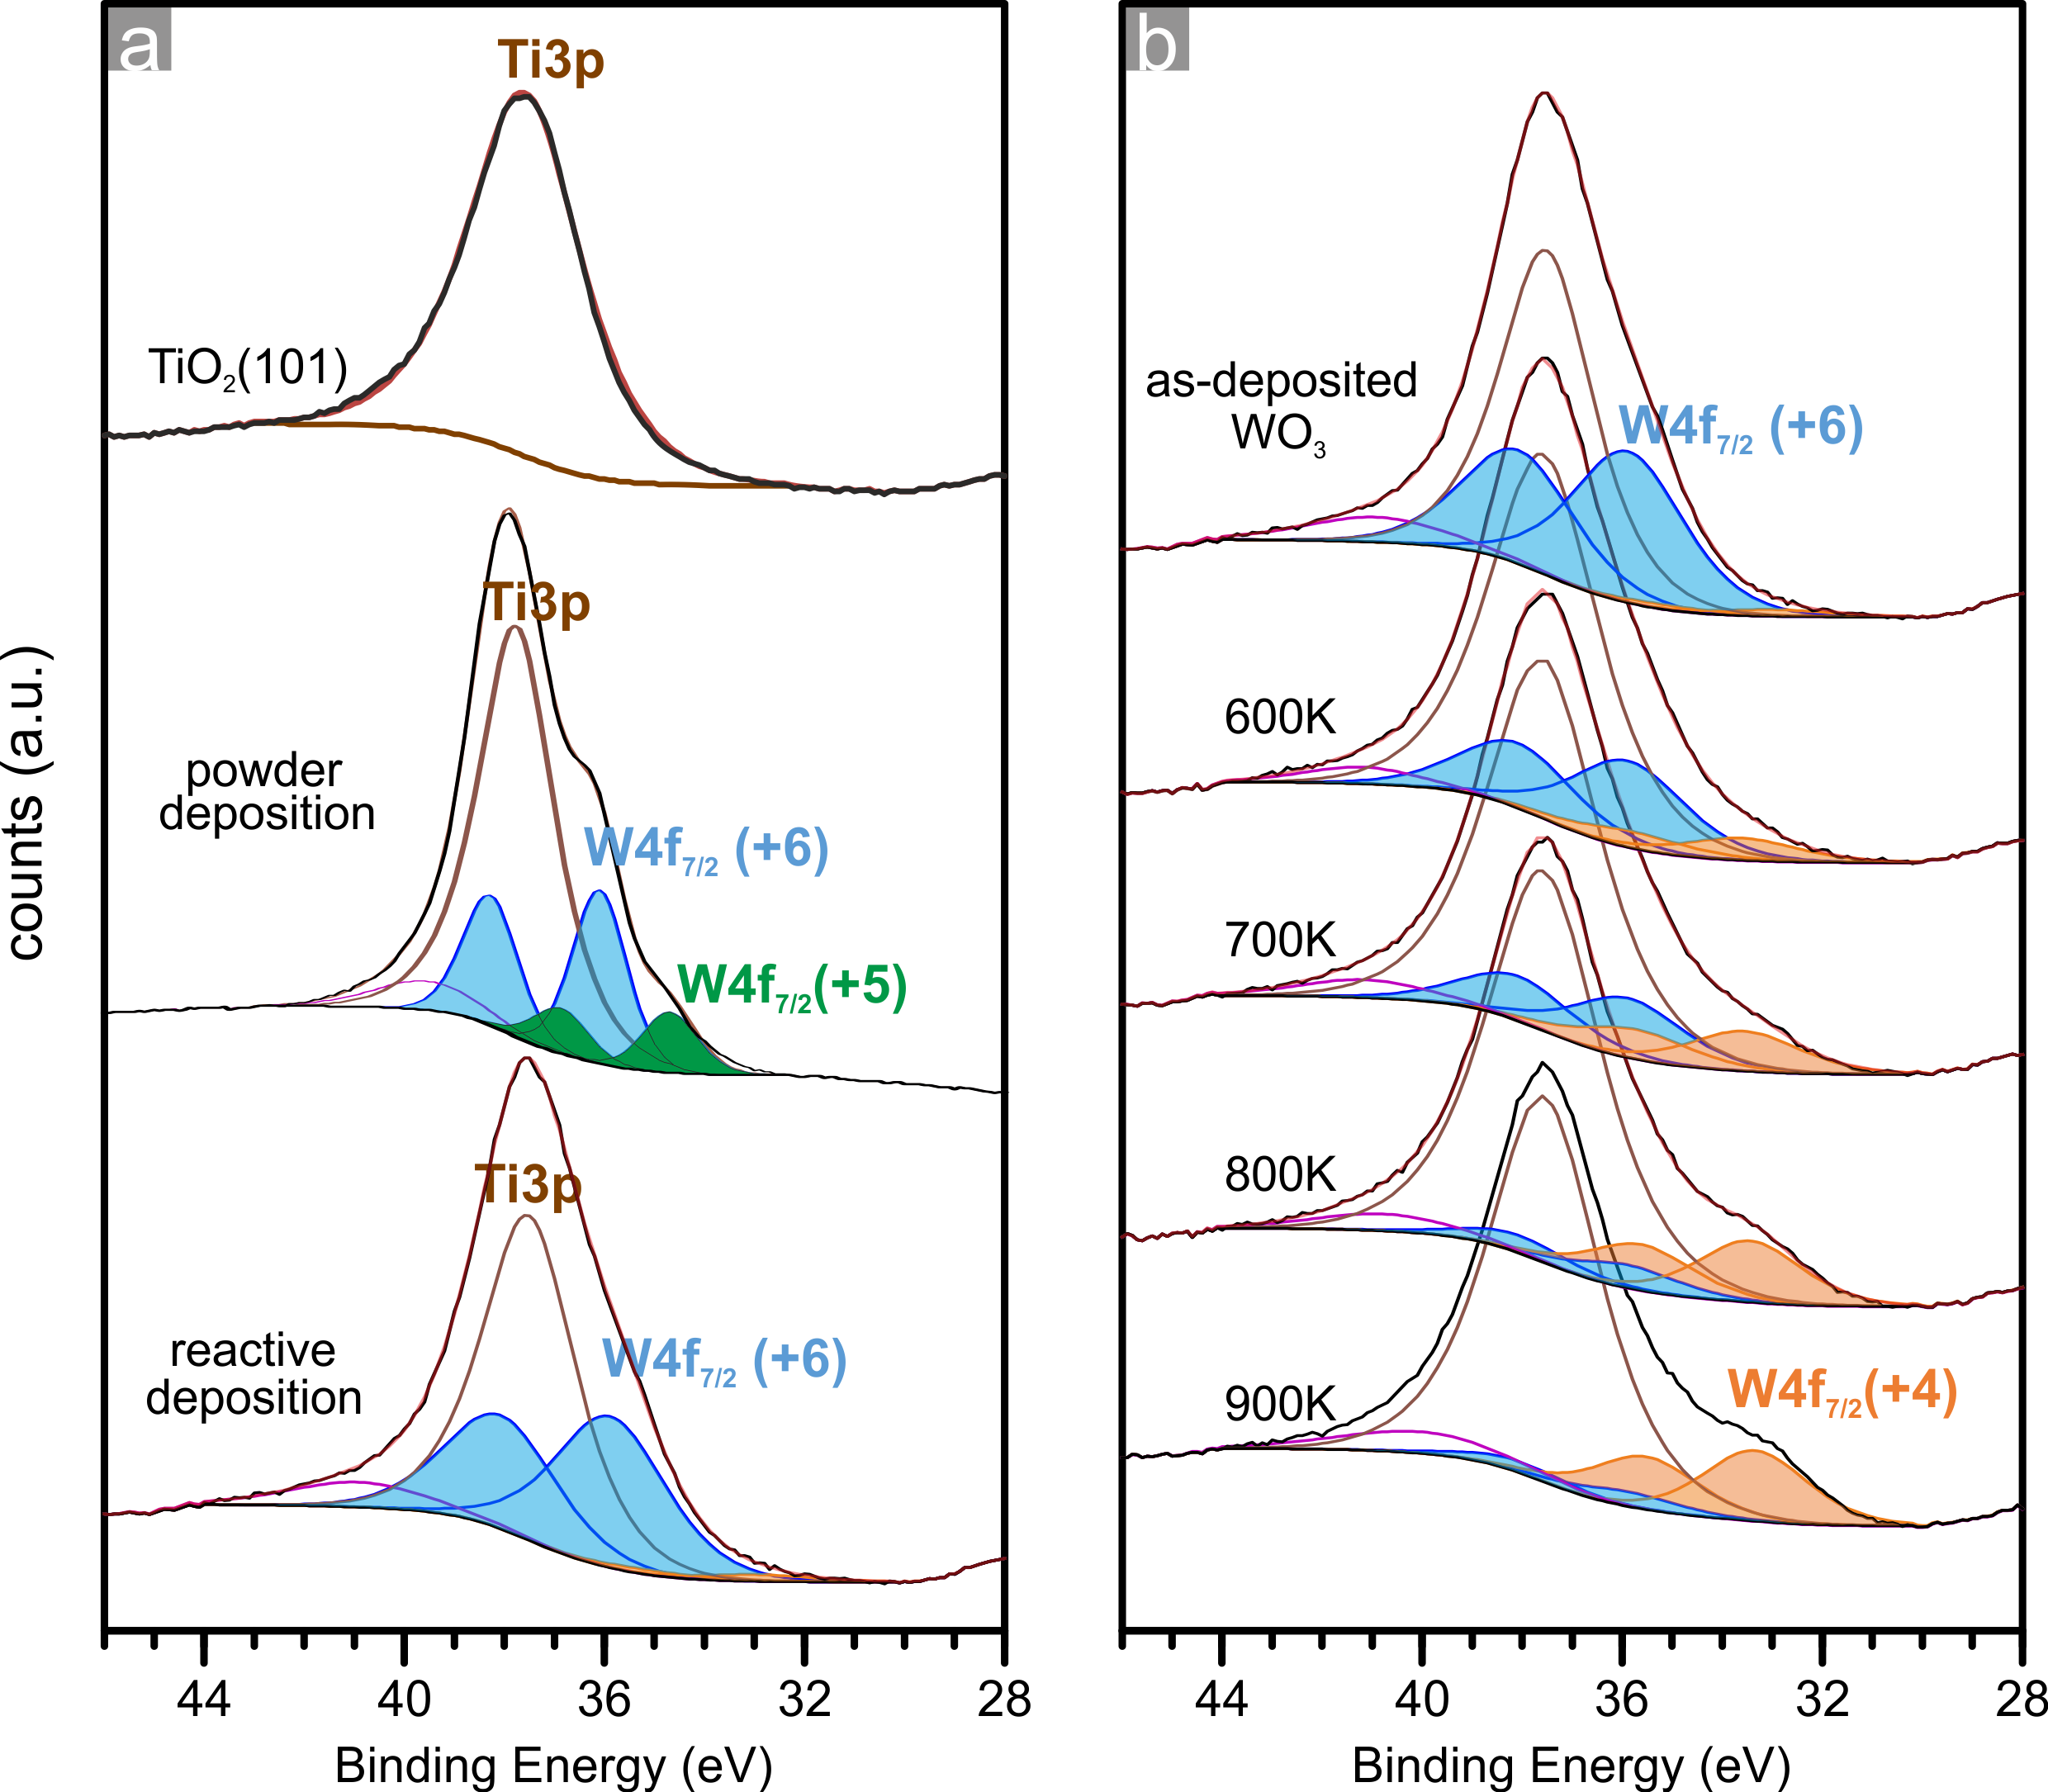
XPS measurements were performed to determine the oxidation state of the WO3 species deposited on the a-TiO2(101) surface. Figure S1(a) shows the W4f/Ti3p regions of a clean a-TiO2(101) surface and two differently prepared WO3/TiO2(101) samples. Due to the overlapping of the W4f and Ti3p peaks, a careful deconvolution process is needed to extract the W4f signals. We found that the majority of the as-deposited WO3 species from the powder source are in the highest W oxidation state of +6 (W4f7/2 at 35.7 eV) with a small portion of W in the +5 state ( 25%, W4f7/2 at 34.5 eV). W in the +5 oxidation state originates from the bulk reduced WO3-x powder in the evaporator and is not a general feature of deposited tungsta on a-TiO2(101).The reactively deposited tungsta species are nearly completely in the +6 oxidation state (W4f7/2 at 35.7 eV). In addition, we found by XPS that W(+6) state is thermally stable until 600 K, where it starts to be reduced to W(+4) (W4f7/2 at 33.7 eV ), as shown in Figure S1(b). Above 600 K, a quick reduction happens. Following annealing at 800 K , the W(+6) is nearly completely converted to W(+4). Although the W oxidation state changes upon annealing at this high temperature, it is worth noticing that the total W4f peak areas decreases only slightly after annealing, indicating that W is thermally stable on the surface without much loss. The XPS results confirm that annealing the as-deposited WO3/a-TiO2(101) samples at 500 K does not reduce the deposited tungsta. Accordingly, brief annealing at 500 K, as done in the STM experiments, does not change the W oxidation state.
A Shirley background subtraction was used before fitting the W4f/Ti3p XPS regions. The XPS spectrum of the clean a-TiO2(101) surface provides a reference for the calibration of Ti3p peak shape and position. The W4f7/2 and W4f5/2 spin-orbital splitting peaks are constrained to be separated by 2.18 eV and the peaks have identical FWHM with an area ratios of 4 to 3. For the spectra obtained with the lab X-ray source, the W4f peaks are fitted with 100% Gaussian, while the Ti3p peak is fitted with 72% Lorentzian + 28% Gaussian. The XPS spectra collected at the synchrotron are characterized by more narrow peaks (smaller FWHM) and the shape of the spectra are adjusted by mixing 50% Gaussian with 50% Lorentzian. The W(+6) oxidation state is calibrated by measuring the W4f peaks from a WO3 multilayer, deposited from the powder source on a-TiO2(101) (data not shown). A shoulder peak at around 42.0 eV is also fitted which is assigned to the loss feature of WO3.
Additionally, we utilized XPS to check the cleanliness of the bare and the tungsta-covered a-TiO2(101) surfaces. Since the carbon amounts were negligible following WO3 deposition from the powder source and reactive deposition, both preparation methods were accomplished in a very clean manner.
4 STM images of WO3/a-TiO2(101) at higher coverage
The STM scans were performed in a home-built Aarhus STM which is mounted in an UHV chamber with base pressure of mbar. The STM images were obtained with the sample at room temperature. A typical scanning condition is: 1.0-1.2 V (tip), 0.1-0.15 nA.
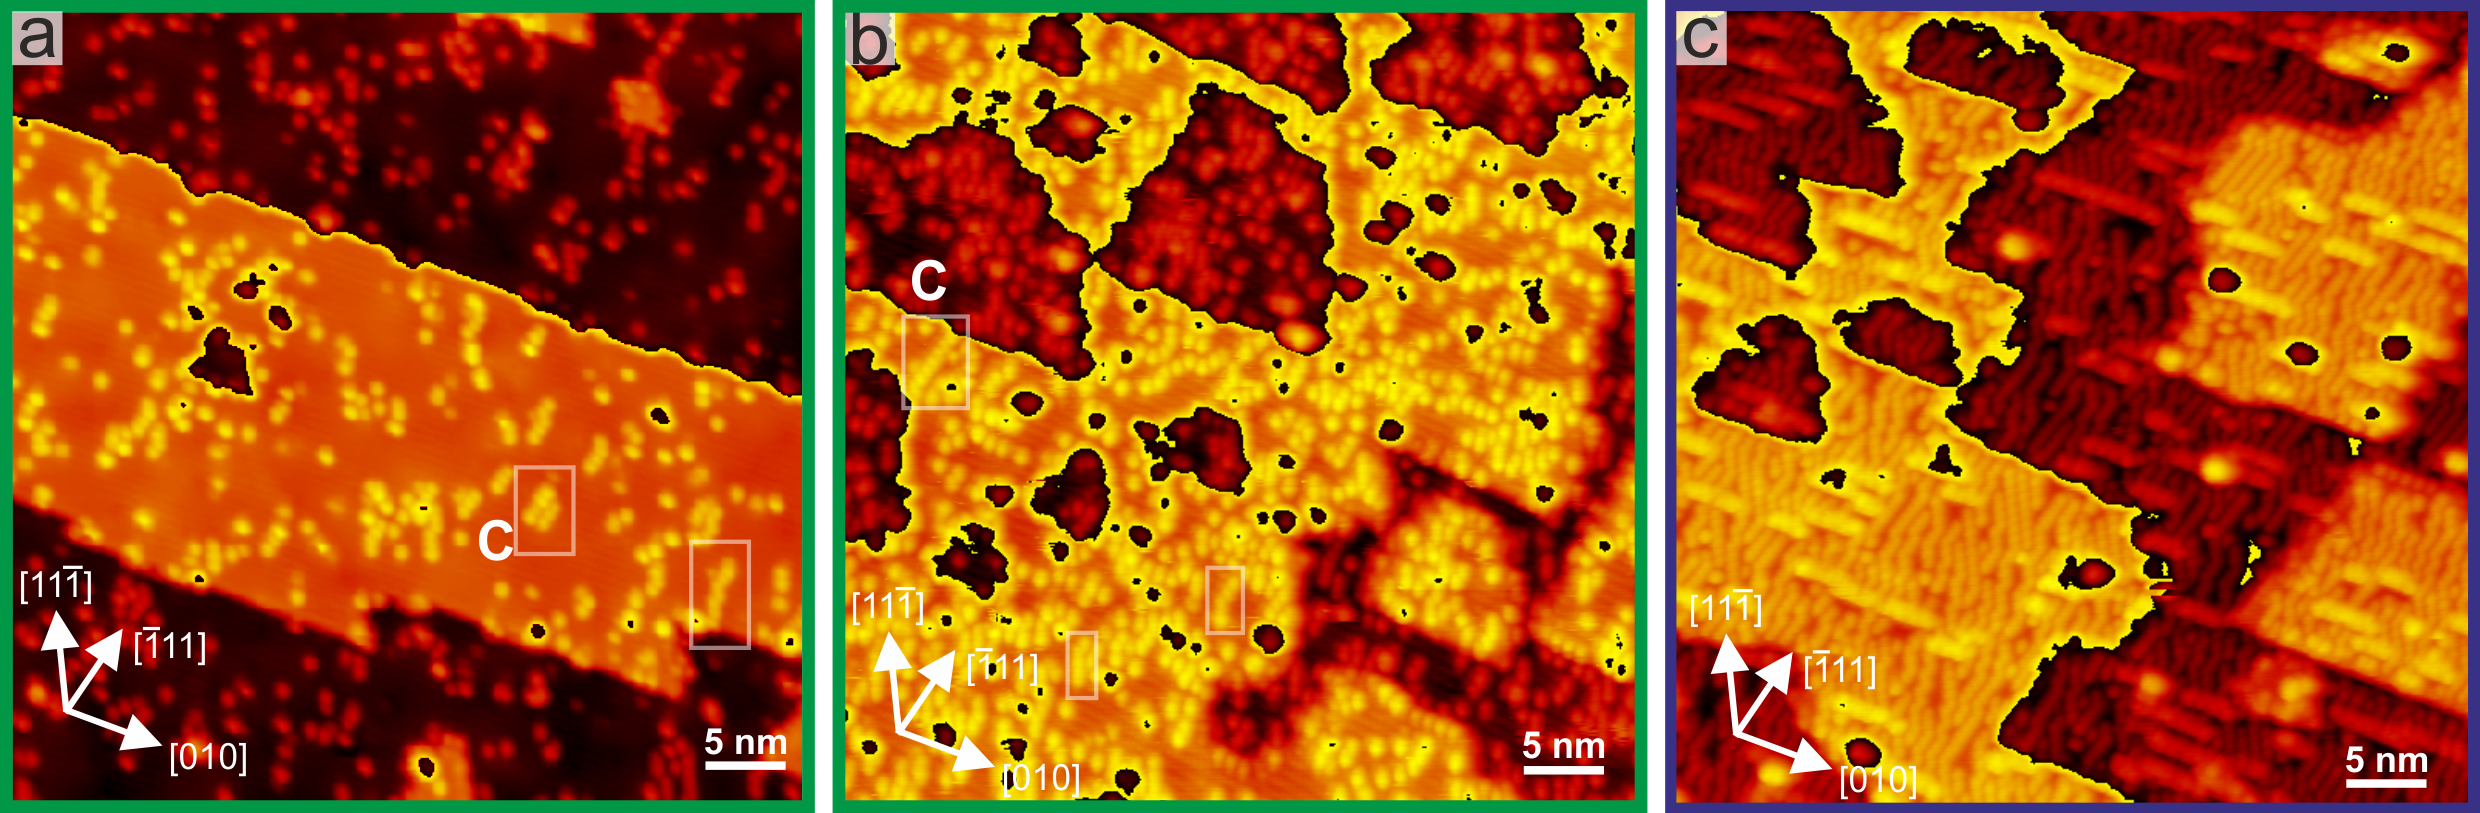
Figure S2(a-b) show the STM images of reactive deposited WO3 on the a-TiO2(101) surface at intermediate (Figure S2(a)) and high coverage (Figure S2(b)) after annealing at 500 K for 5 minutes. As the coverage increases, the M features appear closer to each other and eventually form chain-like C features along the [] and [] direction. Figure S2(c) shows a full monolayer of powder sublimated WO3 on the a-TiO2(101) after annealing at 500 K for 5 minutes. The a-TiO2(101) is nearly completely covered by the C features, forming small sizes of () superstructure domains that are oriented along the [] or [] direction.
5 Distribution analysis of the M features
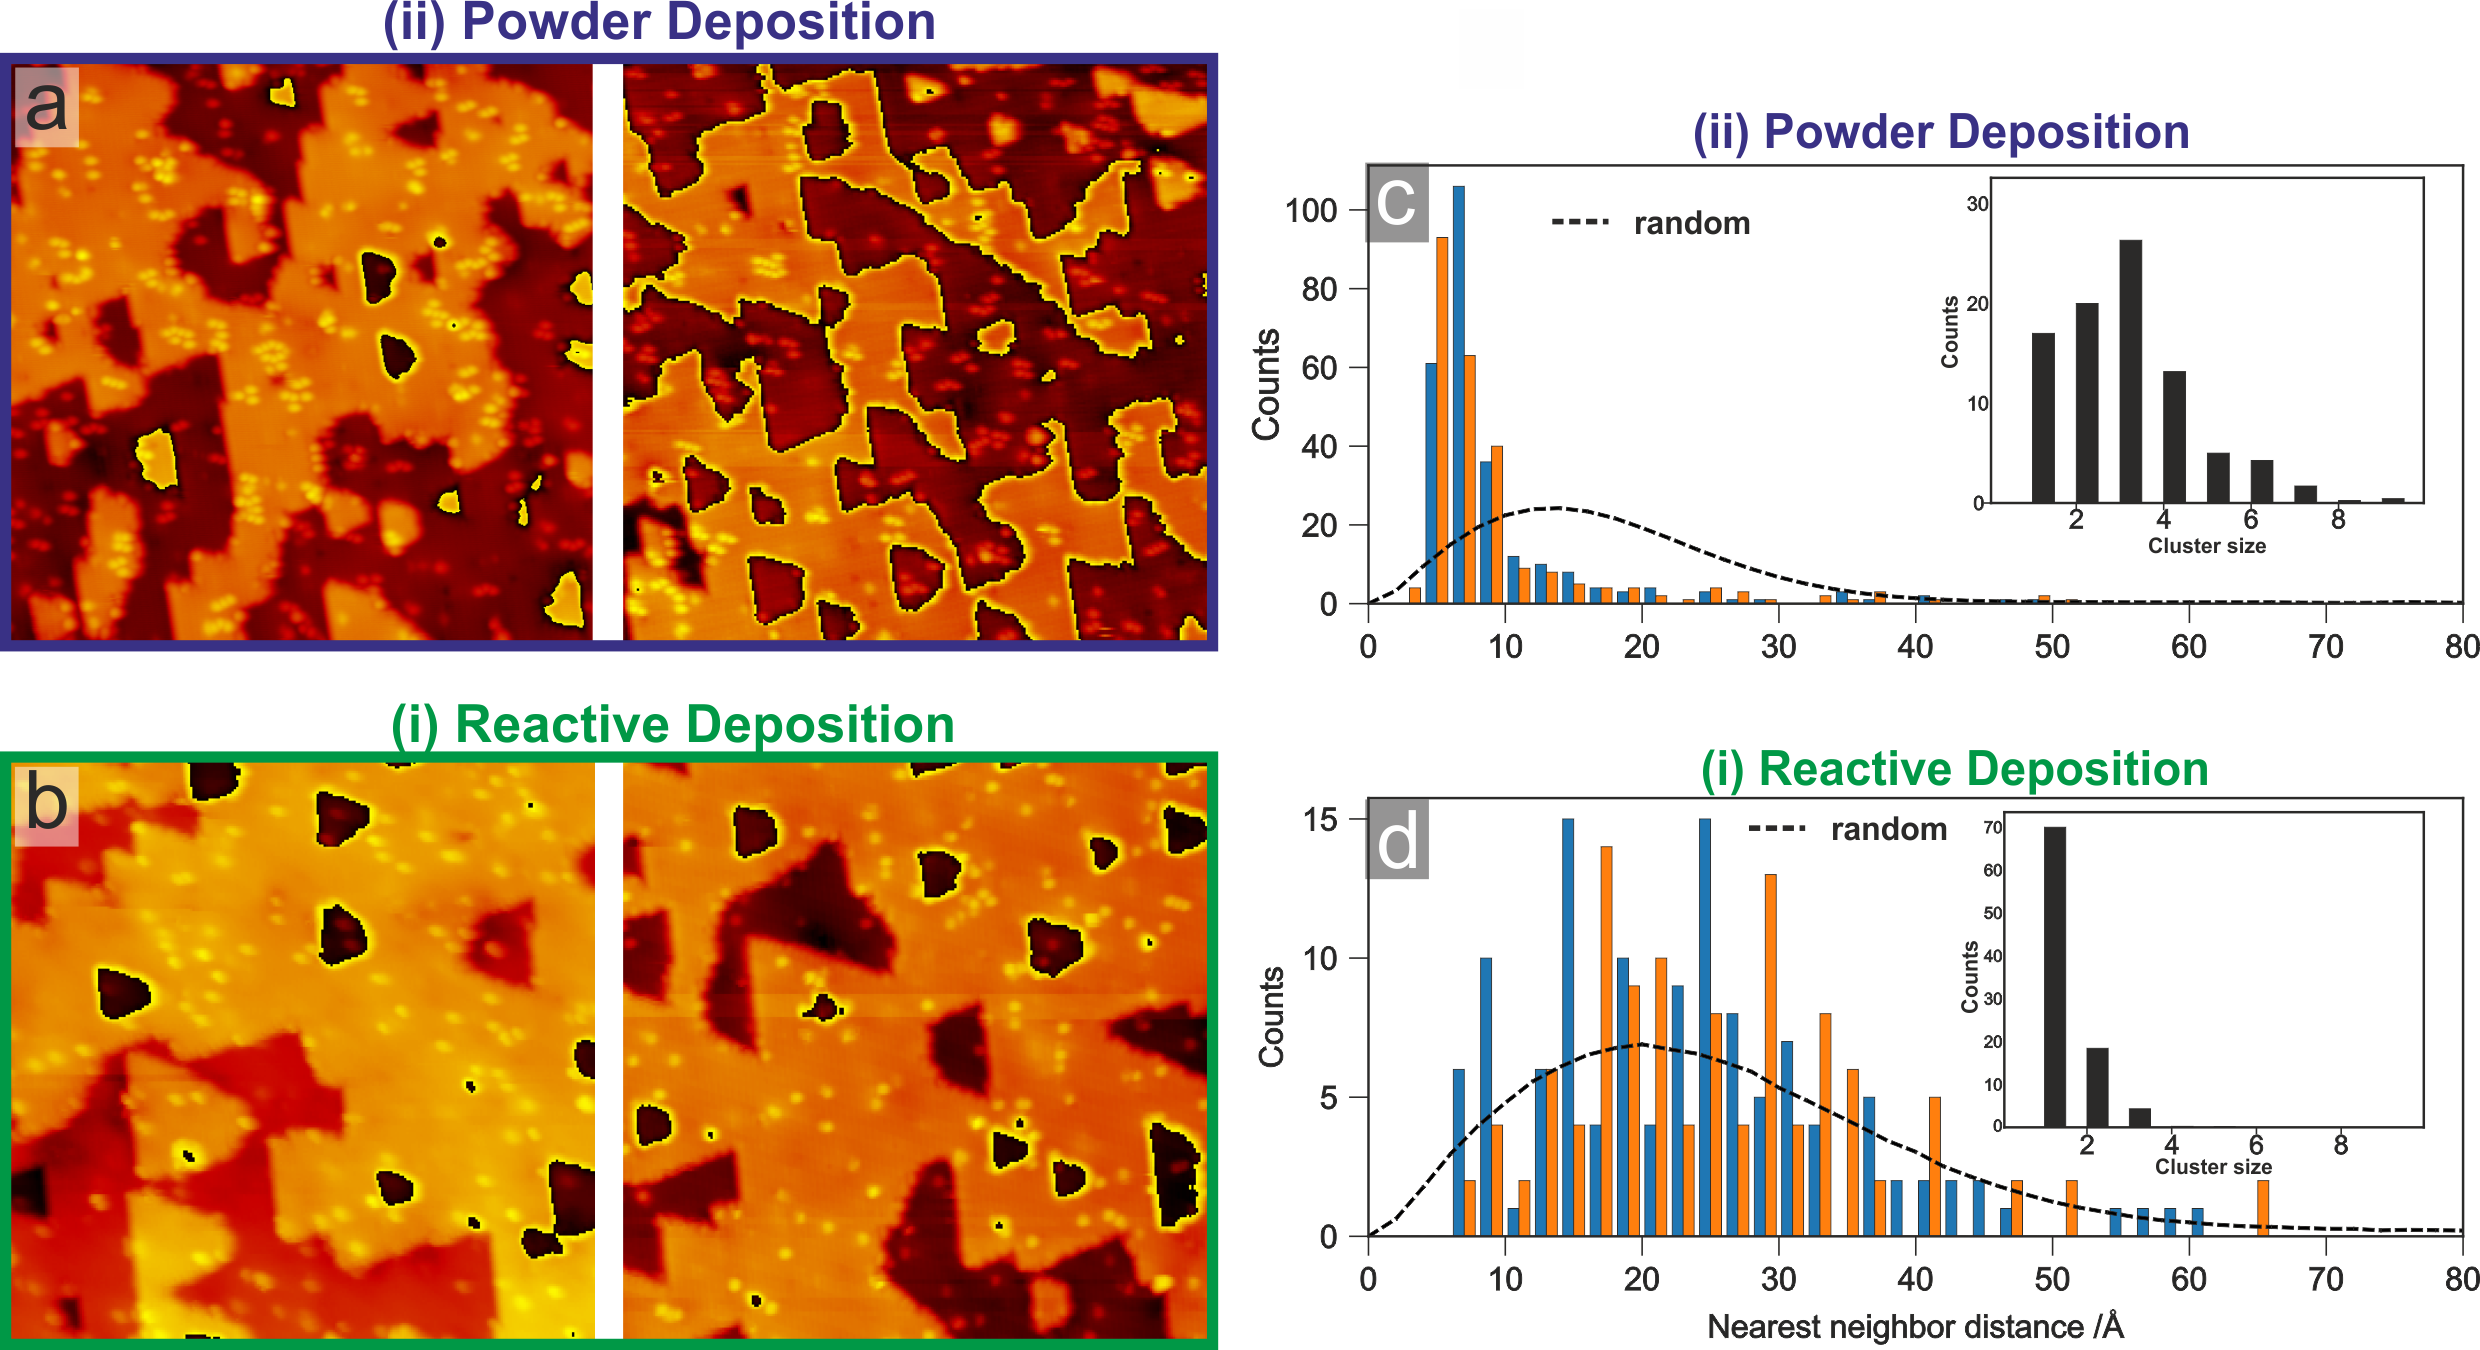
To quantitatively describe the distribution of the M features at low coverage, a stochastic analysis is performed by counting the nearest-neighbor distance (NND) distribution in the STM images, as shown in Figure S3. The number of M features are counted directly from STM images in Figure S3(a, b). The NND for random distribution is performed on a 500 Å 500 Å2-D space with the same coverages as found experimentally corresponding to Figure S3(a, b). Note that the a-TiO2(101) surface lattice was not imposed in the simulation. In total, 6000 iterations were performed to achieve convergence of the NND random distribution curve, as shown in Figure S3(c, d). Clearly, the powder deposited WO3 species are characterized by small NND that peaks between 4 - 8 Å (note that the smallest possible NND of the M features is 7.58 Å along the [010] direction and 5.46 Å along the [] and [] directions) which is at a smaller distance than found in the simulated random distribution curve. The reactively deposited WO3 species, however, are characterized by a wider range of NND that peaks at around 20 Å, which fits well to the simulated random distribution. Further more, it is clear that the powder deposited M features have a tendency to form clusters of trimers while the reactively deposited M features appear as monomers, as can be seen in the inset of Figure S3(c, d). The cluster size is determined by searching for the number of M features within a circle with a radius of 19.5 Å(this radius value is chosen to be larger than the length of a 3M chain (15.16 Å) but smaller than a 4M chain (22.74 Å) along the [010] direction).
6 WO3 configurations calculated with DFT
Density Functional Theory (DFT) calculations are performed using the Grid-based Projector Augmented Wave (GPAW) package [3, 4] through the ASE package [5]. The crystal structure of WO3 was optimized using the stress tensor method available in ASE to be a=7.373 Å, b=7.650 Å and c=7.819 Å, which deviates from the experimental value with less than 2.5% [6]. The a-TiO2(101) surface was modelled with a super cell size of (31) and a slab of 3 layers of TiO2, with the bottom layer atoms kept fixed at their bulk positions. The cells were periodic in the xy plane with a minimum of 10 Å between slabs in the z-direction, and the lattice constants taken from reference [7]. To obtain the most stable structures of the (WO3)x species on the a-TiO2(101) surface we used a genetic algorithm (GA) [8]. A two-step optimization scheme was applied to explore a large area of the potential energy surface (PES). The GPAW program supports three different operating modes for running DFT calculations: The LCAO mode where the wave functions are represented with an atomic orbital basis set, the PW mode, where the wave functions are expanded as plane waves, and grid-based mode, where on a uniform real space orthorhombic grids. Since the LCAO mode with dzp basis set is fastest, we first used this to scan the PES with the GA. To find the most stable structure we then optimized the structures within 1 eV of the most stable structure found with the GA in the more accurate grid-based mode with h= 0.18, and within the generalized gradient approximation with the BEEF‐vdW functional [9]. The DFT energies of the most and second most stable monomeric, dimeric and trimeric species are given in Table S1.
To compare the relative stability of monomeric, dimeric and trimeric species, we have calculated their stabilities per formula WO3 unit. As reference, we take the total energy of the most stable adsorbed WO3* monomer (A1):
A positive indicates that the considered species is less stable than the most stable monomeric WO3 on a-TiO2(101).
| Species | Energy (eV) | E (eV) |
|---|---|---|
| a-TiO2(101) | -5255.57 | |
| WO3*(A1) | -5622.91 | 0 |
| WO3*(A1.1) | -5622.21 | 0.700 |
| W2O6*(A2) | -5989.31 | 0.470 |
| W2O6*(A2.1) | -5989.20 | 0.525 |
| W3O9*(A3) | -6356.34 | 0.417 |
| W3O8* + O*(A3.1) | -6356.48 | 0.370 |
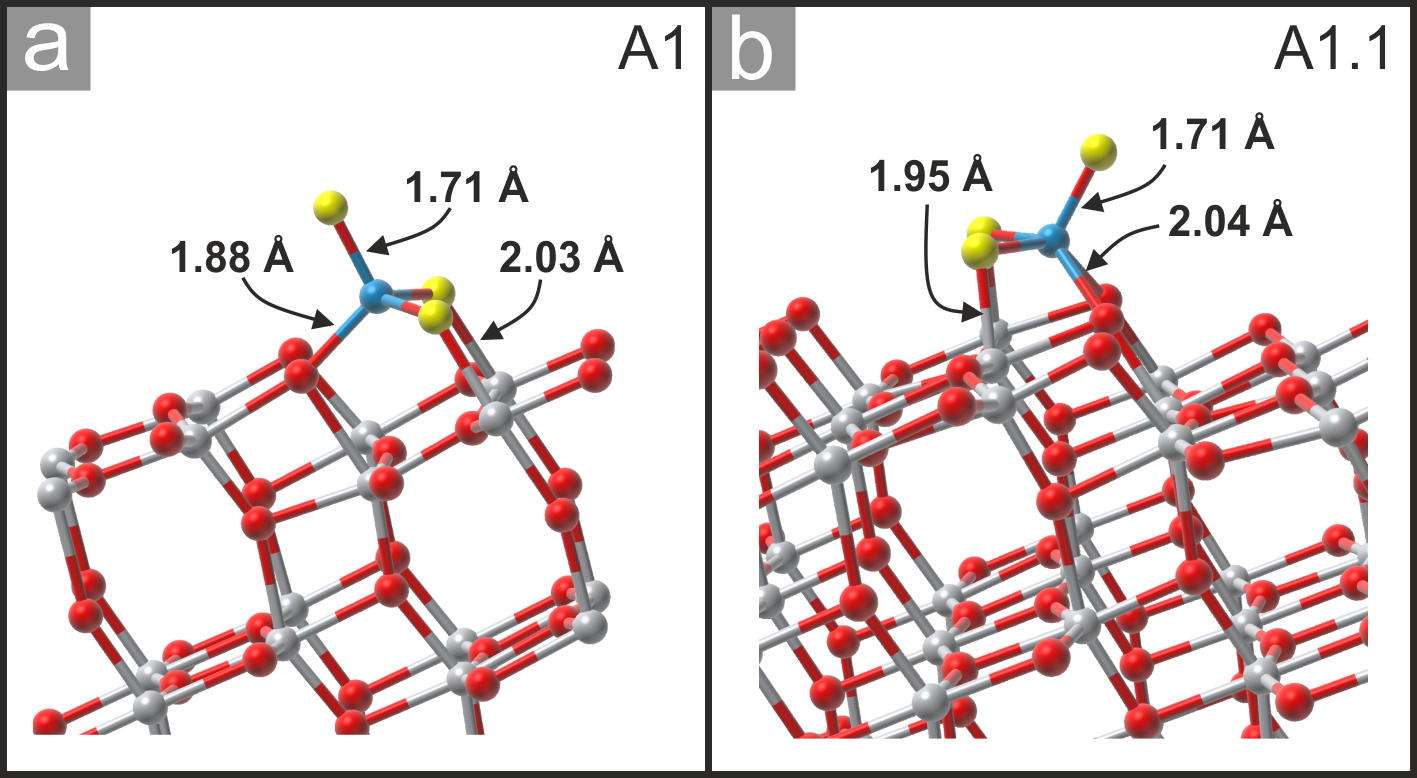
The A1 configuration (S4(a)) is a WO3 monomer with three bonds to the a-TiO2(101) surface, including two WO-Ti(5f) bonds (2.03 Å) and one W-O(2f) bond (1.88 Å). The terminal W-O bond length (1.71 Å) is small, suggesting a double bond. The W cation is in a tetrahedral environment surrounded by four O ions. Figure S4(b) shows the second most stable monomer structure that is labelled with A1.1. In this structure, the WO3 adsorbate has four bonds to the a-TiO2(101) surface, including two WO-Ti(5f) (1.95 Å) and two W-O(2f) (2.04 Å) bonds. The A1.1 configuration is 0.7 eV less stable than the A1 configuration.
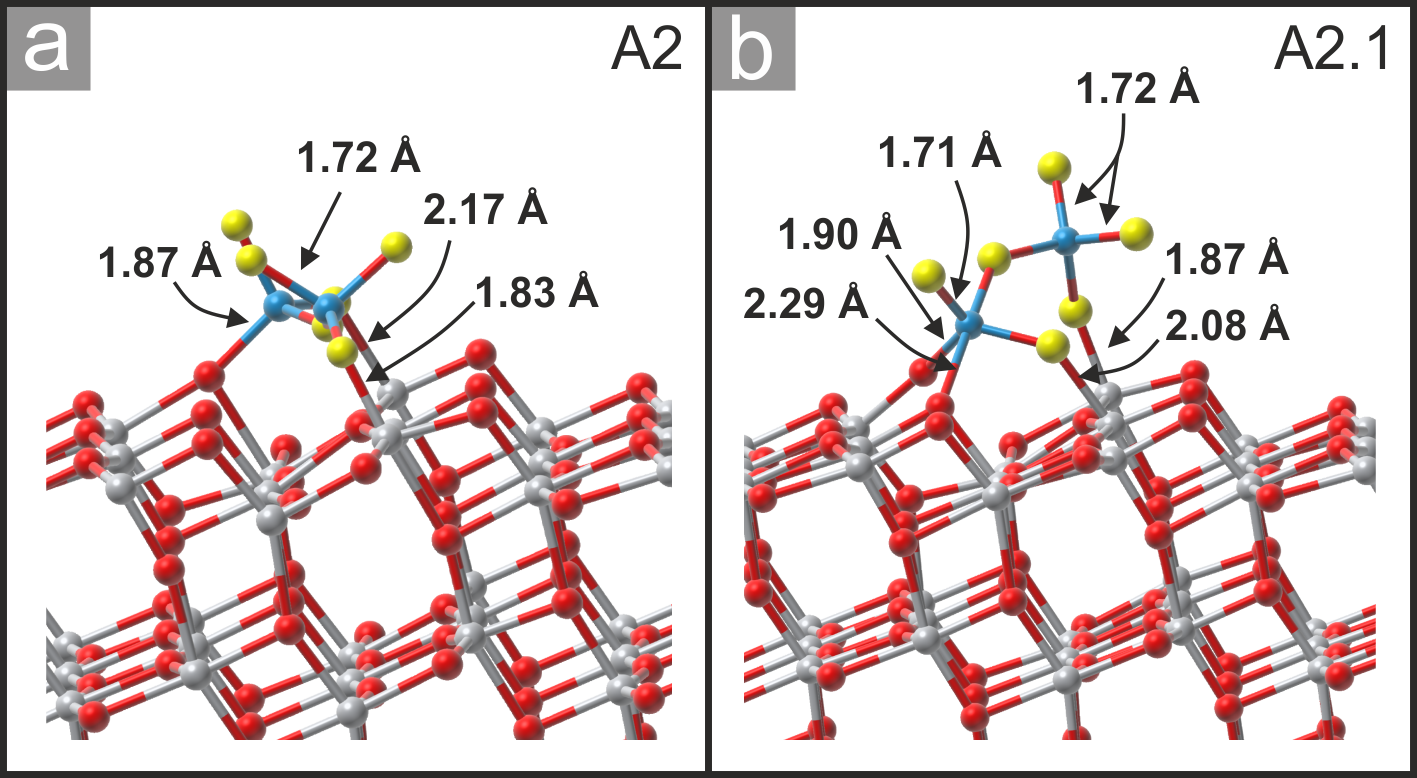
The A2 configuration (Figure S5(a)) - the most stable W2O6 dimer - is bound via three bonds to the a-TiO2(101) surface, including two WO-Ti(5f) bonds (1.83 Å, 2.17 Å) and one W-O(2f) bond (1.87 Å). The dimer spans across three Ti(5f) sites along the [010] direction. The second most stable W2O6 dimer - labelled A2.1 - is shown in Figure S5(b). In this structure, the dimer is bound by four bonds to the a-TiO2(101) surface, including two WO-Ti(5f) bonds and two W-O(2f) bonds. This configuration is 0.11 eV less stable than the A2 structure.
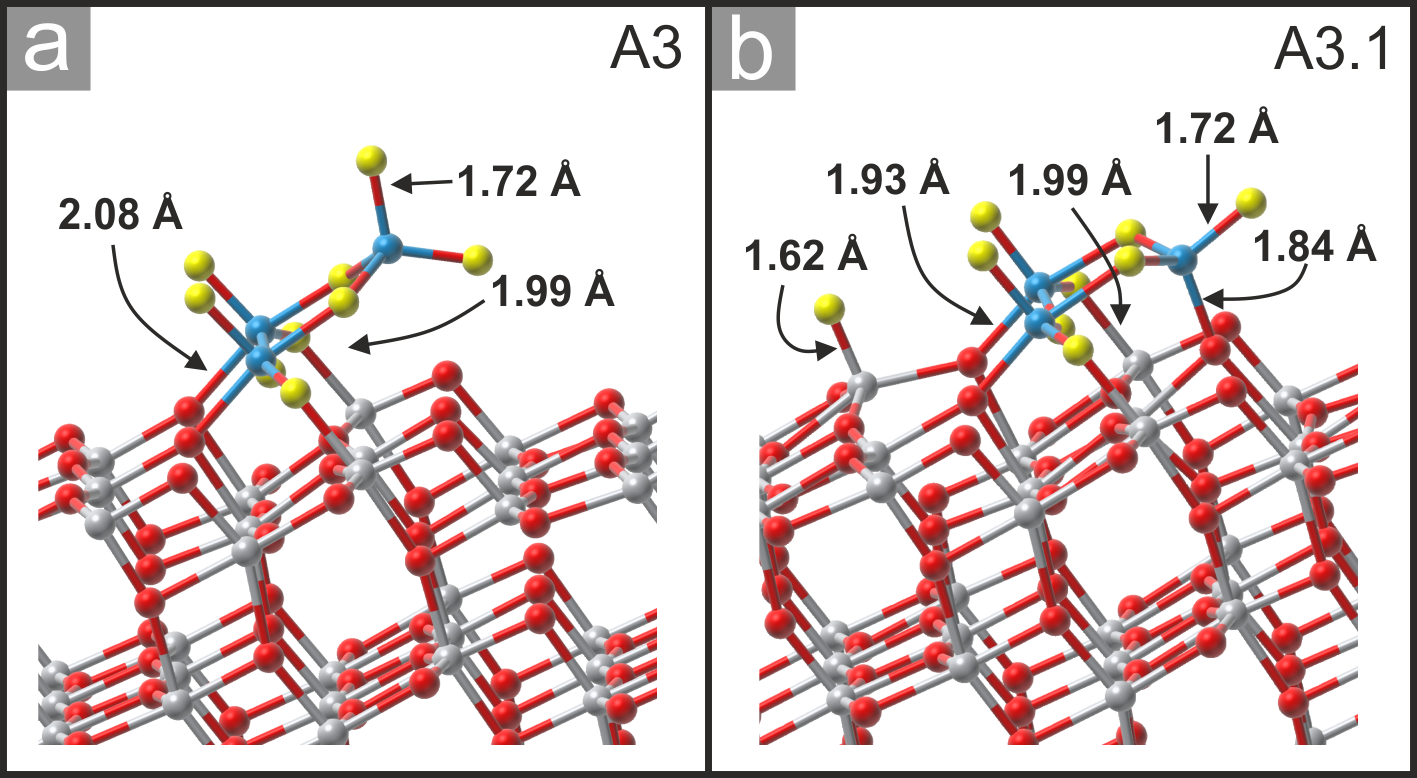
The intact W3O9 trimer, configuration A3 (see Figure S6(a)), is characterized by four bonds to the a-TiO2(101) surface, including two WO-Ti(5f) bonds (1.99 Å) and two W-O(2f) bonds (2.08 Å). The molecular plane of the cyclic W3O9 trimer is tilted away from the surface. The configuration labelled A3.1 (see Figure S6(b)) consists of a W3O8 species and a nearby terminal O atom, bound to a Ti(5f) site. The bond length of the terminal O atom is only 1.62 Å, indicating a double bond. The W3O8 species binds to the a-TiO2(101) with five bonds, including two WO-Ti(5f) bonds (1.99 Å) and three W-O(2f) bonds (1.84 Å, 1.93 Å, 1.96 Å). Notice that the A3.1 configuration is more stable than the A3 structure by 0.14 eV.
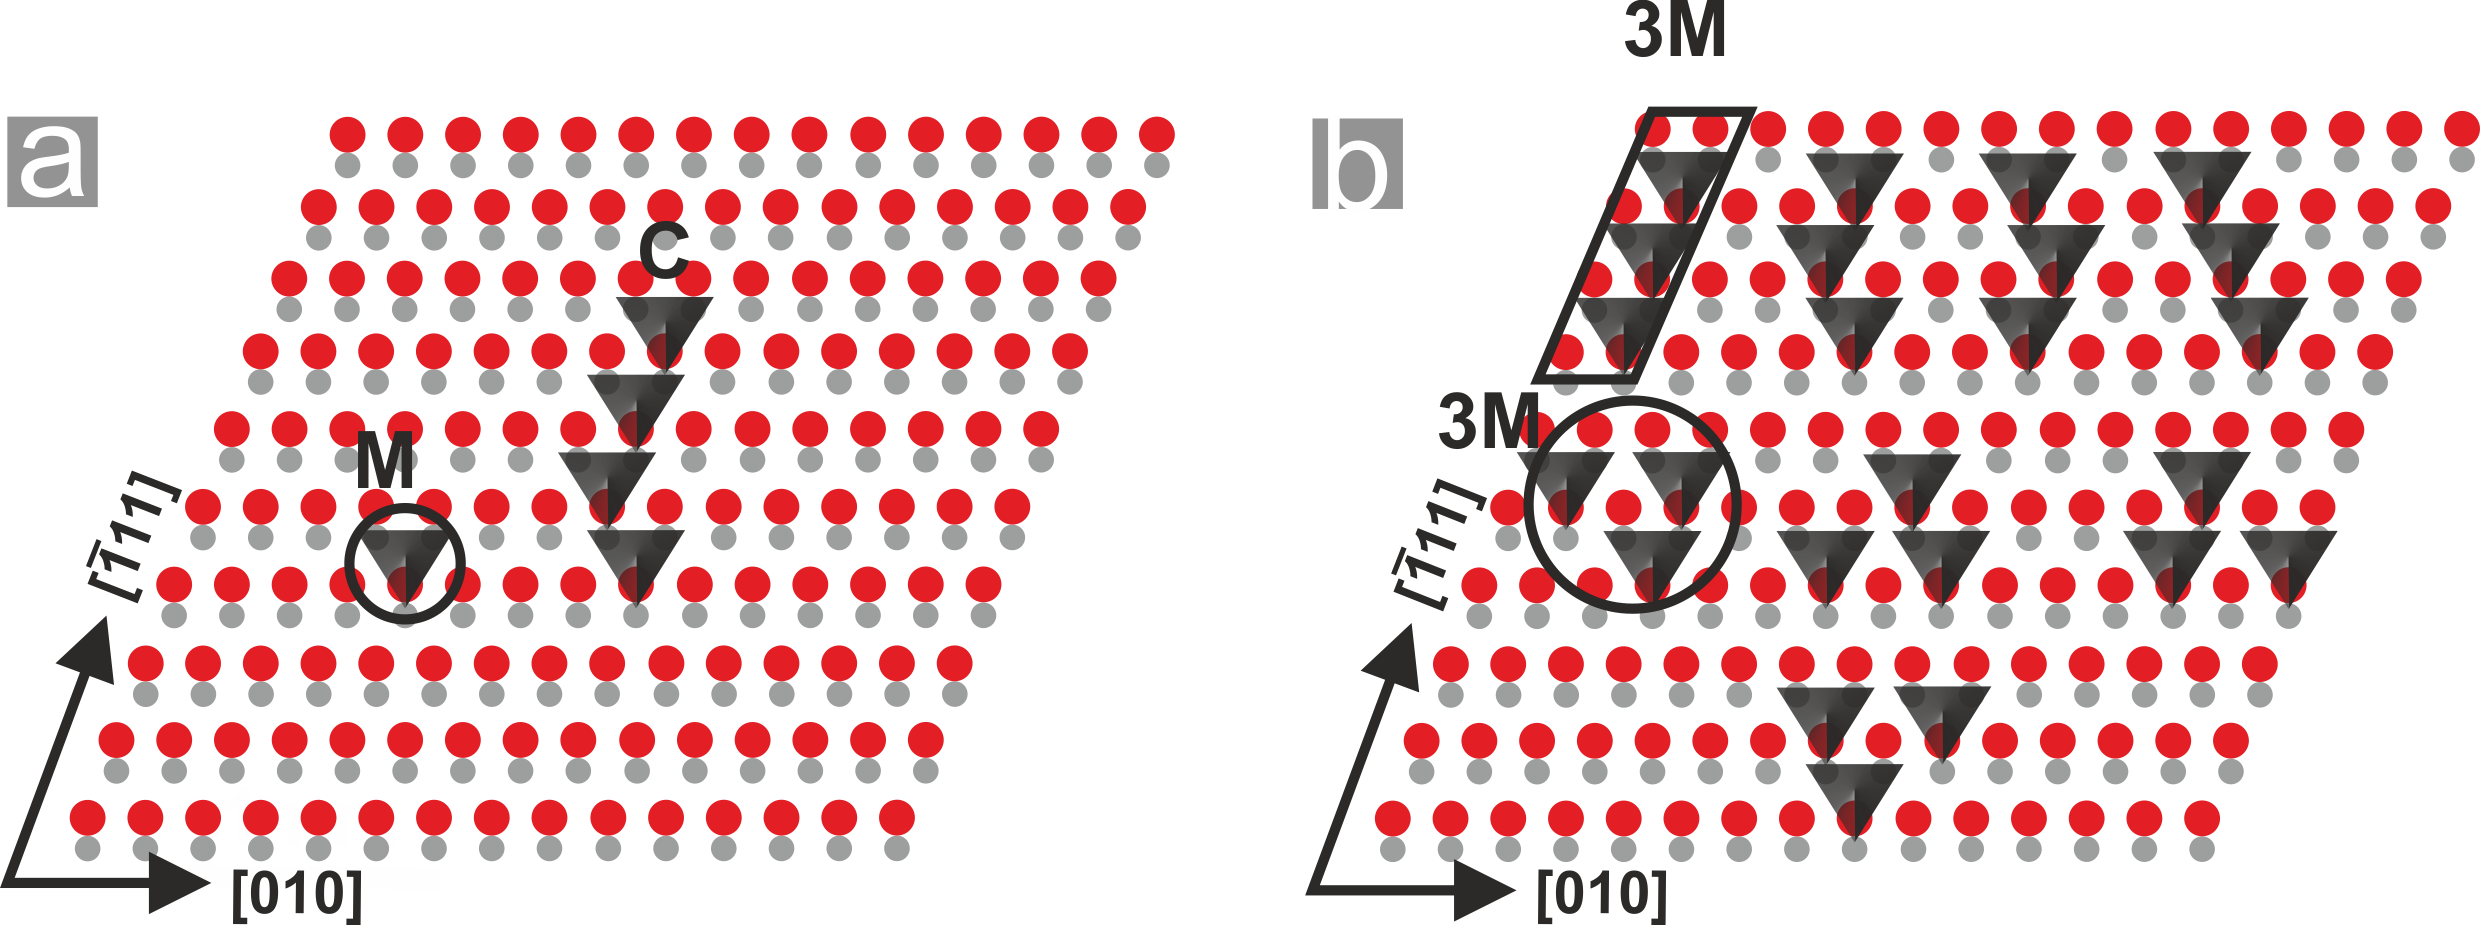
7 Schematic models of the M, C and 3M features
On the basis of the A1 structure (WO3 monomer) found with DFT calculations, the M, C and 3M features can be easily constructed, as shown in Figure S7(a) shows how the C features can be composed. Figure S7(b) shows the different kinds of 3M features, which we indeed observed in our STM studies.
8 WO3 powder deposition onto r-TiO2(110)
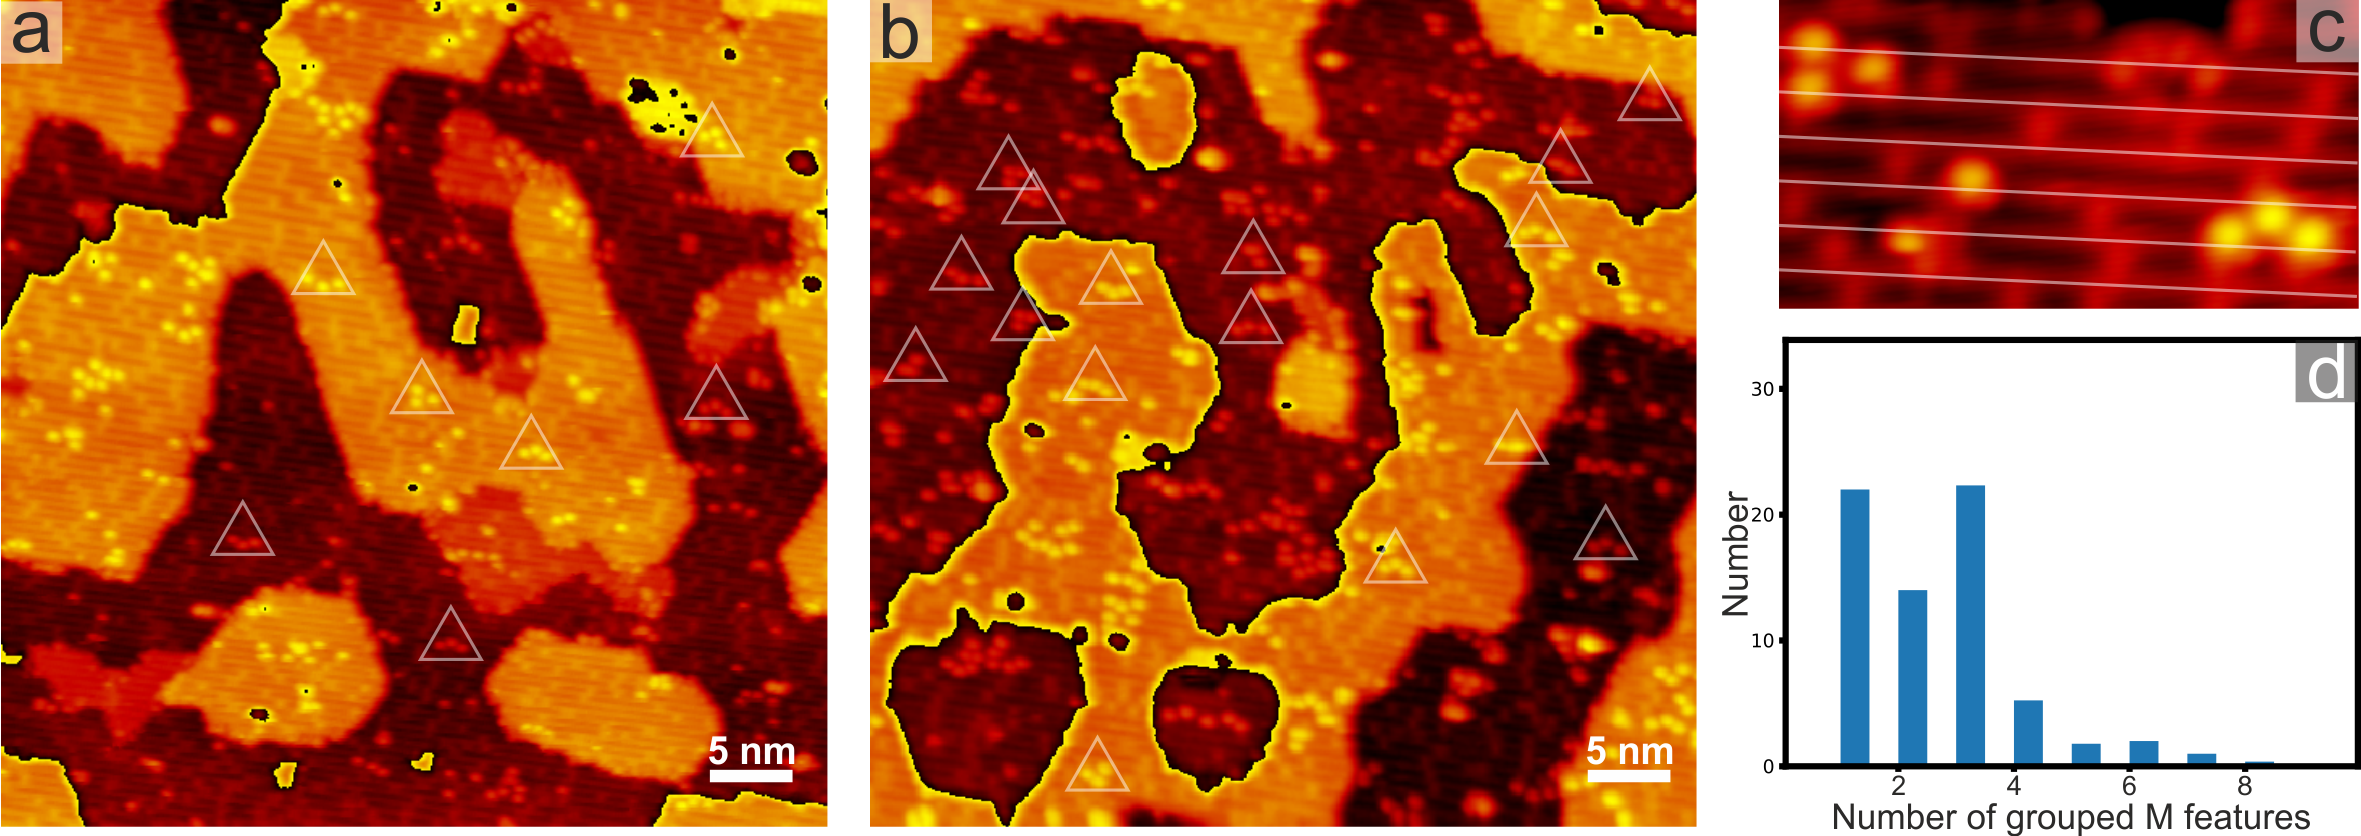
In addition to WO3/a-TiO2(101), we also utilized STM to study WO3/r-TiO2(110). These STM studies were conducted to address the apparent disagreement regarding the assignment of tungsta-related species on TiO2 surfaces, a-TiO2(101) and r-TiO2(110), respectively. Or is the interaction of tungsta with the a-TiO2(101) surface very different from the tungsta–r-TiO2(110) interaction? We used WO3 powder sublimation method to prepare WO3/r-TiO2(110) sample, exactly as in previous studies by Dohnálek and co-workers [10, 11]. Upon WO3 powder sublimation, the r-TiO2(110) surface was at RT. Subsequently, the WO3/r-TiO2(110) sample was vacuum-annealed at 500 K for 5 minutes.
As shown in Figure S8(a, b), we successfully prepared WO3/r-TiO2(110) samples characterized by a rather low tungsta coverage. Tungsta-related new protrusions on r-TiO2(110) appear with lateral sizes of 6.2 Åand STM heights of 1.5 Å. These dimensions are identical to those found for the M features on a-TiO2(101). In addition, the new protrusions on r-TiO2(110) appear preferentially in groups of three, even though some isolated protrusions also occur. Examples of grouped tungsta-related protrusions are highlighted by white triangles in Figure S8(a, b). That numerous groups of three protrusions occur is likewise as found for WO3/a-TiO2(101) samples prepared by WO3 powder sublimation. Accordingly, the STM data presented in Figure S8(a–c) indicate that the same type of tungsta species are formed on r-TiO2(110) surfaces as on a-TiO2(101) surfaces (i.e., the M features). Thus, the interaction of (WO3)3 species with r-TiO2(110) is very similar to the (WO3)3–a-TiO2(101) interaction. As argued in our main manuscript addressing WO3/a-TiO2(101), we assign the M features to WO3 monomers.
On the one hand, the STM data presented here are consistent with our interpretation of dissociated (WO3)3 species on a-TiO2(101). On the other hand, these STM data are in contrast to the assignment put forward in the studies by Dohnálek and co-workers addressing WO3/r-TiO2(110) [10, 11], where the smallest tungsta species on r-TiO2(110) were assigned to cyclic (WO3)3 trimers. Notice that the size of the smallest tungsta species are very similar in the STM studies of both research groups (ours and Dohnálek and coworkers).
Because of the low coverage on our WO3/r-TiO2(110) samples, it was possible to conduct a statistical analysis of the local clustering effect of the tungsta species, see Figure S8(d). It can be seen that there are peaks for isolated M features and 3M features. The fact that tungsta species appear in groups of three as observed in our studies for WO3/a-TiO2(101) and WO3/r-TiO2(110) cannot be easily explained if the M features would originate from (WO3)3 species. However, such groups of three tungsta species can be explained straightforwardly within the model presented in our main manuscript. Within this model, (WO3)3 species impinge the TiO2 surfaces, which then dissociate and slightly separate on the surfaces. In this light, the STM results obtained for WO3/r-TiO2(110) are further support for our assignment of the M features to WO3 monomers. Moreover, it appears that (WO3)3 species dissociate on TiO2 is not limited to the a-TiO2(101) surface. Instead, our STM studies point to (WO3)3 dissociation on a-TiO2(101) and r-TiO2(110). It is possible that (WO3)3 species generally dissociate on TiO2 surfaces at RT, regardless of the TiO2 polymorph and the selected face.
Generally, it is challenging to clarify as to why the studies conducted in different laboratories casually lead to different conclusions. Also in the current case, this is difficult, and there are eventually several points to be considered why the M features were assigned differently. Nevertheless, when comparing the STM images published in Refs. [10, 11] with ours, we noted that the tungsta coverage was clearly higher in the work by Dohnálek and co-workers. We speculate that the high tungsta coverages in Refs. [10, 11] have led to “crowded situations” on the WO3/r-TiO2(110) samples that hindered Dohnálek and co-workers to recognize the grouping of M features.
References
- [1] Martin Setvín, Benjamin Daniel, Vera Mansfeldova, Ladislav Kavan, Philipp Scheiber, Martin Fidler, Michael Schmid, and Ulrike Diebold. Surface preparation of TiO2 anatase (101): Pitfalls and how to avoid them. Surface Science, 626:61–67, 2014.
- [2] https://www.isa.au.dk/facilities/astrid2/beamlines/AU-Matline/AU-Matline.asp.
- [3] J. J. Mortensen, L. B. Hansen, and K. W. Jacobsen. Real-space grid implementation of the projector augmented wave method. Physical Review B, 71(3):035109, 2005.
- [4] J. Enkovaara, C. Rostgaard, J. J. Mortensen, J. Chen, M. Dułak, L. Ferrighi, J. Gavnholt, C. Glinsvad, V. Haikola, H. A. Hansen, H. H. Kristoffersen, M. Kuisma, A. H. Larsen, L. Lehtovaara, M. Ljungberg, O. Lopez-Acevedo, P. G. Moses, J. Ojanen, T. Olsen, V. Petzold, N. A. Romero, J. Stausholm-Møller, M. Strange, G. A. Tritsaris, M. Vanin, M. Walter, B. Hammer, H. Häkkinen, G. K. H. Madsen, R. M. Nieminen, J. K. Nørskov, M. Puska, T. T. Rantala, J. Schiøtz, K. S. Thygesen, and K. W. Jacobsen. Electronic structure calculations with gpaw: a real-space implementation of the projector augmented-wave method. Journal of Physics: Condensed Matter, 22(25):253202, 2010.
- [5] S. R. Bahn and K. W. Jacobsen. An object-oriented scripting interface to a legacy electronic structure code. Computing in Science & Engineering, 4(3):56–66, 2002.
- [6] B. O. Loopstra and H. M. Rietveld. Further refinement of the structure of WO3. Acta Crystallographica Section B, 25(7):1420–1421, 1969.
- [7] Logi Arnarson, Søren B. Rasmussen, Hanne Falsig, Jeppe V. Lauritsen, and Poul Georg Moses. Coexistence of square pyramidal structures of oxo vanadium (+5) and (+4) species over low-coverage VOX/TiO2 (101) and (001) anatase catalysts. The Journal of Physical Chemistry C, 119(41):23445–23452, 2015.
- [8] Lasse B. Vilhelmsen and Bjørk Hammer. A genetic algorithm for first principles global structure optimization of supported nano structures. The Journal of Chemical Physics, 141(4):044711, 2014.
- [9] Jess Wellendorff, Keld T. Lundgaard, Andreas Møgelhøj, Vivien Petzold, David D. Landis, Jens K. Nørskov, Thomas Bligaard, and Karsten W. Jacobsen. Density functionals for surface science: Exchange-correlation model development with bayesian error estimation. Physical Review B, 85(23):235149, 2012.
- [10] Oleksandr Bondarchuk, Xin Huang, Jooho Kim, Bruce D Kay, Lai‐Sheng Wang, JM White, and Zdenek Dohnálek. Formation of monodisperse (WO3)3 clusters on TiO2 (110). Angewandte Chemie International Edition, 45(29):4786–4789, 2006.
- [11] Jooho Kim, Oleksandr Bondarchuk, Bruce D. Kay, J. M. White, and Z. Dohnálek. Preparation and characterization of monodispersed WO3 nanoclusters on TiO2(110). Catalysis Today, 120(2):186–195, 2007.