Protein escape at the ribosomal exit tunnel: Effect of the tunnel shape
Abstract
We study the post-translational escape of nascent proteins at the ribosomal exit tunnel with the consideration of a real shape atomistic tunnel based on the Protein Data Bank (PDB) structure of the large ribosome subunit of archeon Haloarcula marismortui. Molecular dynamics simulations employing the Go-like model for the proteins show that at intermediate and high temperatures, including a presumable physiological temperature, the protein escape process at the atomistic tunnel is quantitatively similar to that at a cylinder tunnel of length Å and diameter Å. At low temperatures, the atomistic tunnel, however, yields an increased probability of protein trapping inside the tunnel while the cylinder tunnel does not cause the trapping. All- proteins tend to escape faster than all- proteins but this difference is blurred on increasing the protein’s chain length. A 29-residue zinc-finger domain is shown to be severely trapped inside the tunnel. Most of the single-domain proteins considered, however, can escape efficiently at the physiological temperature with the escape time distribution following the diffusion model proposed in our previous works. An extrapolation of the simulation data to a realistic value of the friction coefficient for amino acids indicates that the escape times of globular proteins are at the sub-millisecond scale. It is argued that this time scale is short enough for the smooth functioning of the ribosome by not allowing nascent proteins to jam the ribosome tunnel.
I Introduction
After the determination of the ribosome structures Gabashvili et al. (2000); Ban et al. (2000), there has been growing attention on understanding the role of the ribosomal exit tunnel on protein biosynthesis and on cotranslational protein folding (for recent reviews see Ref. Fedyukina and Cavagnero (2011); Trovato and O’Brien (2016); Javed et al. (2017); Thommen, Holtkamp, and Rodnina (2017)). Biochemical studies indicate that the tunnel plays an active role in the regulation of the protein translation process by blocking specific peptide sequences Nakatogawa and Ito (2002); Tenson and Ehrenberg (2002). The mechanism of this blocking or translation arrest can be associated with certain ribosomal protein’s motion which alters the tunnel shape Berisio et al. (2003). In cotranslational protein folding, the tunnel imposes a spatial confinement on the traversing nascent peptide while it is being synthesized by the ribosome. The narrow geometry of the tunnel was suggested to entropically promote the -helix formation Ziv, Haran, and Thirumalai (2005) whereas it may sterically obstruct the formation of -sheet Kirmizialtin, Ganesan, and Makarov (2004). Depending on the location within the tunnel, peptides can form simple -helices Lu and Deutsch (2005) and small tertiary structure units Kosolapov and Deutsch (2009). The latter can be observed near the tunnel exit port where there is enough space to hold the structure. Simulations Elcock (2006); O’Brien et al. (2010) and experiments Holtkamp et al. (2015); Nilsson et al. (2015); Kudva et al. (2018) indicate that cotranslational folding starts inside the tunnel, with the structures ranging from a non-native compact conformation Holtkamp et al. (2015) and transient tertiary structures O’Brien et al. (2010) to a small protein domain Nilsson et al. (2015). There are also considerations that the folding inside the ribosome tunnel is negligible leading to a focus only on the folding of nascent chains as they emerge from the tunnel, as shown in studies with stalled ribosome-bound nascent chain experiments Cabrita et al. (2009); Eichmann et al. (2010) and simulations O’Brien et al. (2011); Krobath, Shakhnovich, and Faísca (2013).
In recent works Bui and Hoang (2016, 2018), we suggested that the exit tunnel, as a passive conduit, has a significant impact on the early post-translational folding, i.e. shortly after the protein’s C-terminus is released from the peptidyl transferase center (PTC). This impact corresponds to a vectorial folding Bui and Hoang (2016) induced by the tunnel and is associated with the escape process of a full length protein from the tunnel. In particular, the folding and escape of a nascent protein at the tunnel are concomitant with each other. Folding accelerates the escape process whereas a gradual escape improves the protein foldability. Furthermore, we showed that the protein escape at the tunnel is governed by a diffusion mechanism and the escape time distribution can be captured by a simple model of a Brownian particle in a linear potential field.
The escape process also has an important meaning of itself. It should not be too quickly because this would leave an escaped protein significantly unfolded outside the ribosome, by that increases the chance of protein aggregation Dobson (2003). It cannot be also too slow because this would decrease the productivity of the ribosome. Interestingly, our previous study shows that the real length of ribosome exit tunnel is close to a cross-over tunnel length Bui and Hoang (2018) of 90 to 110 Å for the diffusion of small globular proteins. For tunnels of lengths larger than this cross-over length, the diffusion is much slower. Thus, it was suggested that the ribosome tunnel length may have been selected by evolution to facilitate an appropriate escape time.
The previous works Bui and Hoang (2016, 2018) on the protein escape process considered a highly simplified model of the ribosomal exit tunnel, being a hollow cylinder with repulsive wall. Real exit tunnel is highly porous for water-size molecules and effectively adopts an irregular shape Voss et al. (2006) for polypetides. The tunnel shape also depends on the type of organism Dao Duc et al. (2019). The aim of our present study is to work with a realistic tunnel to test the validity of the previous findings, and to investigate the effect of the tunnel shape on the protein escape process. For this purpose, we consider an atomistic model of the tunnel based on the resolved PDB structure of the large ribosome subunit of Haloarcula marismortui Ban et al. (2000). The atomistic tunnel incorporates all heavy atoms for the ribosomal RNA but only the ’s for the ribosomal proteins. The -only representation is also used for nascent proteins within a standard Go-like model Go (1983); Hoang and Cieplak (2000a, b); Clementi, Nymeyer, and Onuchic (2000). We have chosen the same coarse-grained level for ribosomal proteins for a consistency in modelling with the chosen Go-like model. This choice, however, reduces the roughness of the tunnel’s wall where amino acid side-chains are exposed. In order to accelerate the simulations all the ribosomal atoms are kept fixed, thus, the tunnel acts solely as a passive channel for the escaping proteins in our consideration.
The main focus of our paper is on the effect of the tunnel shape on the escape process. In order to delineate this effect, we compared the escape of a nascent protein at the atomistic tunnel with that at an equivalent cylinder tunnel. The latter is described such that it produces a similar median escape time to that obtained with the atomistic tunnel. This comparison shows similarities and differences between the two tunnels. Remarkably, we find that the atomistic tunnel yields a non-zero probability of trapping protein inside the tunnel while the cylinder tunnel does not. Other issues being discussed are the dependences of the escape time on temperature, on protein’s length and native state topology among small single domain proteins, and on the friction coefficient for amino acids. An estimation of real escape time from the simulations is also presented. Interestingly, we find that the estimated escape time is relevant to the functionality of the ribosome.
II Models and Methods
II.1 Protein and tunnel models
Nascent proteins are considered in a Go-like model Go (1983); Hoang and Cieplak (2000a, b); Clementi, Nymeyer, and Onuchic (2000), in which a protein is represented only by its Cα atoms. The intramolecular potential energy of a protein in a conformation is given by Clementi, Nymeyer, and Onuchic (2000)
| (1) | |||||
where is the number of amino acid residues; is the distance between residues and ; and are the bond and dihedral angles of the residue ; is equal to either 1 or 3; the star superscript corresponds to the native state’s value; is the native contact map with equal to 1 if there is a native contact between and and equal to 0 otherwise. is defined based on an all-atom consideration of the protein PDB structure with a contact cut-off distance between two atoms equal to 1.5 times the sum of their atomic van der Waals (vdW) radii (the C3 map in Ref. Bui and Hoang (2018)). Energy is given in units of , which corresponds to the depth of the 10-12 Lennard-Jones potential given in the fourth term of Eq. (1). The parameters used in the model are Å, Å, Å-2, , , .
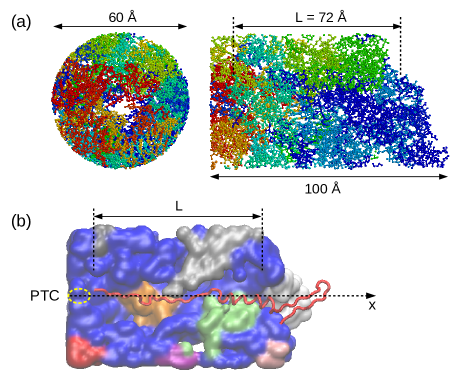
To build up the atomistic model of the ribosomal exit tunnel, we used the crystal structure of the Haloarcula Marismortui’s large ribosomal subunit with the PDB code 1jj2 Ban et al. (2000). Only a part of the subunit surrounding the tunnel was taken to the model (Fig. 1a). In particular, we excluded the ribosome’s atoms that are further than 30 Å from a chosen axis that originates from the PTC region and goes roughly through the middle of the tunnel. Furthermore, we kept only heavy atoms for the ribosomal RNA and only Cα atoms for the ribosomal proteins. The interaction potential between the Cα atoms of a nascent protein and the Cα atoms of a ribosomal protein is assumed to be repulsive and takes the form of . The interaction potential between a nascent protein’s Cα () and a ribosomal RNA heavy atom () is also repulsive and given by
| (2) |
where is the center-to-center distance between and ; Å is an effective radius of amino acid; is the atomic vdW radius of the ribosomal atom; Å is an effective additive radius accounting for the fact that hydrogen atoms are not considered in the model of the tunnel. For example, if is a carbon atom (with a vdW radius of 1.7 Å) then one gets Å, i.e. same as . We have checked that the above mentioned value of yields an adequate escape behavior for the nascent proteins Bui and Hoang (2020).
The simulations were carried out using molecular dynamics method based on the Langevin equation of motion and a Verlet algorithm Bui and Hoang (2016). The amino acids are assumed to have an uniform mass, . Temperature is given in units of , whereas time is measured in units of . We used the same value of the friction coefficient in the Langevin equation, , through out the studies except in the Subsection III.C where the dependence on the friction coefficient is investigated. In each simulation, first the polypeptide chain was grown in the tunnel from the PTC at a constant speed given by the growth time per amino acid. This growth time is slow enough to produce converged properties of fully translated protein conformations in terms of the radius of gyration and the number of native contacts, i.e. the distributions of these quantities are similar to those obtained with a much larger growth time Bui and Hoang (2016). After the protein is completely translated, the simulation was run until it has fully escaped from the tunnel. The escape time was measured from the moment of complete translation. Because the exit port is irregular with a complex geometry, in order to capture the essential escape time, we have defined the tunnel region as the space within a cylinder of length Å and radius of 15 Å centered about the tunnel axis . This region starts from an opening of the tunnel near the PTC and ends at an inner edge of the exit port (Fig. 1), corresponding to positions from Å to Å. An amino acid residue is considered to have escaped from the tunnel if it is found outside the tunnel region. Typically, for each temperature about 1000 independent growth and escape trajectories are simulated to obtain the statistics of the escape time.
II.2 Diffusion model
The escape of a fully translated protein at the ribosome tunnel is driven by: (i) an enthalpic force associated with the folding of the protein outside the tunnel, (ii) an entropy gain as the chain emerges from the tunnel, and (iii) the stochastic motion of a partially unfolded chain. It has been shown that in the Go-like model, the free energy change of a protein along an escape coordinate is a monotonically decreasing function, which is approximately linear at intermediate and high temperatures Bui and Hoang (2016, 2020). Interestingly, all these effects can be effectively acquired in a diffusion model Bui and Hoang (2016, 2018), which describes the protein escape as the diffusion of a Brownian particle pulled by a constant force in one dimension. The particle diffusion in a potential field is governed by the Smoluchowski equation Van Kampen (1992)
| (3) |
where is a probability density of finding the particle at position and at time , given that it was found at position at time ; is the diffusion constant, assumed to be position independent; and is the inverse temperature with the Boltzmann constant. The escape time is described as the first passage time of the particle reaching a distance from an origin in the drift direction. Given an external potential of the linear form , where is the coordinate of the particle and is the force, the distribution of the escape time was obtained via an exact solution Cox and Miller (1965) and is given by Bui and Hoang (2018)
| (4) |
Using the distribution in Eq. (4) one obtains the mean escape time
| (5) |
with as the mean diffusion speed, and the standard deviation
| (6) |
Note that both and diverges when , for which becomes a heavy-tailed Lévy distribution. It has been shown that and depend on , on the protein and on other conditions such as the crowders’ volume fraction outside the tunnel Bui and Hoang (2018).
III Results and Discussion
III.1 Effect of tunnel shape on escape process
To study the effect of tunnel shape on the escape process, we consider the immunoglobulin binding (B1) domain of protein G (GB1) as a nascent protein. This protein has a length of amino acids and was considered in our previous studies Bui and Hoang (2016, 2018). The folding temperature of GB1 was found as Bui and Hoang (2018). Experimentally, the melting temperature of the wild-type GB1 at pH 5.5 has been reported to be 80.5∘C Campos-Olivas et al. (2002). We will study the escape process at various temperatures but will focus on the simulation temperature , which after unit conversion corresponds to a physiologically relevant temperature of 26.3∘C.
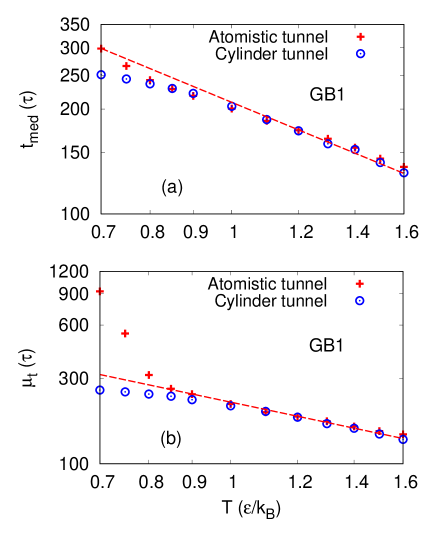
In order to delineate the effects of tunnel shape on the escape process we sought for an equivalent cylinder tunnel that yields a similar escape time to that obtained at the atomistic tunnel for the protein GB1. We found that among the cylinder tunnels of the same length as that of the atomistic tunnel, i.e. Å, the one with diameter Å satisfies quite well the last requirement over a wide range of temperature. Figure 2(a) shows that the median escape times for the atomistic tunnel and the cylinder tunnel are quite close to each other for various temperatures from to . Figure 2(b) also shows that the mean escape times for the two tunnels agree very well with each other at intermediate and high temperatures (). For , both and for the atomistic tunnel are larger than for the cylinder tunnel and the differences increase as the temperature decreases. These differences indicate that at low temperatures, it is more difficult for proteins to escape from the atomistic tunnel than from the cylinder one. It appears that the physiological temperature corresponds to a borderline behavior of the escape process, in which the effect of tunnel shape starts to get in.
Figure 2 also shows the linear dependences of and on in log-log scales (the dashed lines) as it would be found for a Brownian particle diffused in a potential field with a constant . Our previous study Bui and Hoang (2018) shows that this linear behavior is found for a homopolymer chain with self-repulsion, and thus can be applied for intrinsically disordered proteins. For foldable proteins like the GB1, this linear dependence can be observed only at high temperatures, at which the proteins are unfolded during the escape.
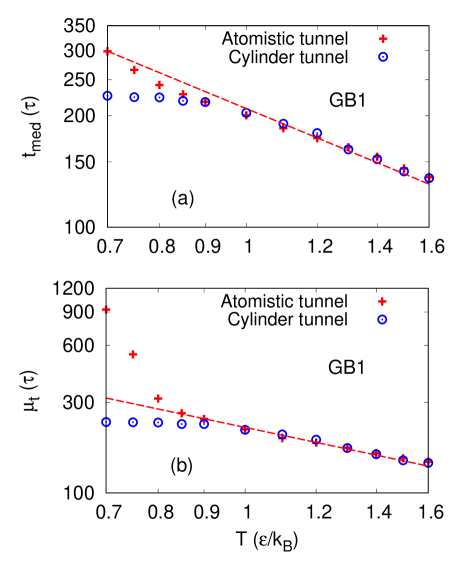
Note that one can also have an equivalent cylinder tunnel of a length different from that of the atomistic tunnel. For example, we found that the cylinder tunnel of Å and Å also yields similar median and mean escape times to those of the atomistic tunnel (see Fig. S1 of the supplementary material) with an equally good agreement as in Fig. 2. For the most relevant comparison, we consider only the equivalent cylinder tunnel of Å and Å.
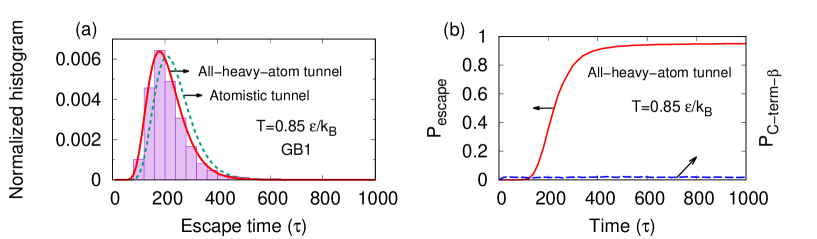
We now examine more carefully the escape processes of GB1 at the atomistic and cylinder tunnels at . Figure 3(a) shows that at the atomistic tunnel, the histogram of the escape time for this protein obtained from the simulations follows quite well the distribution function given by the diffusion model in Eq. (4). Figure 3(b) shows that the probability of protein escape has a sigmoidal dependence on the time with reached the value of 1 at . This result means that the protein can effectively escape from the tunnel without significant delays compared to the median escape time, . Fig. 3(b) also shows the dependence of the probability of forming the C-terminal -hairpin inside the tunnel on time. The time dependence of this probability is obtained by averaging over multiple escape trajectories. The C-terminal -hairpin is said to be formed inside the tunnel if it forms at least half of its native contacts and when all of its residues (41-56) are located within the tunnel. We tracked this -hairpin because previous study showed that at low temperatures the GB1 protein can escape from a cylinder tunnel through two different pathways depending on whether the C-terminal -hairpin is formed inside the tunnel or not Bui and Hoang (2016). Fig. 3(b) shows that at the atomistic tunnel, only a small fraction of about 2% of the escape trajectories have this -hairpin formed inside the tunnel. We have checked that the trajectories having this hairpin formed typically correspond to longer escape times than other trajectories.
Figure 3(c) shows the histogram of conformations observed during the escape process as a function of the number of native contacts and the number of residues escaped from the tunnel for protein GB1 at the atomistic tunnel. The histogram shows a high-density cloud of conformations having intermediate values of and , indicating that the protein folds during the escape. The blurring of the cloud, however, suggests that the protein adopts a wide range of conformations during the escape process. Given that the maximum for GB1 is 120, the histogram shows that during the escape the protein can form up to two-thirds of all of its native contacts. Note that conformations of , i.e. completely located within the tunnel, are also present in the histogram.
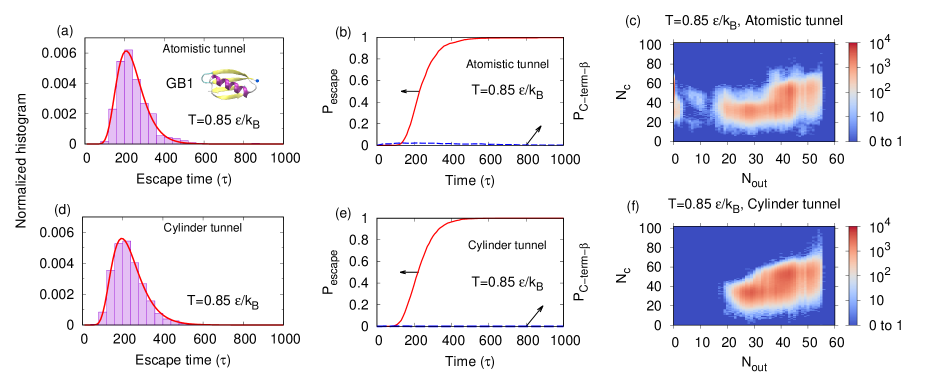
Figures 3(d,e,f) show that the equivalent cylinder tunnel of diameter Å produces not only a similar escape time distribution but also a similar dependence of on time and a similar histogram of escaping protein conformations to those obtained with the atomistic tunnel. Notice, however, that there are differences. First, the escape time distribution at the atomistic tunnel is slightly more narrow than the one at the cylinder tunnel while the median escape time at the cylinder is slightly smaller than at the atomistic tunnel (220 vs. 230 ). Second, for the cylinder tunnel the escape probability reaches 1 faster at the time about . Third, the histogram in and less dispersed in the case of the cylinder tunnel. These differences indicate that the protein escapes relatively more easily at the cylinder tunnel than at the atomistic tunnel.
Other differences at the two tunnels can be seen at the probability of forming the C-terminal -hairpin and the histogram of conformation during the escape process. Fig. 3(e) shows that for the cylinder tunnel the probability is zero at all times, indicating that the C-terminal -hairpin does not form inside the cylinder tunnel. Fig. 3(f) shows that the histogram of conformations during the escape process for the cylinder tunnel does not include conformations of small (less than about 16). These results are different to those at the atomistic tunnel and indicate that the pathways at the atomistic tunnel are more diverse than at the cylinder tunnel.
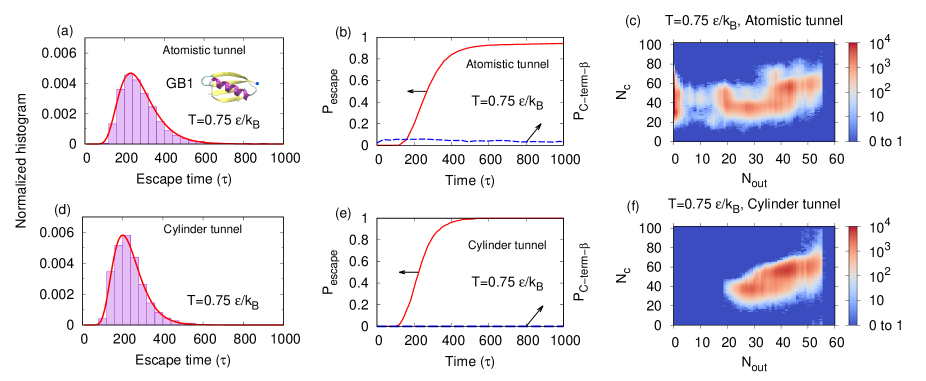
The differences between the escape processes at the two tunnels magnify as the temperature is lowered. In Fig. 4 we show the same plots as in Fig. 3 but for . Figures 4(a) and 4(d) show that the escape time distribution for the atomistic tunnel is significantly more broad than for the cylinder tunnel. Figures 4(b) and 4(e) show that for the atomistic tunnel the escape probability can reach only about 94% at while for cylinder tunnel it can reach 100% at . Figure 4(b) shows that at , about 5% of the escape trajectories having the C-terminal -hairpin formed inside the atomistic tunnel while this fraction remains to be zero for the cylinder tunnel (Fig. 4(e)). Figures 4(c) and 4(f) show that the histogram of escaping conformations for the atomistic tunnel is more complex than for the cylinder tunnel. There appears a significant number of conformations of low , including those of , at the atomistic but the cylinder tunnel. We have checked that the trajectories that did not end with a successful escape after a long time compared to are associated with conformations of . These conformations are identified as kinetic traps in the escape process.
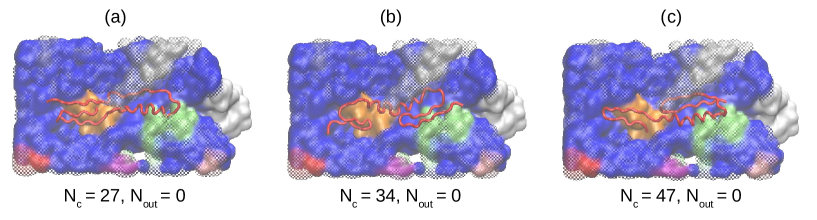
Figure 5 shows several trapped conformations obtained at for GB1 at the atomistic tunnel. The number of native contacts in these conformations is different but all of them have the -helix and at least one -hairpin formed. The conformation shown in Fig. 5(c) also has a partial tertiary structure established by contacts between the -helix and the N-terminal -hairpin. These conformations did not appear at the cylinder tunnel, indicating that the irregular shape of the atomistic tunnel allows for and makes the formation of trapped conformations more easy inside the tunnel. Note that at the physiological temperature , there were no kinetic traps. This can be understood as due to two reasons: the faster diffusion at this temperature helps the protein to avoid trapped conformations, and the larger thermal fluctuations help the protein to get out from the traps. The trapping at an atomistic ribosome tunnel and the alleviation of trapping by increased thermal fluctuations have been also observed for the chymotrypsin inhibitor 2 (CI2) protein in an early simulation study by Elcock Elcock (2006). Our results here for GB1 are consistent with that previous work.
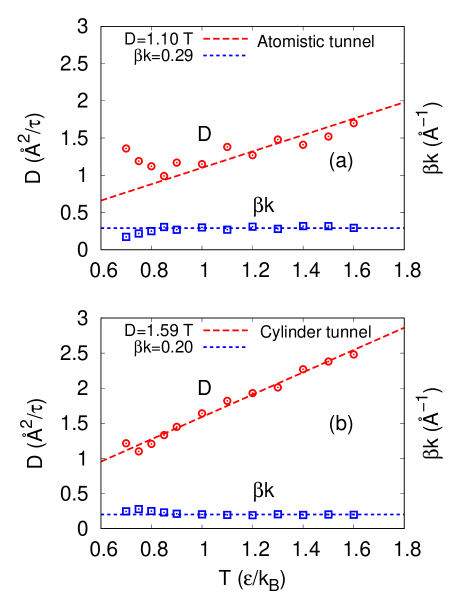
It is interesting now to compare the protein diffusion properties at the two tunnels using the diffusion model. Figure 6 shows the values of the diffusion constant and the potential slope obtained by fitting the escape time histograms at various temperatures to the diffusion model, wherein it can be seen that for both the tunnels appears to increase linearly with temperature whereas tends to adopt a constant value. The linear dependence of on temperature agrees with that of an ideal Brownian particle. The atomistic tunnel, however, yields a lower and a higher than the cylinder tunnel at intermediate and high temperatures (), while the average diffusion speed given by is almost the same for the two tunnels. We have checked that at these temperatures, the escape time distributions at the atomistic tunnel are slightly narrower than at the cylinder tunnel. At low temperatures (), both and for the atomistic tunnel deviate significantly from the average trends due to the impact of kinetic trapping. Also at low temperatures, the escape time distribution for the atomistic tunnel becomes broader than for the cylinder tunnel.
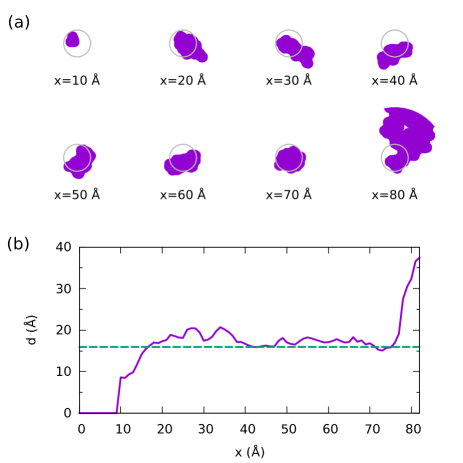
To better understand the differences between the two tunnels, we sought for a quantitative comparison between the shapes of the atomistic tunnel and the cylinder tunnel. To that extent, we have calculated the area of the inner cross-section of the atomistic tunnel as a function of the position along the tunnel axis using a probe sphere. The effective diameter of the tunnel at a given position then was calculated as . Figure 7(a) shows that the shape of the tunnel’s cross-section varies strongly with . It is typically not circular and significantly deviates from that of the equivalent cylinder tunnel. The tunnel is also quite narrow near the PTC and becomes much wider at the exit port. Figure 7(b) shows that the effective diameter of the atomistic tunnel varies, but not too strongly, between 15 and 20 Å, for the positions of between 15 and 75 Å. Notice that for these positions, the diameter Å of the equivalent cylinder tunnel lies within the variation range of the atomistic tunnel’s diameter but is near the lower bound of this range. This can be understood as the irregular shape of the atomistic tunnel’s cross-sections makes it effectively smaller for nascent proteins.
The present model of the atomistic tunnel neglects the presence of amino acid side-chains. We have checked that by considering all the heavy atoms of ribosomal proteins in the tunnel model while keeping the Cα-only representation for GB1, the escape time distribution at changes only slightly with a small shift towards smaller values, but the escape probability reaches only about 95% at the time of 1000 (Fig. S2 of the supplementary material). We also found that due to the increased roughness of the tunnel surface, the all-heavy-atom tunnel requires a longer growth time of the protein, with per amino acid, to obtain converged properties of fully translated protein conformations. The results indicate that amino acid side-chains may have a relatively small but detrimental effect on the escape process. A proper consideration of this effect, however, would need models that include side-chain representations for both ribosomal and nascent proteins and allow the degrees freedom of side-chain rotation. It can be expected that while the side-chain exclude volumes cause some obstruction to the escape process, the freedom of side-chain rotation can make the escape somewhat easier.
III.2 Dependence of escape time on protein
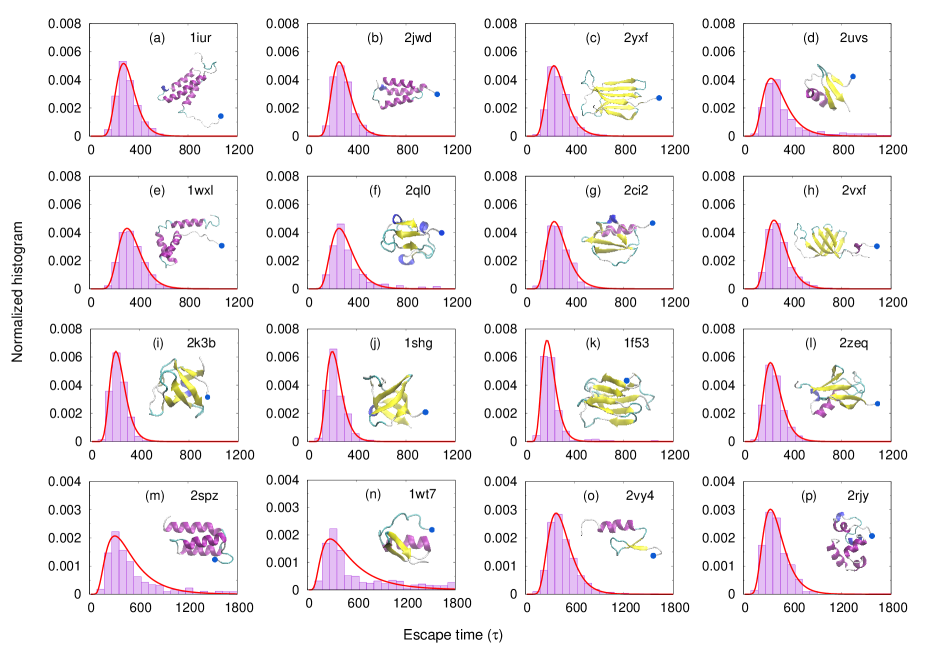
In order to study the dependence of the escape time on protein, apart from GB1 we selected additional 16 single domain proteins of lengths between 37 and 99 residues and belonging to different classes of all-, all- and proteins, and carried out simulations for these proteins. We consider only the atomistic tunnel and the simulation temperature . Figure 8 shows that the histograms of the escape times for the selected proteins are quite similar in the overall shape and the range of most probable values. The peak positions of the histograms vary but within the same order of magnitude. The distribution width is the most narrow for the all- proteins. For most of the proteins, the histogram can be fitted quite well to the distribution function given by Eq. (4) of the diffusion model. For a few proteins, i.e. the ones with PDB codes 2spz and 1wt7, the agreement with the diffusion model is worse than for others with the appearance of a thick tail of large escape times (Fig. 8(m and n)). For most of the proteins, we observed trajectories with trapped conformations of . The fraction of non-escaped trajectories at the largest time in the histograms shown in Fig. 8 (1200 or 1800 ) is below 2% for 10 out of 16 proteins (see the caption of Fig. 8). At a larger time of 8000 , this fraction falls below 2% for all proteins except 2spz, for which this fraction remains at 9.7%. Thus, most proteins can escape efficiently. We have checked that the trapped conformations of 2spz typically have a two-helix bundle formed within the tunnel, resulting in an increased difficulty for its escape.
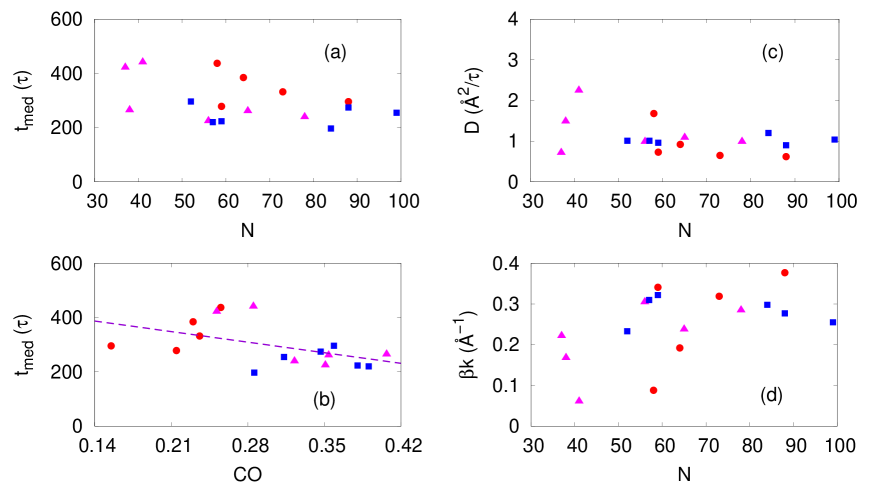
Figure 9(a) shows the median escape time as a function of the chain length for all 17 proteins considered including GB1. It can be seen that is found in the range from 200 to 500 and does not seem to depend on . However, the variation of the escape times among the proteins decreases with . Figure 9(b) plots against a topological parameter of the protein native state, the relative contact order () Plaxco, Simons, and Baker (1998). It shows an weak but visible trend that decreases with . From the types of data points shown in Fig. 9(b) one can also see that the all- proteins on averages escape faster than the all- proteins, whereas the proteins can escape either as fast or as slow as the two other groups. From the fits of the simulated escape time distribution to the diffusion model, we obtained the values of and for 17 proteins. Figures 9(c) and 9(d) show that both and vary strongly among the proteins, but like for , the variation decreases with indicating a kind of convergence. It can be also noticed that the strongest variation belongs to the proteins, whereas the weakest belongs to the proteins. It can be expected that proteins of length have similar and diffusion properties at the tunnel to the ones of length .
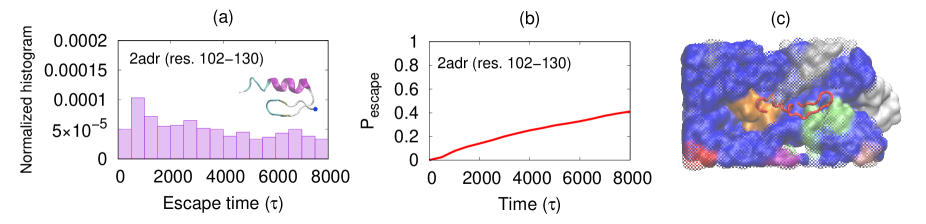
It is interesting that all the proteins considered are able to escape from the atomistic tunnel successfully including the CHHC zinc-finger domain (2vy4) which has the length of only 37 residues. In order to check whether a smaller zinc-finger domain can escape, we carried out the simulations for a 29-residue domain (res. 102-130) of ADR1 protein with the pdb code 2adr. Figure 10 shows that this zinc-finger domain poorly escapes the tunnel with only 40% of the trajectories being able to escape after a long simulation time of 8000 . A projected median escape time for this domain would be at least about 50 times larger than for GB1. Furthermore, the simulated escape time distribution as shown Fig. 10(a) cannot be fitted to the diffusion model. Fig. 10(c) shows that a typical trapped conformation of this zinc-finger domain has the -helix and the N-terminal -hairpin formed and it is found deeply within the tunnel. The partial folding observed here is consistent with a recent experiment which indicates that the 2adr zinc-finger domain can fold completely within the tunnel Nilsson et al. (2015). The difference between the zinc-finger domain of 2adr and that of 2vy4 is that the latter is 8 residues longer and has a more developed -hairpin with a coil-like flagging tail near the N-terminus. This flagging tail makes the -hairpin formation inside the tunnel more difficult allowing the N-terminus to reach out of the tunnel. It is suggested that the behavior of the 29-residue zinc-finger domain is similar to the diffusion with in the diffusion model. A protein trapped entirely inside the tunnel would feel no free energy gradient and therefore has no indication on which direction to diffuse. It can be expected that the cross-over tunnel length Bui and Hoang (2018) for the 29-residue zinc-finger domain is significantly shorter than the real length of the exit tunnel and therefore the protein is found in the slow diffusion regime.
III.3 Dependence of escape time on friction coefficient
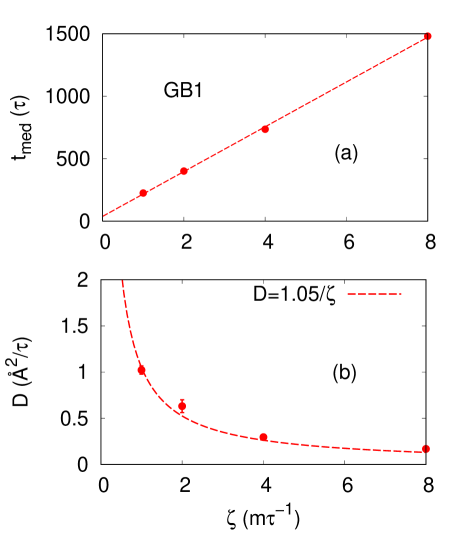
This subsection is relevant only to the methodology used in the study but it helps to better interpret the previous results. All the simulations in the previous subsections were done with the friction coefficient for amino acids. This value of may not be realistic for real proteins inside cells. Thus, we ask how the escape time would depend on and whether one can extrapolate this dependence to obtain the real escape time. For this purpose we carried out additional simulations for GB1 with , 4, and 8 at the atomistic tunnel with . In these simulations, because the increased friction slows down the dynamics, the growth time per amino acid was also increased to 200, 400 and 800 , respectively, for the given values of . Fig. 11(a) shows that the median escape time is an almost perfect linear function of . This linear dependence indicates that the simulation results are in the overdamped (large friction) regime. Fig. 11(b) shows that the diffusion constant of the escaping protein, obtained by fitting the simulated escape time distribution to the diffusion model, decreases with like . Together with the approximate linear dependence of on temperature shown Fig. 6, one finds a complete consistency with the Einstein’s relation where is the friction coefficient of a Brownian particle. Thus, protein at the tunnel behaves very much like a Brownian particle if one assumes that the quantity is proportional to and plays the role of an effective friction coefficient of the whole protein.
Given that Å, g/mol, and kcal/mol, the time unit in our simulation can be calculated as ps. The simulation’s friction unit g s-1. The realistic friction coefficient of amino acid in water can be obtained from the Stokes law, , where Poise is the viscosity of water at 25∘C. One obtains g s. By extrapolating the linear dependence in Fig. 11(a) one finds that at the median escape time for GB1 is ns. This time appears to be too short for large scale motion like the protein escape.
Veitshans et al. Veitshans, Klimov, and Thirumalai (1997) suggested that at high friction, inertial terms in the Langevin equation are irrelevant, and the natural time unit is . For water at room temperature, a direct calculation from the last formula gives ns. With some scaling factor, Veitshans et al. Veitshans, Klimov, and Thirumalai (1997) estimated that ns. With these revised time units, the theoretical estimate of is either 18 s or 90 s. The experimental refolding time of GB1 at neutral pH is about 1 ms Alexander, Orban, and Bryan (1992). We have checked that within the same Go-like model at , the median refolding time is about 50% larger than . Thus, the model prediction of the refolding time is smaller but within the same order of magnitude as the experimental value given that some uncertainties are associated with the estimates. With the above estimates, and given the results of the previous section, it can be expected that the escape times of single-domain proteins are of the order of 0.1 ms, i.e. in the sub-millisecond scale.
IV Conclusion
There are several remarks we would like to mention for the conclusion. First, the shape of the ribosomal exit tunnel appears to cause increased difficulty for nascent proteins to escape compared to a smooth cylinder tunnel. This difficulty is reflected by the appearance of kinetic traps in the escape pathways leading to lengthened escape times. We have shown that the trapped conformations are completely located inside the tunnel and usually have a significant development of tertiary structure. The formation of tertiary structure elements inside the tunnel correlates with the modulated shape of the ribosome tunnel, which has some narrow parts but also some wider parts which can hold a tertiary unit. In contrast, the equivalent cylinder tunnel of 13.5 Å diameter does not allow tertiary structure formation and yields no kinetic trapping. Second, thermal fluctuations are important for the escape of nascent proteins. We have shown that for GB1, a significant fraction of escape trajectories get trapped at , but not at the physiological temperature . Interestingly, at the latter temperature, almost all of the 17 single-domain proteins considered are able to escape efficiently, even the smallest one, the 37-residue 2vy4. Note that the trapping arises solely due to the folding of a protein within the tunnel, thus it depends on temperature. At high temperatures, folding is slow and diffusion is fast, therefore a protein would have a low probability of getting trapped before escaping from the tunnel. At low temperatures, folding is fast while diffusion is slow, the trapping probability is increased. On the other hand, a protein would get out from a trap easier at a higher temperature.
Third, if a protein or peptide is too small it cannot escape efficiently from the tunnel. The example of the 29-residue zinc-finger domain of 2adr shows that the protein is severely trapped inside the tunnel with the median escape time about of two orders of magnitude larger than that of GB1. The trapped protein is not guided by a potential gradient towards the escape direction. This example reflects a relation between the protein size and a cross-over tunnel length for efficient diffusion, as predicted by our previous study with the cylinder tunnel Bui and Hoang (2018). Forth, the escape time of single-domain proteins weakly depends on the native state topology and is almost independent of the protein size. Our model predicts that the protein escape time at the ribosome tunnel is of the order of 0.1 ms. The latter is much shorter than the time needed by the ribosome to translate one codon (tens of milliseconds), therefore not allowing nascent proteins to jam the ribosome tunnel.
One may ask to what extent hydrophobic and electrostatic interactions of a nascent protein with the ribosome exit tunnel can alter the above obtained results. It is well-known that the tunnel’s wall formed by the ribosomal RNA is negatively charged. We found that for H. marismortui’s ribosome, the tunnel’s inner surface with Å has only four hydrophobic side-chains that are clearly exposed within the tunnel, belonging to Phe61 of protein L4, Met130 of protein L22, and Met26 and Leu27 of protein L38, and about 10 exposed charged amino acid side-chains. These statistics indicate that the effect of hydrophobic interaction on the escape process can be considerably small whereas the Coulomb interaction may have a strong effect on nascent chains. However, if the total charge of a nascent protein is neutral, the electrostatic forces on the protein’s positive and negative charges may cancel out each other. Thus, it is reasonable to expect that the energetic interactions of nascent proteins with the tunnel can lead to specific changes in the escape behavior for individual proteins, but on an average they give only higher-order corrections to what obtained with excluded volume interaction.
Finally, like for the cylinder tunnel, it is found that the escape time distribution at the atomistic tunnel for various proteins follows very well the one-dimensional diffusion model of a drifting Brownian particle. This consistent finding suggests that the protein escape at the ribosome tunnel may have been designed by Nature to be simple, efficient and predictable for the smooth functioning of the ribosome. This result also proves the usefulness of using simple stochastic models to understand complex dynamics of biomolecules.
Supplementary Material
See supplementary material for the dependences of the median escape time and the mean escape time on temperature for protein GB1 at the cylinder tunnel of length Å and diameter Å, and for the histogram of the escape time and the time dependences of the escape probability and the probability of the C-terminal -hairpin formation inside the tunnel for protein GB1 at a tunnel model that considers all the heavy atoms of the ribosomal RNA and the ribosomal proteins.
Acknowledgements.
This research is funded by Vietnam National Foundation for Science and Technology Development (NAFOSTED) under grant number 103.01-2019.363. T.X.H. also acknowledges the support of the International Centre for Physics at the Institute of Physics, VAST under grant number ICP.2020.05. We thank the VNU Key Laboratory of Multiscale Simulation of Complex Systems for the occasional use of their high performance computer.Data availability statement
The data that support the findings of this study are available from the corresponding author upon reasonable request.
References
- Gabashvili et al. (2000) I. S. Gabashvili, R. K. Agrawal, C. M. Spahn, R. A. Grassucci, D. I. Svergun, J. Frank, and P. Penczek, Cell 100, 537 (2000).
- Ban et al. (2000) N. Ban, P. Nissen, J. Hansen, P. B. Moore, and T. A. Steitz, Science 289, 905 (2000).
- Fedyukina and Cavagnero (2011) D. V. Fedyukina and S. Cavagnero, Ann. Rev. Biophys. 40, 337 (2011).
- Trovato and O’Brien (2016) F. Trovato and E. P. O’Brien, Annu. Rev. Biophys. 45, 345 (2016).
- Javed et al. (2017) A. Javed, J. Christodoulou, L. D. Cabrita, and E. V. Orlova, Acta Crystallogr. D 73, 509 (2017).
- Thommen, Holtkamp, and Rodnina (2017) M. Thommen, W. Holtkamp, and M. V. Rodnina, Curr. Opin. Struct. Biol. 42, 83 (2017).
- Nakatogawa and Ito (2002) H. Nakatogawa and K. Ito, Cell 108, 629 (2002).
- Tenson and Ehrenberg (2002) T. Tenson and M. Ehrenberg, Cell 108, 591 (2002).
- Berisio et al. (2003) R. Berisio, F. Schluenzen, J. Harms, A. Bashan, T. Auerbach, D. Baram, and A. Yonath, Nat. Struct. Mol. Biol. 10, 366 (2003).
- Ziv, Haran, and Thirumalai (2005) G. Ziv, G. Haran, and D. Thirumalai, Proc. Natl. Acad. Sci. USA 102, 18956 (2005).
- Kirmizialtin, Ganesan, and Makarov (2004) S. Kirmizialtin, V. Ganesan, and D. E. Makarov, J. Chem. Phys. 121, 10268 (2004).
- Lu and Deutsch (2005) J. Lu and C. Deutsch, Nat. Struct. Mol. Biol. 12, 1123 (2005).
- Kosolapov and Deutsch (2009) A. Kosolapov and C. Deutsch, Nat. Struct. Mol. Biol. 16, 405 (2009).
- Elcock (2006) A. H. Elcock, PLoS Comp. Biol. 2, 0824 (2006).
- O’Brien et al. (2010) E. P. O’Brien, S.-T. D. Hsu, J. Christodoulou, M. Vendruscolo, and C. M. Dobson, J. Am. Chem. Soc. 132, 16928 (2010).
- Holtkamp et al. (2015) W. Holtkamp, G. Kokic, M. Jäger, J. Mittelstaet, A. A. Komar, and M. V. Rodnina, Science 350, 1104 (2015).
- Nilsson et al. (2015) O. B. Nilsson, R. Hedman, J. Marino, S. Wickles, L. Bischoff, M. Johansson, A. Müller-Lucks, F. Trovato, J. D. Puglisi, E. P. O’Brien, et al., Cell Rep. 12, 1533 (2015).
- Kudva et al. (2018) R. Kudva, P. Tian, F. Pardo-Avila, M. Carroni, R. B. Best, H. D. Bernstein, and G. Von Heijne, Elife 7, e36326 (2018).
- Cabrita et al. (2009) L. D. Cabrita, S.-T. D. Hsu, H. Launay, C. M. Dobson, and J. Christodoulou, Proc. Natl. Acad. Sci. USA 106, 22239 (2009).
- Eichmann et al. (2010) C. Eichmann, S. Preissler, R. Riek, and E. Deuerling, Proc. Natl. Acad. Sci. USA 107, 9111 (2010).
- O’Brien et al. (2011) E. P. O’Brien, J. Christodoulou, M. Vendruscolo, and C. M. Dobson, J. Am. Chem. Soc. 133, 513 (2011).
- Krobath, Shakhnovich, and Faísca (2013) H. Krobath, E. I. Shakhnovich, and P. F. Faísca, J. Chem. Phys. 138, 215101 (2013).
- Bui and Hoang (2016) P. T. Bui and T. X. Hoang, J. Chem. Phys. 144, 095102 (2016).
- Bui and Hoang (2018) P. T. Bui and T. X. Hoang, J. Chem. Phys. 149, 045102 (2018).
- Dobson (2003) C. M. Dobson, Nature 426, 884 (2003).
- Voss et al. (2006) N. Voss, M. Gerstein, T. Steitz, and P. Moore, J. Mol. Biol. 360, 893 (2006).
- Dao Duc et al. (2019) K. Dao Duc, S. S. Batra, N. Bhattacharya, J. H. Cate, and Y. S. Song, Nucleic Acids Research 47, 4198 (2019).
- Go (1983) N. Go, Ann. Rev. Biophys. Bioeng. 12, 183 (1983).
- Hoang and Cieplak (2000a) T. X. Hoang and M. Cieplak, J. Chem. Phys. 112, 6851 (2000a).
- Hoang and Cieplak (2000b) T. X. Hoang and M. Cieplak, J. Chem. Phys. 113, 8319 (2000b).
- Clementi, Nymeyer, and Onuchic (2000) C. Clementi, H. Nymeyer, and J. N. Onuchic, J. Mol. Biol. 298, 937 (2000).
- Schmeing et al. (2005) T. M. Schmeing, K. S. Huang, S. A. Strobel, and T. A. Steitz, Nature 438, 520 (2005).
- Bui and Hoang (2020) P. T. Bui and T. X. Hoang, J. Phys.: Conf. Ser. 1506, 012022 (2020).
- Van Kampen (1992) N. G. Van Kampen, Stochastic Processes in Physics and Chemistry, 3rd ed. (Elsevier, 1992).
- Cox and Miller (1965) D. R. Cox and H. D. Miller, The Theory of Stochastic Processes (Chapman and Hall, 1965) pp. 219–223.
- Campos-Olivas et al. (2002) R. Campos-Olivas, R. Aziz, G. L. Helms, J. N. Evans, and A. M. Gronenborn, FEBS Lett. 517, 55 (2002).
- Plaxco, Simons, and Baker (1998) K. W. Plaxco, K. T. Simons, and D. Baker, J. Mol. Biol. 277, 985 (1998).
- Veitshans, Klimov, and Thirumalai (1997) T. Veitshans, D. Klimov, and D. Thirumalai, Fold. Des. 2, 1 (1997).
- Alexander, Orban, and Bryan (1992) P. Alexander, J. Orban, and P. Bryan, Biochem. 31, 7243 (1992).
Supplementary Material for: “Protein escape at the ribosomal exit tunnel: effect of the tunnel shape”, P.T. Bui and T.X. Hoang