Photometric and spectroscopic evolution of the peculiar Type IIn SN 2012ab
Abstract
We present an extensive ( 1200 d) photometric and spectroscopic monitoring of the Type IIn supernova (SN) 2012ab. After a rapid initial rise leading to a bright maximum (MR = 19.39 mag), the light curves show a plateau lasting about 2 months followed by a steep decline up to about 100 d. Only in the band the decline is constant in the same interval. At later phases, the light curves remain flatter than the 56Co decline suggesting the increasing contribution of the interaction between SN ejecta with circumstellar material (CSM). Although heavily contaminated by emission lines of the host galaxy, the early spectral sequence (until 32 d) shows persistent narrow emissions, indicative of slow unshocked CSM, and the emergence of broad Balmer lines of hydrogen with P-Cygni profiles over a blue continuum, arising from a fast expanding SN ejecta. From about 2 months to 1200 d, the P-Cygni profiles are overcome by intermediate width emissions (FWHM km s-1), produced in the shocked region due to interaction. On the red wing a red bump appears after 76 d, likely a signature of the onset of interaction of the receding ejecta with the CSM. The presence of fast material both approaching and then receding is suggestive that we are observing the SN along the axis of a jet-like ejection in a cavity devoid of or uninterrupted by CSM in the innermost regions.
keywords:
supernovae: general – supernovae: individual: SN 2012ab – galaxies: individual: UGC 5460 – techniques: photometric – techniques: spectroscopic1 Introduction
Type IIn supernovae (SNe IIn, Schlegel, 1990) constitute 6–9 per cent of core-collapse SNe (CCSNe) (Cappellaro et al., 1997; Smartt et al., 2009; Smith et al., 2011a; Li et al., 2011), and their spectra are characterised by prominent lines of H and He I with emission components and composite profiles, although typically without showing broad P-Cygni absorption troughs. SNe IIn spectra show narrow-width (NW, km sec-1) components arising in the photoionised circumstellar medium (CSM) (Chevalier et al., 1994; Salamanca et al., 1998), along with intermediate-width (IW, km sec-1) components due to either Thomson broadening of NW lines, or due to emission from gas shocked by the SN ejecta (Chugai & Danziger, 1994; Chugai, 2001; Dessart et al., 2009). Some events show also very broad emission components arising from shocked ejecta (e.g. Turatto et al., 1993). Due to the dominance of strong CSM interaction, these SNe can be observed from X-ray to radio wavelengths, and may develop at later stages an IR excess resulting from re-processed radiation energy by pre-existing or newly formed dust (or a combination of the two processes, Gerardy et al., 2002; Fox et al., 2009). SNe IIn are luminous in comparison with other CCSNe. Extended follow-up campaigns revealed a great observational diversity, probably reflecting different conditions of the CSM (e.g. structures, clumpiness, orientation) and SN parameters (e.g. energy, mass of the ejecta, mass loss history). This adds to great interest in studying these objects.
At the brighter end of SNe IIn luminosity class (M mag; Gal-Yam, 2012), objects like SN 2006gy (Smith et al., 2007; Ofek et al., 2007; Smith & McCray, 2007; Agnoletto et al., 2009), SN 2006tf (Smith et al., 2008) and SN 2008iy (Miller et al., 2010) are found. Agnoletto et al. (2009) favoured CSM-interaction as source of the high luminosity, a scenario discussed by Moriya et al. (2013) along with CSM being produced by pulsational instability of a zero-age main sequence 80–130 M⊙ star. SN 2006tf and SN 2008iy are thought to arise from ejecta interaction with dense circumstellar shells ejected during the eruptions in Luminous Blue Variables (LBVs). At this luminosity we can also find the so-called SNe IIn-P, such as SNe 1994W, 2009kn and 2011ht (Chugai et al., 2004; Dessart et al., 2009; Kankare et al., 2012; Mauerhan et al., 2013b; Graham et al., 2017) that may originate from 8–10 M⊙ stars undergoing core collapse as a result of electron capture after a brief phase of enhanced mass loss, or from more massive (25 M⊙) progenitors, which experience substantial fallback of the metal-rich radioactive material. Some objects with similar moderate brightness (Mv 18 mag) may also result from intrinsically sub-luminous SN explosions interacting with CSM (Chugai et al., 2004; Benetti et al., 2016) or objects like SN 1997cy that have narrow Balmer lines in addition to the broad features reminiscent to those observed in broad-lined Type Ic SNe (Germany et al., 2000; Turatto et al., 2000; Rigon et al., 2003).
Narrow emission line spectra, somehow recalling SN IIn, are shown also by objects of different nature like the so-called “SN impostors” (Van Dyk et al., 2000; Maund et al., 2006) that are non-terminal eruptions of massive LBV stars. Sometimes these objects are followed by genuine core-collapse such as in SN 2009ip (e.g., Pastorello et al., 2013; Graham et al., 2014; Margutti et al., 2014; Smith et al., 2014; Fraser et al., 2015; Martin et al., 2015; Mauerhan et al., 2013a; Fraser, 2015; Graham et al., 2017).
The current understanding of the progenitor of SNe IIn is not fully established. Since SNe IIn have dense CSM draining kinetic energy from the blast wave, the most luminous SNe requires high mass loss rates of the order of 0.01 M⊙ yr-1 (Chugai et al., 2004; Smith & McCray, 2007). Such extreme environments point to episodic mass loss rates reminiscent of the eruptions as seen in Carinae and other LBVs having mass loss rates upto M⊙ yr-1 far exceeding the limits of line-driven winds (Smith & Owocki, 2006). The detection of their LBV like progenitors was claimed in the past for SNe 2005gl, 2009ip and 2010jl (Gal-Yam & Leonard, 2009; Mauerhan et al., 2013a; Smith et al., 2011b, 2016). This opens the way to consistently large mass loss rates with respect to conventional core collapse progenitors, ranging from 10-4 M⊙ yr-1 for Red supergiants (RSGs), 10-5 M⊙ yr-1 for Yellow supergiants (YSGs) (Andrews et al., 2017) and 10-4 M⊙ yr-1 for Wolf-Rayet stars (Kiewe et al., 2012).
In a few cases, it is interesting to note that SNe with narrow line spectra, such as SNe 2002ic and 2005gj have been also associated with thermonuclear explosions (Hamuy et al., 2003; Aldering et al., 2006), although Benetti et al. (2006) argued alternatively suggested the core-collapse of a stripped-envelope star interacting with a dense CSM as a more plausible explanation. However the Type Ia PTF 11kx (Dilday et al., 2012) (and more recently SN 2015cp, Graham et al., 2019 and ASASSN-18tb, Kollmeier et al., 2019) showed convincingly that SN Ia can also be surrounded by multiple shells of CSM. A class of transients, called Tidal Disruption Events (TDE), have been observed to occur in the nuclei of galaxies showing well defined characteristics, like blue continuum and strong lines of He II and H (van Velzen et al., 2011; Gezari et al., 2012). These have been interpreted as the result of the tidal disruption of stars by massive black hole in the galaxy nuclei (e.g. Rees, 1988). More recently, population of highly energetic transients in the centres of active galaxies has been identified. Important members of this class are PS1-10adi, SN 2006gy, CSS100217:102913 +404220, ASASSN-15lh (Kankare et al., 2017; Smith et al., 2007; Drake et al., 2011; Dong et al., 2016). The origin of these bright nuclear transients, that in the past was overlooked because of incorrectly associated with black hole activity, is debated. PS1-10adi is the most energetic and one of the best studied nuclear SN. Kankare et al. (2017) suggest that the high energy originates from shock interaction between expanding gas ejecta and with quantities of surrounding dense matter. The expanding material mostly arises from a star that has been tidally disrupted by the central black hole or a SN. However, such bright transients may also originate from reprocessed emission from an active galactic nuclei.
Recently, Bilinski et al. (2018) reported the photometric, spectroscopic and spectropolarimetric study of SN 2012ab which exploded close to the nucleus in the central region of the host galaxy. SN 2012ab was a high luminosity (M mag) SN IIn showing strong intermediate-width features due to CSM interaction, along with absence of broad absorption features. Spectropolarimetry suggested strong asymmetry in the CSM structure, with the progenitor being in part an eccentric binary system undergoing eruptive mass loss stages. In this paper, we extend the study of SN 2012ab with multiband photometry and extensive spectroscopic coverage until 1200 d post maximum. We provide information on the SN discovery and its host galaxy in Section 2. Section 3 describes the data acquisition and reduction procedures. In Section 4, we study the multi-band light curves, and compare the colours, absolute light curves and bolometric evolution with those of other SNe IIn. The spectroscopic evolution is described in Section 5. In Section 6, we analyse in detail the evolution of the H line profile. Finally in Section 7, we estimate the mass-loss rates and provide a plausible progenitor scenario for SN 2012ab. A summary is given in Section 8.
2 SN 2012ab and its host galaxy
SN 2012ab was discovered by J. Vinko and the ROTSE collaboration, at 15.8 mag (on 2012 January 31.35 UT (MJD = 55957.86) with the 0.45m ROTSE-IIIb telescope at the McDonald Observatory. The object was located at R.A.=12h22m47.6s, Decl.=+05∘3625.0 (J2000.0), in the proximity of the center of the host galaxy SDSS J122247.61+053624.2, at a redshift of 0.018 (Vinko et al., 2012). The details of the host galaxy are given in Table 1. No source was detected at the SN location before 2012 January 29.28, down to a limiting magnitude 18.7 mag.
Mould et al. (2000) simulated a velocity field model to estimate the recessional velocity of the host galaxy recession. The velocity model corrected for the influences of Virgo cluster, the Great Attractor and the Shapley supercluster gives 6010 40 km sec-1. Assuming H0 = 73 5 km sec-1 Mpc-1, this corresponds to a luminosity distance of 82.3 5.8 Mpc. The same value is also used by Bilinski et al. (2018).
In order to estimate the contribution of the host galaxy to the total reddening, we measured the equivalent width of the NaID 5890, 5896 Å doublet at the host galaxy redshift in a couple of good resolution spectra (2012 May 26, 2012 June 08 and 2012 June 27; resolutions are listed in Table 5). A number of relations have been proposed to correlate the equivalent width of the NaID lines to the dust extinction (Richmond et al., 1994; Munari & Zwitter, 1997; Turatto et al., 2003; Poznanski et al., 2012). The average value of equivalent widths for the D1 and D2 lines are estimated to be 0.24 0.03 Å and 0.30 0.05 Å, respectively. Using the Poznanski et al. (2012) relation and the equivalent widths, we estimate the host galaxy extinction along the line of sight to be AV = 0.19 0.10 mag, assuming AV = (Pei, 1992). We also estimated the equivalent widths of NaID using the formulations by Richmond et al. (1994); Munari & Zwitter (1997); Turatto et al. (2003); Poznanski et al. (2012) which yielded the results well within the error bars of our obtained values. We also adopt the galactic reddening (Schlafly & Finkbeiner, 2011) in the direction of SN 2012ab. Thus, the total reddening value is AV = 0.24 mag for = 0.079 mag, which is in good agreement with Bilinski et al. (2018).
Several diagnostics are used to estimate the host galaxy metallicity (McGaugh, 1991; Kewley & Dopita, 2002; Pettini & Pagel, 2004; Pilyugin & Thuan, 2005). We used the SDSS spectrum of the host galaxy taken on 2008 February 13111http://skyserver.sdss.org/dr14/en/get /SpecById.ashx?id=3242705331930818560 in which both [O III] 5007 Å and [N II] 6583 Å lines are clearly visible. Using the O3N2 index calibration by Pettini & Pagel (2004) we estimate the host galaxy metallicity to be 12 + log(O/H) dex. As a comparison, Allende Prieto et al. (2001), Asplund et al. (2009) and Caffau et al. (2011) estimated the solar metallicity to be 8.69 0.05 dex, 8.69 dex and 8.76 0.07 dex, respectively. Thus, the host galaxy metallicity is nearly solar.
| SN 2012ab | |
|---|---|
| Discovery Date | 2012 Jan. 31.35 (MJD 55957.86) |
| Explosion Date | 2012 Jan. (MJD 55955.3) |
| SN Type | IIn |
| RA (J2000.0) | 12h 22m 47.60s |
| Dec (J2000.0) | +05∘ 36 25.0 |
| Discovery Magnitude | 16.3 (Unfiltered) |
| E(B-V)tot | 0.079 mag |
| HOST GALAXY | |
| Galaxy Names | SDSS J122247.61+053624.2 |
| 2MASXJ12224762+0536247 | |
| LEDA 1286171 | |
| Morphology Type | Spiral |
| RA (J2000.0) | 12h 22m 47.61s |
| Dec (J2000.0) | +05∘ 36 24.3 |
| redshift (z) | 0.018 |
| vVirgo+Shapley (km s-1) | 601040 |
| mB | 16.60 mag |
| MB | 17.84 mag |
| 12+log(O/H) | 8.50.5 dex |
| d (Mpc) | 82.305.8 |
| (mag) | 34.57 |
2.1 SN Location
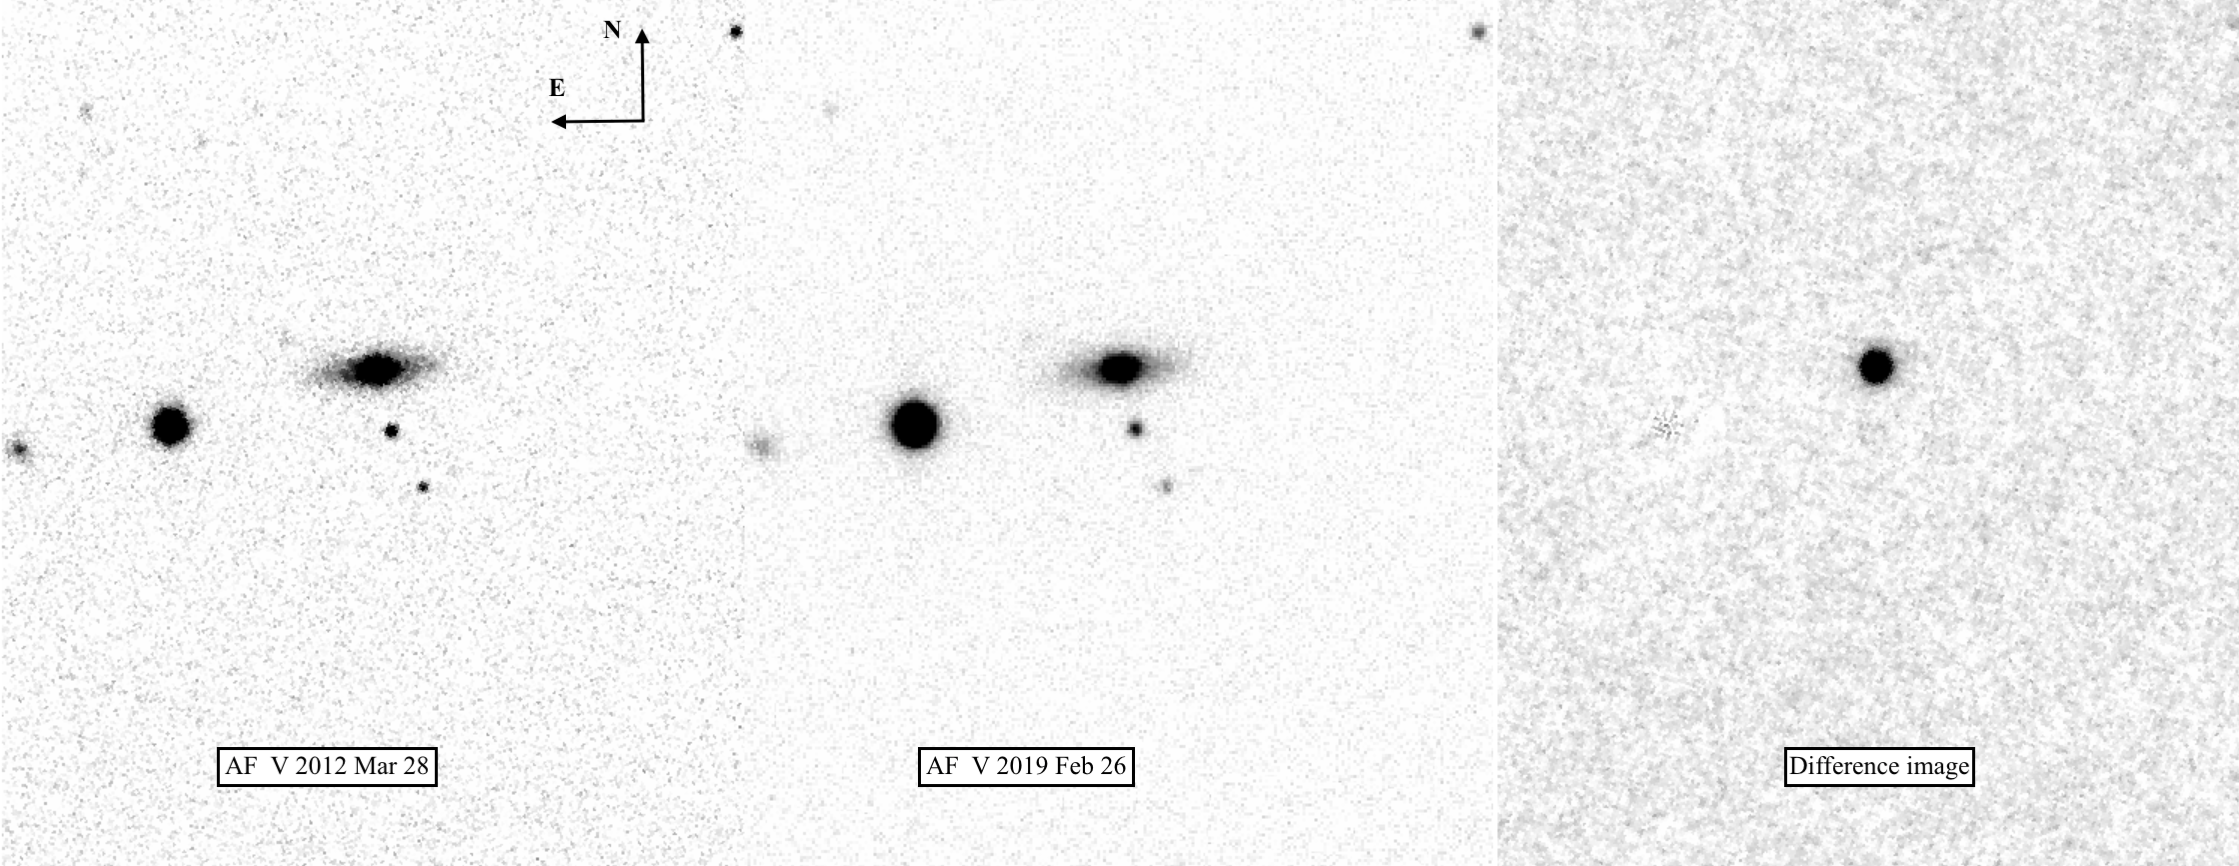
To determine the exact location of the SN in the host galaxy, we performed astrometric calibration of the SDSS DR14 image of the host galaxy taken in November 2001, and the galaxy-subtracted SN image taken in September 2012 with 1.0m ST, ARIES using astrometry.net (Barron et al., 2008). We use the same technique as Bilinski et al. (2018) for determining the SN and the host galaxy nucleus location by performing radial profile fits to the Moffat distribution. The uncertainty in the position is determined by refitting the centroid 100 times and quoting the rms of the covered measurements as the uncertainty. The precise position of the SN is = 12h22m47.60s, = +05∘3625 and the host galaxy core is at = 12h22m47.60s, = +05∘3624 (J2000). The estimated offsets in and values are 0.01s 0.01s and 0.70 0.09, respectively, in close agreement with those found by Bilinski et al. (2018). So, we conclude that the position of SN 2012ab is displaced by about 280 pc; allowed for projection effects; away from the host galaxy center and not coincident with the nucleus. This formally rules out that SN 2012ab is not strictly a nuclear transient, such as an AGN flare or a TDE.

| Date | Phase† | MJD | Instrument | |||||
|---|---|---|---|---|---|---|---|---|
| (dd/mm/yy) | (d) | (mag) | (mag) | (mag) | (mag) | (mag) | ||
| 20/02/12 | 22.62 | 55977.82 | 15.10 0.06 | 15.98 0.027 | 15.77 0.02 | 15.50 0.01 | 15.43 0.02 | 1 |
| 21/02/12 | 23.57 | 55978.77 | — | — | — | 15.31 0.03 | 15.35 0.04 | 1 |
| 22/02/12 | 24.57 | 55979.77 | 15.05 0.13 | 15.93 0.02 | 15.69 0.03 | — | — | 1 |
| 05/03/12 | 36.61 | 55991.81 | 15.55 0.08 | 16.44 0.04 | — | 15.58 0.02 | 15.48 0.03 | 1 |
| 10/03/12 | 40.96 | 55996.16 | — | 16.40 0.05 | 15.91 0.05 | 15.57 0.08 | — | 2 |
| 12/03/12 | 42.91 | 55998.11 | — | 16.45 0.01 | 15.98 0.01 | 15.59 0.01 | 15.58 0.01 | 3 |
| 12/03/12 | 43.79 | 55998.99 | — | 16.58 0.04 | 16.13 0.04 | 15.67 0.02 | 15.61 0.03 | 1 |
| 13/03/12 | 44.76 | 55999.96 | — | — | 16.02 0.02 | 15.62 0.03 | 15.55 0.02 | 2 |
| 14/03/12 | 44.87 | 56000.07 | 16.00 0.02 | 16.53 0.02 | — | — | — | 4 |
| 14/03/12 | 45.66 | 56000.86 | 15.93 0.06 | 16.52 0.03 | 16.05 0.03 | 15.63 0.04 | 15.63 0.04 | 1 |
| 17/03/12 | 47.97 | 56003.17 | — | 16.63 0.02 | 16.09 0.02 | 15.61 0.02 | 15.52 0.03 | 4 |
| 24/03/12 | 55.74 | 56010.94 | 16.05 0.03 | 16.51 0.02 | 16.08 0.02 | 15.62 0.02 | 15.48 0.01 | 3 |
| 26/03/12 | 57.64 | 56012.84 | 16.24 0.05 | 16.56 0.03 | 16.17 0.03 | 15.67 0.02 | 15.67 0.04 | 1 |
| 28/03/12 | 59.71 | 56014.91 | — | 16.58 0.03 | 16.12 0.04 | 15.77 0.06 | 15.63 0.03 | 2 |
| 28/03/12 | 59.73 | 56014.93 | 16.16 0.05 | 16.56 0.03 | 16.24 0.03 | 15.85 0.03 | 15.77 0.03 | 4 |
| 28/03/12 | 59.75 | 56014.95 | 16.06 0.03 | 16.72 0.01 | 16.13 0.02 | 15.77 0.02 | 15.63 0.02 | 3 |
| 01/04/12 | 62.82 | 56018.02 | — | 16.73 0.01 | 16.24 0.02 | 15.91 0.04 | 15.65 0.05 | 2 |
| 01/04/12 | 63.53 | 56018.73 | 16.30 0.14 | 16.74 0.02 | — | 15.87 0.03 | 15.84 0.06 | 1 |
| 03/04/12 | 65.56 | 56020.76 | 16.25 0.09 | 16.82 0.03 | — | 15.96 0.03 | 15.89 0.04 | 1 |
| 04/04/12 | 66.57 | 56021.77 | — | — | 16.42 0.03 | — | — | 1 |
| 08/04/12 | 70.40 | 56025.60 | 16.39 0.10 | — | 16.64 0.04 | 16.16 0.02 | 16.09 0.04 | 1 |
| 13/04/12 | 75.59 | 56030.79 | 16.76 0.07 | 17.15 0.04 | 16.78 0.03 | 16.21 0.04 | 16.27 0.04 | 1 |
| 14/04/12 | 75.96 | 56031.16 | 16.31 0.02 | 17.04 0.05 | 16.84 0.06 | 16.13 0.03 | 16.38 0.03 | 5 |
| 19/04/12 | 81.50 | 56036.70 | 17.04 0.10 | 17.42 0.05 | 17.12 0.03 | 16.43 0.03 | 16.49 0.05 | 1 |
| 24/04/12 | 86.63 | 56041.83 | 17.21 0.13 | 17.58 0.05 | 17.05 0.05 | 16.48 0.03 | 16.47 0.04 | 1 |
| 24/04/12 | 86.78 | 56041.98 | — | 17.38 0.03 | 16.89 0.03 | 16.63 0.05 | 16.56 0.04 | 2 |
| 27/04/12 | 89.69 | 56044.89 | — | 17.63 0.03 | — | 16.41 0.06 | 16.53 0.04 | 2 |
| 29/04/12 | 91.40 | 56046.60 | 17.14 0.13 | 17.83 0.09 | 17.24 0.06 | 16.59 0.04 | 16.63 0.05 | 1 |
| 30/04/12 | 92.79 | 56047.99 | — | 17.92 0.03 | 17.23 0.03 | 16.88 0.08 | 16.88 0.03 | 6 |
| 07/05/12 | 99.52 | 56054.72 | — | 18.02 0.13 | 17.39 0.18 | 16.84 0.07 | 17.07 0.17 | 1 |
| 13/05/12 | 105.52 | 56060.72 | 17.35 0.12 | 18.13 0.11 | 17.39 0.07 | 16.74 0.03 | 16.87 0.06 | 1 |
| 15/05/12 | 107.76 | 56062.96 | 17.30 0.10 | 18.08 0.02 | — | 16.84 0.01 | 17.04 0.09 | 3 |
| 17/05/12 | 109.49 | 56064.69 | 17.43 0.09 | 18.07 0.04 | 17.54 0.06 | 16.80 0.03 | 17.09 0.08 | 1 |
| 26/05/12 | 118.54 | 56073.74 | 17.86 0.16 | 18.24 0.19 | 17.33 0.10 | 16.91 0.05 | 17.15 0.08 | 1 |
| 26/05/12 | 118.73 | 56073.93 | 17.89 0.02 | 18.34 0.02 | 17.55 0.02 | 16.99 0.02 | 17.23 0.05 | 7 |
| 08/06/12 | 130.80 | 56086.00 | 17.88 0.02 | 18.37 0.02 | 17.61 0.03 | 17.06 0.02 | 17.31 0.03 | 8 |
| 09/06/12 | 132.53 | 56087.73 | 18.05 0.37 | 18.43 0.08 | 17.50 0.08 | 17.07 0.05 | 17.32 0.12 | 1 |
| 25/06/12 | 148.46 | 56103.66 | — | 18.35 0.15 | 17.74 0.10 | 17.11 0.07 | 17.57 0.19 | 1 |
| 27/06/12 | 150.65 | 56105.85 | — | — | 17.74 0.08 | — | — | 4 |
| 07/07/12 | 160.75 | 56115.95 | 18.27 0.08 | 18.71 0.05 | 17.89 0.05 | 17.19 0.04 | 17.68 0.06 | 6 |
| 18/07/12 | 171.64 | 56126.84 | — | — | 18.03 0.09 | 17.19 0.06 | 17.74 0.09 | 4 |
| 28/11/12 | 304.75 | 56259.95 | — | 19.05 0.15 | 18.46 0.06 | 17.73 0.04 | 18.07 0.24 | 1 |
| 10/12/12 | 315.78 | 56270.98 | 18.43 0.21 | 18.96 0.08 | 18.53 0.06 | 17.62 0.09 | 18.16 0.15 | 1 |
| 13/01/13 | 350.71 | 56305.91 | — | — | 18.62 0.08 | 17.81 0.05 | 18.54 0.16 | 1 |
| 14/01/13 | 351.78 | 56306.98 | 18.72 0.16 | 19.14 0.09 | — | — | — | 1 |
| 03/02/13 | 371.66 | 56326.86 | — | 19.59 0.15 | 18.90 0.15 | 18.03 0.08 | 18.61 0.24 | 1 |
| 09/02/13 | 376.94 | 56332.14 | 18.95 0.17 | 19.75 0.08 | 18.82 0.04 | 18.08 0.03 | 18.77 0.11 | 4 |
| 21/02/13 | 389.76 | 56344.96 | — | 19.63 0.13 | 18.88 0.09 | 18.05 0.07 | 18.72 0.14 | 1 |
| 16/03/13 | 411.95 | 56367.15 | — | >19.94 0.20 | 19.29 0.07 | 18.24 0.06 | 18.75 0.11 | 4 |
| 11/04/13 | 438.61 | 56393.81 | — | 20.00 0.14 | 19.41 0.11 | 18.48 0.06 | 19.16 0.21 | 1 |
| 25/04/14 | 816.79 | 56771.99 | — | — | 19.55 0.10 | 18.95 0.43 | 19.62 0.25 | 2 |
| 12/02/15 | 1109.96 | 57065.16 | — | >20.39 0.20 | 19.99 0.19 | 19.65 0.19 | 20.22 0.41 | 4 |
| 11/06/15 | 1229.72 | 57184.92 | — | >20.44 0.20 | >20.18 0.20 | 19.93 0.23 | > 20.66 0.20 | 4 |
With respect to explosion (MJD=55955.200.5)
1 ARIES 1.04m ST+2kx2k ccd; 2 Ekar Schmidt 67/92cm; 3 Calar Alto 2.2m+CAFOS; 4 Ekar 1.82m+AFOSC; 5 ESO NTT 3.58m+EFOSC2; 6 NOT 2.54m+ALFOSC; 7 WHT 4.20m+ACAM; 8 TNG 3.58m+LRS
| Data | Phase† | MJD | Instrument | |||
|---|---|---|---|---|---|---|
| (dd/mm/yy) | (d) | |||||
| 15/03/12 | 46.48 | 56001.68 | 14.97 0.06 | 14.59 0.08 | 14.29 0.11 | 9 |
| 04/06/12 | 127.33 | 56082.53 | 15.62 0.04 | 15.14 0.04 | 15.03 0.07 | 10 |
| 04/07/12 | 158.22 | 56113.42 | 15.88 0.03 | 15.18 0.05 | 14.99 0.03 | 11 |
With respect to the explosion (MJD=55955.200.5)
Note: 9 = ES0 NTT 3.58m +SOFI; 10 = TNG 3.58m+NICS; 11 = NOT 2.54m+NOTCam.
3 Data Acquisition and Reduction
3.1 Photometric Observations
Photometric follow-up observations of SN 2012ab were carried out for about 3 years, from 2012 February 20 to 2015 June 11, using a large number of ground-based optical telescopes listed in Tables 2 and LABEL:tab:IR_mag.
Imaging was done using Johnson-Cousins-Bessell U, B, V, R, I filters. Basic pre-processing and image reduction were done using IRAF222Image Reduction and Analysis Facility as outlined in Gangopadhyay et al. (2018). SN 2012ab is embedded near the center of the host galaxy, therefore template subtraction has revealed it to be necessary for accurate measurements at all epochs. As templates, we used a set of deep images obtained on 2019 February 26 with the 1.82m Copernico Telescope at Ekar-Asiago equipped with AFOSC, when the SN was well beyond the limit of detection. SN and template images were aligned, scaled and subtracted using the SNOoPY333Cappellaro, E. (2014). SNOoPY: a package for SN photometry, http://sngroup.oapd.inaf.it/snoopy.html package which also performs point-spread-function measurements of the SN on the galaxy subtracted images. The instrumental magnitudes were then calibrated using colour terms previously determined with the same instruments on a number of standard fields (Landolt, 1992), while zero-points were determined for each night with reference to a previously calibrated local sequence of stars (cfr. Fig. 2, Table 4). The magnitudes of the stars of the local sequence were derived on a number of photometric nights. These resulted in good agreement ( mag) with the magnitudes derived transforming the SLOAN AB magnitudes to the Vega UBVRI ones with the transformations (Chonis & Gaskell, 2008). Only the brightest star n.1 showed large deviations possibly because it is saturated in the SLOAN survey. The errors due to the calibration and the photometric measurements were added in quadrature to estimate the final error of the SN magnitudes.
ROTSE-IIIb obtained an intensive monitoring coverage of the host galaxy field before and after the SN discovery. The original unfiltered images were calibrated to -band via USNO-B1.0 photometric calibration (Table 1 of Bilinski et al., 2018). We used our local sequence to check this calibration finding a fair agreement ( mag). Therefore, in order to describe the SN behaviour shortly after the shock-breakout, a period in which we are short of data, we use the early -band photometry from Bilinski et al. (2018) (cfr. Fig. 3).
Near-infrared (near-IR) photometry (JHK) was obtained with different telescopes. The reduction of IR images needed a few additional steps. After the flat field correction, sky images were obtained median-combining several science frames. Sky images were then subtracted to individual science images in order to remove the contribution of the bright near-IR background. We remark that the IR images are obtained from PSF-fitting and not template subtraction. Finally, science frames were aligned and combined in order to improve the signal-to-noise (S/N). Photometric calibration was achieved relative to the 2MASS444Two Micron All Sky Survey. magnitudes of the same local sequence stars used for the calibration of the optical photometry. The SN magnitude determinations in optical and IR bands are reported in Table 2 and Table LABEL:tab:IR_mag, respectively.
3.2 Spectroscopic observations
We obtained low and medium resolution optical and NIR spectra of SN 2012ab at 26 epochs (from 2012 February 7 to 2015 February 27), as tabulated in Table 5. Unfortunately our spectroscopic campaign missed the earliest epochs after the discovery of SN 2012ab and for the description of the early phases we rely on the Hobby-Eberly Telescope (HET) spectra presented in Bilinski et al. (2018)), as reported in Table 5. The 2-d spectra were pre-processed using standard tasks in IRAF, as well as for the subsequent extraction and calibration of the 1-d spectra. HeNe, HeAr, HgCdNe arc lamps were used for wavelength calibration, whose accuracy was checked using night-sky emission lines. When appropriate, minor rigid wavelength shifts were applied. Spectroscopic standards were observed for correcting the instrumental response, and for flux calibration. The flux-calibrated spectra in the blue and the red regions were combined after scaling to get the final spectrum on a relative flux scale. The spectroscopic fluxes were checked with the photometric measurements at similar epochs and appropriate scaling factors were applied. However, because of the location of the SN projected over the bright galaxy nucleus the background subtraction was a major problem. During the SN brightest stages, a careful reduction and choice of the background produced satisfactory results (still leaving a residual contamination, cfr. Sect. 6). At late stages (after about 200 d) the residual background contamination cannot be neglected. The observed continuum and the unresolved nebular emission lines are likely due to the host galaxy nucleus, while only the broad emissions, in particular H and H, are due to the SN.
| Star ID | |||||||
|---|---|---|---|---|---|---|---|
| (h:m:s) | (∘ ’ ”) | (mag) | (mag) | (mag) | (mag) | (mag) | |
| 1 | 12:22:49.98 | +05:36:13.74 | 15.529 0.060 | 15.120 0.030 | 14.321 0.009 | 13.809 0.021 | 13.625 0.038 |
| 2 | 12:22:52.79 | +05:34:36.87 | 18.316 0.066 | 18.033 0.015 | 17.202 0.025 | 16.686 0.055 | 16.299 0.015 |
| 3 | 12:22:46.46 | +05:34:01.88 | 17.361 0.046 | 17.360 0.015 | 16.666 0.030 | 16.273 0.040 | 15.934 0.011 |
| 4 | 12:22:35.55 | +05:34:55.02 | 20.276 0.194 | 19.297 0.045 | 18.284 0.034 | 17.645 0.075 | 17.140 0.028 |
| 5 | 12:22:31.55 | +05:35:05.26 | 16.390 0.050 | 15.000 0.020 | 13.634 0.003 | 12.684 0.027 | 12.170 0.241 |
| 6 | 12:22:35.89 | +05:37:34.51 | 15.604 0.043 | 15.926 0.042 | 15.422 0.031 | 15.082 0.002 | 14.825 0.056 |
| 7 | 12:22:37.67 | +05:37:21.39 | 16.229 0.007 | 15.960 0.016 | 15.133 0.065 | 14.571 0.039 | 14.254 0.026 |
| 8 | 12:22:44.94 | +05:38:11.86 | 18.911 0.073 | 17.802 0.018 | 16.638 0.016 | 15.907 0.061 | 15.427 0.012 |
| 9 | 12:22:52.35 | +05:38:17.58 | 18.852 0.088 | 18.272 0.020 | 17.350 0.014 | 16.762 0.046 | 16.297 0.016 |
The magnitudes quoted are the weighted average of the magnitudes obtained from Ekar 1.82m+AFOSC and HCT 2.0m+HFOSC
| Date | Phase | MJD | Telescope | Range | Resolution |
|---|---|---|---|---|---|
| (dd/mm/yy) | (d) | (Å) | (Å) | ||
| 07/2/12† | 9.6 | 55964.85 | HET+LRS+gm300 | 4200-10200 | 10.9 |
| 16/2/12† | 18.6 | 55973.82 | HET+LRS+gm300 | 4200-10200 | 10.9 |
| 01/3/12† | 32.6 | 55987.78 | HET+LRS+gm300 | 4200-10200 | 10.9 |
| 07/3/12 | 38.3 | 55993.50 | Pennar+B&C+300tr/mm | 3300-7800 | 7.5 |
| 12/03/12 | 43.4 | 55998.63 | Calar-Alto+CAFOS+gm8 | 3300-8850 | 13.0 |
| 14/03/12 | 45.3 | 56000.54 | Copernico+AFOSC+gm4+gm2 | 3750-9900 | 12.5-34.0 |
| 15/03/12 | 46.5 | 56001.72 | NTT+SOFI+GB | 9350-24800 | - |
| 17/03/12 | 48.5 | 56003.66 | Copernico+AFOSC+gm4 | 3750-8200 | 11.5 |
| 20/03/12 | 51.4 | 56006.63 | NOT+ALFOSC+gm4 | 3450-9100 | 13.5 |
| 24/03/12 | 56.3 | 56011.46 | Calar-Alto+CAFOS+gm8 | 3350-9900 | 14.0 |
| 28/03/12 | 60.2 | 56015.41 | Calar-Alto+CAFOS+gm8 | 3350-10000 | 13.5 |
| 28/03/12 | 60.2 | 56015.42 | Copernico+AFOSC+gm4 | 3400-8200 | 23.0 |
| 14/04/12 | 76.5 | 56031.74 | NTT+EFOSC2+gm13 | 3650-9250 | 27.0 |
| 25/04/12 | 86.3 | 56041.54 | Copernico+AFOSC+gm4 | 3600-8200 | 24.0 |
| 30/04/12 | 93.3 | 56048.48 | NOT+ALFOSC+gm4 | 3450-8700 | 13.5 |
| 09/05/12 | 102.2 | 56057.38 | Pennar+B&C+300tr/mm | 3250-7750 | 7.5 |
| 17/05/12 | 110.2 | 56065.40 | Pennar+B&C+300tr/mm | 3300-7750 | 7.5 |
| 26/05/12 | 119.2 | 56074.44 | WHT+ISIS+R300B+R158R | 3100-10550 | 4.3-7.3 |
| 03/06/12 | 127.2 | 56082.42 | TNG+NICS+IJ+HK | 8750-24800 | - |
| 08/06/12 | 132.2 | 56087.40 | TNG+LRS+LR-B | 3150-8000 | 10.0 |
| 27/06/12 | 151.2 | 56106.39 | Copernico+AFOSC+gm4 | 3900-8150 | 24.0 |
| 17/07/12 | 171.1 | 56126.35 | Copernico+AFOSC+gm4 | 3900-8150 | 24.0 |
| 09/02/13 | 376.9 | 56332.09 | Copernico+AFOSC+gm4 | 3900-8150 | 24.0 |
| 16/03/13 | 411.9 | 56367.08 | Copernico+AFOSC+gm4 | 3900-8150 | 24.0 |
| 25/04/14 | 817.3 | 56772.51 | Pennar+B&C+300tr/mm | 3300-7750 | 7.5 |
| 27/02/15 | 1126.9 | 57080.15 | GTC+OSIRIS+R1000B | 3630-7500 | 7.0 |
† Spectra from Biliniski et al. 2018
4 Temporal evolution of SN 2012ab
Optical light curves of SN 2012ab are shown in Fig. 3. This includes our new observations (Table 2), that started on 2012 February 20 UT, and the ROTSE-IIIb observations (cfr. Sect. 3.1) describing the early epochs. Thanks to the relatively deep and stringent pre-detection limits and to the ROTSE-IIIb detection on the rising branch, we could estimate the explosion date to be 2012 January (MJD 55955.3) which is used throughout the paper as reference date. The light-curve in -band shows a rapid rise of 3.4 mag in the first 4 d reaching a on MJD 55960.34. After the rise, as noted by Bilinski et al. (2018) the light curve remained almost flat for about 60 d. In other bands the coverage started only on February 20. In B, V, R and bands we can identify a short plateau lasting about 60 d, steeper at shorter wavelengths (from 1.62 to 0.54 mag (100d)-1), followed by a rapid drop in the next 40 d (ranging from 3.67 to 2.72 mag (100d)-1). The band instead declines at constant rate from the early available observations to 100 d (2.97 mag (100d)-1). The slopes of the different phases identified in the light curves are reported in Table 6. In the 130350 d interval, the decline at all wavelengths is definitely slower (from 0.17 to 0.42 mag (100d)-1) than the typical radioactive decay rate of the 56Co 56Fe (0.98 mag (100d)-1) indicating the contribution of another energy source in addition to radioactive decay, most probably the interaction between the SN ejecta and the CSM, as discussed in the following Sections. Only for a short interval between 350440 d, all light curves decline at a rate close to that of 56Co (between 0.62 and 0.93 mag (100d)-1), to slow-down once again afterward in V, R and , the bands for which we have late time observations.
| Time Interval | 2060d | 20100d | 60100d | 130350d | 350440d | 4401110d |
|---|---|---|---|---|---|---|
| — | 2.97 0.20 | — | 0.17 0.09 | 0.92 0.00 | — | |
| 1.62 0.27 | — | 3.67 0.23 | 0.33 0.07 | 0.89 0.03 | — | |
| 1.18 0.13 | — | 2.95 0.30 | 0.42 0.04 | 0.93 0.13 | 0.08 0.02 | |
| 0.59 0.17 | — | 2.72 0.16 | 0.34 0.03 | 0.71 0.08 | 0.17 0.03 | |
| 0.54 0.23 | — | 3.29 0.17 | 0.31 0.03 | 0.62 0.15 | 0.16 0.02 |

.
4.1 Comparison sample
To place SN 2012ab in the context of other SNe, we have selected a reference sample of other well-studied CCSNe. The sample is quite heterogeneous and comprises of nine objects: SNe 1996al, 1998S, 1999em 2005ip, 2006gy, 2007od, 2009kn, 2010jl and PS1-10adi. The basic parameters of the comparison SNe are tabulated in Table 7. SNe 2006gy and PS1-10adi have been selected because they are located very close to the nuclei of their host galaxies, similar to SN 2012ab. This is motivated by the need of checking whether positional dependency can affect photometric or spectroscopic features. Then we have selected a group of strongly interacting SNe IIn similar to SNe 2005ip and 2010jl, whose light curve features are very similar to those of SN 2012ab. In contrast, we choose the fleeting SN 1998S, the interacting linear SN 1996al, the transitional (from Plateau to Linear) SN 2007od and the Type IIn-P like SN 2009kn, to remark the clear photometric differences with SN 2012ab for objects showing a rapid luminosity decline. At last, we have included a normal Type II Plateau, SN 1999em, to have a clear comparison with a non-interacting SN. Thus, the diversity in the comparison sample enables us to highlight the light curve heterogeneity of SNe II, and the role of CSM interaction in their photometric evolution.
| SN | Host Galaxy | Offset from center | Distance‡ | Extinction | Peak MR | Reference† |
|---|---|---|---|---|---|---|
| (Mpc) | (mag) | (mag) | ||||
| SN 1996al | NGC 7689 | 30" N | 22.9 | 0.11 | 17.53 | 1 |
| SN 1998S | NGC 3877 | 16" W, 46" S | 15.7 | 0.219 | 19.54 | 2,3,4 |
| SN 1999em | NGC 1637 | 15" W, 17" S | 9.8 | 0.1 | 16.93 | 5 |
| SN 2005ip∗ | NGC 2906 | 2".8 E, 14".2 N | 29.3 | 0.048 | 17.44 | 6 |
| SN 2006gy | NGC 1260 | 0.941" W, 0.363" N | 79.7 | 0.56 | 22.39 | 7,8 |
| SN 2007od | UGC 12846 | 38" E, 31" S | 25.6 | 0.126 | 18.61 | 9,10 |
| SN 2009kn | MCG -3-21-6 | 17.75" E, 15.27" N | 67.5 | 0.114 | 18.09 | 11 |
| SN 2010jl∗ | UGC 5189A | 2".4 E, 7".7 N | 48.5 | 0.058 | 20.25 | 12, 13,14 |
| PS1-10adi∗ | J204244.74+153032.1 | center | 953.4 | 0.091 | 23.16 | 15 |
† References:(1) Benetti et al. (2016); (2) Fassia et al. (2000); (3) Tully et al. (2016); (4) Fassia et al. (2001); (5) Elmhamdi et al. (2003); (6) Stritzinger et al. (2012); (7) Smith et al. (2007); (8) Agnoletto et al. (2009); (9) Inserra et al. (2011); (10) Andrews et al. (2010); (11) Kankare et al. (2012); (12) Jencson et al. (2016); (13) NED; (14) Zhang et al. (2012); (15) Kankare et al. (2017);
We use days since discovery with the assumption that the discovery date occurred close to the explosion date.
‡ Distances have been scaled to H0 = 73 km sec-1 Mpc-1
4.2 Absolute magnitude and bolometric light curve
Adopting the distance modulus mag and a total reddening mag, we can calculate the peak absolute magnitude. The absolute magnitude in the band is M mag, computed by using the early brightest point from ROTSE-IIIb (MJD 55960.34; R=15.39). Fig. 4 shows the comparison of the absolute R-band light curve of SN 2012ab with those of the SNe of the comparison sample. SN 2012ab has a peak luminosity similar to SN 1998S (cfr. Table 7).

To better understand the overall photometric properties of SN 2012ab and - in particular - the sources of energy at work, we computed the pseudo-bolometric (limited to BVRI bands) light curve, thanks to the multi-wavelength follow-up described in the previous Sections. Broad-band magnitudes were converted into fluxes at the effective wavelengths, corrected for extinction, and finally the resulting Spectral Energy Distribution (SED) was integrated over wavelengths. The fluxes were computed at the epochs when R-band observations were available. When an observation in one band was not available on a given night, the magnitude has been obtained by interpolating the light curve with a low-order polynomial, or was extrapolated assuming a constant colour. The pseudo-bolometric light curve of SN 2012ab shows the same behaviour of the chromatic light curves, i.e. the rapid rise to maximum, the plateau up to about 2 months and the steep fall from the plateau. At about 4 months the decline slows down and remains slower than the radioactive decay of 56Co up to the latest detection (3.3 yr after explosion). The fastest late-time decline occurs between 350440 d with a slope of mag (100d)-1. It is clear that another energy input is required in addition to the 56Co radioactive decay to sustain the light curve. We will see in Section 5 that the ejecta-CSM interaction provides a plausible explanation. Assuming that the luminosity of SN 2012ab in the 350440 d period was generated by the radioactive decay of 56Co, the 56Ni mass required is M(56Ni) M⊙, using the formulation given by Hamuy (2003). This value, much larger than the usual 56Ni masses produced in normal CCSNe (0.001-0.03 M⊙ Hamuy, 2003), is also excluded by a simple model based on Arnett (1982) formalism. In fact, if we assume that the luminosity of the SN in the 350440 d is entirely supported by the 56Ni decay, then following Arnett (1982), the early rise is matched by only assuming 1 M⊙ of ejecta, e.g. an almost pure 56Ni composition, which is not supported by the observations. Higher ejecta mass would give even slower rise times. Also the rapid decline seen in the bolometric light curve after 100d is at odds with a high 56Ni mass scenario.

In Fig. 5 the pseudo-bolometric light curve of SN 2012ab is compared with those of the comparison sample. SN 2012ab has average peak luminosity with respect to the comparison objects (L erg s-1). It is fainter than SNe 2006gy, 2010jl and PS1-10adi, brighter than SNe 1999em, 2005ip and 2009kn, and similar to SNe 1996al, 1998S and 2007od. However, among these last four objects the luminosity evolution varies significantly and the behaviour most similar to SN 2012ab is with that of the interacting SNe group.
4.3 Colour evolution of SN 2012ab
The reddening-corrected colour curves of SN 2012ab are compared in Fig. 6 with those of the reference sample.
The (BV) colour of SN 2012ab evolves redward very slowly, from 0.1 mag to 0.7 mag between 22 and 120 d. This reflects in a slow reddening of the spectral continuum during this period (cfr. Sect. 5.3). A similar, quite constant trend in (BV) colour evolution is also noticed for the other strongly interacting SNe 1996al, 1998S 2005ip, 2006gy, 2010jl and PS1-10adi (Smith et al., 2009; Jencson et al., 2016), indicating that the colour evolution is not driven by the expansion of the ejecta as is in the cases of the normal SN 1999em and the weakly interacting SN 2007od that show a fast drift to the red. SN 2009kn appears intermediate between normal and strongly interacting SNe. After 120 d, up to the latest epoch (440 d), the (BV) colour of SN 2012ab does not change significantly, with a possible shallow decrease ( mag) at intermediate epochs, in line with other interacting SNe, while normal SN II remain definitely redder.
Less evident, though still present, is the differentiation of the (VR) colour between normal and interacting objects. SN 2012ab changes slowly, similarly to interacting SNe. The (VR) colour of SN 2012ab becomes progressively redder, reaching mag at 440 d, consistent with the strengthening of H line relative to the continuum at late times (see Section 5). Two very rare additional points (not shown in Fig. 6) indicate a return to a bluer (VR) colour up to 1100 d. Different is the (VI) behaviour of SN 2012ab, which remains relatively almost constant colours throughout the whole evolution with a modest drift to the red around 100d, and then fixing at mag up to 440 d. The latest points (not shown in Fig. 6) seems to indicate much bluer (VI) colours but at epoch when the photometric errors are large.

5 Spectral evolution of SN 2012ab
The main characteristic of SN 2012ab is its slow spectroscopic evolution after the rapid, initial cooling of the continuum. The spectra are dominated at all epochs by emission lines, in particular H, whose complex evolution will be discussed in Section 6. Only a broad and shallow P-Cygni absorption leftwards of H and H is seen in the first months. The lines of Fe II, Ba II, Sc II, Mg I, Ti II, and Ca II, with P-Cygni profile, characteristic features of SNe are not visible at any time. Narrow lines due to [O II], [O III], [N II] and [S II] are always well visible suggesting heavy host galaxy contamination.
The first spectrum taken 9.6 d after the explosion is an almost featureless black-body continuum at 12600 K with the above mentioned unresolved emission lines of the galaxy nucleus and, possibly, a shallow H absorption (cfr. Sect. 6 and Table 8). With time the temperature rapidly decreases. The black-body temperature cools down to 10100K at 18.6 d and broad asymmetric emissions of H and H emerge. By 32 d the shallow H absorption becomes clearly visible (cfr. Sect. 6).
Afterward the evolution slows down significantly. The temperature slowly decreases (cfr. Sect. 5.3), a blend of emissions, possibly multiplet 42 of Fe II, develops redward of H, the line width overall shrinks and the SN continuum fades. The spectra at one year, and later, display only broad H and H emissions of the SN contaminated by narrow host galaxy features over a residual galaxy nucleus spectrum (cfr. Fig. 8). The nebular emission lines of intermediate atomic mass elements typical of late-time spectra of CCSNe (e.g. [O I], [Ca II], [O II]) are not present at any time.

5.1 Infrared spectrum
Two NIR spectra have been acquired. They are displayed in Fig 9 along with the closest optical spectrum available. The first spectrum obtained with closest available optical NTT+SOFI at 46 d from the explosion shows clearly two broad Paschen line, Pβ and Pγ, the latter probably blended with He I line at 10830 Å. The FWHM width of the two Paschen lines (FWHM km s-1) are similar to that of the central (IW) emission of H, that will be discussed in Sect. 6. In the TNG+NICS spectrum (phase 127 d) four Paschen lines are visible (Pβ, Pγ, Pδ and Pϵ). Again Pγ is blended with He I at 10830 Åand Pϵ. The other three lines are isolated and their FWHMs and positions are in perfect agreement with the values of the central (IW) emission of H (cfr. Sect. 6 and Table 8).

5.2 Spectral comparison with other SNe IIn
In Figs. 10, 11 and 12 we compare the early, mid and late phase spectra of SN 2012ab with those of the reference sample of SNe IIn (see Section 4.1). The plots are made with spectra taken at similar phases with respect to the explosion. For SN 2012ab, we plot the spectra without the additional removal of the galaxy contamination discussed in Sect. 6.
At early (9 d) phases all spectra show blue continua. However, Fig. 10 shows that SN 2012ab, almost featureless has low-contrast lines over the continuum, is similar to PS1-10adi. Some objects, such as SNe 2007od and 1996al, show more strong features shaped lines not dissimilar to normal Type II (Plateau or Linear) SNe, while others already display multicomponent H profiles (e.g. SN2005ip, though its phase is considerably later).
Also the mid-evolution (76 d) spectrum (Fig. 11) shows features similar to the other strongly interacting SNe. In particular, evident is the complex profile of H emission, in analogy with SNe 2005ip, 2010jl, and PS1-10adi, each exhibiting large expansion velocities. Interestingly, SN 2012ab does not show the He I emission, a feature missing only in SN 2009kn.
About six months after the explosion SN 2012ab keeps an overall similarity with strongly interacting SNe (Fig 12). While the interacting SN 1996al shows an unusual, strong He I emission and a three-peaked H emission, the strongly interacting ones have broader components, clearly visible in SNe 2005ip and 2010jl. The component deconvolution of SN 2012ab will be discussed in Sect. 6. The strong interaction between SN ejecta and CSM produces also a blue pseudo-continuum at 5500 Å, that is likely produced by a forest of Fe emission lines (Fox et al., 2009). Such enhanced blue continuum, evident in SNe 2005ip, 2010jl and PS1-10ad, is not visible in SN 2012ab.


5.3 Photospheric radius and temperature
The analysis of the spectra allows to derive a number of physical parameters such as photospheric radius and temperature.
To this aim we performed black-body fits of spectra up to 62 d, when we are confident that the black-body approximation holds. After performing reddening and redshift corrections to the observed spectra, the fits were performed selecting line-free regions in the spectra. Typical standard deviations of repeated fits defining different continuum regions are of the order of 200K, to which we must add in quadrature the uncertainty on the flux calibration curves and on the galaxy subtraction, where much of the uncertainty resides. We believe that the overall uncertainty on the T determination is of the order of 1000K. Fig. 13 illustrates the derived temporal evolution of the temperature.
The black-body fit to the 9.6 d spectrum of SN 2012ab gives a temperature of about 12600K that quick decreases to 10100K in less than 10 d. Then the black body temperature decrease progressively more slowly to reach about 8200K on 43 d. From this epoch the large uncertainty due to the galaxy contamination leads to a scatter in the temperature determination which anyway seems to decrease to 7000K at two months past explosion. The parent galaxy contamination increases while, at the same time, the emission lines grow in intensity. The black body fit, therefore, becomes more uncertain.
Having the temperature T and the bolometric luminosity L (cfr. Sect. 4.2) it is possible to compute the radius of the emitting region using the relation L = 4R2. The radius increases during the first months, and then decreases to reach progressively RAU at the last epoch (cfr. Fig 13, right ordinate). The scatter in the temperature determines the observed dispersion in the radius.

6 H evolution
The inspection of Figs. 7 and 8 shows a clear evolution of the H line profile that carries important information about the ejecta and the CSM.
Before making a quantitative analysis of the line profile it is important to notice that most of the spectra of SN 2012ab in Figs. 7 and 8 show unresolved emissions (H, H, [O II], [O III], [S II], [N II]) throughout the entire evolution with line ratios typical of H II regions (see also Bilinski et al., 2018). During the data reduction the galaxy background has been removed by subtracting the spectrum of a nearby H II region. Nevertheless, because of the uneven galaxy background and the variable observing conditions, residual unresolved lines remain. In order to understand if the narrow emissions are entirely due to contamination of the host galaxy, we have empirically subtracted to the reduced spectra the host galaxy spectrum retrieved from SDSS and scaled to remove the [S II] 6717-6731 Å lines. This was done after degrading the resolution of the host galaxy spectra. This exercise has shown that in general it is possible to remove entirely the narrow-line contamination of the host galaxy, leaving sometimes negligible residual contamination. Significant exceptions are the earliest 3 spectra for which the cancellation of the [S II] forbidden lines leaves unresolved H and H emissions at galaxy rest frame. We believe, therefore, that such unresolved emissions are associated to the SN itself (cfr. Table 8). This result contradicts the conclusions based on the evolution of the H/ H line ratios from Bilinski et al. (2018), who concluded that the narrow lines are always due to host galaxy contamination. In Fig. 14 we show the results of this procedure at two reference epochs, on 32.6 d, when the SN spectrum is very bright, and on 1126.9 d, when the SN has faded by about 4 magnitudes.

We have, therefore, performed multicomponent line profile fits of the H emissions after removal of this residual galaxy contamination. The results are displayed in Fig. 15 where we show the observed spectra along with the individual components used in the fit. Defining and choosing a continuum is very critical for the estimated results. We have selected the continuum in a region external to the line region by at least 50 Å. The selection of continuum and the consistency of fits were repeated and checked several times. During the early times as several broad lines are present, we had to check the consistency of our results with the fits at adjacent epochs.
To describe the line profiles four components are required, of which only three (or less) are required simultaneously for each epoch: an unresolved emission at rest-frame at the earliest epochs, a broad blue-shifted absorption during the first two months, a central emission of intermediate width (IW), centered close to rest- frame during most of the SN evolution, and a red-shifted emission at late times. The fits have been performed using both Gaussian and Lorentzian profiles that produce similar and equally satisfactory results. Chugai (2001) proposed that in interacting SN spectra a Lorentzian profile of a SN can arise from an intrinsically narrow line that is broadened by collisions with thermal electrons in an opaque shell outside the photosphere. Gaussian profile are generally associated with the emission coming from the P-cygni profile of the ejecta which is in overall a homologous expansion. Table 8 reports the central wavelength of each component, the line flux and the FWHM. For the absorption also the terminal velocity (at zero intensity) of the blue wing and the expansion velocity derived from the position of the minima are reported. The terminal velocity of the red wing of the red emission is also shown in the last column.

In the first spectrum (9.6 d), taken shortly after the rapid rise to maximum, the H line profile shows an unresolved emission at rest-frame, likely due to unshocked CSM associated to the SN (cfr. Sect. 7), and a broad, shallow absorption centered at about 16,000 km s-1, extended to - km s-1. Because of its shallowness the line parameters have been derived by using an initial guess of the fit parameters obtained at the second epoch. In Table 8 they are reported with the uncertainty mark (:).
Nine days after (18.6 d) the line profile has changed dramatically. The unresolved emission grows even stronger than before and emerges on the red wing of a much broader (FWHM km s-1) blue-shifted emission centered at 6511 Å that, together with a pronounced absorption, providing a P-Cygni profile to the line. This IW component, centered close to the H rest-wavelength (with some variations with time), will persist during the whole evolution of the SN as in Bilinski et al. (2018).
There is evidence of an unresolved emission also on 32.6 d, convincing beneath which stands a well developed P-Cygni profile with an IW emission component (FWHM km s-1) emission that is quickly drifting towards the H rest-frame position. The absorption is still strong and extends to high velocities ( km s-1). The minimum of the P-Cygni absorption seems to indicate an high photospheric expansion velocity of 16,600 km s-1.
In the following spectrum (43.4 d) the unresolved emission associated to the unshocked CSM has definitively disappeared. From this until epoch up to about 60 d (i.e. during the second part of the plateau observed in and bands, cfr. Sect. 4) the line profile is well fitted by two components only, a single Lorentzian emission (but a Gaussian works decently as well) in emission and a Gaussian absorption. It is interesting to note that the center of the absorption, as well as the minimum of the P-Cygni profile and the terminal velocity, change very little with time up to its definitive disappearance at about 60 d. On the other hand during the same time interval (43.4 d to 60.2 d) in the time window the IW emission reaches its maximum FWHM and luminosity (48.5 d, FWHM km s-1, L( H) erg cm-2 s-1) and remains centered to slightly red wavelength (Å).
On 76.5 d, the IW emission suddenly shrinks to about 6000 km s-1, i.e. close to the values required for the second spectrum (18.6 d) and drops in luminosity. At the same time the line becomes progressively more asymmetric with an extended red wing. Such red wing can be accounted for a red component centered at about 6800 Å (FWHM km s-1), that emerges more clearly only after 119.2 d (cfr. Fig 15) persisting up to 817.2 d. Starting on 76.5 d, there is therefore a clear indication of interaction of very fast ejecta ( km s-1 red terminal velocity) with a receding blob of CSM. Differently from us, Bilinski et al. (2018) have explained the increases on the red wing by introducing a broad component extending from to km s-1at zero intensity. We believe that our profile decomposition is more robust (cfr. our Fig. 15 with their Figs. 8 and 9) especially from 119 d to 817 d. Nevertheless, despite the different deconvolution, we confirm their finding of an increase of the flux of the receding (velocity km s-1) side of the ejecta between 76 d and 817 d.
The last spectrum 1126.9 d consists of only a symmetric IW component at the rest wavelength with FWHM km s-1. Therefore, the ejecta are now interacting only with a more symmetric CSM which is entirely embedding the exploding system.
Top and middle panels of Fig 16 shows the evolution of the H luminosity and FWHM of the various emission components, tabulated in Table 8. The luminosities have been estimated with the distance and reddening discussed in Sect. 2.
From 9.6 d to 48.5 d, the H luminosity of the IW component increases by a factor of . Afterward it is evident a slower, monotonic decline with time that persists up to the latest detection (1127 d). As mentioned above the red component is required only after 76 d. The scatter in the plot gives an idea of the uncertainty of the flux determinations of both components at this epoch (%).
Phase Narrow emission Absorption Central (IW) Emission Red Component center flux FWHM center flux bleu term. vel. P-Cyg vel. center flux FWHM center flux FWHM red term. vel. (Days) Å erg cm-2 s-1 km s-1 Å (km s-1) erg cm-2 s-1 km s-1 km s-1 Å erg cm-2 s-1 km s-1 Å (km s-1) erg cm-2 s-1 km s-1 km s-1 9.6 6565 1.68E-15 <500 6206: (-16305:) -2.38E-14: -30900: — — — — — — — — 18.6 6566 2.97E-15 <500 6146 (-19048) -3.33E-14 -29800 — 6511 3.64E-14 5591 — — — — 32.6 6563 2.84E-15 <500 6232 (-15130) -5.77E-14 -26600 -16600 6551 5.87E-14 8195 — — — — 43.4 — — — 6262 (-13754) -3.93E-14 -23600 -15550 6572 1.55E-13 13929 — — — — 45.3 — — — 6233 (-15085) -5.72E-14 -23800 -16000 6581 1.26E-13 10773 — — — — 48.5 — — — 6291 (-12447) -7.02E-14 -23200 -16000 6590 3.36E-13 18185 — — — — 51.4 — — — 6266 (-13581) -5.74E-14 -23200 -14100 6585 2.37E-13 14477 — — — — 56.3 — — — 6294 (-12301) -4.52E-14 -24100 — 6580 2.44E-13 13469 — — — — 60.2 — — — 6340 (-10212) -4.11E-14 -20500 — 6580 2.40E-13 12917 — — — — 76.5 — — — — — — 6574 1.31E-13 5813 6666:(4713:) 1.00E-13: 12739: 23200: 86.3 — — — — — — 6577 1.31E-13 5813 6730:(7634:) 5.41E-14: 12739: 24100: 93.3 — — — — — — 6576 1.75E-13 5588 6693:(5947:) 5.18E-14: 10816: 21900: 102.2 — — — — — — 6588 1.11E-13 6619 6804:(11016:) 9.00E-15: 11423: 22700: 110.2 — — — — — — 6589 9.90E-14 6619 6804:(11016:) 1.79E-14: 11423: 16500: 119.2 — — — — — — 6590 8.80E-14 6625 6804 (11016) 2.51E-14 13849 27200 132.2 — — — — — — 6582 1.52E-13 4502 6777 (9796) 4.30E-14 11830 22700 151.2 — — — — — — 6582 1.11E-13 5169 6796 (10651) 1.67E-14 7393 18600 171.1 — — — — — — 6578 8.56E-14 3823 6775 (9691) 1.09E-14 9030 18100 376.9 — — — — — — 6575 3.73E-14 3970 6774 (9631) 2.20E-15 4954 18600 411.9 — — — — — — 6572 9.84E-15 3918 6655 (4214) 2.23E-15 4012 9600 817.3 — — — — — — 6561 4.17E-15 4031 6669 (4854) 6.42E-16 4269 8500 1126.9 — — — — — — 6572 1.50E-15 4102 — — — — — —
":" means uncertain determination.

The central panel of Fig 16 shows the FWHM evolution of the emission components of H. The IW component rapidly broadens reaching its maximum FWHM ( km s-1) at the same time as that of the luminosity peak (top panel). Then it monotonically decreases levelling at a FWHM km s-1 after 150 d. Note that during the early phase the central emission is significantly blue-shifted, drifting to the red as the ejecta becomes optically thin. Then, during the spike in luminosity and FWHM (48.5 d) the line is overall centered at longer wavelengths ( Å). The red component remains broader than the IW until its last detection (on 817 d). The terminal velocity of the red component is difficult to estimate because of the low signal-to-noise ratio of the late time spectra. However, there is a clear indication that the red wing extends to very high velocities, km s-1on 119 d and km s-1on 817 d.
Furthermore, although the H flux is not easy to measure because of line blending, we have attempted to measure H to H flux ratio that is shown in the bottom panel of Fig 16. Despite the large uncertainty (nearly %) a monotonic increase (from 3 to 13 in the time interval ranging from 9 d to 411 d) is clearly observed. During the first month the values are rather constant and similar to Case B recombination, implying that the H emitting gas is actually photoionized, like in the early phases of SN 1996al (Benetti et al., 2016). Already around 45 d the flux ratio rapidly rises to about indicating that probably the gas becomes more collisionally excited. After a sort of plateau, from 90 d we observe that the value monotonically increases to 13 at 170 d, when we believe pure-collisional excitation dominates (Branch et al., 1981).
7 Discussion
AGN,TDE…:
In Sect. 2.1 we have shown that our astrometric determination of the SN position is not coincident with the galaxy nucleus (offset ), in agreement with Bilinski et al. (2018). These authors have discussed the possibility that SN 2012ab is instead either an AGN or a TDE. AGN nature was ruled out since AGNs vary stochastically by only a few tenths of magnitude (MacLeod et al., 2012). From 60 to 120 d, we see a sharp drop of magnitude by about 2 mag in all bands, which makes the AGN scenario unlikely. From a spectroscopic point of view, forbidden lines, such as [O I] 6300, 6364 Å and [Fe VII] 5721 Å, are expected in an AGN. Also, the He II 4686 Å line is sometimes more prominent than the Balmer series in AGNs. These are not detected in the spectra of SN 2012ab. Moreover, high state AGNs show a distinct break in the continuum slope near 5000 Å (Vanden Berk et al., 2001). Such spectral break is not observed in the case of SN 2012ab. Similarly, the possibility that SN 2012ab is a TDE was ruled out on the basis of the observed light curve shape and spectral features. However, blackbody temperatures estimated for SN 2012ab are lower and evolve faster than those typically observed in TDEs (see, e.g., PS1-10adi, Kankare et al., 2017). The spectra of TDEs are either featureless or show broad emission lines of He I/He II (Gezari, 2012). Such lines are not detected in the spectrum of SN 2012ab. Gezari (2012) has provided some tool to distinguish SNe, AGN and TDEs based on the X-ray and UV data. Unfortunately these cannot be applied to SN 2012ab as X-ray and UV observations are not available. Based on the data available, we conclude SN 2012ab to be a CCSN with CSM interaction, in agreement with Bilinski et al. (2018).
Classification:
The late-time light curves of SN 2012ab is not sustained by the radioactive decay of 56Co (cfr. Sect 4.2). Only in the interval between 350 and 440 d the bolometric slope ( mag (100d)-1) approached the radioactive dacay but the corresponding 56Ni mass would be an exceptionally large value. Overall the light curve of SN 2012ab stays in the average of the strongly interacting SNe of the reference sample discussed in Sect.4.1 both in luminosity and evolution. The spectra do not show the typical evolution of a non-interacting SN II. There is a clear evolution of the normal SED toward lower temperatures in the first two months without change in the spectral lines. The spectra never display the forbidden lines characteristics observed in CCSNe in nebular phase.
Mass-loss:
We believe that the presence of the central IW component is a clear indication of the presence of interaction between the ejecta and the CSM, likely originated from the progenitor. We can estimate the mass-loss rate of the progenitor star assuming that the luminosity of the ejecta-CSM interaction is fed by energy at the shock front. The progenitor mass loss rate can be calculated using the relation of Chugai & Danziger (1994) :
| (1) |
where (1) is the efficiency of conversion of the shock’s kinetic energy into optical radiation (an uncertain quantity), vw is the velocity of the pre-explosion stellar wind, vSN is the velocity of the post-shock shell and L is the bolometric luminosity of SN 2012ab. Unfortunately we do not know the velocity of the wind. Our low-resolution spectra just provide an upper limit to the unshocked wind velocity, v km s-1, which in turn provide us just an upper limit to the mass-loss. For the post-shocked shell we assume the characteristic velocity given by the Half width at half maxima (HWHM) of the IW component, that dominates the H emission at all epochs (cfr. Table 8), and for the luminosity the bolometric luminosity computed in Sect. 4.2. Using = 1, to be directly comparable to Bilinski et al. (2018), we have computed the mass-loss at four epochs in which the SN luminosity is dominated by ejecta-CSM interaction, i.e on 76. 119, 411 and 1127 d. The inferred mass-loss rates are , 0.057, 0.071 and 0.016 M⊙ yr-1, respectively. These values are compatible with M⊙ yr-1derived for 2012 Apr. 17 (79 d) by Bilinski et al. (2018) who used slightly different luminosity and assumed a value vw = 100 km s-1, while we conservatively used v km s-1, provided by the observations. Our derived mass-loss rates are comparable to the values often attributed to some SN IIn, which are of the order of 0.1 M⊙ yr-1 (e.g. Chugai et al., 2004; Gal-Yam et al., 2007; Kiewe et al., 2012) as observed in some giant eruptions of LBVs, and and instead they appear somewhat larger than those of other SN IIn SN 2005ip: M⊙ yr-1, Smith et al. (2009), SN 2017hcc: 0.12 M⊙ yr-1, Kumar et al. (2019) and it is also much larger than the typical values of RSG and yellow hypergiants M⊙ yr-1(Smith et al., 2014), and quiescent winds of LBV (10 M⊙ yr-1, Vink (2018).
Bilinski et al. (2018) have provided a general physical picture for SN 2012ab according to which the SN interacts with a largely asymmetric CSM. In particular, they claimed to observe firstly ejecta-CSM interaction occurring on the side to the observer and, later on, on the opposite side. They proposed that the CSM lay on an equatorial plane, seen at an intermediate inclination, and interpret this as evidence of non-axisymmetric mass loss in an eccentric binary system. Their evidence was based on the lack of normal P-Cygni features, and on the presence and timing of blue- and red-shifted emission features.
Physical scenario:
Based on our analysis of Sect. 6 we propose some variation to this picture. Our new analysis of the HET spectra shows that unresolved emission lines associated to the SN are present up to 32 d. They are attributed to unshocked slow-moving CSM, ionised by the X-UV flash shock break-out in close analogy to that observed in SN 1996al (Benetti et al., 2016). There is no evidence of significant narrow absorption associated to this gas even in the MMT/BC high resolution spectrum obtained on 2012 March 1 (32 d) (cfr. Bilinski et al., 2018) and is, therefore, either fully ionized and/or aligned out of the line of sight.
The narrow emission is no longer visible in our spectrum taken on 43.6 d, therefore by this epoch the unshocked gas either recombined quickly was swept away. The external boundary of the unshocked gas is R cm from the exploding star. It is, therefore, reasonable to conclude that significant interaction between the ejecta and the CSM takes place soon after the burst.
In previous Sections we have shown that on 9.6 d very broad and shallow absorption can be recognized at wavelengths shorter than the H rest position. Subsequent spectra taken between 19 d and 60 d show more clear evidence of broad absorptions (Fig. 15), extending to very high terminal velocities (v km s-1at zero intensity, Table 8) giving to H a very broad P-Cygni profile. There is, therefore, evidence of a photosphere in an expanding envelope that at early phases appears to be optically thick and obscures the receding ejecta. We note that during the period in which the broad absorption is visible, the width of the central emission is unusually broad (FWHM up to 18,000 km s-1).
At this stage, the observed spectrum is probably a combination of radiation from an high-energy, H-rich fast expanding envelope of the SN diluted by a continuum emission from the ejecta-CSM interaction. Anyway, the line profile does not provide evidence for an asymmetric interaction stronger on the approaching side of the ejecta at early epoch, as suggested by Bilinski et al. (2018).
The minimum of the P-Cygni absorptions, in particular, those of Fe II lines, is typically used to determine the photospheric velocity. Lacking the Fe II absorptions, we can get an upper limit from minimum of the H which, being stronger, forms at higher velocities (Jeffery & Branch, 1990). On 32 d the H absorption is still very broad and the minimum poorly defined. But anyway, using v km s-1(Table 8), we get a value of the radius of the photosphere four times larger than RBB (cfr. Sect. 5.3). This is formally compatible, considering the large uncertainties in the photospheric velocity and in the T determinations, but probably it is an indication that some deviation from spherical symmetry is present. Indeed, the polarimetric observations have shown that the geometry of the system from 54 d to 78 d is heavily aspherical (Bilinski et al., 2018). From the similarity with SN 2010jl they suggest a pole-to-equator density ratio of , in analogy to Dessart et al. (2015). The evidence of asymmetry, the measurements of exceptionally high expansion velocities and the presence of unshocked gas not aligned along the line-of-sight are suggestive of an highly energetic and asymmetric explosion observed along the jet emission (cfr. Trundle et al., 2009; Pastorello et al., 2019).
Soon after 32 d the photosphere becomes optically thin and the red wings of H rapidly grows in intensity. Overall the line starts to be skewed to the red and the line centroid is slightly redshifted. Such red drift can indeed signal the onset of interaction on the receding side of the fast ejecta, supporting aspherical geometry in the emitting material as suggested by Bilinski et al. (2018).
By 76 d the absorption has completely disappeared and the central (IW) emission shrunken to FWHM km s-1. The narrowness of the emission allows the identification of a red wing of the IW component. We note that the terminal velocity of the red component, i.e. the fastest expansion velocity of the receding part of the ejecta in direction opposite to the observer, is comparable to the terminal velocity observed for the absorption, i.e. the fastest ejecta velocity in the direction of the observer. This on one side strengthens the identification of the broad absorption at early phases and the determination of its terminal velocity, and also the hypothesis that the receding ejecta travelled undisturbed until the collision marked by the onset of the red component. The very high measured velocities, of the order of km s-1, support the idea that we are observing along the direction of a jet-like ejecta expanding until this epoch in a region devoid of interaction with CSM.
Moreover, the observed terminal velocities also suggest that the emission arises in the ejecta shocked by the reverse shock. With time (starting fom 127 d) the terminal velocities decrease because the reverse shock receded into slower layers. Despite the introduction of this additional red component, the central (IW) component maintains a slightly redshifted wavelength position (corresponding to km s-1). The IW component instead may likely arises from shocked CSM in a cocoon enclosing the jet.
After 300 d there is a clear increase in the slopes of light curves at all wavelengths that mimics for few months (up to about 440 d) that of 56Co decay (cfr. Table 6). The overall spectral features remain unchanged. The H profile still requires the red component, but its FWHM appears significantly narrowed and the terminal velocity halves quickly. We read this as evidence that the shock with the receding material is temporarily reduced.
But again the light curves flatten after 440 d and remain so for at least 2 more years. In the meantime the SN has faded considerably and it is hard to disentangle its luminosity from that of the galaxy nucleus. However, the spectral observations have detected the fading IW component (only) at least up to 3.5yr past the explosion (cfr. Table 8 and Bilinski et al., 2018) confirming, therefore, that the interaction was still going on with a rather symmetric CSM.
During the whole evolution the line profile does not show evidence of dust formation inside the ejecta as observed in SN 1987A and other CCSNe (Smith et al., 2009; Fox et al., 2009; Sarangi et al., 2018). Fig. 17 reproduces schematically the above interaction scenario at two epochs.

8 Conclusions
This paper presents the photometric and spectroscopic observations of the luminous Type IIn SN 2012ab. The main results are summarized as follows:
-
1.
The UBVRI light curves underwent a multi-stage evolution with synchronous changes. The rise to maximum was very steep ( mag in 4 d in the R band). Afterward, while and bands showed a sort of flat plateau lasting about 60-70 d, followed by a steeper decline up to about 100d. In the same, band declined at constant rate. Starting from 4-5 months after maximum the bolometric light curves of non-interacting Type II SNe follow the radioactive decay of 56Co 56Fe (0.98 mag (100d)-1, Turatto et al., 1990). In the same period and bands showed a sloping plateau steeper at shorter wavelengths. The bolometric light curve of SN 2012ab remain always flatter than this value. The peak absolute magnitude is MR = 19.39 mag and the pseudo-bolometric luminosity at maximum is L8.31042 erg s-1, making SN 2012ab brighter than non-interacting SN II (Valenti et al., 2009). We thus propose that both radioactive decay of 56Co and CSM interaction contribute to the high SN luminosity observed at late stages.
-
2.
At all epochs the spectra appear contaminated by unresolved emission lines typical of H II regions. However, our analysis (Sect. 6) shows that part of the observed unresolved flux of H and H observed during the first month is due to slowly expanding, ionized gas in close proximity of the exploding star, while at later epochs the the observed unresolved lines are due exclusively to galaxy contamination.
-
3.
At the epoch of the first spectral observation (9.6 d after the burst), the spectrum of SN 2012ab is characterized by a black-body continuum of T K like normal CCSNe, with shallow undulations, possibly indication of very fast absorbing material, plus the above mentioned unresolved emission lines. In the following spectra, broad H Balmer lines appear with P-Cygni profile due to a very fast expanding envelope (v km s-1; Sect. 6). Obscuration by the opaque photosphere produces significant blueshift of the emission component. With time the photosphere shrinks in velocity coordinates, becomes transparent and the obscuration rapidly disappears. The broad P-Cygni absorptions and the corresponding broad emission component (FWHM km s-1) from the scattering envelope are visible for about 2 months. With the decrease of the strength of the broad emission, we identify an IW component (FWHM km s-1) with a Gaussian (or Lorentzian) profile that characterizes the line shapes for over 3 years. This is attributed to ejecta-CSM interaction with a globally symmetric CSM.
-
4.
Starting already on 43 d, the H emission component is slightly moved to the red with respect to the rest-wavelength. With the progressive reduction of the emission FWHM a red component stands out on the red wing of an overall symmetric central emission of intermediate width (IW) that we attribute to the onset of interaction of the receding ejecta with CSM. The red component maintains the same central position and FWHM for about 100 d. The (receding) terminal velocity of the red component (v km s-1) is similar to the (approaching) terminal velocity of the absorption observed at early time, an indication that (at least a substantial part of) the ejecta in direction opposite to the observed travelled undisturbed until this new interaction.
-
5.
The long-lasting presence of very fast material along the line of sight, that we observe approaching and producing the broad absorption for the first two months, and then receding, and interacting with the CSM, on the receding side from several months more, is suggestive of the fact that we observe the SN along the axis of a jet-like ejection either devoid of CSM in the innermost regions or may be uninterrupted by nearby CSM clumps. Of course, we suggest that there may be clumps of CSM interaction occurring in the approaching region but there are gaps where the SN ejecta are expanding uninterrupted, producing a broad P-Cygni profile and an IW component on the blueshifted side (of variable strength depending on how much CSM material is present). Alternatively, the simultaneous presence of an IW component (FWHM 4000 - 6000 km s-1), on the other side, tells that ejecta-CSM interaction with a more symmetric CSM component takes place on the sides of the jet, in addition to the asymmetric one. A sketch of a possible configuration visualizing the findings above is shown in Fig. 17. Thus, to summarise the Fig. 17, we say that the long-lasting presence of very fast material along the line of sight, that we observe 1) approaching and producing the broad absorption during the first two months, and then 2) receding, and interacting with the CSM, for several months more, suggests that we observe the SN along the axis of a jet-like ejection in a region either devoid of CSM or may be unhindered by the nearby CSM clumps.
-
6.
We measured the mass-loss rate of the progenitor star to be M⊙ yr-1at epochs between 76 d and 1127 d, similar to the value derived by Bilinski et al. (2018). This value is consistent with of giant eruptions of LBV.
Therefore, SN 2012ab appears as the outcome of an energetic core-collapse explosion in a dense structured CSM produced by the massive progenitor in the last stages of its evolution via strong mass-loss. However, differently from Bilinski et al. (2018) we do not find evidence of structures in the CSM that can be associated with the progenitor being in an eccentric binary system. On the other hand, our analysis supports the presence of both interaction of the ejecta with a relatively symmetric CSM with abundant nearby clumps as depicted in Fig. 17 from early phase, and the late collision of the receding high-speed (v km s-1) ejecta with other asymmetric structures of the CSM. This, together with the similarly high terminal velocity of the absorptions, suggests that we are observing the interaction from a line of sight aligned with a jet-like ejection in a region devoid of interaction with CSM close to the progenitor star.
Data Availability Statement: The data underlying this article will be shared on reasonable request to the corresponding author.
Acknowledgements
N.E.R. acknowledges support from the Spanish MICINN grant ESP2017-82674-R and FEDER funds. SB, LT and MT are partially supported by the PRIN-INAF 2016 with the project Towards the SKA and CTA era: discovery, localisation, and physics of transient sources (P.I. M. Giroletti). This work is partially based on observations of the European supernova collaboration involved in the ESO-NTT and TNG large programmes led by Stefano Benetti. This work is partially based on observations made with the ESO Telescopes at the La Silla and Paranal Observatories under programme IDs 184.D-1140, 184.D-1152; the Italian Telescopio Nazionale Galileo (TNG) operated by the Fundación Galileo Galilei of the INAF (Istituto Nazionale di Astrofisica) at the Spanish Observatorio del Roque de los Muchachos of the Instituto de Astrofísica de Canarias under the programme ID A25TAC49; the Nordic Optical Telescope, operated by the Nordic Optical Telescope Scientific Association at the Observatorio del Roque de los Muchachos, La Palma, Spain, of the Instituto de Astrofísica de Canarias; the 1.82m Copernico telescope (Asiago, Italy) of the INAF - Osservatorio Astronomico di Padova; Asiago Observatory; the 1.22 m Galileo telescope of Dipartimento di Fisica e Astronomia (Universitá di Padova); the William Herschel Telescope, operated on the island of La Palma by the Isaac Newton Group in the Spanish Observatorio del Roque de los Muchachos of the Instituto de Astrofísica a de Canarias; the 2.2-m Telescope of the Centro Astronómico Hispano Alemán (Calar Alto, Spain); the Gran Telescopio Canarias (GTC), installed at the Spanish Observatorio del Roque de los Muchachos of the Instituto de Astrofísica de Canarias, in the island of La Palma. We thank the observers at ARIES to support these observations.
References
- Agnoletto et al. (2009) Agnoletto I., et al., 2009, ApJ, 691, 1348
- Aldering et al. (2006) Aldering G., et al., 2006, ApJ, 650, 510
- Allende Prieto et al. (2001) Allende Prieto C., Barklem P. S., Asplund M., Ruiz Cobo B., 2001, ApJ, 558, 830
- Andrews et al. (2010) Andrews J. E., et al., 2010, ApJ, 715, 541
- Andrews et al. (2017) Andrews J. E., Smith N., McCully C., Fox O. D., Valenti S., Howell D. A., 2017, MNRAS, 471, 4047
- Arnett (1982) Arnett W. D., 1982, ApJ, 253, 785
- Asplund et al. (2009) Asplund M., Grevesse N., Sauval A. J., Scott P., 2009, ARA&A, 47, 481
- Barron et al. (2008) Barron J. T., Hogg D. W., Lang D., Roweis S., 2008, AJ, 136, 1490
- Benetti et al. (2006) Benetti S., Cappellaro E., Turatto M., Taubenberger S., Harutyunyan A., Valenti S., 2006, ApJ, 653, L129
- Benetti et al. (2016) Benetti S., et al., 2016, MNRAS, 456, 3296
- Bilinski et al. (2018) Bilinski C., et al., 2018, MNRAS, 475, 1104
- Branch et al. (1981) Branch D., Falk S. W., McCall M. L., Rybski P., Uomoto A. K., Wills B. J., 1981, ApJ, 244, 780
- Caffau et al. (2011) Caffau E., Ludwig H.-G., Steffen M., Freytag B., Bonifacio P., 2011, Sol. Phys., 268, 255
- Cappellaro et al. (1997) Cappellaro E., Turatto M., Tsvetkov D. Y., Bartunov O. S., Pollas C., Evans R., Hamuy M., 1997, A&A, 322, 431
- Chevalier et al. (1994) Chevalier R. A., Fransson C., Lundqvist P., 1994, in Bulletin of the American Astronomical Society. p. 791
- Chonis & Gaskell (2008) Chonis T. S., Gaskell C. M., 2008, AJ, 135, 264
- Chugai (2001) Chugai N. N., 2001, MNRAS, 326, 1448
- Chugai & Danziger (1994) Chugai N. N., Danziger I. J., 1994, MNRAS, 268, 173
- Chugai et al. (2004) Chugai N. N., et al., 2004, MNRAS, 352, 1213
- Dessart et al. (2009) Dessart L., Hillier D. J., Gezari S., Basa S., Matheson T., 2009, MNRAS, 394, 21
- Dessart et al. (2015) Dessart L., Audit E., Hillier D. J., 2015, MNRAS, 449, 4304
- Dilday et al. (2012) Dilday B., et al., 2012, Science, 337, 942
- Dong et al. (2016) Dong S., et al., 2016, Science, 351, 257
- Drake et al. (2011) Drake A. J., et al., 2011, ApJ, 735, 106
- Elmhamdi et al. (2003) Elmhamdi A., et al., 2003, MNRAS, 338, 939
- Fassia et al. (2000) Fassia A., et al., 2000, MNRAS, 318, 1093
- Fassia et al. (2001) Fassia A., et al., 2001, MNRAS, 325, 907
- Fox et al. (2009) Fox O., et al., 2009, ApJ, 691, 650
- Fraser (2015) Fraser M., 2015, Searching for the disappearance of the progenitor of the unique SN 2009ip, HST Proposal
- Fraser et al. (2015) Fraser M., et al., 2015, MNRAS, 453, 3886
- Gal-Yam (2012) Gal-Yam A., 2012, in Roming P., Kawai N., Pian E., eds, IAU Symposium Vol. 279, Death of Massive Stars: Supernovae and Gamma-Ray Bursts. pp 253–260 (arXiv:1206.2157), doi:10.1017/S1743921312013014
- Gal-Yam & Leonard (2009) Gal-Yam A., Leonard D. C., 2009, Nature, 458, 865
- Gal-Yam et al. (2007) Gal-Yam A., et al., 2007, ApJ, 656, 372
- Gangopadhyay et al. (2018) Gangopadhyay A., et al., 2018, MNRAS, 476, 3611
- Gerardy et al. (2002) Gerardy C. L., et al., 2002, ApJ, 575, 1007
- Germany et al. (2000) Germany L. M., Reiss D. J., Sadler E. M., Schmidt B. P., Stubbs C. W., 2000, ApJ, 533, 320
- Gezari (2012) Gezari S., 2012, in European Physical Journal Web of Conferences. p. 03001, doi:10.1051/epjconf/20123903001
- Gezari et al. (2012) Gezari S., et al., 2012, Nature, 485, 217
- Graham et al. (2014) Graham M. L., et al., 2014, ApJ, 787, 163
- Graham et al. (2017) Graham M. L., et al., 2017, MNRAS, 472, 3437
- Graham et al. (2019) Graham M. L., et al., 2019, ApJ, 871, 62
- Hamuy (2003) Hamuy M., 2003, ApJ, 582, 905
- Hamuy et al. (2003) Hamuy M., et al., 2003, Nature, 424, 651
- Inserra et al. (2011) Inserra C., et al., 2011, MNRAS, 417, 261
- Jeffery & Branch (1990) Jeffery D. J., Branch D., 1990, in Wheeler J. C., Piran T., Weinberg S., eds, Vol. 6, Supernovae, Jerusalem Winter School for Theoretical Physics. p. 149
- Jencson et al. (2016) Jencson J. E., Prieto J. L., Kochanek C. S., Shappee B. J., Stanek K. Z., Pogge R. W., 2016, MNRAS, 456, 2622
- Kankare et al. (2012) Kankare E., et al., 2012, MNRAS, 424, 855
- Kankare et al. (2017) Kankare E., et al., 2017, Nature Astronomy, 1, 865
- Kewley & Dopita (2002) Kewley L. J., Dopita M. A., 2002, ApJS, 142, 35
- Kiewe et al. (2012) Kiewe M., et al., 2012, ApJ, 744, 10
- Kollmeier et al. (2019) Kollmeier J. A., et al., 2019, arXiv e-prints,
- Kumar et al. (2019) Kumar B., et al., 2019, MNRAS, 488, 3089
- Landolt (1992) Landolt A. U., 1992, AJ, 104, 340
- Li et al. (2011) Li W., et al., 2011, MNRAS, 412, 1441
- MacLeod et al. (2012) MacLeod C. L., et al., 2012, ApJ, 753, 106
- Margutti et al. (2014) Margutti R., et al., 2014, ApJ, 780, 21
- Martin et al. (2015) Martin J. C., Hambsch F.-J., Margutti R., Tan T. G., Curtis I., Soderberg A., 2015, AJ, 149, 9
- Mauerhan et al. (2013a) Mauerhan J. C., et al., 2013a, MNRAS, 430, 1801
- Mauerhan et al. (2013b) Mauerhan J. C., et al., 2013b, MNRAS, 431, 2599
- Maund et al. (2006) Maund J. R., et al., 2006, MNRAS, 369, 390
- McGaugh (1991) McGaugh S. S., 1991, ApJ, 380, 140
- Miller et al. (2010) Miller A. A., et al., 2010, MNRAS, 404, 305
- Moriya et al. (2013) Moriya T. J., Blinnikov S. I., Tominaga N., Yoshida N., Tanaka M., Maeda K., Nomoto K., 2013, MNRAS, 428, 1020
- Mould et al. (2000) Mould J. R., et al., 2000, ApJ, 529, 786
- Munari & Zwitter (1997) Munari U., Zwitter T., 1997, A&A, 318, 269
- Ofek et al. (2007) Ofek E. O., et al., 2007, ApJ, 659, L13
- Pastorello et al. (2013) Pastorello A., et al., 2013, ApJ, 767, 1
- Pastorello et al. (2019) Pastorello A., et al., 2019, A&A, 628, A93
- Pei (1992) Pei Y. C., 1992, ApJ, 395, 130
- Pettini & Pagel (2004) Pettini M., Pagel B. E. J., 2004, MNRAS, 348, L59
- Pilyugin & Thuan (2005) Pilyugin L. S., Thuan T. X., 2005, ApJ, 631, 231
- Poznanski et al. (2012) Poznanski D., Prochaska J. X., Bloom J. S., 2012, MNRAS, 426, 1465
- Rees (1988) Rees M. J., 1988, Nature, 333, 523
- Richmond et al. (1994) Richmond M. W., Treffers R. R., Filippenko A. V., Paik Y., Leibundgut B., Schulman E., Cox C. V., 1994, AJ, 107, 1022
- Rigon et al. (2003) Rigon L., et al., 2003, MNRAS, 340, 191
- Salamanca et al. (1998) Salamanca I., Cid-Fernandes R., Tenorio-Tagle G., Telles E., Terlevich R. J., Munoz-Tunon C., 1998, MNRAS, 300, L17
- Sarangi et al. (2018) Sarangi A., Dwek E., Arendt R. G., 2018, ApJ, 859, 66
- Schlafly & Finkbeiner (2011) Schlafly E. F., Finkbeiner D. P., 2011, ApJ, 737, 103
- Schlegel (1990) Schlegel E. M., 1990, MNRAS, 244, 269
- Smartt et al. (2009) Smartt S. J., Eldridge J. J., Crockett R. M., Maund J. R., 2009, MNRAS, 395, 1409
- Smith & McCray (2007) Smith N., McCray R., 2007, ApJ, 671, L17
- Smith & Owocki (2006) Smith N., Owocki S. P., 2006, ApJ, 645, L45
- Smith et al. (2007) Smith N., et al., 2007, ApJ, 666, 1116
- Smith et al. (2008) Smith N., Chornock R., Li W., Ganeshalingam M., Silverman J. M., Foley R. J., Filippenko A. V., Barth A. J., 2008, ApJ, 686, 467
- Smith et al. (2009) Smith N., et al., 2009, ApJ, 695, 1334
- Smith et al. (2011a) Smith N., Gehrz R. D., Campbell R., Kassis M., Le Mignant D., Kuluhiwa K., Filippenko A. V., 2011a, MNRAS, 418, 1959
- Smith et al. (2011b) Smith N., et al., 2011b, ApJ, 732, 63
- Smith et al. (2014) Smith N., Mauerhan J. C., Prieto J. L., 2014, MNRAS, 438, 1191
- Smith et al. (2016) Smith N., Andrews J. E., Mauerhan J. C., 2016, MNRAS, 463, 2904
- Stritzinger et al. (2012) Stritzinger M., et al., 2012, ApJ, 756, 173
- Trundle et al. (2009) Trundle C., et al., 2009, A&A, 504, 945
- Tully et al. (2016) Tully R. B., Courtois H. M., Sorce J. G., 2016, AJ, 152, 50
- Turatto et al. (1990) Turatto M., Cappellaro E., Barbon R., della Valle M., Ortolani S., Rosino L., 1990, AJ, 100, 771
- Turatto et al. (1993) Turatto M., Cappellaro E., Danziger I. J., Benetti S., Gouiffes C., della Valle M., 1993, MNRAS, 262, 128
- Turatto et al. (2000) Turatto M., et al., 2000, ApJ, 534, L57
- Turatto et al. (2003) Turatto M., Benetti S., Cappellaro E., 2003, in Hillebrandt W., Leibundgut B., eds, From Twilight to Highlight: The Physics of Supernovae. p. 200 (arXiv:astro-ph/0211219), doi:10.1007/10828549_26
- Valenti et al. (2009) Valenti S., et al., 2009, Nature, 459, 674
- Van Dyk et al. (2000) Van Dyk S. D., Peng C. Y., King J. Y., Filippenko A. V., Treffers R. R., Li W., Richmond M. W., 2000, PASP, 112, 1532
- Vanden Berk et al. (2001) Vanden Berk D. E., et al., 2001, AJ, 122, 549
- Vink (2018) Vink J. S., 2018, A&A, 619, A54
- Vinko et al. (2012) Vinko J., et al., 2012, Central Bureau Electronic Telegrams, 3022
- Zhang et al. (2012) Zhang T., et al., 2012, AJ, 144, 131
- van Velzen et al. (2011) van Velzen S., et al., 2011, ApJ, 741, 73