A Recent Major Merger Tale for the Closest Giant Elliptical Galaxy Centaurus A
Abstract
We have used hydrodynamical simulations to model the formation of the closest giant elliptical galaxy, Centaurus A. We find that a single major merger event with a mass ratio up to 1.5, and which has happened Gyr ago, is able to reproduce many of its properties, including galaxy kinematics, the inner gas disk, stellar halo ages and metallicities, and numerous faint features observed in the halo. The elongated halo shape is mostly made of progenitor residuals deposited by the merger, which also contribute to stellar shells observed in the Centaurus A halo. The current model also reproduces the measured Planetary Nebulae line of sight velocity and their velocity dispersion. Models with small mass ratio and relatively low gas fraction result in a de Vaucouleurs profile distribution, which is consistent with observations and model expectations. A recent merger left imprints in the age distribution that are consistent with the young stellar and Globular Cluster populations (2-4 Gyrs) found within the halo. We conclude that even if not all properties of Centaurus A have been accurately reproduced, a recent major merger has likely occurred to form the Centaurus A galaxy as we observe it at present-day.
keywords:
Galaxies: evolution - Galaxies: interactions - individual: NGC 51281 Introduction
Understanding the star formation history and mass assembly history of galaxies is one of the most challenging tasks in modern astrophysics. Elliptical galaxies are the most massive ones in the classification of Hubble (Hubble, 1936). They contain % of the total mass in stars in the local universe and this fraction goes to 75% for spheroids, including S0 and spiral bulges. The massive Early Type Galaxies (ETG) are believed to form according to a two phase scenario (e.g. Daddi et al., 2005; Oser et al., 2010; Arnold et al., 2011; Naab & Ostriker, 2017; Iodice et al., 2017; Pulsoni et al., 2020). At high redshift, gas collapses in the centre of dark matter and intense star formation occurs, to be subequently quickly quenched. Then in a second stage, the accretion is dominant and ETGs grow efficiently in size through a series of mergers. The complex formation process through mergers and accretion of nearby galaxies make it difficult to disentangle mixed material and stars originating from different progenitors.
Centaurus A (Cen A, NGC 5128), the central galaxy of the Centaurus group, is the closest easily observable giant elliptical galaxy with a distance of 3.8 Mpc (Harris, Rejkuba & Harris, 2010). The iconic optical image of Cen A with a prominent twisted dust lane traversing a large spheroid has led to galaxy classification as peculiar elliptical or sometimes also S0 or S0p (see Harris, 2010, for a more details about Cen A’s classification). This morphology has been ascribed already in the 50-ies to a possible merger origin. Baade & Minkowski (1954) interpreted the object as consisting of two nebulae, an elliptical nebula and a second system, possibly a spiral, that are ”in a state of strong gravitational interaction, perhaps actually in collision.” A number of studies have pointed out that the main body of the galaxy has a light distribution of a ”normal” elliptical following closely the de Vaucouleur’s profile (Sersic, 1958; van den Bergh, 1976; Dufour et al., 1979), and that the denomination as peculiar was perhaps undeserving and only a result of the proximity, that offers more detailed observations than possible in more distant systems (Ebneter & Balick, 1983; Harris, 2010). The proximity of Cen A provides excellent opportunities to study the galaxy in exquisite detail, and a possibility to disentangle its formation history.
Wang et al. (2012, 2015) and Hammer et al. (2010, 2018) modeled the formation of nearby giant spirals using numerical simulations of major mergers of two gas rich spiral galaxies. Such a code can be adapted to explore a possibility of reproducing the observed properties of Cen A as a result of a major merger. Through comparison of observational properties of Cen A with those predicted by merger simulations we can learn about galaxy formation processes.
In spite of already mentioned ideas about the merger origin of Cen A, some of its properties are suggesting an early rapid formation with subsequent evolution that included accretion(s) of satellite galaxies. This is in particular supported by the observed age distribution of stars (Rejkuba et al., 2005, 2011) and globular clusters (GCs) (Kaviraj et al., 2005; Beasley et al., 2008; Woodley et al., 2007, 2010b) that contain a bulk of the population that formed Gyr ago, and up to 20-30% that formed later having ages as young as Gyr. Beasley et al. (2003) have compared the stellar halo and GCs metallicity distribution functions with predictions of a cold dark matter (CDM) semi-analytic galaxy formation model, finding that the vast majority of star formation in the model occurs quiescently, while the red metal-rich GCs require hierarchical mergers, leading to predictions for their age-metallicity distribution. The warped disk that crosses the centre of Cen A and the presence of HI and CO in the disk and in shells surrounding the galaxy have been interpreted as coming from a relatively recent minor merger with a gas rich spiral akin in size to M33 (Quillen et al., 1992; Mirabel et al., 1999; Charmandaris, Combes & van der Hulst, 2000).
The formation scenario in which Cen A has experienced a relatively recent major merger has been invoked in the literature due to its perturbed morphology with the central dust lane, filaments and shells, and it could perhaps also explain the presence of the active galactic nucleus (AGN) in its centre (see the review by Israel, 1998, for a historical perspective and further references). Peng, Ford & Freeman (2004a) suggested that the GC System and Planetary Nebulae data in Cen A support a scenario according to which the main body of the galaxy was formed several Gyr ago through a dissipational merger of two unequal-mass disk galaxies and continued to grow through accretion of further satellites. Mathieu, Dejonghe & Hui (1996) built a triaxial dynamical model interpreting the Cen A Planetary Nebulae kinematics measured by Hui et al. (1995) as the results of a major merger with 3:1 mass ratio. Numerical simulations in which an elliptical galaxy is formed through a major merger of spiral galaxies have been made by Bekki, Harris & Harris (2003) as well as by Bekki & Peng (2006). They were used to explain the halo metallicity distribution and PN kinematics, respectively. Additional simulations that include gas dissipation and star formation are necessary to make further progress (Peng, Ford & Freeman, 2004b). It has been shown that realistic mergers require a correct treatment of the gas through hydrodynamical simulations, and by using consistent hydrodynamical solvers (see Hopkins 2015, and references therein).
Hammer et al. (2013) proposed that the vast thin disk of satellites around our closest giant spiral M31 (Ibata et al., 2013) could be linked to a major merger. The model of M31 (Hammer et al., 2018) as a recent 2-3 Gyr old major merger reproduced successfully the giant stream and halo substructures in M31 (Ibata et al., 2007). This prompts the question of whether a similar explanation could be applied also to Cen A.
The aim of this paper is to verify if a numerical simulation of a major merger could explain several observational properties in Cen A. In Section 2 we describe data used for comparison with the models. The simulation method and initial conditions are described in Section 3. Results including comparisons to observations are presented in Section 4. In the last section, we discuss and summarize our results.
2 THE PROPERTIES OF CENTAURUS A
Centaurus A is one of the nearest and largest radio galaxies, and its optical counterpart is the giant elliptical galaxy NGC 5128 with the total integrated magnitude mag (Dufour et al., 1979). Throughout the paper, while we examine mostly the optical properties of the elliptical galaxy, we use its radio source name abbreviated to Cen A. Based on a review of distance measurements, Harris, Rejkuba & Harris (2010) derived the best-estimate distance for NGC 5128 of Mpc111At the 3.8 Mpc distance 1′ is equivalent to kpc. The integrated light measurements in the inner parts of the galaxy revealed a luminosity distribution similar to that of an E2 galaxy type following a de Vaucouleur’s law over the range mag arcsec-2 and having an effective radius of measured in -band (Dufour et al., 1979). At the distance of 3.8 Mpc this implies kpc.
Fall & Romanowsky (2018) have derived the stellar mass of Cen A based on the observed colors and the predicted relation between and from stellar population models, assuming . The band luminosity from Two Micron All Sky Survey (2MASS) survey (Skrutskie et al., 2006) has been corrected for the bias that underestimates luminosity for large galaxies by their ”aperture corrections” (Romanowsky & Fall, 2012). After re-scaling the distance to 3.8 Mpc and the Initial Mass Function (IMF) to a Salpeter ’diet’, the total stellar mass is estimated to be M⊙.
The total dynamical mass has been measured using GCs, PN, HI gas, X-ray emission, and satellites. While these tracers cover different distances, the total mass is between M⊙ at kpc (Schiminovich et al., 1994, corrected to 3.8 Mpc distance) and M⊙ at kpc (Woodley et al., 2010a). Considering also dynamics of satellites, the mass of the whole Centaurus group is M⊙ (Woodley, 2006; Karachentsev et al., 2007). The ratio is lower than expected for an elliptical with values between 7–15 within inner 20 kpc and increasing outwards reaching at 45 kpc in the halo and for the Centaurus group (Kraft et al., 2003; Woodley, 2006; Samurovic, 2006).
The giant elliptical is traversed by a warped dust lane (Quillen et al., 2006) surrounded by a stellar ring populated by young red supergiant stars (Kainulainen et al., 2009), and it hosts a system of shells (Malin, 1978; Peng et al., 2002) and an extended halo with numerous low surface brightness streams (Crnojević et al., 2016).
Most of the gas in Cen A is located in a disk that follows the dust lane in the centre of the galaxy (van Gorkom et al., 1990; Eckart et al., 1990; Quillen et al., 1992; Espada et al., 2019). Furthermore, HI and molecular gas have also been detected extending out to about 15 kpc in the halo of Cen A (Schiminovich et al., 1994; Charmandaris, Combes & van der Hulst, 2000; Oosterloo & Morganti, 2005). HI in the central area is in close to edge-on structure along the central dust lane that is roughly perpendicular to the jet, which is along PA axis (Tingay et al., 1998). The central HI, CO and dust are all part of a coherent warp that extends between 2 to 6500 pc (see Quillen et al., 2010, for a review). There are multiple folds in this warped disk. The northern radio lobe is likely pointing towards us, while the southern lobe points away. The gas and dust disk is mostly visible in the optical in the north-eastern part where it is in front of the galaxy, while in the south-western side it is partly obscured by the galaxy body (Morganti, 2010; Struve et al., 2010).
The gas in the halo is distributed in a ring-like structure that rotates in the same direction as the main stellar body of the galaxy, and molecular gas is found to be located in close proximity of stellar shells (Charmandaris, Combes & van der Hulst, 2000). In the north-eastern region of the HI ring, along the radio jet direction, there is evidence of recent star formation (Graham, 1998; Mould et al., 2000; Rejkuba et al., 2001, 2002) possibly triggered by interaction of the jet with the interstellar medium (Oosterloo & Morganti, 2005; Salomé et al., 2016b; Santoro et al., 2016). The total HI mass of M⊙ in the disk and another M⊙ in the shells were reported by Schiminovich et al. (1994); Struve et al. (2010). A similar amount of molecular gas was found by Charmandaris, Combes & van der Hulst (2000); Wild & Eckart (2000); Salomé et al. (2016a). The overall HI fraction in Cen A is relatively low for an ETG with (Struve et al., 2010). Parkin et al. (2012) reported a total dust mass of M⊙ and total gas mass of M⊙ based on Herschel and JCMT observations. Most recent high sensitivity and high spatial resolution maps of the central disk in Cen A made in CO (1-0) with ALMA (Espada et al., 2019) found even larger reservoir of molecular gas amounting to M⊙.
Thanks to its proximity, the stellar halo of Cen A can be resolved into individual red giant branch (RGB) stars and from their colour distribution it is possible to measure a metallicity distribution function (MDF), in addition to surface brightness distribution and mean metallicity gradient. The stellar MDF has been derived from optical photometry obtained with the HST in fields ranging in distance between 8 – 140 kpc (Harris, Harris & Poole, 1999; Harris & Harris, 2000, 2002; Rejkuba et al., 2005, 2014) from the centre of Cen A. Stellar halo age distribution was derived from the deepest HST field located kpc south of the centre of the Cen A. Two burst models with 70-80% of the stars forming in a short burst Gyr ago, and the 20-30% of the stars forming 2–4 Gyr ago, provided the best fit to these observations (Rejkuba et al., 2011). This age distribution is consistent with the globular cluster age distribution based on photometry (Kaviraj et al., 2005) and on low-resolution spectroscopy (Peng, Ford & Freeman, 2004a; Beasley et al., 2008; Woodley et al., 2010b). Wider area imagers, VIMOS on the VLT and Megacam on the Magellan telescope, were used to trace the surface density and metallicity gradients in the outer halo (Bird et al., 2015; Crnojević et al., 2013, 2016). The resolved stellar halo studies showed a relatively shallow metallicity gradient with a slope dex kpc-1, or dex per (Rejkuba et al., 2014). This may indicate that bulk of the halo was not assembled through accretion of many low mass satellites, but rather from few, massive ones.
Over a thousand Planetary Nebulae (PN, Hui et al., 1995; Peng, Ford & Freeman, 2004b; Walsh, Rejkuba & Walton, 2015) and almost six hundred GCs (Peng, Ford & Freeman, 2004a; Beasley et al., 2008; Woodley et al., 2010a) have measured velocities providing kinematic information from centre out to Reff, with a few confirmed clusters and PN as far out as 15.5 Reff or 85 kpc (Walsh, Rejkuba & Walton, 2015), and many more cluster candidates out to 150 kpc (Taylor et al., 2017; Voggel et al., 2020). The halo of Cen A shows a disk-like feature, which has a large rotation along the major axis flattening at 100 km/s as traced by PN (Peng, Ford & Freeman, 2004b). The zero-velocity contour of the velocity field is perpendicular to the stellar major axis with a pronounced twist. GCs show different kinematics between metal-poor and metal-rich component (Peng, Ford & Freeman, 2004a; Woodley et al., 2010a). The metal-poor GCs are supported by dispersion ( km/s) with a flat dispersion profile extending to 20′and then possibly increasing outwards. The metal-rich GCs have a similar velocity dispersion, but they also exhibit a rotation of km/s around the isophotal major axis. The globular cluster kinematics was discussed both as providing evidence supporting (Peng, Ford & Freeman, 2004a) and against (Woodley et al., 2010a) a recent major merger formation scenario for the galaxy.
The studies mentioned above are mainly focusing on the large scale properties of the Cen A halo, its stellar population content and dynamics. The properties and studies of the radio jet and black hole in the center region are beyond the scope of our analysis, and are not discussed in this paper.
| parameters | Model-6 | Model-7 | Model-10 | Model-11 |
|---|---|---|---|---|
| mass ratio | 1.0 | 1.0 | 1.0 | 1.5 |
| Gal1 incy | 90 | 90 | 90 | 90 |
| Gal1 incz | -90 | -90 | -90 | -90 |
| Gal2 incy | 70 | 80 | 80 | 80 |
| Gal2 incz | -40 | -50 | -50 | -50 |
| Gal1 gas fraction | 0.2 | 0.2 | 0.2 | 0.2 |
| Gal2 gas fraction | 0.2 | 0.2 | 0.4 | 0.4 |
| Gal1 (kpc) | 5.1 | 5.1 | 8.1 | 8.5 |
| Gal2 (kpc) | 5.1 | 5.1 | 5.1 | 4.86 |
| Gal1 (kpc) | 10.2 | 10.2 | 16.2 | 17.0 |
| Gal2 (kpc) | 10.2 | 10.2 | 15.3 | 14.58 |
| (kpc) | 20 | 20 | 18 | 25 |
| eccentricity | 1.0 | 1.0 | 1.0 | 1.0 |
| Nparticle | 1.85M | 1.85M | 1.85M | 1.85M |
| mdm:mstar:mgas | 4:1:1 | 4:1:1 | 4:1:2 | 4:1:1 |
| softening(::)(kpc) | 0.3:0.1:0.1 | 0.3:0.1:0.1 | 0.3:0.1:0.1 | 0.3:0.1:0.1 |
| Observed time (Gyr) | 5.8 | 5.8 | 6.4 | 5.4 |
| Sersic index() | 4.7 | 4.4 | 6.2 | 4.4 |
| Effective radius (kpc) | 3.7 | 4.0 | 4.4 | 6.3 |
| Final gas fraction | 3.2% | 3.5% | 4.1% | 8.8% |
| Gas Mass (r kpc) (1010M⊙) | 0.61 | 0.68 | 0.73 | 1.58 |
3 NUMERICAL SIMULATIONS AND INITIAL CONDITIONS
The numerical simulations were carried out with GIZMO code (Hopkins, 2015), which is based on a new Lagrangian method for hydrodynamics, and has simultaneously properties of both Smoothed Particle Hydrodynamics (SPH) and grid-based/adaptive mesh refinement methods. We have implemented into GIZMO star formation and feedback processes as described in Wang et al. (2012) following the method of Cox et al. (2006). The cooling process has been implemented in GIZMO with an updated version of Katz, Weinberg & Hernquist (1996). This code has been used in simulating the formation of Magellanic Stream (Wang et al., 2019).
The initial conditions were set up following the procedure of Wang et al. (2012, 2015) and Hammer et al. (2010, 2018), who modeled the formation of a nearby giant spirals after a major merger of two gas rich spirals. Since Cen A is an early type galaxy with low gas fraction, progenitors with moderate gas fractions () are used, which leads to a larger bulge fraction for the merger remnant (Hopkins et al., 2009, 2010). Moreover, Sauvaget et al. (2018) experimented with a series of major mergers showing that only those with an initially low gas fraction and low mass ratio (2) are able to produce giant elliptical remnants. All the simulations are performed assuming a baryon fraction of 9% (Wang et al., 2012, 2015). The initial gas disk scale-length is 2-3 times larger than that of the stellar disk, since observations show that gas disks are more extended than stellar disks (van der Kruit, 2007).
There are several thin streams in the halo of Cen A that, if associated with a major merger, would favor a prograde orbit for one progenitor. Indeed, (Toomre & Toomre, 1972) showed that for prograde encounters (orbital angular momentum aligned with those of the initial disk galaxies), particles are more in resonance with the tidal field and result in far more prominent tidal tails than retrograde encounters (see also realizations of tidal tails by Wang et al. 2012, 2015). This also applies for interpreting the straight stream (Crnojević et al., 2016), which leads us to use a prograde orbit for one of the progenitors. We also use a polar orbit for the other progenitor, since Bekki & Peng (2006) found that a collision with a highly inclined orbital configuration can reproduce Cen A’s kinematics (Peng, Ford & Freeman, 2004b). Observations show ongoing star formation with Myr old stars along the jet direction in the north-east halo extending up to kpc (Graham, 1998; Mould et al., 2000; Rejkuba et al., 2001). Additional ionised gas filaments are observed up to 35 kpc distance(Neff, Eilek & Owen, 2015). However, beyond those relatively confined areas with ongoing low efficiency star formation (Salomé et al., 2016b), the stellar age distribution within kpc in the halo has a moderate (%) fraction of stars that formed as recently as 2 Gyr ago (Rejkuba et al., 2011). This epoch could indicate the fusion time of the merger (Hammer et al., 2018), during which some material can be easily ejected from the central regions. We compare the simulated merger remnants at the time that corresponds to 21 Gyr after fusion with observations. The timescale for the current major merger is longer than that for minor merger models. Quillen, Graham & Frogel (1993) proposed a timescale of the order of 0.2 Gyr after accretion of a minor spiral to model the warp formation. This is also roughly consistent with the shell-like feature formation timescale (Schiminovich et al., 1994; Peng et al., 2002). We developed an efficient software that enables three dimensional visualisation of results to model nearby galaxy formation. For further details about this software we refer to Hammer et al. (2010, 2018) and Wang et al. (2012, 2015).
Following the same procedure as done in our previous studies (Wang et al., 2012, 2015; Hammer et al., 2010, 2018), we have optimized the parameter space, including the pericenter, two inclination angles for each progenitor, the initial gas fractions and mass ratio. Given the large parameter space, It is impossible to examine all parameters in detail. However, the above constraints help reduce the parameter space significantly. During its exploration, we first build large coarse grid of parameters with values in the following ranges: (1) mass ratio of progenitors between 1 to 3, (2) the orbital parameters with pericenter distance between 5 kpc to 40 kpc and eccentricity ranging from 0.9 to 1, (3) different inclination angles of initial progenitors. Besides these, we also checked our major merger library that was built specifically for NGC 5907 and NGC 4013 (Wang et al., 2012, 2015) in order to further constrain the parameter space. Snapshots from each simulation have been examined using 0.1 Gyr time steps. After finding possible candidate models, we fine tune the parameters to optimize the simulation. A total of 220 simulations have been performed to provide the necessary material for reproducing Cen A’s observed properties. A systematic comparison between these models and observations has let us to select four of them that show the best reproduction of Cen A’s properties. Parameters of these four models are presented in Table 1. They all have similar angular orbital parameters as well as the initial gas fractions. Most of the variance is in mass ratio, initial scale-lengths, and pericenters, all being major ingredients in merger modelling, which well demonstrate the final result variance from different models. We run simulations using 1.85 million particles per simulation. Additionally, we also run some simulations with 6 and 10 million particles. There was little change with the increased number of particles demonstrating convergence of our simulations.
In what follows, we compare several features from our simulations to the observed properties of Cen A to assess the robustness of our methods and results.
4 THE RESULTS
4.1 Galaxy morphology and faint features formed during merger
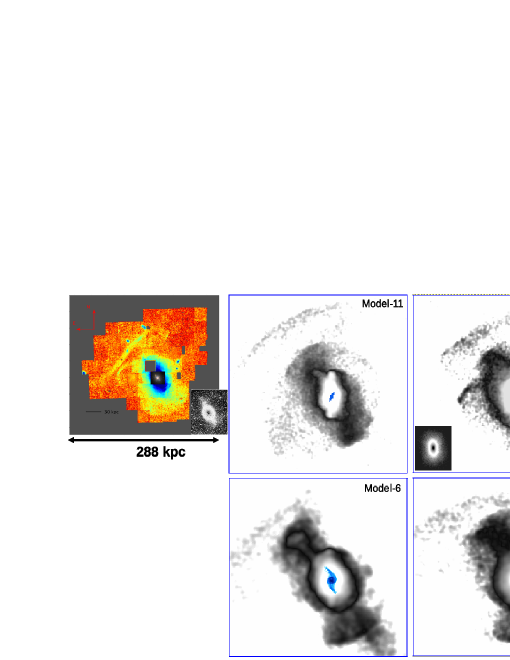
Fig.1 shows the stellar mass distribution resulting from the four models and compares them to the observations made by Crnojević et al. (2016) and image from D. Malin published in Israel (1998). All models reproduce the main features observed in the Cen A imagery. In the deepest observations from Crnojević et al. (2016), the halo of Cen A shows an elongated shape along the major axis. At both ends of the major axis, there are several over-densities and clumps, in particular on the bottom side of the galaxy. This behavior is well reproduced by our simulations and identified to be main residuals of the merger event. Interestingly, our simulations are able to reproduce one of the most stunning features in Cen A’s halo, i.e., the long stream to the north-east of the galaxy, as a result of the central major merger. The stream was first discovered in the ground-based imaging presented by Crnojević et al. (2016) and further followed-up with HST (Crnojević et al., 2019); it is 60 kpc long and located at a projected distance of 80 kpc from Cen A, and it features a clear remnant (dubbed Dw3) which hosts a candidate nuclear star cluster (Seth et al., in prep.). The stream could have originated from the tidal influence of Cen A on a dwarf galaxy, leading to the observed S-shape of the stripped remnant’s outer isophotes (Crnojević et al., 2016). However, the shape of Dw3’s tidal tails, and in particular their straightness, is somewhat unusual: one possible interpretation is that this is the result of a recent accretion event, which is observed close to apocenter and with a large velocity component in the direction of the plane of the stream (S. Pearson, private communication). It is intriguing that this feature can be naturally obtained from our simulations: this could possibly imply that Dw3 has a tidal dwarf origin instead (Fouquet et al., 2012; Hammer et al., 2013; Yang et al., 2014; Ploeckinger et al., 2015; Baumschlager et al., 2019; Kroupa, Pawlowski & Milgrom, 2012; Metz & Kroupa, 2007). This scenario can be tested by obtaining kinematics of the remnant to assess the presence/absence of dark matter. We also highlight that one model (Model-10) reproduces as well a second, curved stream that can be seen on the left side of the images in the top-left (Crnojević et al., 2016) and top-right panels of Fig.1.
Observations have revealed a warped HI gas disk (Schiminovich et al., 1994; Israel, 1998; van Gorkom et al., 1990), which is roughly perpendicular to the major axis of the stellar component. In Fig.1 the gas component is the blue component overlapping the center of the galaxy. Three models show such an edge-on gas disk component, and two of them, Model-11 and Model-7, have gas disk position angles roughly consistent with observations. We notice however, that the gas disk component presents large angular changes with time, which means that capturing the proper position angle is a difficult and lengthy task. To get a better match, more models are needed for fine tuning.
Perhaps the major weakness of our modeling is the overall size of Cen A, which is systematically larger in simulations than the observed one. For example, in Model-10 the distance from the galaxy center to the faint features found in the bottom of the image is about 22% larger than that observed, while Model-7 leads to even more overestimated size (60% larger). Moreover, for Model-10 and Model-7, the projected distance from the galaxy center to the straight stream is 70 and 100% larger than that observed, respectively. Thus our modeling is well indicative of the structures formed during the major merger that has occurred in Cen A, but does not represent an accurate reproduction of this galaxy, contrary to the one obtained in Hammer et al. (2018) for M31. We notice that to get such an accurate reproduction of M31 required to perform close to a thousand different models, most of them being dedicated for fine tuning. To recover the projected distance between the straight stream and the galaxy center different projected angles need to be considered. Alternatively, the mismatch could be due to the low baryon-to-dark matter ratio adopted here, since it possibly leads to a merger that is too energetic and expels too large quantities of material in the galaxy outskirts. Among several fine tuning parameters that can be experimented with, one may consider changing the initial scales of the progenitors, as well as the merger pericenter.
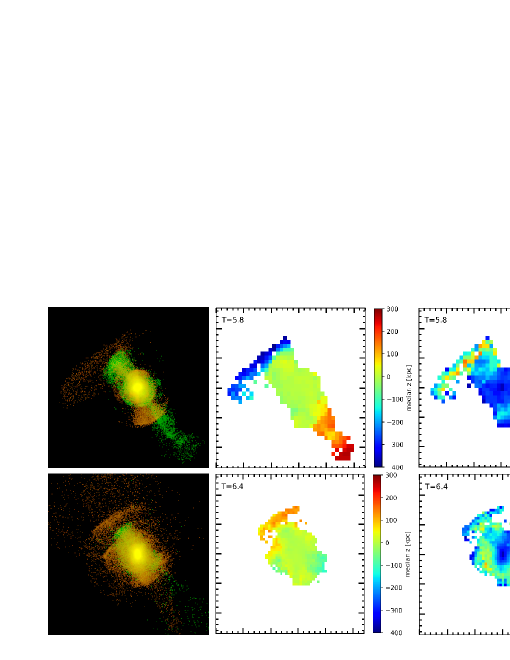
The left panels of Fig. 2 show how the stellar particles from the two progenitors are distributed. While both progenitors contribute to the central regions, there are clear differences in their outskirt distributions. For example, the straight stream is always coming from a single progenitor as well as the shell-like structures on both top and bottom sides of the galaxy (see red particles). The other progenitor (see green particles) may also contribute to the elongated distribution of the residuals along the major axis, though with large differences from one model to another.
The distance distribution of residuals in the galaxy outskirts is shown in the middle panels of Fig. 2. For Model-6 the straight stream is found 300 kpc behind Cen A. On the contrary in Model-10 it is 100 kpc in front of Cen A. As shown by Crnojević et al. (2019, see their table 5), the distance estimates along this stream are not well constrained by observations, with values ranging from 150 kpc in front of Cen A, to 750 kpc further away. Uncertainties from observations add another reason why fine tuning of the model could not be accomplished, for the moment.
In the right panels of Fig. 2, the color coding indicates the standard deviation of the distances. In most cases, the standard deviation is around 60 kpc in the straight stream such as in Model-10, while it may reach 110 kpc in Model-6. The observed difference in distance at different positions along the straight stream is quite large reaching up to 900 kpc in Crnojević et al. (2019) (between Dw3-WFC3 and Dw3S-ACS). This is significantly larger difference than the distance deviation in the models, and may indicate that the straight stream is made of different components and/or has a different origin, as discussed above.
4.2 Velocity Field
Over the last a few decades, the kinematic properties of Cen A have been studied using different tracers, including spectroscopy of integrated stellar light (Wilkinson et al., 1986), of PN (Hui et al., 1995; Peng, Ford & Freeman, 2004b), and of GCs (Peng, Ford & Freeman, 2004a; Beasley et al., 2008; Woodley et al., 2007, 2010a). These studies provide valuable constraints on the kinematic properties of Cen A and total mass.
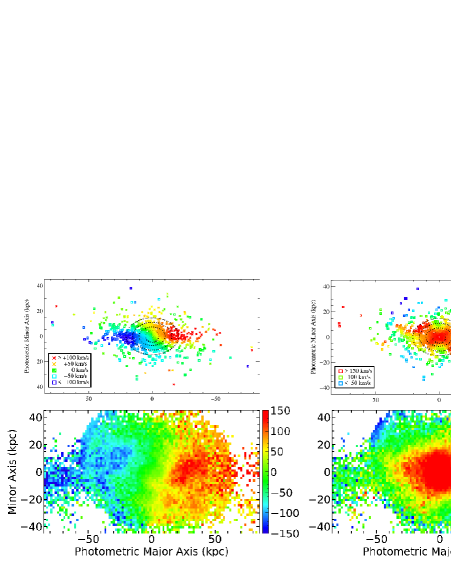
Bottom panels of Fig.3 show the velocity field (left) and dispersion map (right) for Model-6. In this figure, the galaxy has been rotated to have the major axis along to the x-axis to ease the comparison with the observations by Peng, Ford & Freeman (2004b) shown in the top two panels. Peng, Ford & Freeman (2004b) used PN to study the velocity field. The final Model-6 remnant shows a rotation along the major axis with an amplitude of about 150 km/s, which is fully consistent with the observations (Peng, Ford & Freeman, 2004b). The central peak in the velocity dispersion map reaches about 150 km/s, which is also consistent with observations (Peng, Ford & Freeman, 2004b). Given the discrete tracer (PN) the observations show a sparser sampling than that of the models.
4.3 Total mass distribution
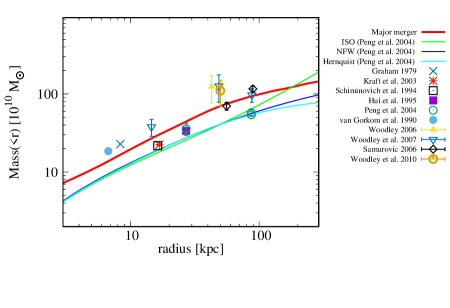
Measurements of total mass of Cen A are important because they reveal the amount of dark matter. Several different methods and tracers have been used to estimate the total mass profile for Cen A. Their values, compiled from the literature and scaled to the galaxy distance of 3.8 Mpc are plotted with different symbols and lines as shown on the right side of Fig. 4. The total mass tracers include GCs (Woodley, 2006; Woodley et al., 2007, 2010a), PN (Peng, Ford & Freeman, 2004b; Hui et al., 1995; Samurovic, 2006), HI gas (Graham, 1979; van Gorkom et al., 1990; Schiminovich et al., 1994), and X-ray emission (Kraft et al., 2003). There is a significant scatter between the total mass measurements at comparable radii with a clear outward increase indicating that the galaxy is not dominated by dark matter in the inner Reff (see also Peng, Ford & Freeman, 2004b, for further discussion). The red line (Major merger) Model-6 simulation follows the outward increase in the total mass and lies in between observed data points.
4.4 Stellar mass profile
Dufour et al. (1979) have measured the surface brightness profile in the central region in band and obtained a very good fit with a de Vaucouleur’s law. The extended surface brightness of Cen A to its outskirts has been measured using observations of individual RGB stars in the halo (Crnojević et al., 2013; Rejkuba et al., 2014; Bird et al., 2015). Crnojević et al. (2013) and Bird et al. (2015) resolved stellar halo of Cen A using VIMOS@VLT. Crnojević et al. (2013) observed two fields along the north-eastern major axis and another two fields along south-east minor axis, spanning a range of distances between kpc. Bird et al. (2015) had a single VIMOS pointing at kpc, but they combined their results with the RGB star counts and MDF measurements from previous Hubble Space Telescope data (Harris, Harris & Poole, 1999; Harris & Harris, 2000, 2002; Rejkuba et al., 2005) to derive the density falloff independently for metal-rich and metal-poor stars between kpc. They found that both the metal-rich and metal-poor populations can be well fitted with a de Vaucouleur’s law profile. Crnojević et al. (2013) noted a higher RGB number density along the major axis that deviated significantly from a de Vaucouleur’s profile beyond kpc. Their data had insufficient coverage to distinguish between the genuine flattening of the radial profile and a presence of small scale substructures in the halo. Rejkuba et al. (2014) used ACS and WFC3 cameras on board the HST to extend resolved stellar halo studies out to a projected distance of 140 kpc along the galaxy major axis and 90 kpc along the minor axis. They found that in the outer halo, beyond 10 Reff, there is a systematic increase in number counts along the major axis, even after accounting for field-to-field variations due to small scale substructures. A de Vaucouleur’s profile was shown to provide a good fit in the inner part of the galaxy as well as along the minor axis, while a power law provided a better fit along outer halo major axis.
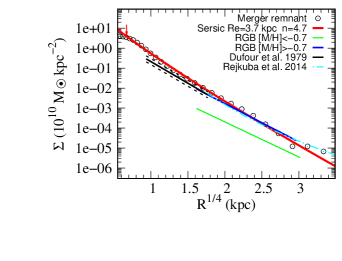
Fig.5 shows the surface mass density distribution of the Model-6 remnant, including its fit with a Sérsic profile. The Sérsic index is 4.7, which is consistent with the observed de Vaucouleur’s profile (). For comparison we plot in Fig.5 the Dufour et al. (1979) band profile converted to stellar mass surface density. To convert the surface brightness to a stellar mass surface density, we have used the color vs. stellar mass to light ratio relation (Bell et al., 2003). A color of 0.84 is adopted from Dufour et al. (1979), and from Bell & de Jong (2001).
The surface brightness distributions of RGB stars have been re-scaled to that of Dufour et al. (1979). In this figure we also compare the simulation with the surface brightness profile of RGB stars from Bird et al. (2015). In cyan we show the power law fit to RGB stars surface distribution from Rejkuba et al. (2014) rescaled to surface mass density as above. The excess of light in the outermost bins of the simulated mass surface density is well matched with this power law. The slope of the surface brightness and the stellar surface number counts can be robustly used for comparison to the model, because we are confident that the total stellar mass used in the models is well consistent with observations (see section 4.3). The observed surface brightness profiles from integrated light and RGB star counts are consistent with profiles of the four merger remnants examined here, for which the Sérsic index range from 4.4 to 6.2, i.e. slightly larger than observations. Indeed the profile from Dufour et al. (1979) is slightly shallower (Fig.5). This could be either due to IMF variations (see black dashed lines showing a 0.15 dex systematic offset) or due to an increasing extinction in the central region.
The half light radius of Cen A is changing with wavelength. Dufour et al. (1979) estimated it in band to be 305 (5.6 kpc) with a de Vaucouleurs profile. The half mass radius for the four models are ranging from 3.7 to 6.3 kpc as shown in Table 1.
4.5 Star formation during the major merger
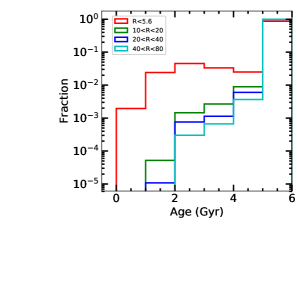
In Fig.6 the age distribution of stars at different radii is shown. However, since the simulation is started 6 Gyr ago, the peak at 6 Gyr is artificial and indeed represents stars with ages larger or equal to 6 Gyr. This could have been corrected by re-sampling the age of these stars according to the observational constraints, though such considerations are out of the scope of this paper.
Rejkuba et al. (2011) found that the halo contains of stars that have been formed Gyr ago in a field located 40 kpc south of the galaxy center, which is also consistent with the age distribution of global clusters (Woodley et al., 2007, 2010b). The latter studies found many young GCs in the halo, with youngest ages around 2 Gyr, which confirms our choice of a recent fusion epoch. The above results are consistently reproduced by our modeling (see Fig.6) after considering radii ranging from 10 to 80 kpc. A larger fraction of recent star formation is expected in the central regions (within the half mass radius, R kpc) after a major merger, during which interaction between progenitors and then fusion have enhanced gas compression and favoured its transformation into stars.
4.6 Metallicity distribution and radial metallicity gradient
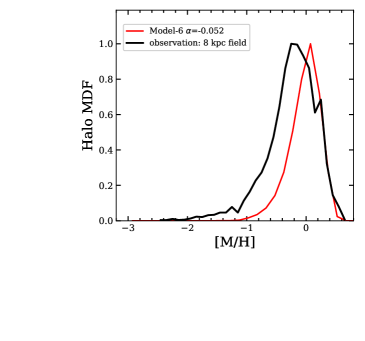
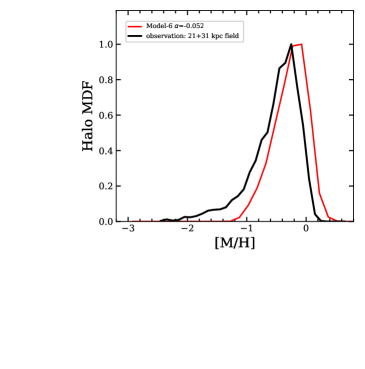
Thanks to the proximity of Cen A, its metallicity content can be measured from resolved stars. Metallicity distribution functions (MDFs) of halo stars in Cen A have been determined from the HST photometry (Harris, Harris & Poole, 1999; Harris & Harris, 2000, 2002) in three fields at projected distances of 8, 21, and 31 kpc from the galaxy center. They can be used to constrain the merger history of Cen A. Following Bekki, Harris & Harris (2003) we have compared the MDF of Model-6 with observed MDFs. For the inner halo region field (8 kpc), we have selected stars with projected distance to the center between 7 and 9 kpc. For comparison to the two outer halo fields (21 and 31 kpc), we have selected stars in the models with projected distance between 20 to 30 kpc. For the initial metallicity distribution in the progenitors we have assumed:
The initial metallicity gradient for the progenitors is -0.052 dex kpc-1, which is from the results of MW open cluster from APOGEE and GALAH and consistent with the literature value ranged from -0.035 to -0.1 dex kpc-1 (Carrera et al., 2019; Friel, 1995) The central metallicity value is set to +0.5, which is very close to the maximum metallicity of MW bulge (Sarajedini & Jablonka, 2005; Zoccali et al., 2017). This value is slightly lower than the maximum metallicity of M31 bulge, which is around +0.9 (see Fig. 6 of Sarajedini & Jablonka 2005).
Fig.7 compares the MDF for the inner halo field (8 kpc), and for the outer halo (21 and 31 fields). As pointed out by Rejkuba et al. (2014) the metallicity calibration in Harris, Harris & Poole (1999); Harris & Harris (2000, 2002) has an offset of 0.2 dex with respect to that in Rejkuba et al. (2014) due to use of different stellar evolutionary models. Also there is a relatively large incompleteness correction at the high metallicity end. Therefore, we have artificially shifted the black line (obeserved MDFs) in Fig.7 by +0.2 dex. The median of observed MDFs are still lower than the model for both inner field and out field. These may reflect the incompleteness in photometry for the most metal-rich, reddest and faintest stars.
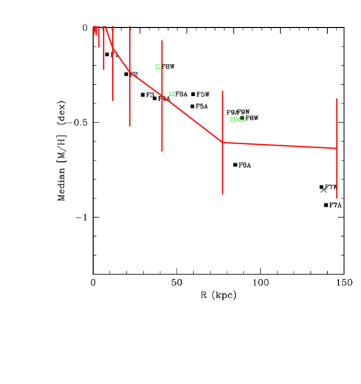
In Fig.8 we compare the observed metallicity distribution along the radial direction with that from our model. Within 100 kpc, the model will fit the observation data. At 150 kpc the metallicity is about 0.2 dex higher than that from observation, which may need more observation at that scale to overcome the variance from field to field.
4.7 Ongoing star formation in the disk
There is still residual gas and star formation in the very centre of Cen A as visible in Fig.1 both from observations (gas fraction of %) and modeling (3.2 to 8.8% from Table 1). This is linked to the central warped HI disk. Both young stars, Wolf-Rayet stars and red supergiants, as well as HII regions have been detected around the dusty disk (Graham, 1979; Moellenhoff, 1979; Minniti et al., 2004; Kainulainen et al., 2009). The star forming warped disk is also well traced by the IRAC map at m (Quillen et al., 2006, 2008), which is well known to trace the star formation (Wu et al., 2005). Furthermore, there is a reservoir of molecular gas fueling low level star formation (Eckart et al., 1990; Espada et al., 2019). Possible discrepancy in gas fraction between observations and simulations could be solved by implementing a less efficient feedback in the modeling to better exhaust the HI gas.
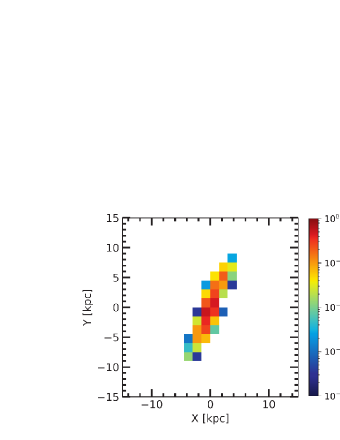
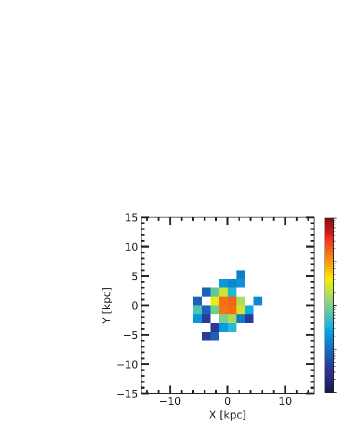
Figure 9 shows the map of star formation rate (SFR) for Model-11 (top) and Model-6 (bottom) simulations. The ongoing star formation confined to the disk is fueled by the remaining gas that has sunk to the center after the merger ended Gyr ago. The total SFR estimated for Model-6, -11, -7, and Model-10 are 0.85, 3.5, 1.3, and 0.6 M⊙ yr-1, respectively. A recent study by Espada et al. (2019) using ALMA CO (1–0) observations produced high angular resolution () maps towards the dust lane of Cen A. They found a total molecular gas mass of M⊙, which is higher than previously measured, and derived a star formation rate of M⊙ yr-1. This is remarkably similar to the values we estimate from our simulations. The ALMA map has a much higher resolution and shows a more structured distribution of SFR surface density than can be inferred from the present simulations. It presents a peak in the central circumnuclear disk, which is reminiscent of what we see in Model-6, albeit on a much smaller spatial scale.
5 DISCUSSION AND CONCLUSION
We presented the first hydrodynamical simulations tailored to model the nearest gE Cen A, assuming a major merger with a mass ratio up to 1.5. From our modeling, the merger event happened Gyrs ago with the first passage at Gyr ago and the fusion of the two progenitors completing 2 Gyr ago. The age distribution of the stars brought in by the progenitors and formed during the merger event is consistent with the stellar age distribution in the halo (Rejkuba et al., 2011). With low gas fractions (20%-40%) in the progenitors and a small mass ratio (1.5), the merger remnant stellar mass distribution follows a de Vaucouleurs profile, consistent with observations (Dufour et al., 1979).
In the current model the halo region is dominated by stars coming from the progenitors of the major merger. The two progenitors have been assumed to be massive spirals, so it is expected that relatively metal-rich stars spread throughout the halo region. This may explain the observations showing the relatively high average metallicity of halo stars (Harris & Harris, 2000, 2002; Rejkuba et al., 2005) and the shallow metallicity gradient (Rejkuba et al., 2014).
Malin (1978) and Malin, Quinn & Graham (1983) reported the discovery of many faint narrow stellar shells surrounding Cen A. Additional shells in the inner parts of the galaxy were uncovered by Peng et al. (2002), who applied the unsharp masking technique to CCD images of Cen A. Such faint shells and filaments were found to be quite common features of many nearby early-type galaxies (Malin & Carter, 1980). There are two principal scenarios in the literature explaining the shell formation. One assumes accretion of a smaller (spiral) galaxy onto an elliptical. Quinn (1984) showed that shells can be formed by the ”phase-wrapping” of dynamically cold material with accreted companion on radial orbit. The shells can also be created by ”spatial wrapping” of debris from thin disk (Hernquist & Quinn, 1988; Dupraz & Combes, 1986). The second scenario proposed by Hernquist & Spergel (1992) assumes a major merger of two equal mass spirals that results in an elliptical with shells. This scenario solves many difficulties with the shell formation in the minor merger model. In a recent study of the incidence and formation processes of shell galaxies based on the Illustris hydrodynamic cosmological simulation Pop et al. (2018) reported that shell galaxies observed at z=0 preferentially formed through mergers with relatively major merger ( in stellar mass ratio). Our current work where shells are result of a major merger is consistent with the latter scenario, and also in agreement with recent simulations by Bekki, Harris & Harris (2003) and Bekki & Peng (2006).
Our modeling has some limitations and does not provide a detailed description of all the observed Cen A properties. For example, the simulated residuals that mostly lie along the main galaxy axis occupy a larger area than that found in observations, and not all the geometrical angles are reproduced together. Some improvements are expected either from observations, e.g., a more accurate determination of stream distances, or from modeling, e.g., by fine-tuning parameters and also by considering different baryonic fractions.
However, the success in modeling Cen A’s properties indicates that there are still giant elliptical galaxies that are formed through major mergers in the last few Gyr. The role of major and minor mergers in the mass assembly of massive spiral and elliptical galaxies had been vastly discussed during the last decades. Due to their lower impact and their longer duration (Jiang et al., 2008), minor mergers are considerably less efficient to activate a starburst, and to distort morphologies and kinematics, or they do it in a somewhat sporadic way (Hopkins et al., 2008). On the other hand, the argument can be counter balanced if dwarf galaxies are as numerous as predicted by cosmological models. Observations of moderately distant galaxies (= 0.65), have revealed that 6 Gyr ago, mass ratio 5 mergers were quite common (Hammer et al., 2005; Hopkins et al., 2008; Hammer et al., 2009) and similar to expectations from (Puech et al., 2012).
The above could make both M31 and Cen A exceptional since they have experienced a much more recent major merger, about 2 Gyr ago. This also implies a quite efficient mass assembly through mergers in the Local Universe, an evidence that could be further supported if M81 is likely to experience soon a merger with M82 (Smercina et al., 2019).
Perhaps even more intriguingly, Müller et al. (2018, 2019) showed that dwarf galaxy satellites surrounding Cen A are corotating within a gigantic thin plane that has a measured rms height of 133 kpc and a semi major axis length of 327 kpc. Woodley (2006) compared the kinematics from Cen A GCs with over 60 satellite members of Cen A and nearby M83, finding similarities in rotation amplitude, rotation axis, and velocity dispersion between the halo of Cen A and the Centaurus group as a whole. The plane of satellites reported in Müller et al. (2018) is aligned with the galaxy major axis and satellites on the north-east side of Cen A are approaching, while those on the south-west side are receding, indicating a coherent rotation in the same direction as PNe (see Fig. 1 in Müller et al., 2018). M31 shares a similar alignment of the gigantic plane with the Giant Stream (Hammer et al., 2013, 2018), and both planes are aligned with the line of sight. Such gigantic plane structures are not well understood in cosmology (Pawlowski et al., 2014), which calls for further observational and simulation studies of Cen A and of its dSph satellites.
Acknowledgments
The authors thank the referee for helpful suggestions. The computing task was carried out on the HPC cluster at China National Astronomical Data Center (NADC). NADC is a National Science and Technology Innovation Base hosted at National Astronomical Observatories, Chinese Academy of Sciences. This work has been supported by the China-France International Associated Laboratory ’Origins’. Research by DC is supported by NSF grant AST-1814208.
Data availability: The data underlying this article will be shared on reasonable request to the corresponding author.
References
- Arnold et al. (2011) Arnold J. A., Romanowsky A. J., Brodie J. P., Chomiuk L., Spitler L. R., Strader J., Benson A. J., Forbes D. A., 2011, ApJL, 736, L26
- Baade & Minkowski (1954) Baade W., Minkowski R., 1954, ApJ, 119, 215
- Baumschlager et al. (2019) Baumschlager B., Hensler G., Steyrleithner P., Recchi S., 2019, MNRAS, 483, 5315
- Beasley et al. (2008) Beasley M. A., Bridges T., Peng E., Harris W. E., Harris G. L. H., Forbes D. A., Mackie G., 2008, MNRAS, 386, 1443
- Beasley et al. (2003) Beasley M. A., Harris W. E., Harris G. L. H., Forbes D. A., 2003, MNRAS, 340, 341
- Bekki, Harris & Harris (2003) Bekki K., Harris W. E., Harris G. L. H., 2003, MNRAS, 338, 587
- Bekki & Peng (2006) Bekki K., Peng E. W., 2006, MNRAS, 370, 1737
- Bell & de Jong (2001) Bell E. F., de Jong R. S., 2001, ApJ, 550, 212
- Bell et al. (2003) Bell E. F., McIntosh D. H., Katz N., Weinberg M. D., 2003, ApJS, 149, 289
- Bird et al. (2015) Bird S. A., Flynn C., Harris W. E., Valtonen M., 2015, A&A, 575, A72
- Carrera et al. (2019) Carrera R. et al., 2019, A&A, 623, A80
- Charmandaris, Combes & van der Hulst (2000) Charmandaris V., Combes F., van der Hulst J. M., 2000, A&A, 356, L1
- Cox et al. (2006) Cox T. J., Jonsson P., Primack J. R., Somerville R. S., 2006, MNRAS, 373, 1013
- Crnojević et al. (2013) Crnojević D., Ferguson A. M. N., Irwin M. J., Bernard E. J., Arimoto N., Jablonka P., Kobayashi C., 2013, MNRAS, 432, 832
- Crnojević et al. (2019) Crnojević D. et al., 2019, ApJ, 872, 80
- Crnojević et al. (2016) Crnojević D. et al., 2016, ApJ, 823, 19
- Daddi et al. (2005) Daddi E. et al., 2005, ApJ, 626, 680
- Dufour et al. (1979) Dufour R. J., van den Bergh S., Harvel C. A., Martins D. H., Schiffer, F. H. I., Talbot, R. J. J., Talent D. L., Wells D. C., 1979, AJ, 84, 284
- Dupraz & Combes (1986) Dupraz C., Combes F., 1986, A&A, 166, 53
- Ebneter & Balick (1983) Ebneter K., Balick B., 1983, PASP, 95, 675
- Eckart et al. (1990) Eckart A., Cameron M., Genzel R., Jackson J. M., Rothermel H., Stutzki J., Rydbeck G., Wiklind T., 1990, ApJ, 365, 522
- Espada et al. (2019) Espada D. et al., 2019, ApJ, 887, 88
- Fall & Romanowsky (2018) Fall S. M., Romanowsky A. J., 2018, ApJ, 868, 133
- Fouquet et al. (2012) Fouquet S., Hammer F., Yang Y., Puech M., Flores H., 2012, MNRAS, 427, 1769
- Friel (1995) Friel E. D., 1995, ARA&A, 33, 381
- Graham (1979) Graham J. A., 1979, ApJ, 232, 60
- Graham (1998) Graham J. A., 1998, ApJ, 502, 245
- Hammer et al. (2005) Hammer F., Flores H., Elbaz D., Zheng X. Z., Liang Y. C., Cesarsky C., 2005, A&A, 430, 115
- Hammer et al. (2009) Hammer F., Flores H., Puech M., Yang Y. B., Athanassoula E., Rodrigues M., Delgado R., 2009, A&A, 507, 1313
- Hammer et al. (2013) Hammer F., Yang Y., Fouquet S., Pawlowski M. S., Kroupa P., Puech M., Flores H., Wang J., 2013, MNRAS, 431, 3543
- Hammer et al. (2018) Hammer F., Yang Y. B., Wang J. L., Ibata R., Flores H., Puech M., 2018, MNRAS, 475, 2754
- Hammer et al. (2010) Hammer F., Yang Y. B., Wang J. L., Puech M., Flores H., Fouquet S., 2010, ApJ, 725, 542
- Harris (2010) Harris G. L. H., 2010, PASA, 27, 475
- Harris & Harris (2000) Harris G. L. H., Harris W. E., 2000, AJ, 120, 2423
- Harris, Harris & Poole (1999) Harris G. L. H., Harris W. E., Poole G. B., 1999, AJ, 117, 855
- Harris, Rejkuba & Harris (2010) Harris G. L. H., Rejkuba M., Harris W. E., 2010, PASA, 27, 457
- Harris & Harris (2002) Harris W. E., Harris G. L. H., 2002, AJ, 123, 3108
- Hernquist & Quinn (1988) Hernquist L., Quinn P. J., 1988, ApJ, 331, 682
- Hernquist & Spergel (1992) Hernquist L., Spergel D. N., 1992, ApJL, 399, L117
- Hopkins (2015) Hopkins P. F., 2015, MNRAS, 450, 53
- Hopkins et al. (2010) Hopkins P. F. et al., 2010, ApJ, 715, 202
- Hopkins et al. (2009) Hopkins P. F., Cox T. J., Younger J. D., Hernquist L., 2009, ApJ, 691, 1168
- Hopkins et al. (2008) Hopkins P. F., Hernquist L., Cox T. J., Younger J. D., Besla G., 2008, ApJ, 688, 757
- Hubble (1936) Hubble E. P., 1936, Realm of the Nebulae
- Hui et al. (1995) Hui X., Ford H. C., Freeman K. C., Dopita M. A., 1995, ApJ, 449, 592
- Ibata et al. (2007) Ibata R., Martin N. F., Irwin M., Chapman S., Ferguson A. M. N., Lewis G. F., McConnachie A. W., 2007, ApJ, 671, 1591
- Ibata et al. (2013) Ibata R. A. et al., 2013, Nature, 493, 62
- Iodice et al. (2017) Iodice E. et al., 2017, ApJ, 839, 21
- Israel (1998) Israel F. P., 1998, A&ARv, 8, 237
- Jiang et al. (2008) Jiang C. Y., Jing Y. P., Faltenbacher A., Lin W. P., Li C., 2008, ApJ, 675, 1095
- Kainulainen et al. (2009) Kainulainen J. T. et al., 2009, A&A, 502, L5
- Karachentsev et al. (2007) Karachentsev I. D. et al., 2007, AJ, 133, 504
- Katz, Weinberg & Hernquist (1996) Katz N., Weinberg D. H., Hernquist L., 1996, ApJS, 105, 19
- Kaviraj et al. (2005) Kaviraj S., Ferreras I., Yoon S. J., Yi S. K., 2005, A&A, 439, 913
- Kraft et al. (2003) Kraft R. P., Vázquez S. E., Forman W. R., Jones C., Murray S. S., Hardcastle M. J., Worrall D. M., Churazov E., 2003, ApJ, 592, 129
- Kroupa, Pawlowski & Milgrom (2012) Kroupa P., Pawlowski M., Milgrom M., 2012, International Journal of Modern Physics D, 21, 1230003
- Malin (1978) Malin D. F., 1978, Nature, 276, 591
- Malin & Carter (1980) Malin D. F., Carter D., 1980, Nature, 285, 643
- Malin, Quinn & Graham (1983) Malin D. F., Quinn P. J., Graham J. A., 1983, ApJL, 272, L5
- Mathieu, Dejonghe & Hui (1996) Mathieu A., Dejonghe H., Hui X., 1996, A&A, 309, 30
- Metz & Kroupa (2007) Metz M., Kroupa P., 2007, MNRAS, 376, 387
- Minniti et al. (2004) Minniti D., Rejkuba M., Funes J. G., Kennicutt, Robert C. J., 2004, ApJ, 612, 215
- Mirabel et al. (1999) Mirabel I. F. et al., 1999, A&A, 341, 667
- Moellenhoff (1979) Moellenhoff C., 1979, A&A, 77, 141
- Morganti (2010) Morganti R., 2010, PASA, 27, 463
- Mould et al. (2000) Mould J. R. et al., 2000, ApJ, 536, 266
- Müller et al. (2018) Müller O., Pawlowski M. S., Jerjen H., Lelli F., 2018, Science, 359, 534
- Müller et al. (2019) Müller O., Rejkuba M., Pawlowski M. S., Ibata R., Lelli F., Hilker M., Jerjen H., 2019, A&A, 629, A18
- Naab & Ostriker (2017) Naab T., Ostriker J. P., 2017, ARA&A, 55, 59
- Neff, Eilek & Owen (2015) Neff S. G., Eilek J. A., Owen F. N., 2015, ApJ, 802, 88
- Oosterloo & Morganti (2005) Oosterloo T. A., Morganti R., 2005, A&A, 429, 469
- Oser et al. (2010) Oser L., Ostriker J. P., Naab T., Johansson P. H., Burkert A., 2010, ApJ, 725, 2312
- Parkin et al. (2012) Parkin T. J. et al., 2012, MNRAS, 422, 2291
- Pawlowski et al. (2014) Pawlowski M. S. et al., 2014, MNRAS, 442, 2362
- Peng, Ford & Freeman (2004a) Peng E. W., Ford H. C., Freeman K. C., 2004a, ApJ, 602, 705
- Peng, Ford & Freeman (2004b) Peng E. W., Ford H. C., Freeman K. C., 2004b, ApJ, 602, 685
- Peng et al. (2002) Peng E. W., Ford H. C., Freeman K. C., White R. L., 2002, AJ, 124, 3144
- Ploeckinger et al. (2015) Ploeckinger S., Recchi S., Hensler G., Kroupa P., 2015, MNRAS, 447, 2512
- Pop et al. (2018) Pop A.-R., Pillepich A., Amorisco N. C., Hernquist L., 2018, MNRAS, 480, 1715
- Puech et al. (2012) Puech M., Hammer F., Hopkins P. F., Athanassoula E., Flores H., Rodrigues M., Wang J. L., Yang Y. B., 2012, ApJ, 753, 128
- Pulsoni et al. (2020) Pulsoni C., Gerhard O., Arnaboldi M., Pillepich A., Nelson D., Hernquist L., Springel V., 2020, arXiv e-prints, arXiv:2004.13042
- Quillen et al. (2008) Quillen A. C. et al., 2008, MNRAS, 384, 1469
- Quillen et al. (2006) Quillen A. C., Brookes M. H., Keene J., Stern D., Lawrence C. R., Werner M. W., 2006, ApJ, 645, 1092
- Quillen et al. (1992) Quillen A. C., de Zeeuw P. T., Phinney E. S., Phillips T. G., 1992, ApJ, 391, 121
- Quillen, Graham & Frogel (1993) Quillen A. C., Graham J. R., Frogel J. A., 1993, ApJ, 412, 550
- Quillen et al. (2010) Quillen A. C., Neumayer N., Oosterloo T., Espada D., 2010, PASA, 27, 396
- Quinn (1984) Quinn P. J., 1984, ApJ, 279, 596
- Rejkuba et al. (2005) Rejkuba M., Greggio L., Harris W. E., Harris G. L. H., Peng E. W., 2005, ApJ, 631, 262
- Rejkuba et al. (2011) Rejkuba M., Harris W. E., Greggio L., Harris G. L. H., 2011, A&A, 526, A123
- Rejkuba et al. (2014) Rejkuba M., Harris W. E., Greggio L., Harris G. L. H., Jerjen H., Gonzalez O. A., 2014, ApJL, 791, L2
- Rejkuba et al. (2002) Rejkuba M., Minniti D., Courbin F., Silva D. R., 2002, ApJ, 564, 688
- Rejkuba et al. (2001) Rejkuba M., Minniti D., Silva D. R., Bedding T. R., 2001, A&A, 379, 781
- Romanowsky & Fall (2012) Romanowsky A. J., Fall S. M., 2012, ApJS, 203, 17
- Salomé et al. (2016a) Salomé Q., Salomé P., Combes F., Hamer S., 2016a, A&A, 595, A65
- Salomé et al. (2016b) Salomé Q., Salomé P., Combes F., Hamer S., Heywood I., 2016b, A&A, 586, A45
- Samurovic (2006) Samurovic S., 2006, Serbian Astronomical Journal, 173, 35
- Santoro et al. (2016) Santoro F., Oonk J. B. R., Morganti R., Oosterloo T. A., Tadhunter C., 2016, A&A, 590, A37
- Sarajedini & Jablonka (2005) Sarajedini A., Jablonka P., 2005, AJ, 130, 1627
- Sauvaget et al. (2018) Sauvaget T., Hammer F., Puech M., Yang Y. B., Flores H., Rodrigues M., 2018, MNRAS, 473, 2521
- Schiminovich et al. (1994) Schiminovich D., van Gorkom J. H., van der Hulst J. M., Kasow S., 1994, ApJL, 423, L101
- Sersic (1958) Sersic J. L., 1958, The Observatory, 78, 24
- Skrutskie et al. (2006) Skrutskie M. F. et al., 2006, AJ, 131, 1163
- Smercina et al. (2019) Smercina A. et al., 2019, arXiv e-prints, arXiv:1910.14672
- Struve et al. (2010) Struve C., Oosterloo T. A., Morganti R., Saripalli L., 2010, A&A, 515, A67
- Taylor et al. (2017) Taylor M. A., Puzia T. H., Muñoz R. P., Mieske S., Lançon A., Zhang H., Eigenthaler P., Bovill M. S., 2017, MNRAS, 469, 3444
- Tingay et al. (1998) Tingay S. J. et al., 1998, AJ, 115, 960
- Toomre & Toomre (1972) Toomre A., Toomre J., 1972, ApJ, 178, 623
- van den Bergh (1976) van den Bergh S., 1976, ApJ, 208, 673
- van der Kruit (2007) van der Kruit P. C., 2007, A&A, 466, 883
- van Gorkom et al. (1990) van Gorkom J. H., van der Hulst J. M., Haschick A. D., Tubbs A. D., 1990, AJ, 99, 1781
- Voggel et al. (2020) Voggel K. T., Seth A. C., Sand D. J., Hughes A., Strader J., Crnojevic D., Caldwell N., 2020, arXiv e-prints, arXiv:2001.02243
- Walsh, Rejkuba & Walton (2015) Walsh J. R., Rejkuba M., Walton N. A., 2015, A&A, 574, A109
- Wang et al. (2012) Wang J., Hammer F., Athanassoula E., Puech M., Yang Y., Flores H., 2012, A&A, 538, A121
- Wang et al. (2015) Wang J., Hammer F., Puech M., Yang Y., Flores H., 2015, MNRAS, 452, 3551
- Wang et al. (2019) Wang J., Hammer F., Yang Y., Ripepi V., Cioni M.-R. L., Puech M., Flores H., 2019, MNRAS, 486, 5907
- Wild & Eckart (2000) Wild W., Eckart A., 2000, A&A, 359, 483
- Wilkinson et al. (1986) Wilkinson A., Sharples R. M., Fosbury R. A. E., Wallace P. T., 1986, MNRAS, 218, 297
- Woodley (2006) Woodley K. A., 2006, AJ, 132, 2424
- Woodley et al. (2010a) Woodley K. A., Gómez M., Harris W. E., Geisler D., Harris G. L. H., 2010a, AJ, 139, 1871
- Woodley et al. (2007) Woodley K. A., Harris W. E., Beasley M. A., Peng E. W., Bridges T. J., Forbes D. A., Harris G. L. H., 2007, AJ, 134, 494
- Woodley et al. (2010b) Woodley K. A., Harris W. E., Puzia T. H., Gómez M., Harris G. L. H., Geisler D., 2010b, ApJ, 708, 1335
- Wu et al. (2005) Wu H., Cao C., Hao C.-N., Liu F.-S., Wang J.-L., Xia X.-Y., Deng Z.-G., Young C. K.-S., 2005, ApJL, 632, L79
- Yang et al. (2014) Yang Y., Hammer F., Fouquet S., Flores H., Puech M., Pawlowski M. S., Kroupa P., 2014, MNRAS, 442, 2419
- Zoccali et al. (2017) Zoccali M. et al., 2017, A&A, 599, A12