3D modeling from the onset of the SN to the full-fledged SNR
Abstract
Context. The manifold phases in the evolution of a core-collapse (CC) supernova (SN) play an important role in determining the physical properties and morphology of the resulting supernova remnant (SNR). Thus, the complex morphology of SNRs is expected to reflect possible asymmetries and structures developed during and soon after the SN explosion.
Aims. The aim of this work is to bridge the gap between CC SNe and their remnants by investigating how post-explosion anisotropies in the ejecta influence the structure and chemical properties of the remnant at later times.
Methods. We performed three-dimensional magneto-hydrodynamical simulations starting soon after the SN event and following the evolution of the system in the circumstellar medium (CSM) (consisting of the wind of the stellar progenitor), for 5000 years, obtaining the physical scenario of a SNR. Here we focused the analysis on the case of a progenitor red supergiant of M⊙. We also investigated how a post-explosion large-scale anisotropy in the SN affects the ejecta distribution and the matter mixing of heavy elements in the remnant, during the first 5000 years of evolution.
Results. In the case of a spherically symmetric SN explosion without large-scale anisotropies, the remnant roughly keeps memory of the original onion-like layering of ejecta soon after the SN event. Nevertheless, as the reverse shock hits the ejecta, the element distribution departs from a homologous expansion, because of the slowing down of the outermost ejecta layers due to interaction with the reverse shock. In the case of a large-scale anisotropy developed after the SN, we found that the chemical stratification in the ejecta can be strongly modified and the original onion-like layering is not preserved. The anisotropy may cause spatial inversion of ejecta layers, for instance leading to Fe/Si-rich ejecta outside the O shell, and may determine the formation of Fe/Si-rich jet-like features that may protrude the remnant outline. The level of matter mixing and the properties of the jet-like feature are sensitive to the initial physical (density and velocity) and geometrical (size and position) initial characteristics of the anisotropy.
Key Words.:
magnetohydrodynamics (MHD) – instabilities – shock waves – ISM: supernova remnants1 Introduction
Core-collapse (CC) supernovae (SNe), the final fate of massive stars, are known to play a major role in the dynamical and chemical evolution of galaxies (by injecting mass and energy) and in driving the chemical enrichment of the diffuse gas. Nevertheless, many aspects of the processes governing the SN engine and the final stages in the evolution of their progenitor stars are not fully understood. Severe limitations in these studies are the rarity of SN events in our galaxy (on average about one every 50 years; Diehl et al. 2006), the large distances of extragalactic SNe which make them unresolved point-like sources, and their unpredictability and transient nature. These issues make extremely challenging to extract, from observations of SNe, key information on the progenitor stars and on the explosion processes associated with SNe.
Otherwise, nearby supernova remnants (SNRs), i.e. what is left over of SN explosions, are extended sources for which the structure and chemical composition of the stellar debris ejected in the SN outburst (i.e. the ejecta) can be studied in detail. More specifically, young and nearby SNRs encode valuable information in their expanding debris and evolution, that can reveal details about the inherent asymmetries of the explosion itself and the products of nucleosynthesis occurred during the explosion. Moreover, SNRs probe the circumstellar medium (CSM) surrounding the SNe, which can be shaped by the progenitor stars through their powerful stellar winds. However, with increasing age, all these pieces of information, which are useful for establishing a SN-SNR connection, are diluted by the remnant’s increasing interaction with the surrounding environment. Thus young and nearby remnants are the most likely candidates to investigate the intimate link that exists between the morphological properties of a SNR and the complex phases in the SN explosion, although in the Milky Way less than a dozen SNRs are 1000 years old (Ferrand & Safi-Harb, 2012; Green, 2014).
Hydrodynamic/magnetohydrodynamic (HD/MHD) models can be powerful tools to bridge the gap between CC-SNe and their remnants. However, up to recent years, the key strategy was to describe either the SN evolution or the expansion of the remnant due to the very different time and space scales involved in these two phases of evolution and the inherent three-dimensional (3D) nature of the phenomenon. As a result, SN models described the early SN evolution, leaving out an accurate description of its subsequent interaction with the ambient environment; SNR models described only the expansion of the remnant and its interaction with the ambient medium, leaving out a self-consistent and accurate description of the distribution of mass and energy of the ejecta soon after the SN explosion. Only recently, seminal studies (Patnaude et al. 2015; Utrobin et al. 2015; Orlando et al. 2015, 2016; Wongwathanarat et al. 2017; Orlando et al. 2019; Ferrand et al. 2019; Orlando et al. 2020) have described the whole evolution from the SN to the SNR and have shown that HD/MHD models can be very effective in studying the SN-SNR connection. Thus these studies bring together two distinct physical scenarios (SN and SNR) on the logical and temporal level, creating continuity between the two.
Up to date, the mixing of chemically homogeneous layers of ejecta after the SN event has been investigated in detail only in the aftermath of SN explosions (e.g. Kifonidis et al. 2006; Joggerst et al. 2009, 2010), not considering the transition from the phase of SN to that of SNR. Very recently, Ono et al. (2020) studied the matter mixing in aspherical CC-SNe through accurate three-dimensional simulations with the aim to link the ejecta structure soon after the shock breakout at the stellar surface (i.e. when the shock produced by the explosion leaves the stellar surface) with the nature of the progenitor star.
Here, we aim at analyzing how matter mixing occurs at later times during the remnant expansion and interaction with the CSM to investigate how the various chemically homogeneous layers at the time of the explosion map into the resulting abundance pattern of the SNR, and how large-scale anisotropies typically observed in CC-SNe (possibly originated by instabilities developed during the CC; e.g. Nagataki et al. 1997, 1998; Nagataki 2000; Kifonidis et al. 2006; Takiwaki et al. 2009; Gawryszczak et al. 2010; Wongwathanarat et al. 2017; Bear & Soker 2018) affect the evolution of these layers. To this end, we developed a 3D MHD model describing the evolution of the remnant from the onset of the SN to the development of its remnant at the age of 5000 years, focusing on the case of a progenitor red supergiant (RSG). We analyzed the effects of large-scale anisotropies that may develop soon after the SN on the final remnant morphology. These anisotropies may be responsible for the knotty and clumpy ejecta structure observed at different wavelengths in many CC SNRs (e.g. the Vela SNR, Aschenbach et al. 1995; Miceli et al. 2008; García et al. 2017; G292.0+1.8, Park et al. 2004; Puppis A, Katsuda et al. 2008; and Cassiopeia A, Fesen et al. 2006; Milisavljevic & Fesen 2013; N132D, Law et al. 2020) which is commonly interpreted as a product of HD instabilities developed during the complex phases of the SN explosion (Gawryszczak et al., 2010). However, it is still unclear the role of these anisotropies in the evolution of the chemical stratification of the remnant.
2 The numerical setup
The model describes the evolution of a SNR from soon after the CC of the progenitor star to the full-fledged remnant at the age of 5000 years, following the expansion of the remnant through its pre-SN environment. As in Orlando et al. (2016), the initial distribution of ejecta is derived from a 1D SN model which describes the SN evolution from the CC to the shock breakout at the stellar surface, covering about 24 hours of evolution. The output of the SN simulation provided the initial radial profile of the ejecta distribution, including their chemical composition. Then we mapped this output into the 3D domain and started the 3D SNR simulations.
2.1 The initial conditions
As initial conditions for our 3D SNR simulations we adopted one of the SN simulations presented in Ono et al. (2020). These authors performed both 1D and 3D HD simulations of SN explosions with the aim of investigating the matter mixing during the expansion of the blast wave through the stellar interior. Their 1D simulations assume spherical symmetry, whereas the 3D simulations consider aspherical explosions, triggered by an initial asymmetric injection of kinetic and thermal energy around the composition interface of the iron core and silicon-rich layer. The simulations were initialized by considering different pre-SN stellar models, including progenitor blue and red supergiants, and were performed with the adaptive-mesh refinement HD/MHD code FLASH (Fryxell et al., 2000).
The SN model takes into account the effects of gravity (both self-gravity and gravitational effects of the central proto-neutron star), the fallback of material on the central compact object, the explosive nucleosynthesis through a nuclear reaction network including 19 species (n, p, 1H, 3He, 4He, 12C, 14N, 16O, 20Ne, 24Mg, 28Si, 32S, 36Ar, 40Ca, 44Ti, 48Cr, 52Fe, 54Fe and 56Ni), the feedback of nuclear energy generation, and the energy deposition due to radioactive decays of isotopes synthesized in the explosion (see Ono et al. 2020 for more details). For our purposes, we considered the case of a 1D SN simulation from a non-rotating, solar metallicity progenitor RSG with a main sequence mass 19.8 M⊙ which reduces to 15.9 M⊙ at collapse (Sukhbold et al., 2016), and with injected energy erg (see Sect. 3.1 in Ono et al. 2020).
In our SNR simulations we are not aiming at describing in detail the effects of matter mixing before the shock breakout (indeed carefully modelled and analyzed through the 3D SN simulations by Ono et al. 2020). The motivation of this work is to highlight the contribution to matter mixing during the expansion of the blast wave through the CSM and to investigate the stability of the 1D onion shell structure of the progenitor star during the evolution of the SNR. To this end, we explored the case of a spherically symmetric SN explosion and the case of a SN characterized by a large-scale anisotropy. In this latter case, once the output of the 1D SN simulation is mapped into the 3D domain, we parametrized the initial large-scale anisotropy of ejecta that may have been developed soon after the SN explosion. The aim was to investigate how the matter mixing and the final remnant morphology depend on the physical (density and velocity) and geometric (position and size) properties of the initial anisotropy.
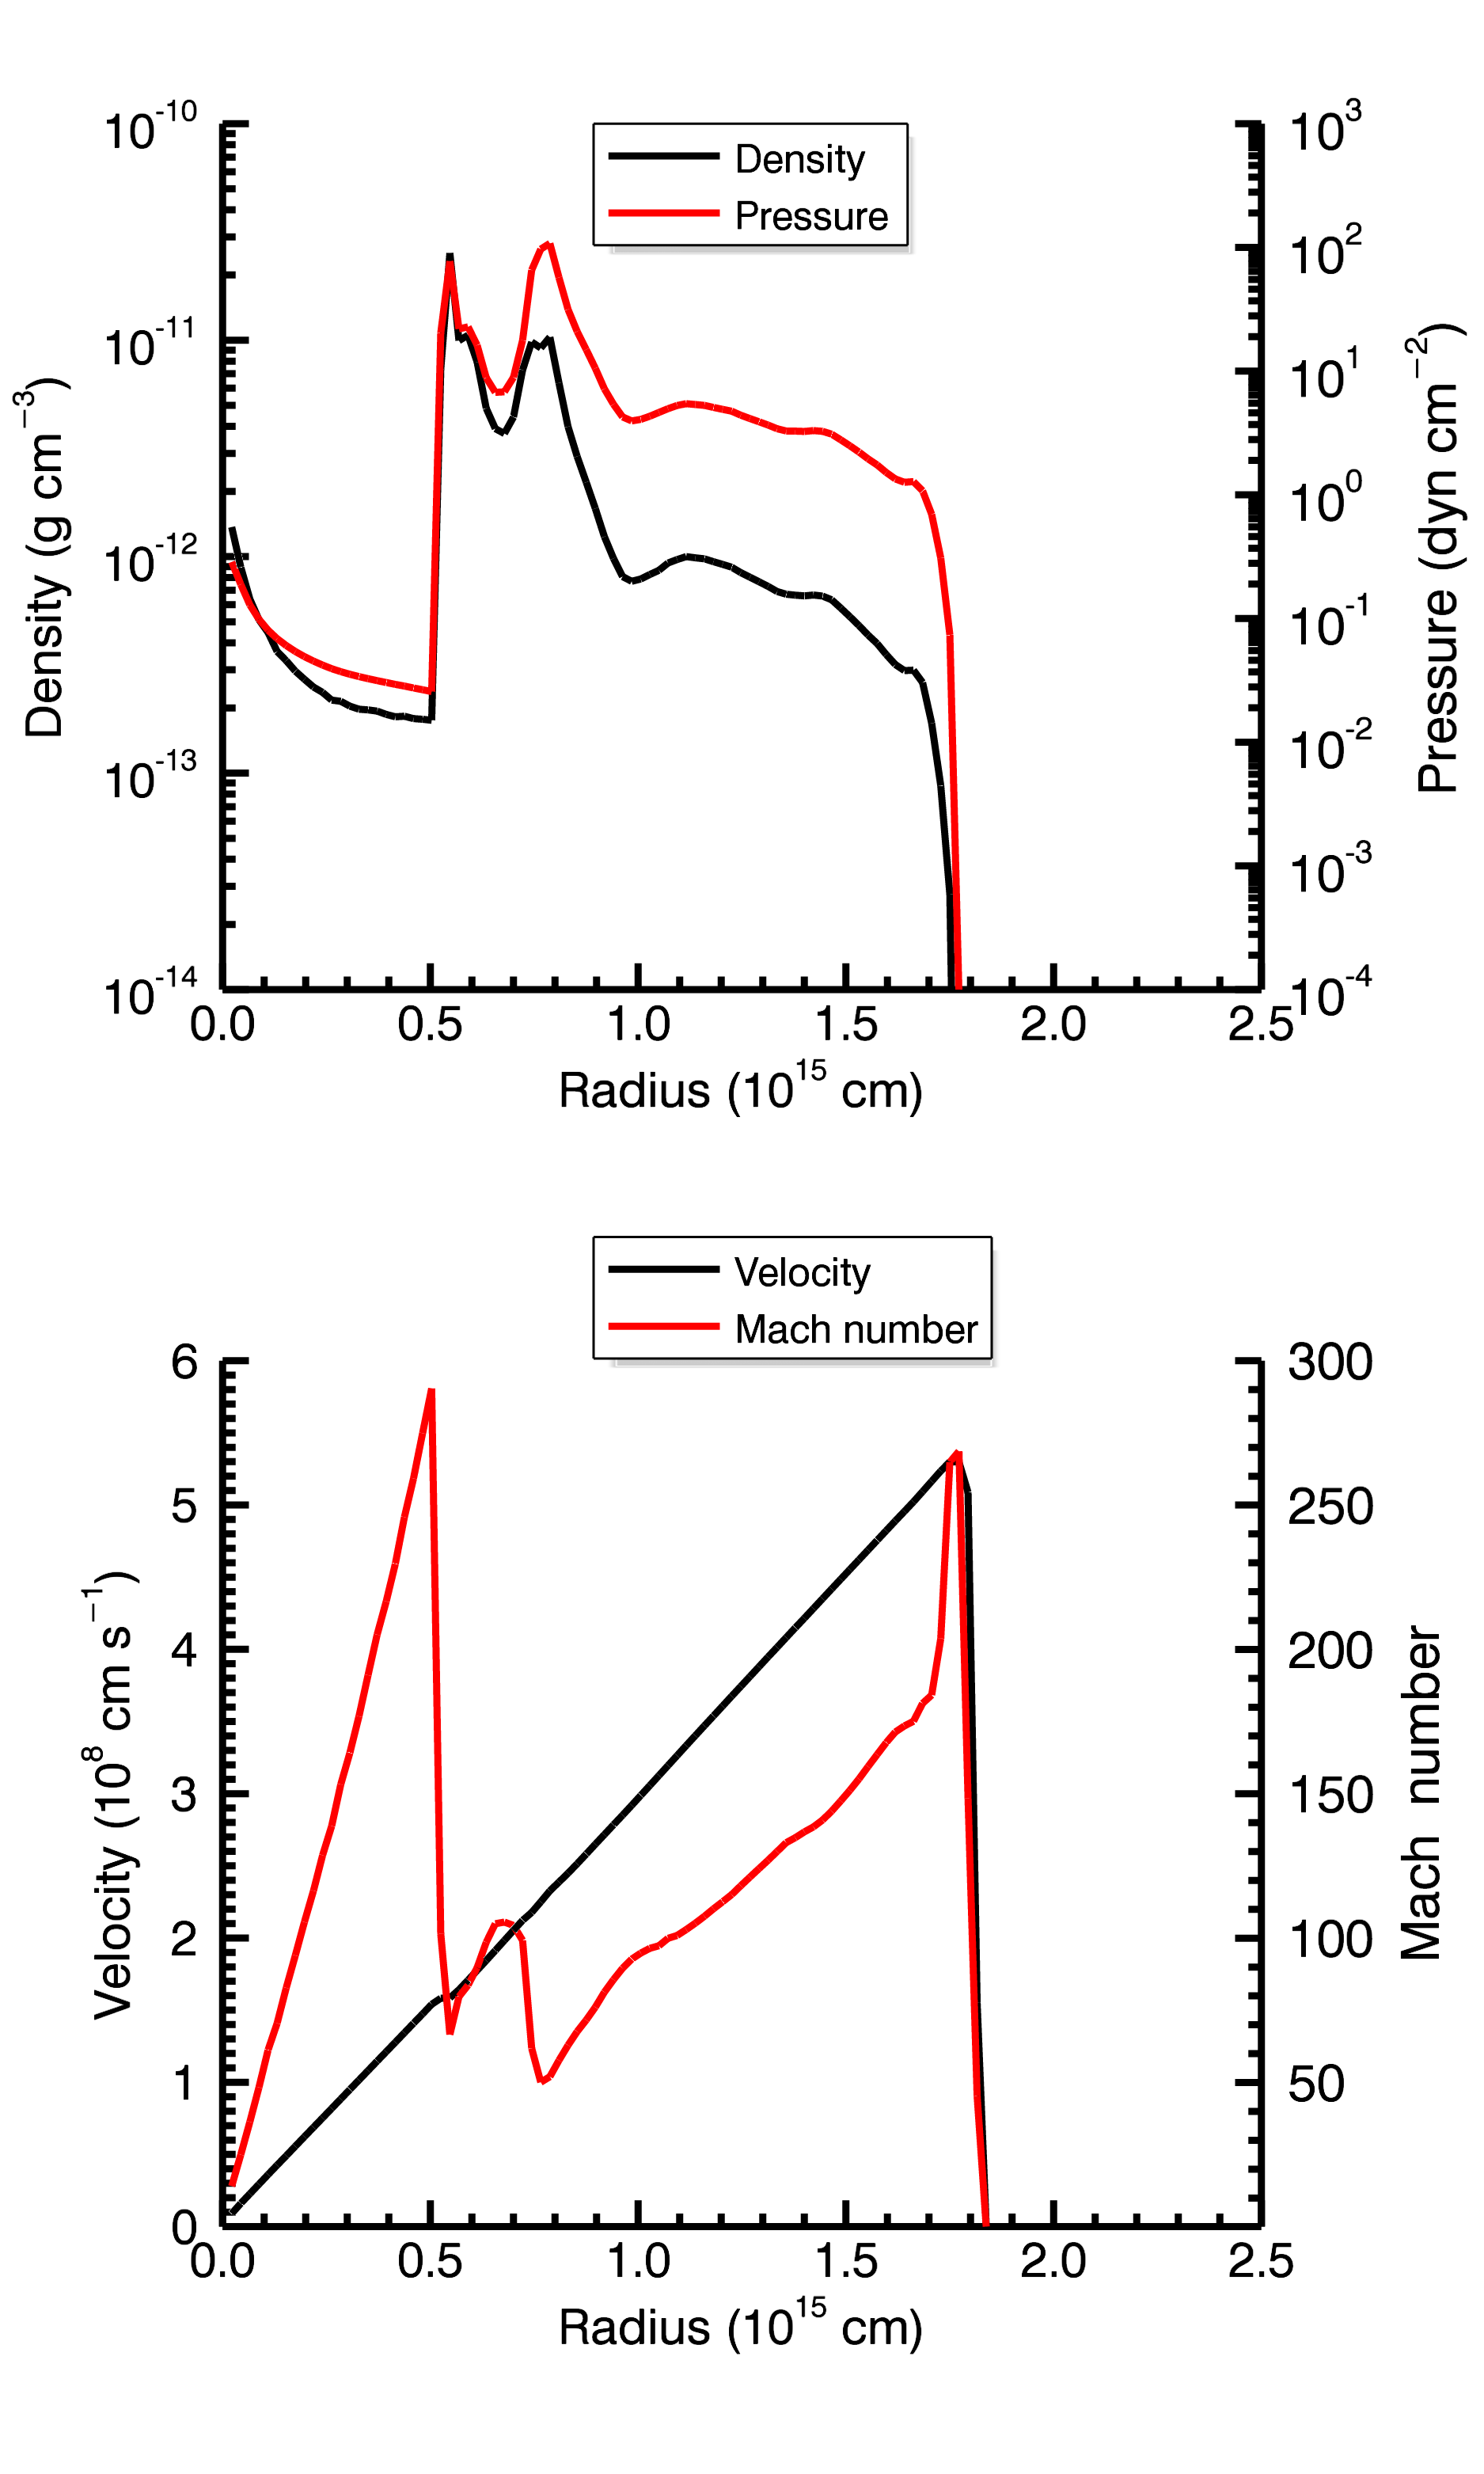
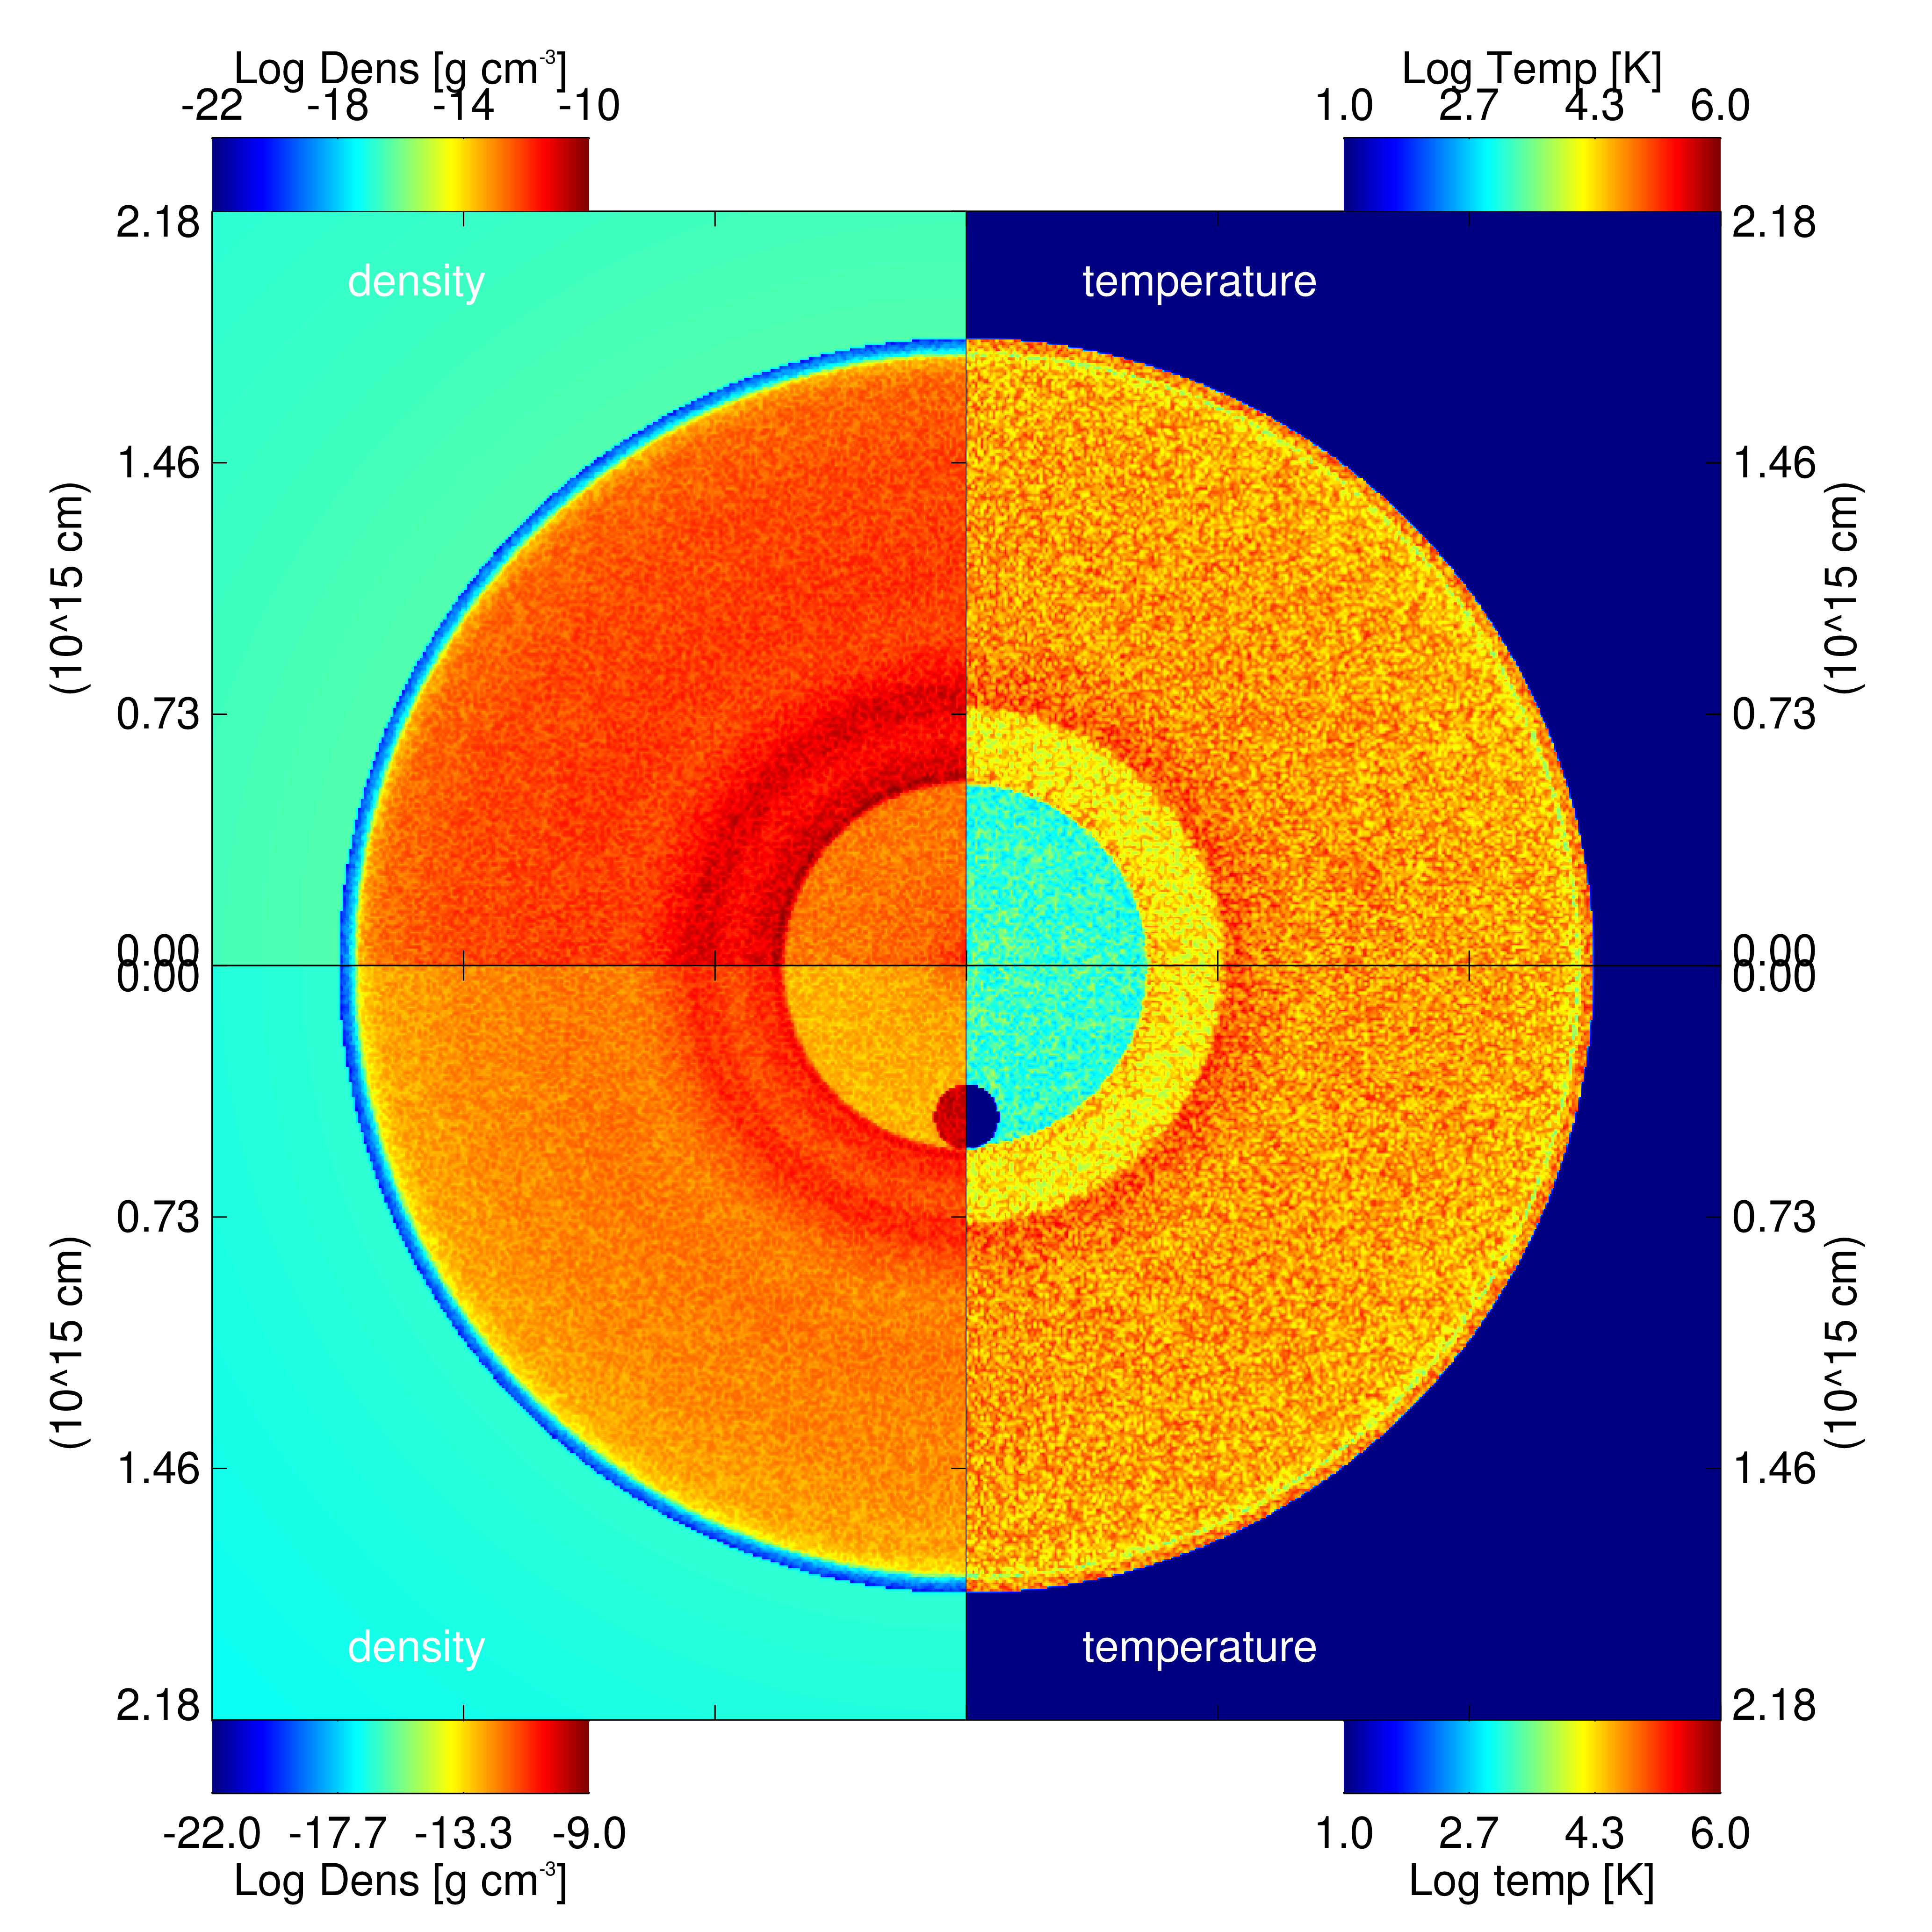
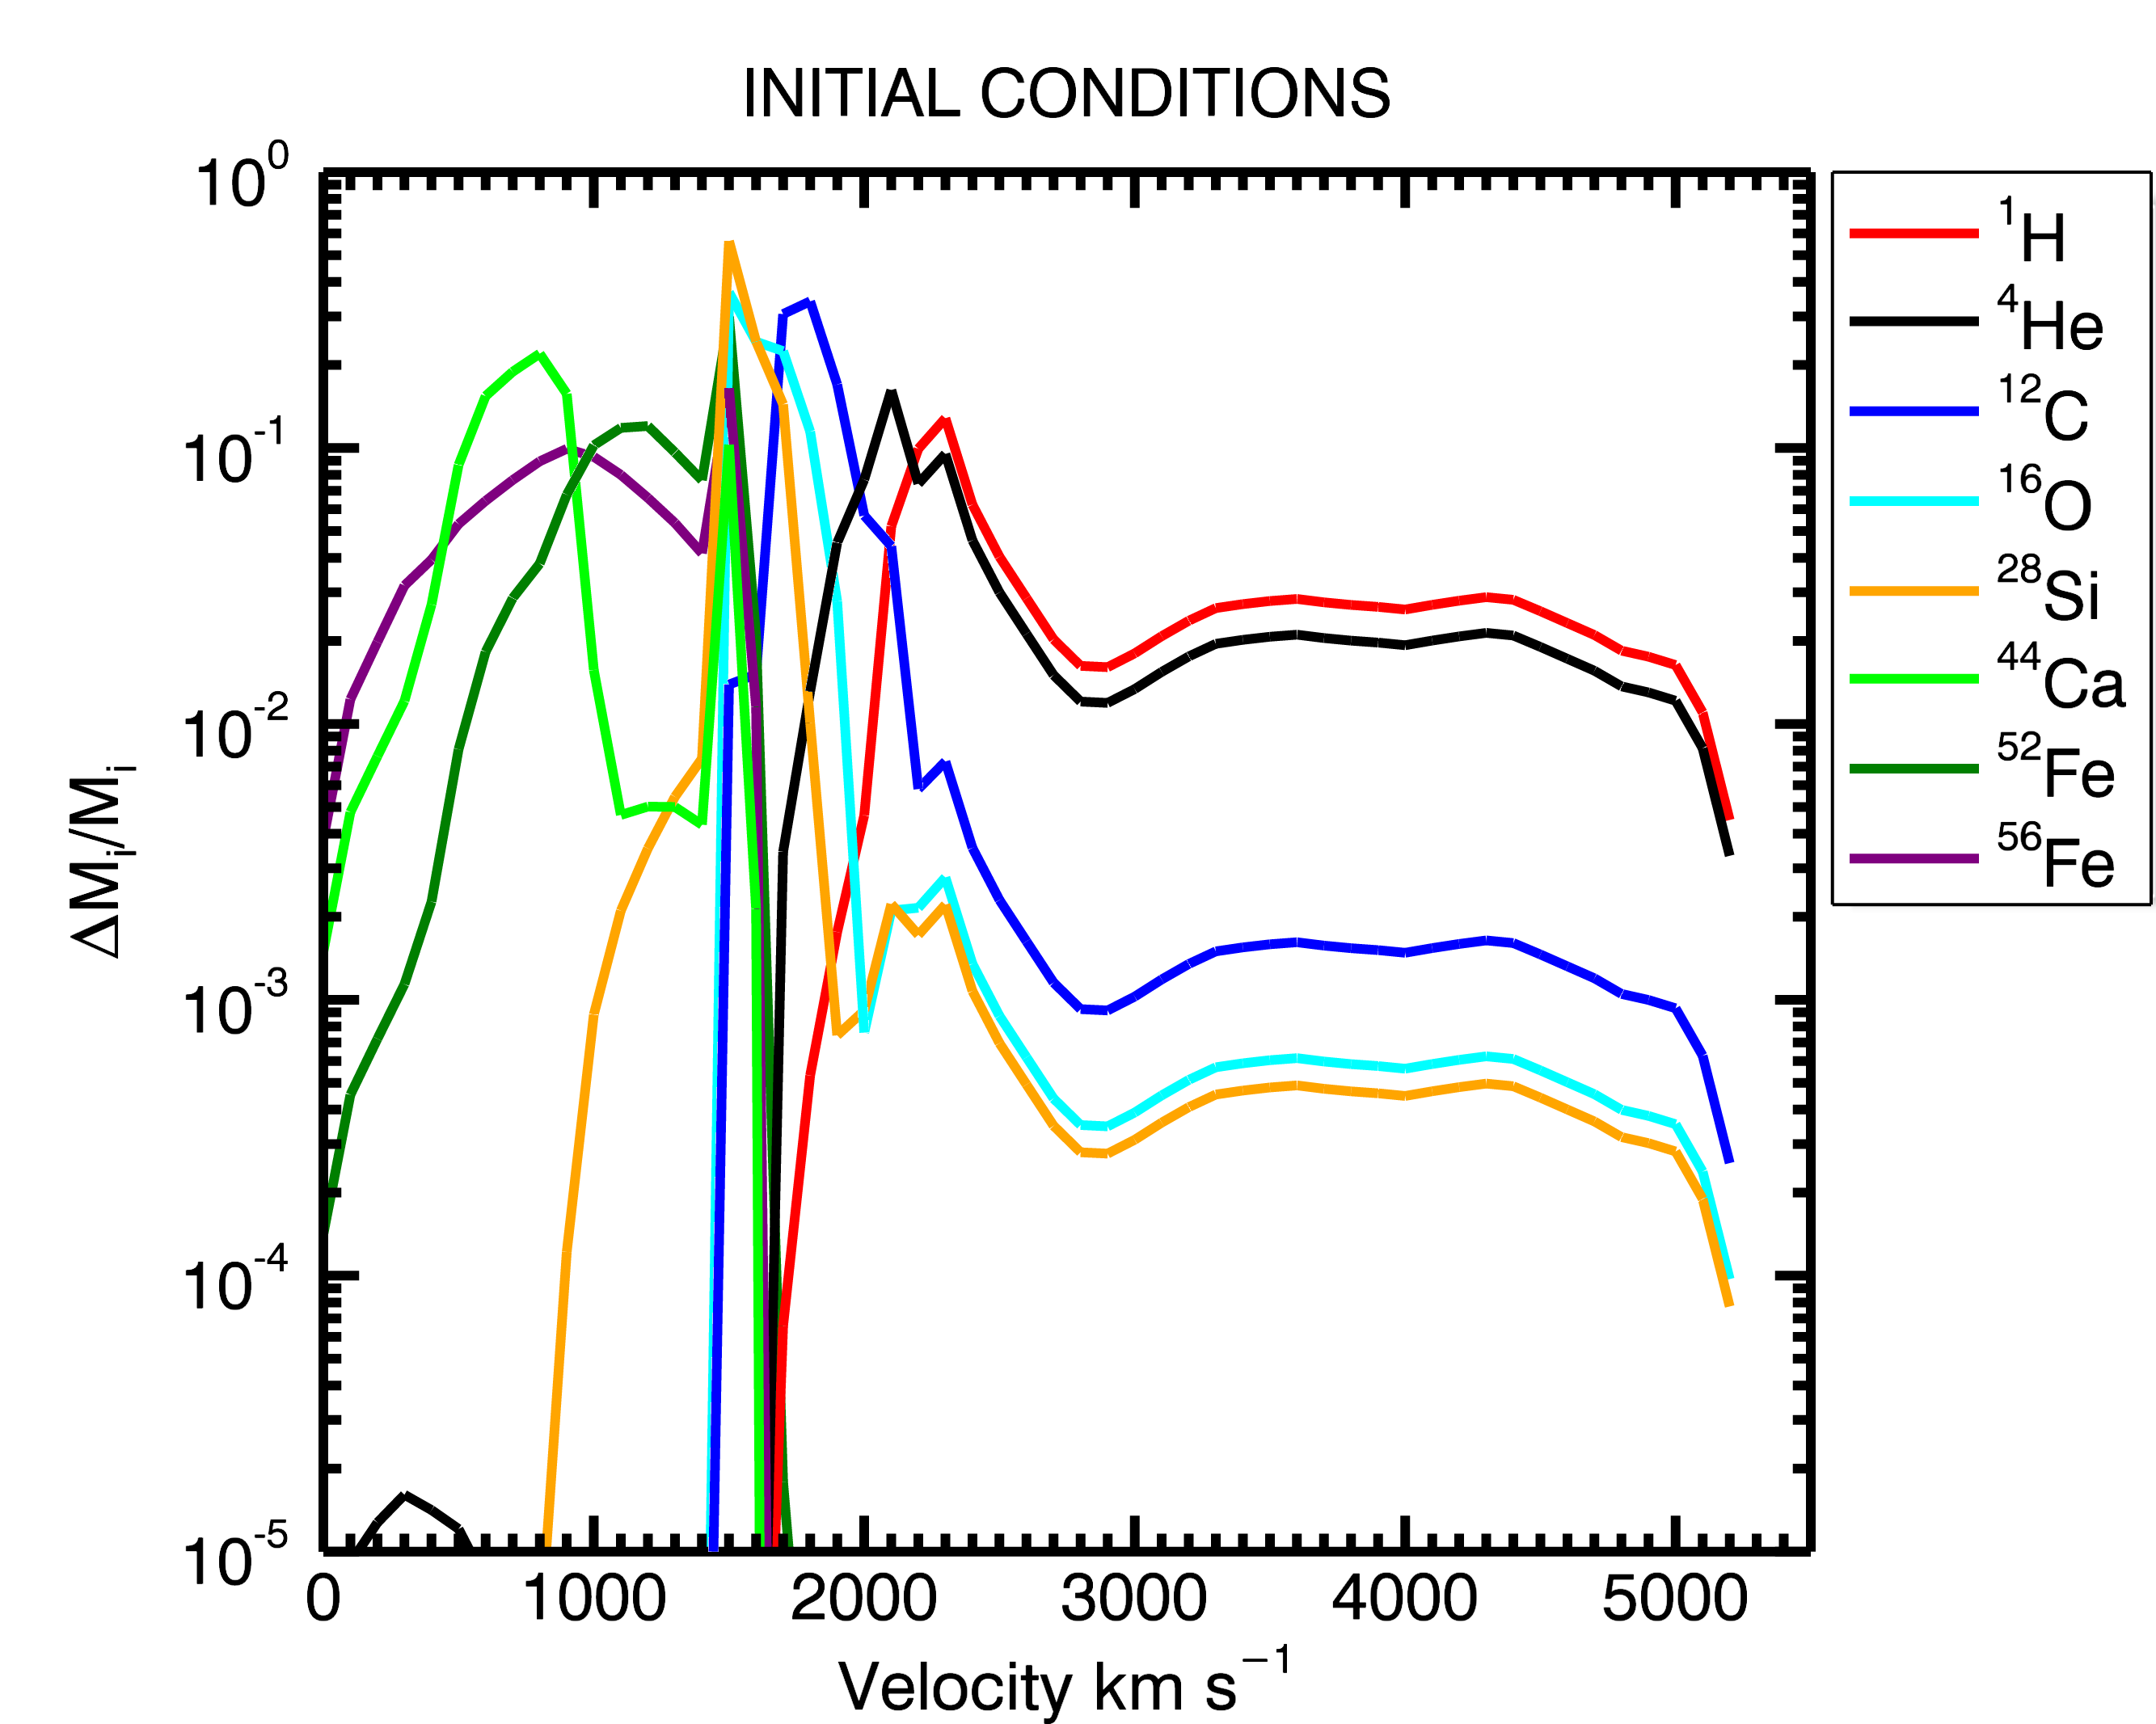
The physical properties of the initial condition, i.e. the output from the CC-SN simulation, consist of an initial remnant at s ( hours) after the CC with a radius of 1.851015 cm, an ejecta mass of M⊙ and a kinetic energy of erg. At this epoch, hours after the breakout of the shock at the stellar surface, the ejecta expand almost homologously through the tenuous wind of the progenitor star (e.g. Gawryszczak et al. 2010; Wongwathanarat et al. 2017; Ono et al. 2020). The initial radial density profile of the ejecta presents a less dense inner region surrounded by a denser shell located in the region of radius cm, corresponding to about of the radius of the ejecta (see Figs. 1 and 2; see also Ono et al. 2020 for a description of the evolution of the SN and the formation of the large-scale structure in the density radial profile). This density profile arises from the SN simulation and depends on the progenitor star considered. Here we considered a generic case of a RSG; a different progenitor as, for instance, a blue supergiant could produce a density profile much smoother with structures that may significantly differ from the dense shell discussed above (see e.g. Ono et al. 2020). The velocity profile (see Fig. 1) increases linearly with the radius of the ejecta from 0 at the origin to a maximum of cm s-1 at the external shell of the initial remnant.
2.2 Modeling the evolution of the SNR
The numerical setup for the SNR simulations is analogous to that described in Orlando et al. (2019, 2020). Since the remnant expansion is described during the free expansion and Sedov expansion phases, the radiative losses (see Orlando et al. 2005, also treated in Miceli et al. 2006; Lee et al. 2015) are neglected. We adopted a 3D Cartesian coordinate system (, , ) and we carried out the simulations by numerically solving the full time-dependent ideal MHD equations in conservative form:
| (1) |
| (2) |
| (3) |
| (4) |
where
are the total pressure and the total gas energy (internal energy, , kinetic energy, and magnetic energy), respectively, is the magnetic field, is the density, is the velocity, is the identity matrix, is the pressure and is the time. The set of equations is closed by the equation of state (EOS) for ideal gases, , where is the adiabatic index.
The 3D simulations of the expanding SNR were performed using PLUTO (see Mignone et al., 2007), a numerical code developed for the solution of hyper-sonic flows widely and successfully used in several studies. The MHD equations are solved using the MHD module available in PLUTO, configured to compute inter-cell fluxes with the Harten-Lax-van Leer discontinuities (HLLD) approximate Riemann solver, while third order in time is achieved using a Runge-Kutta scheme. To preserve the condition of a mixed hyperbolic/parabolic divergence cleaning technique is used (Mignone et al., 2007).
The distribution of elements is traced through a set of advection equations:
| (5) |
which are solved for each of the elements considered in addition to the MHD equations, where is the mass fraction of the element of index , and runs over the 19 species listed in Section 2.1. Unlike the 1D SN simulation used as initial condition, the 3D SNR simulations do not include the radioactive decays of the explosive nucleosynthesis products synthesized in the SN explosion, such as 56Ni or 44Ti. The main effect of radioactive decay would be a slight inflation of the instability-driven structures developed in regions near the decaying elements (Gabler et al., 2017). Since the decay time of these species is much lower than the evolution time analyzed here, we assumed at the beginning of our simulations that all the 56Ni and 44Ti are already decayed in their decaying products (56Fe and 44Ca respectively; see Nadyozhin 1994; Ahmad et al. 2006).
Our computational domain describes only one octant of the whole remnant to reduce the computational cost. At the initial condition, the explosion is located at the origin (0,0,0) of the coordinate system. To follow the wide range of space and time scales covered during the expansion of the remnant from the onset of the explosion to the first 5000 years, we adopted the same approach as Orlando et al. (2019). Initially the domain extends between 0 and cm in all directions and is covered by a uniform grid with zones. Then the domain is gradually extended as the forward shock propagates outward and the physical values are remapped in the new domains. More specifically, each time the forward shock gets close to 90% of the domain size, the domain is extended by a factor of 1.2 in all directions, maintaining a uniform grid of grid points. As discussed by Ono et al. (2013) this approach is reliable because it does not introduce errors larger than 0.1% after 40 remappings. In such a way, the finest spatial resolution is cm at the beginning of our 3D simulations and, because of the expansion of the system, the resolution is cm at the end of simulation time. The simulations, therefore, span from an initial domain of ( cm)3 up to ( cm)3. Equatorial symmetric boundary conditions 111Variables are symmetrized across the boundary and normal components of vector fields flip signs, with the exception of the magnetic field in which only the transverse component flip sign. with respect to x=0, y=0 and z=0 planes are considered, while fixed pre-shock values conditions are assumed at all other boundaries. We checked the effects of spatial resolution on the remnant evolution in Appendix A, and verified that our main conclusions are not significantly affected by the resolution adopted (see Appendix A for further details).
The ejecta distribution is expected to be characterized by small-scale clumping of material and larger-scale anisotropies (e.g. Orlando et al. 2016). Thus, following Orlando et al. (2012), we introduced small-scale perturbations in the initial ejecta distribution, mimicking the small-scale clumping of ejecta. These inhomogeneities were modeled as a per-cell random density perturbations derived from a power-law probability distribution. All the clumps have an initial size of cm and the density perturbation of each clump is calculated as the ratio of the mass density of the resulting clump to the local (unperturbed) average density in the region occupied by the clump; the maximum density perturbation allowed is a factor of 4. In Sect. 2.3 we discuss how post-explosion large-scale anisotropies in the ejecta distribution are modeled.
The CSM around the progenitor star has been described as a spherically symmetric steady wind with a gas density proportional to (where is the radial distance from the center of explosion):
| (6) |
We assumed that the wind is isobaric, with pressure dyn cm-2 to prevent the wind to evolve towards the boundaries of the domain, causing ”jumps” in the wind’s profile whenever the domain is extended. This assumption does not affect the results because the forward shock propagates much faster than the stellar wind during the whole evolution.
The CSM is characterized by three parameters: the reference density, the radial distance of the reference density, and the temperature ( cm-3, pc, and K, respectively). The values considered are within the range of typical values for a progenitor RSG, which is subject to high mass-loss rates ( M⊙ yr-1) and very slow winds (20 - 100 km s-1) (Dwarkadas, 2005; Crowther, 2001). Assuming M⊙ yr-1 and km s-1, we derived the reference mass density as which corresponds to a particle number density cm-3. In such a tenuous environment, the radiative losses would become relevant after years (see Blondin et al. 1998; Orlando et al. 2005; Miceli et al. 2006; Lee et al. 2015), a timescale much greater than the simulated time ( years).
The simulations include the effect of an ambient magnetic field. This field is not expected to influence the overall dynamics of the system which is characterized by high values of the plasma (i.e. the plasma pressure dominates over the magnetic one). We note that MHD codes are generally more diffusive than HD codes because they use approximate Riemann solvers. However, we decided to include the effects on an ambient magnetic field in our simulations because the field can play a relevant role in limiting the growth of HD instabilities that would develop at the border of ejecta clumps and anisotropies and that are responsible for their fragmentation (Fragile et al., 2005; Shin et al., 2008; Orlando et al., 2008, 2012, 2019). Following Orlando et al. (2019), the field configuration adopted is the ”Parker spiral” that is the field resulting from the rotation of the progenitor star and the expanding stellar wind (Parker, 1958). The Parker spiral can be described in spherical coordinates (, , ) as:
| (7) | ||||
| (8) |
The previous parameters are set to G cm2 and G cm in order to produce a magnetic field of the order of G at the surface of the progenitor star (e.g. Tessore et al. 2017 and references therein).
2.3 Post explosion large-scale anisotropy
We considered the case of a post-explosion large-scale anisotropy located in the inner initial ejecta distribution. Our aim is to study how/whether the remnant structure and morphology keep memory of post-explosion anisotropies and if these anisotropies have an effect on the evolution and mixing of the different metal-rich layers of the progenitor star. The anisotropy included in our model does not arise from the 1D SN simulation, but is set in the initial conditions of our SNR model. In fact, explaining the physical origin of these initial anisotropies is well beyond the scope of this work; indeed we aimed at studying the effects of a large scale post-explosion anisotropy on the evolution of a SNR and at investigating how the different initial parameters of the anisotropy might determine the final shape of the remnant.
The anisotropy is described as an overdense sphere in pressure equilibrium with the surrounding ejecta, whose center lies on the z-axis (therefore only a quarter of the sphere is modelled). We investigated possible numerical effects which may develop by assuming the overdense sphere propagating along the -axis, by exploring a case of a clump with its center located at in the plane (see Appendix B for further details). We found that simulations assuming the sphere propagating either along the -axis or at in the plane produce very similar results on the time-scale considered (5000 years) and we concluded that the numerical effects (if any) due to the propagation of the bullet along the -axis have a negligible impact on the evolution of the ejecta bullet.
The geometrical properties of the anisotropy are parametrized by its distance from the center (), and its radius (). We considered two values of , associated with different layers of the exploding star, namely: the interface between 56Fe/28Si-rich regions at (where is the initial radius of remnant) and the 56Fe-rich region at . We explored two values for the clump radius, namely and , both consistent with the characteristic size of clumps generated by Rayleigh-Taylor (RT) instability (seeded by flow structures resulting from neutrino-driven convection) in SN explosion simulations (e.g. Kifonidis et al. 2006; Gawryszczak et al. 2010). We explored anisotropies with density between and times that of the surrounding ejecta at distance (density contrast ), and with radial velocity between and times that of the surrounding ejecta (velocity contrast ), making sure that the maximum speed of the clump does not exceed the velocity of the fastest ejecta in the outermost layers. Wongwathanarat et al. (2017) have shown that fast and high-density large-scale anisotropies/plumes with high concentration of 56Ni and 44Ti can emerge from neutrino-driven SN explosions. Some other authors have predicted that high-velocity ejecta components might be produced in the presence of magnetic fields that are anchored to a rapidly-rotating proto-neutron star (e.g. Takiwaki et al. 2009). The anisotropies parametrized in this paper assume the same chemical composition as the surrounding ejecta region, i.e. iron or iron/silicon when and . A summary of the cases explored is given in Table 1.
Previous simulations of ejecta bullets in a SNR, performed by Miceli et al. (2013) and Tsebrenko & Soker (2015), showed that clumps with initial values of are able to reach the SNR shock front without being dispersed by the interaction with the reverse shock. At odds with those simulations which adopt power-law density profiles for the ejecta distribution and start tens of years after the SN event, our simulations include a self-consistent description of the initial ejecta density profile (derived from 1D SN simulations) which shows a high-density thick shell in the innermost regions of the ejecta (see left boxes of Fig. 2). As a result, we found that higher density contrasts () are necessary for the clumps to overcome this overdense structure and to eventually protrude the forward shock. The maximum initial mass of the anisotropies considered is M⊙ (¡ 2% of the initial ejecta mass) with a maximum kinetic energy of erg (¡ 3% of the total initial kinetic energy of the ejecta).We note that these values are very similar to those estimated for the Si-rich jet-like feature observed in Cassiopeia A (Orlando et al., 2016) and to those inferred for the shrapnel G in the Vela SNR (García et al., 2017).
| Model | ||||
|---|---|---|---|---|
| () | () | |||
| Si-R5-D750-V5 | ||||
| Si-R5-D750-V4 | ||||
| Si-R5-D750-V3 | ||||
| Si-R5-D750-V1 | ||||
| Si-R5-D600-V5 | ||||
| Si-R5-D600-V4 | ||||
| Si-R5-D600-V3 | ||||
| Si-R5-D500-V5 | ||||
| Si-R5-D500-V4 | ||||
| Si-R5-D500-V3 | ||||
| Fe-R5-D750-V7 | ||||
| Fe-R5-D750-V6 | ||||
| Fe-R5-D750-V5 | ||||
| Fe-R5-D750-V3 | ||||
| Fe-R5-D750-V2 | ||||
| Fe-R5-D600-V7 | ||||
| Fe-R5-D600-V6 | ||||
| Fe-R5-D500-V7 | ||||
| Fe-R5-D500-V6 | ||||
| Fe-R5-D500-V5 | ||||
| Fe-R5-D500-V3 | ||||
| Fe-R5-D500-V2 | ||||
| Fe-R4-D750-V7 | ||||
| Fe-R4-D750-V6 | ||||
| Fe-R4-D500-V7 | ||||
| Fe-R4-D500-V6 |
3 Results
3.1 The case of a spherically symmetric explosion
We first considered the case of a spherically symmetric SN explosion with small-scale (isotropically distributed) clumps of ejecta, without including any large-scale anisotropies (hereafter, the spherical model) to study the spherically symmetric expansion of the remnant and the evolution of its chemically homogeneous layers.
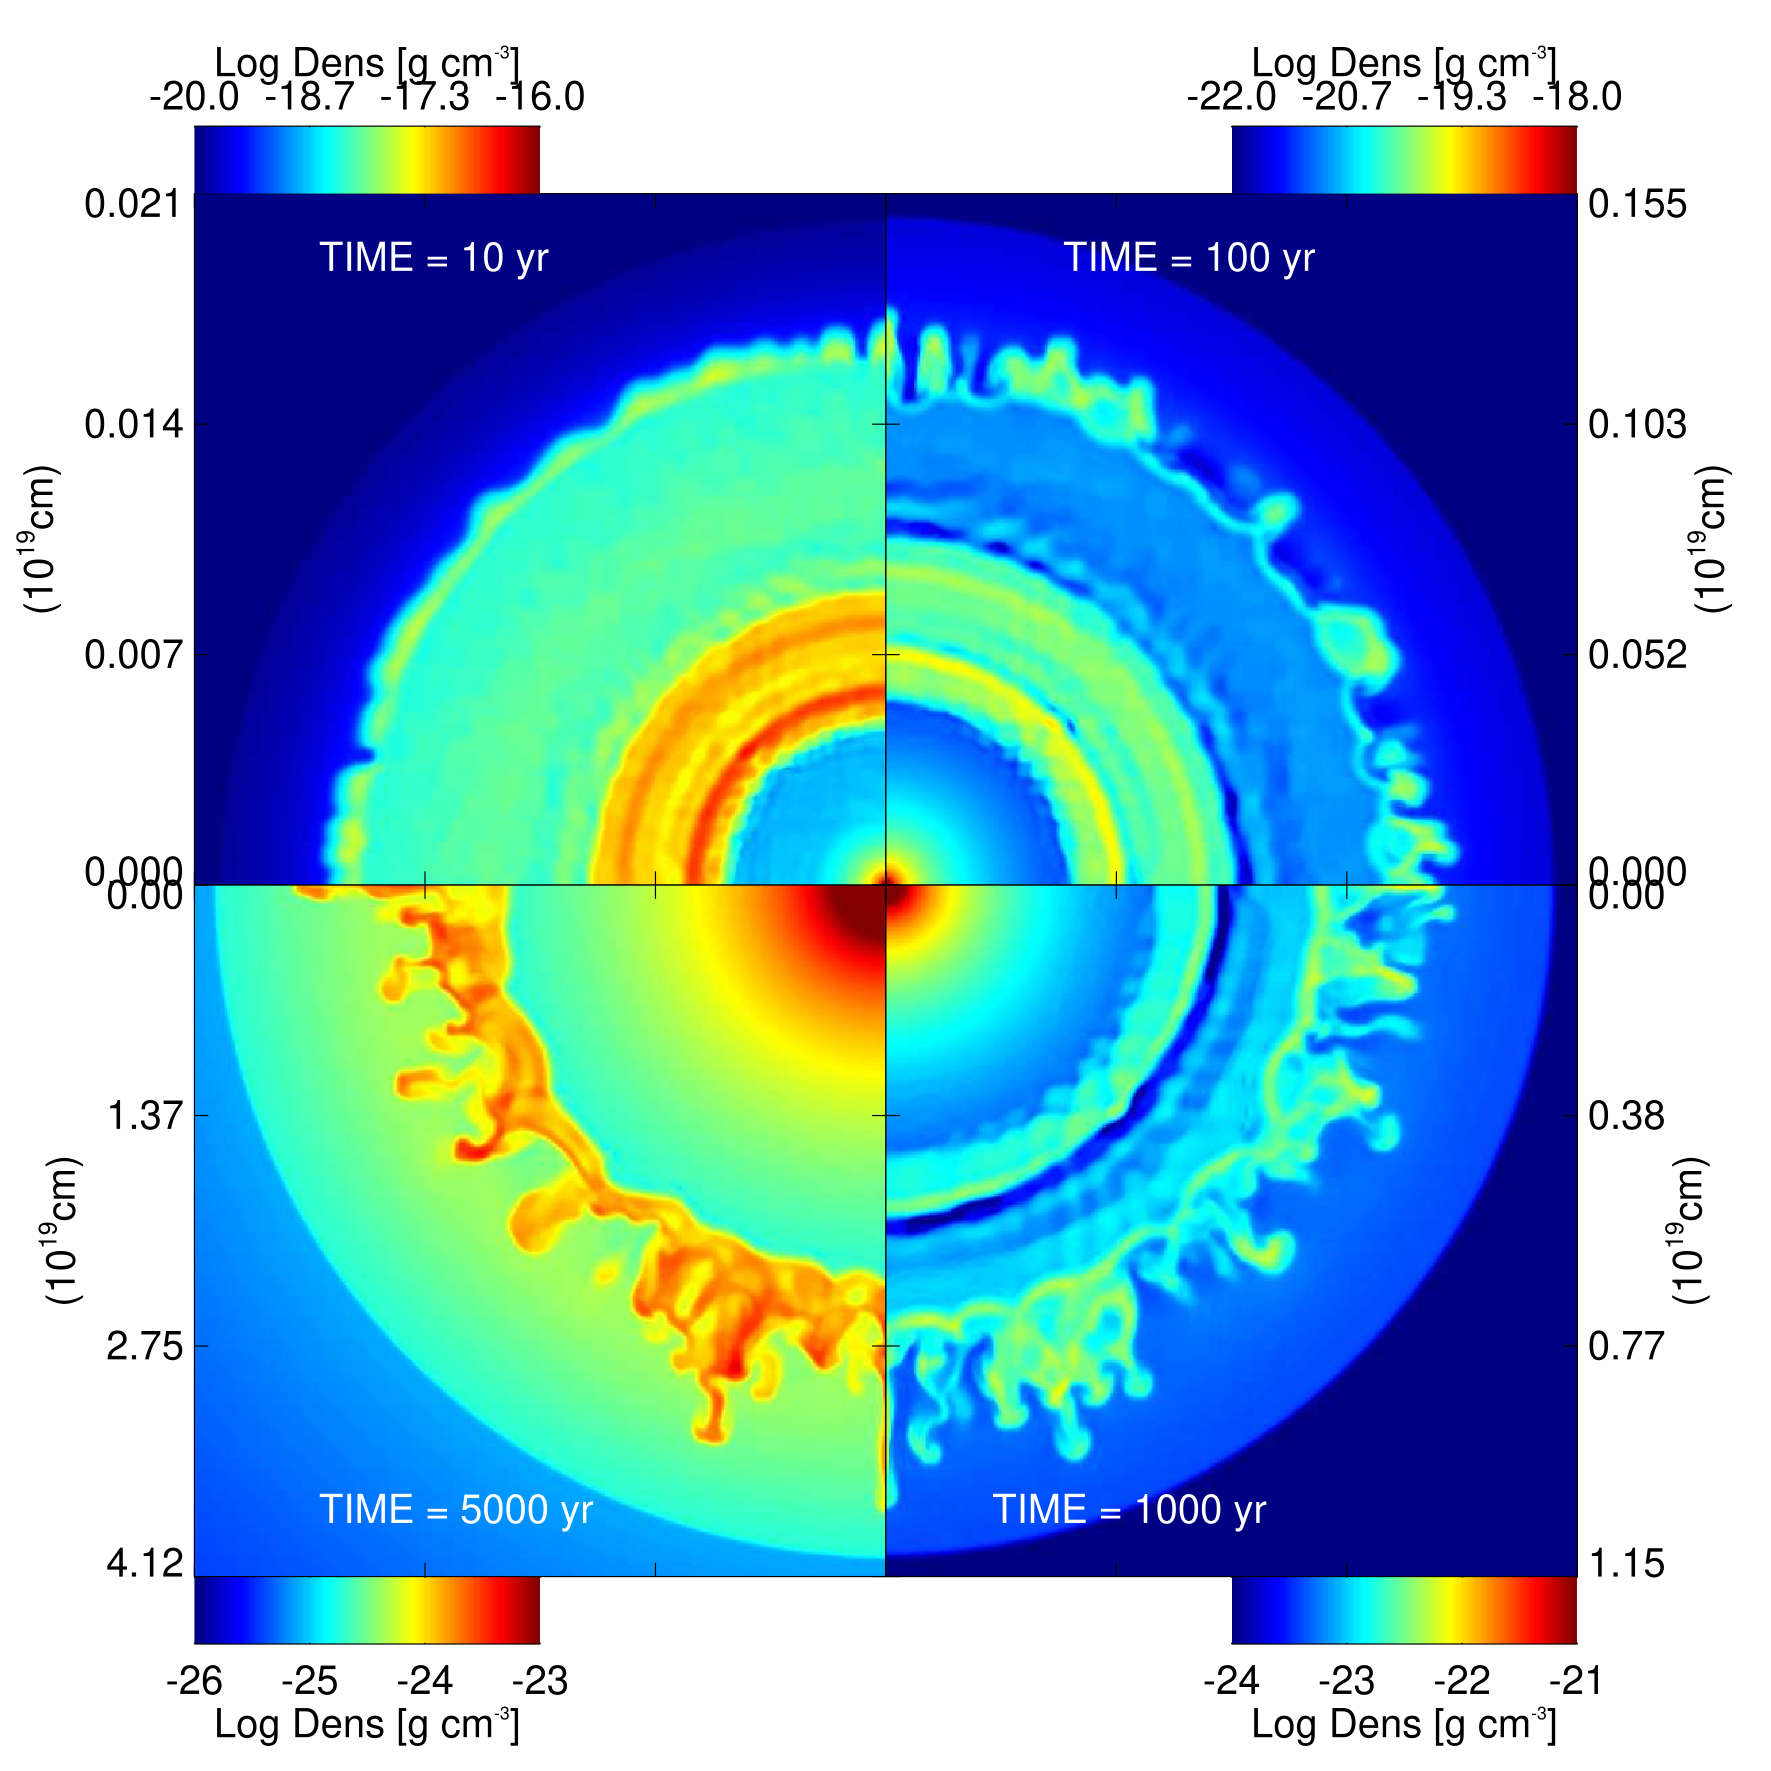
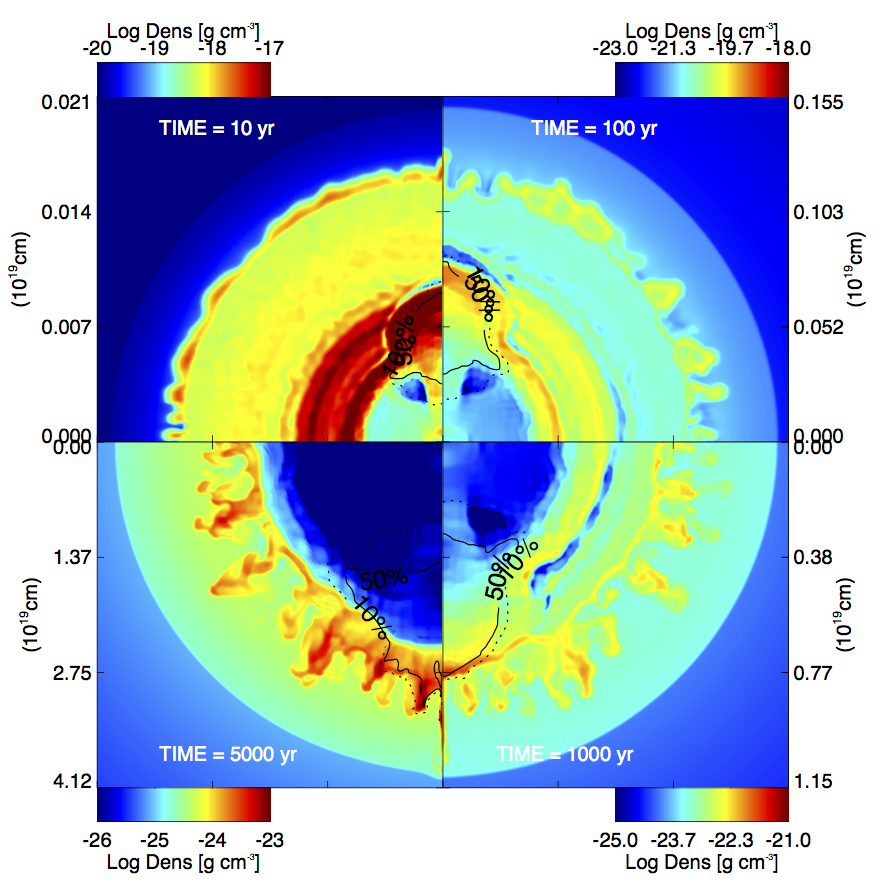
Fig. 3 (see also online Movie 1 and 2) shows the 2D cross-sections through the () plane of density at different evolutionary stages for the spherical model (left panel). After years of evolution, it is possible to see HD instabilities (Rayleigh-Taylor, Kelvin-Helmholtz shear instability; e.g. Gull 1973; Chevalier 1976; Fryxell et al. 1991; Chevalier et al. 1992) developing as finger-like structures at the interface between ejecta and shocked CSM (as already shown by numerical simulations in Dwarkadas & Chevalier 1998; Wang & Chevalier 2001), thus driving the mixing between the ejecta and the ambient. During this evolutionary phase, the over-dense internal shell in the ejecta expands and it is clearly visible in the density distribution. At the age of years the reverse shock reaches the over-dense internal shell. This allows the over-dense shell to enter in the mixing-region causing the destruction of the shell itself by the HD instabilities at years (see online Movie 1). At the end of the simulation, the SNR reaches a radius of cm ( pc).
Among all the elements considered in the simulations, radioactive nuclei (such as 56Ni and 44Ti), synthesized during the explosion, and their decay products are very important because they are produced in the innermost regions of the exploding star, which makes them excellent probes of the internal conditions that lead to the determination of the explosion mechanism and of the shock-wave dynamics during the earliest phases of SN outbursts. For this reason, the study of these elements is a key to connect explosion models to observations and to deduce important constraints on the underlying processes. Radioactive 56Ni and 44Ti transform into the stable isotopes 56Fe and in 44Ca, respectively, with a half-life of years (Nadyozhin, 1994; Ahmad et al., 2006). As mentioned in Sect. 2, since we are interested to investigate the matter mixing and evolution of the remnant at epochs longer than 100 years, and recalling that our model does not include the radioactive decay of the elements (see Section 2.2), we assumed that all the 56Ni and 44Ti are already decayed in 56Fe and 44Ca respectively at the beginning of our simulations.
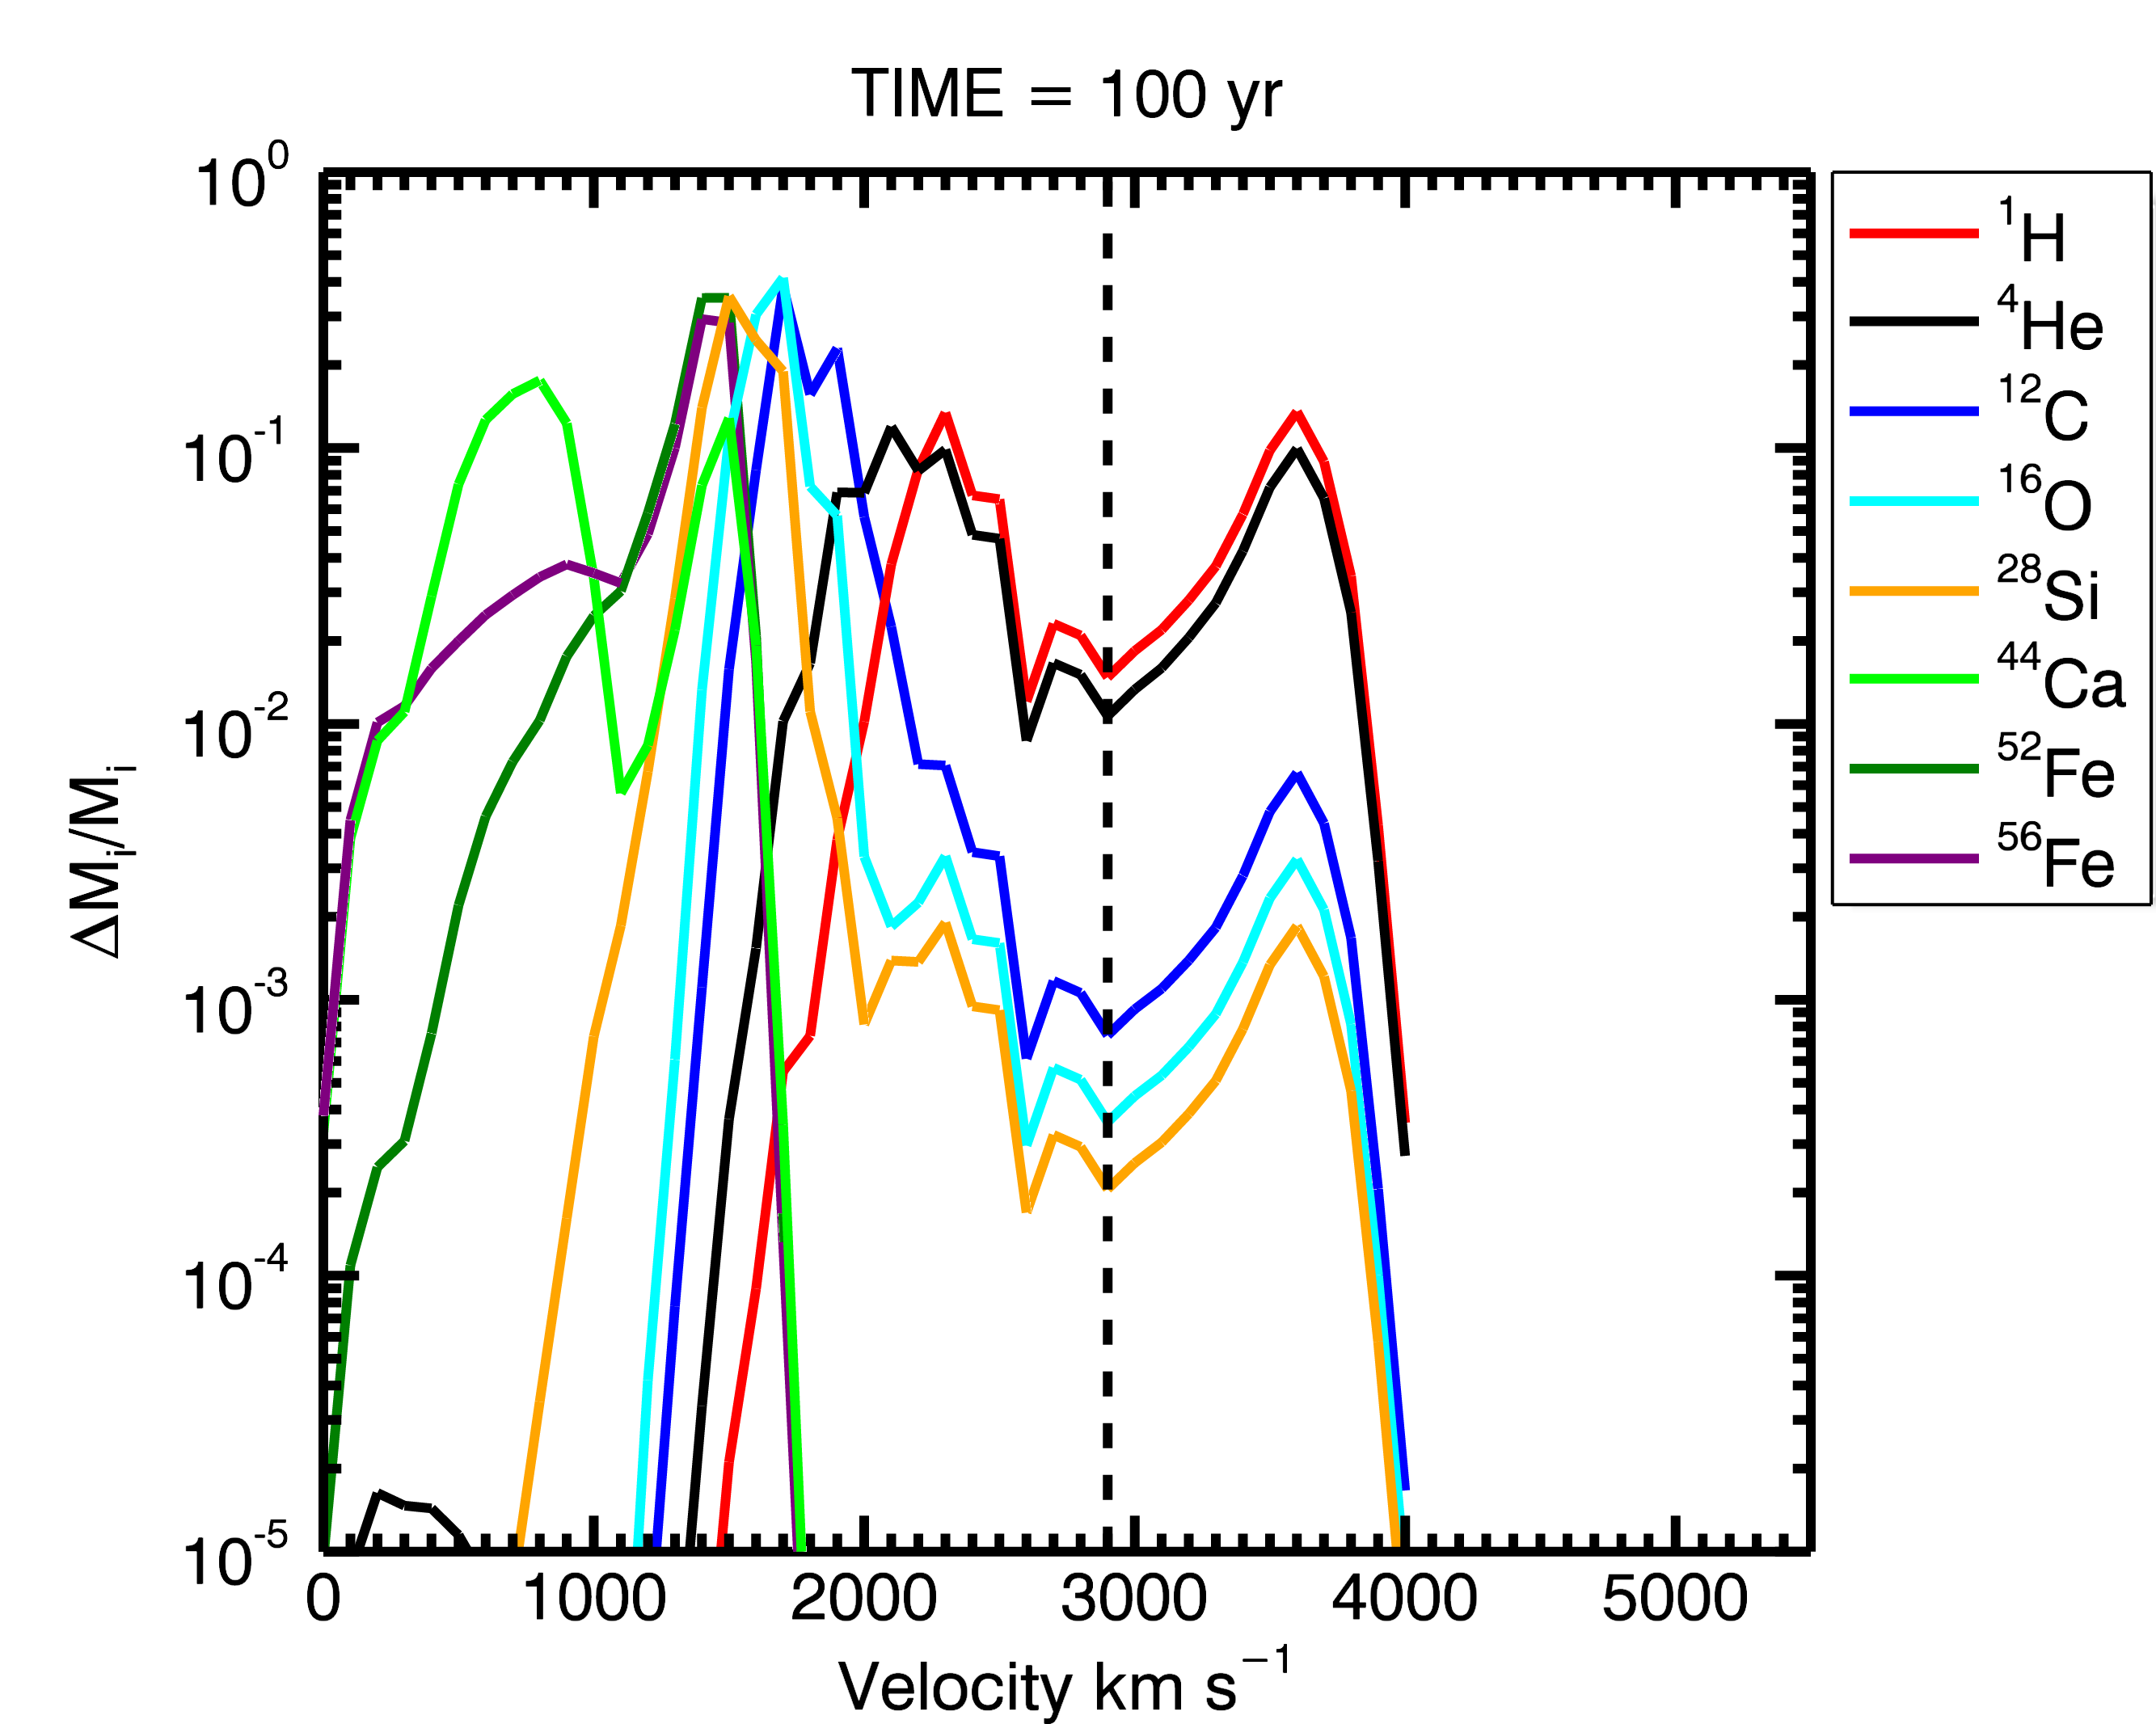
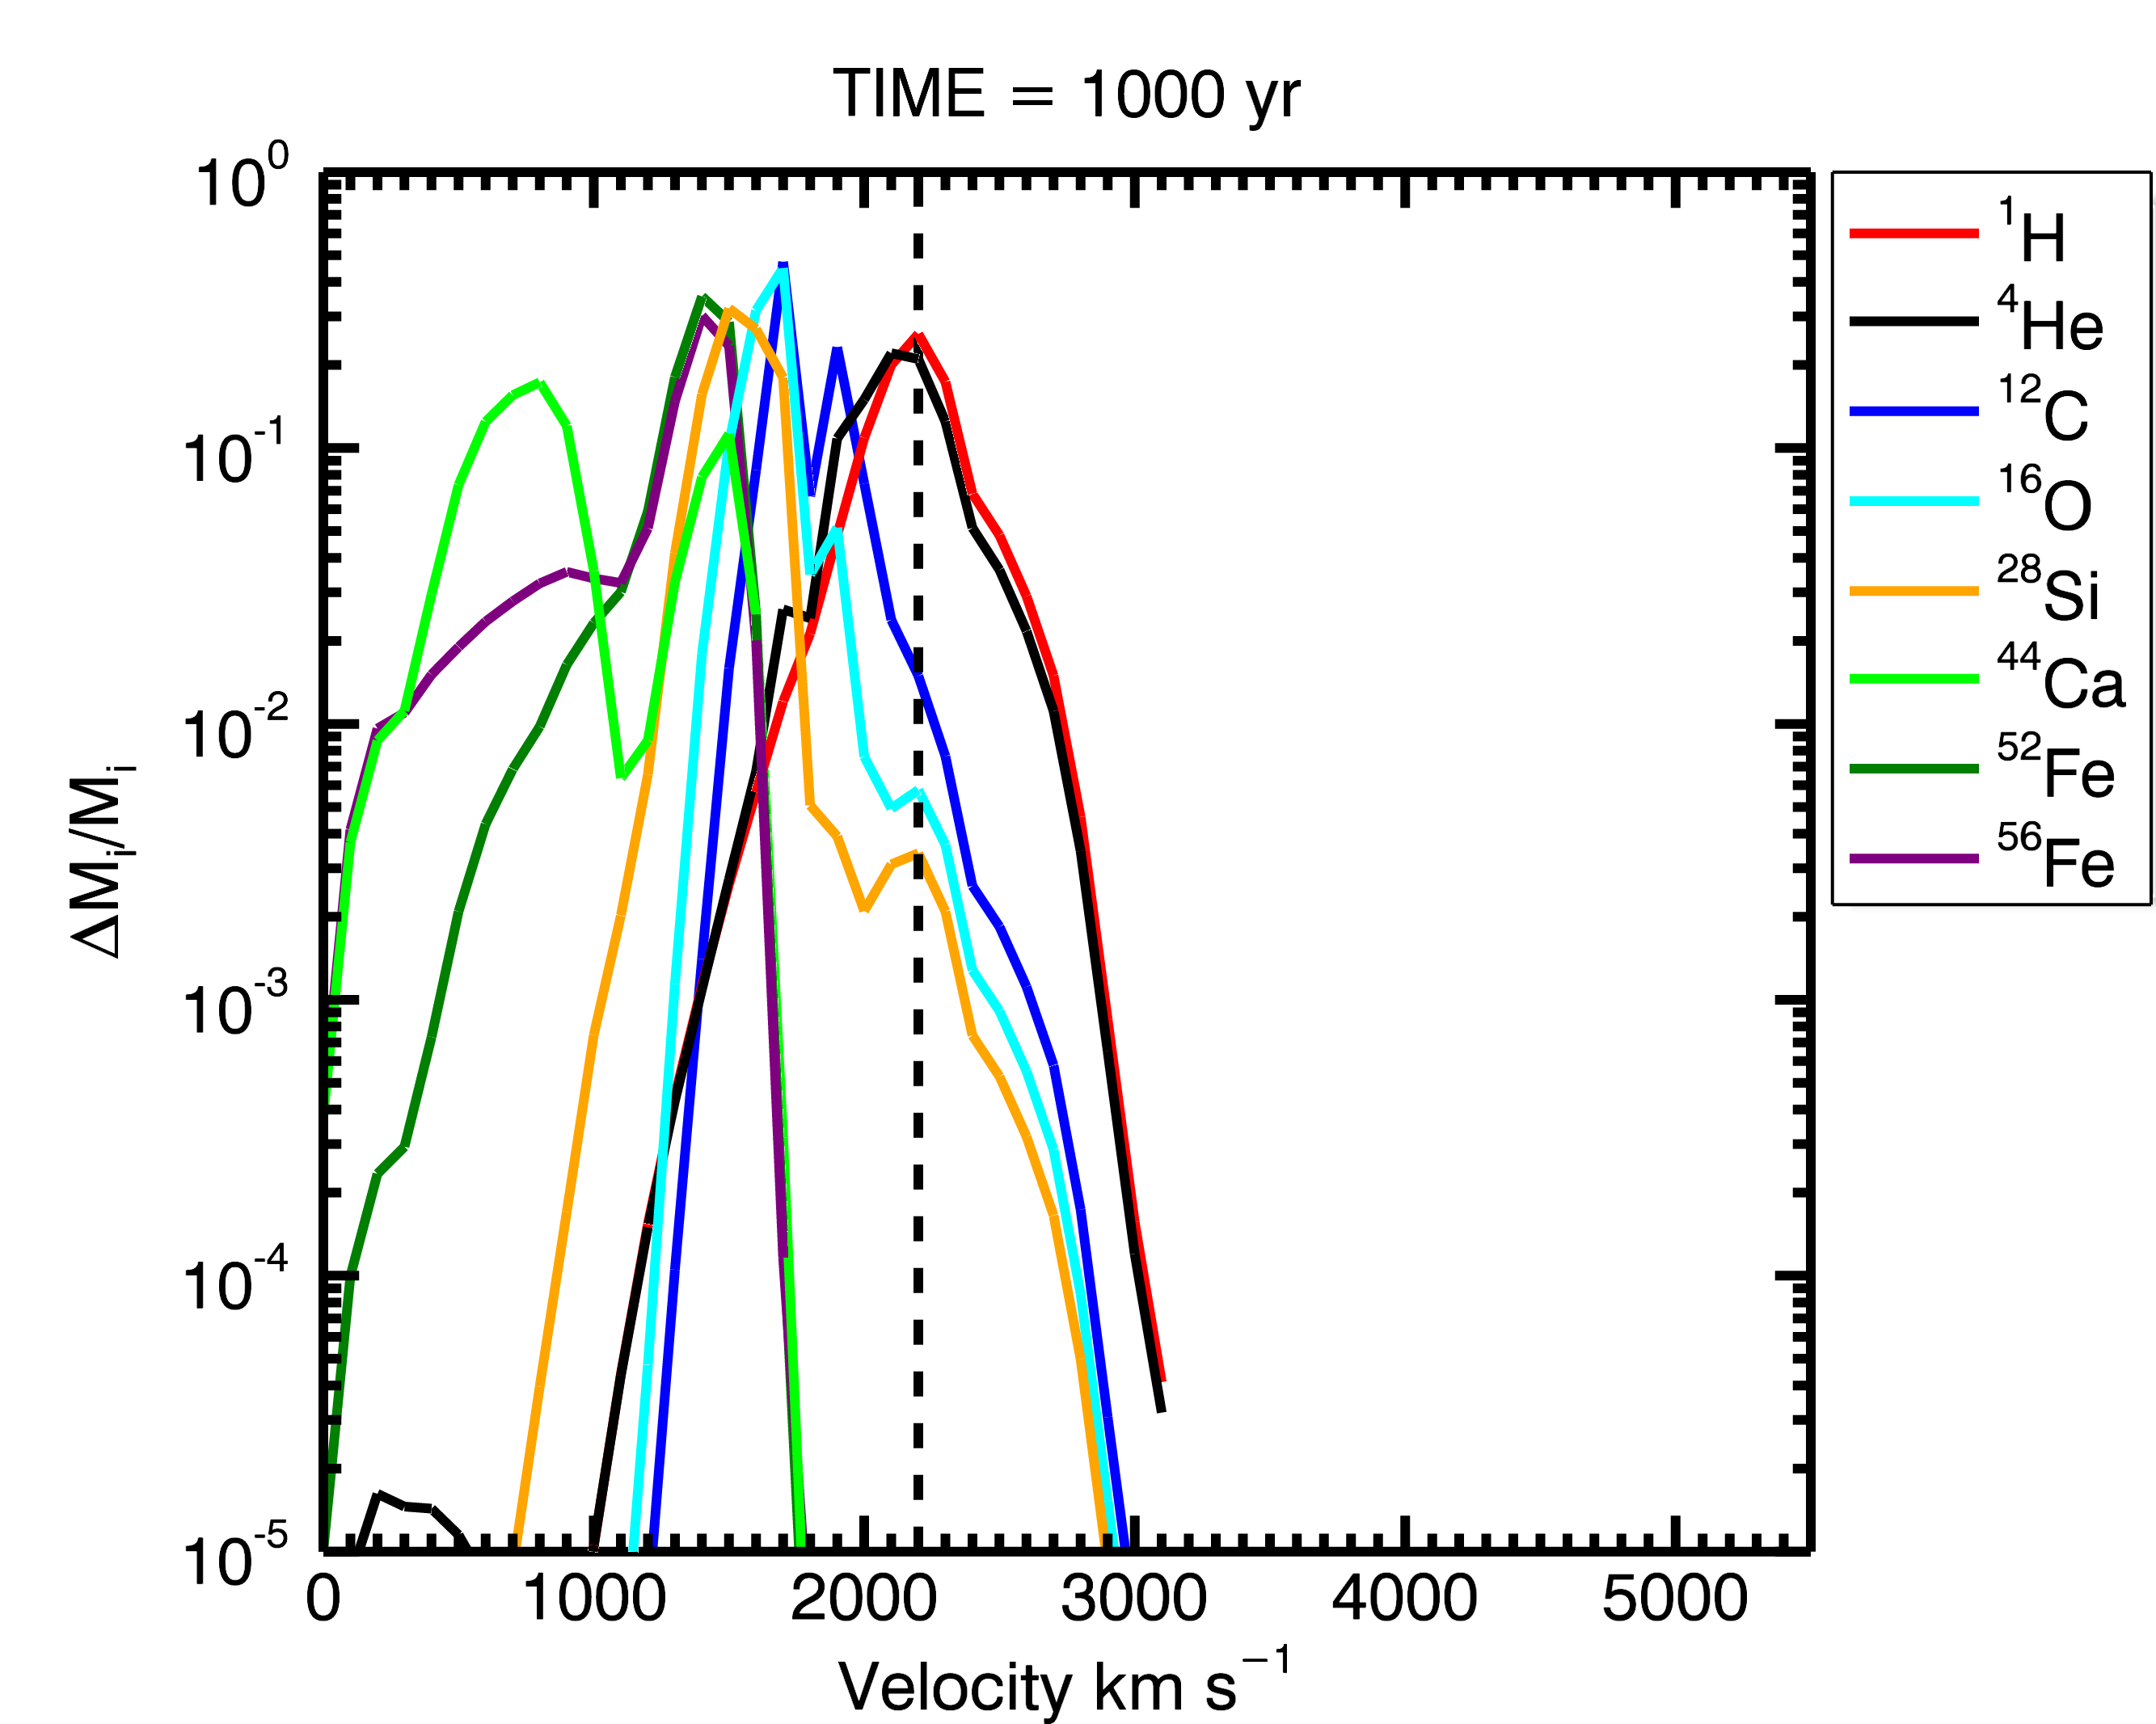
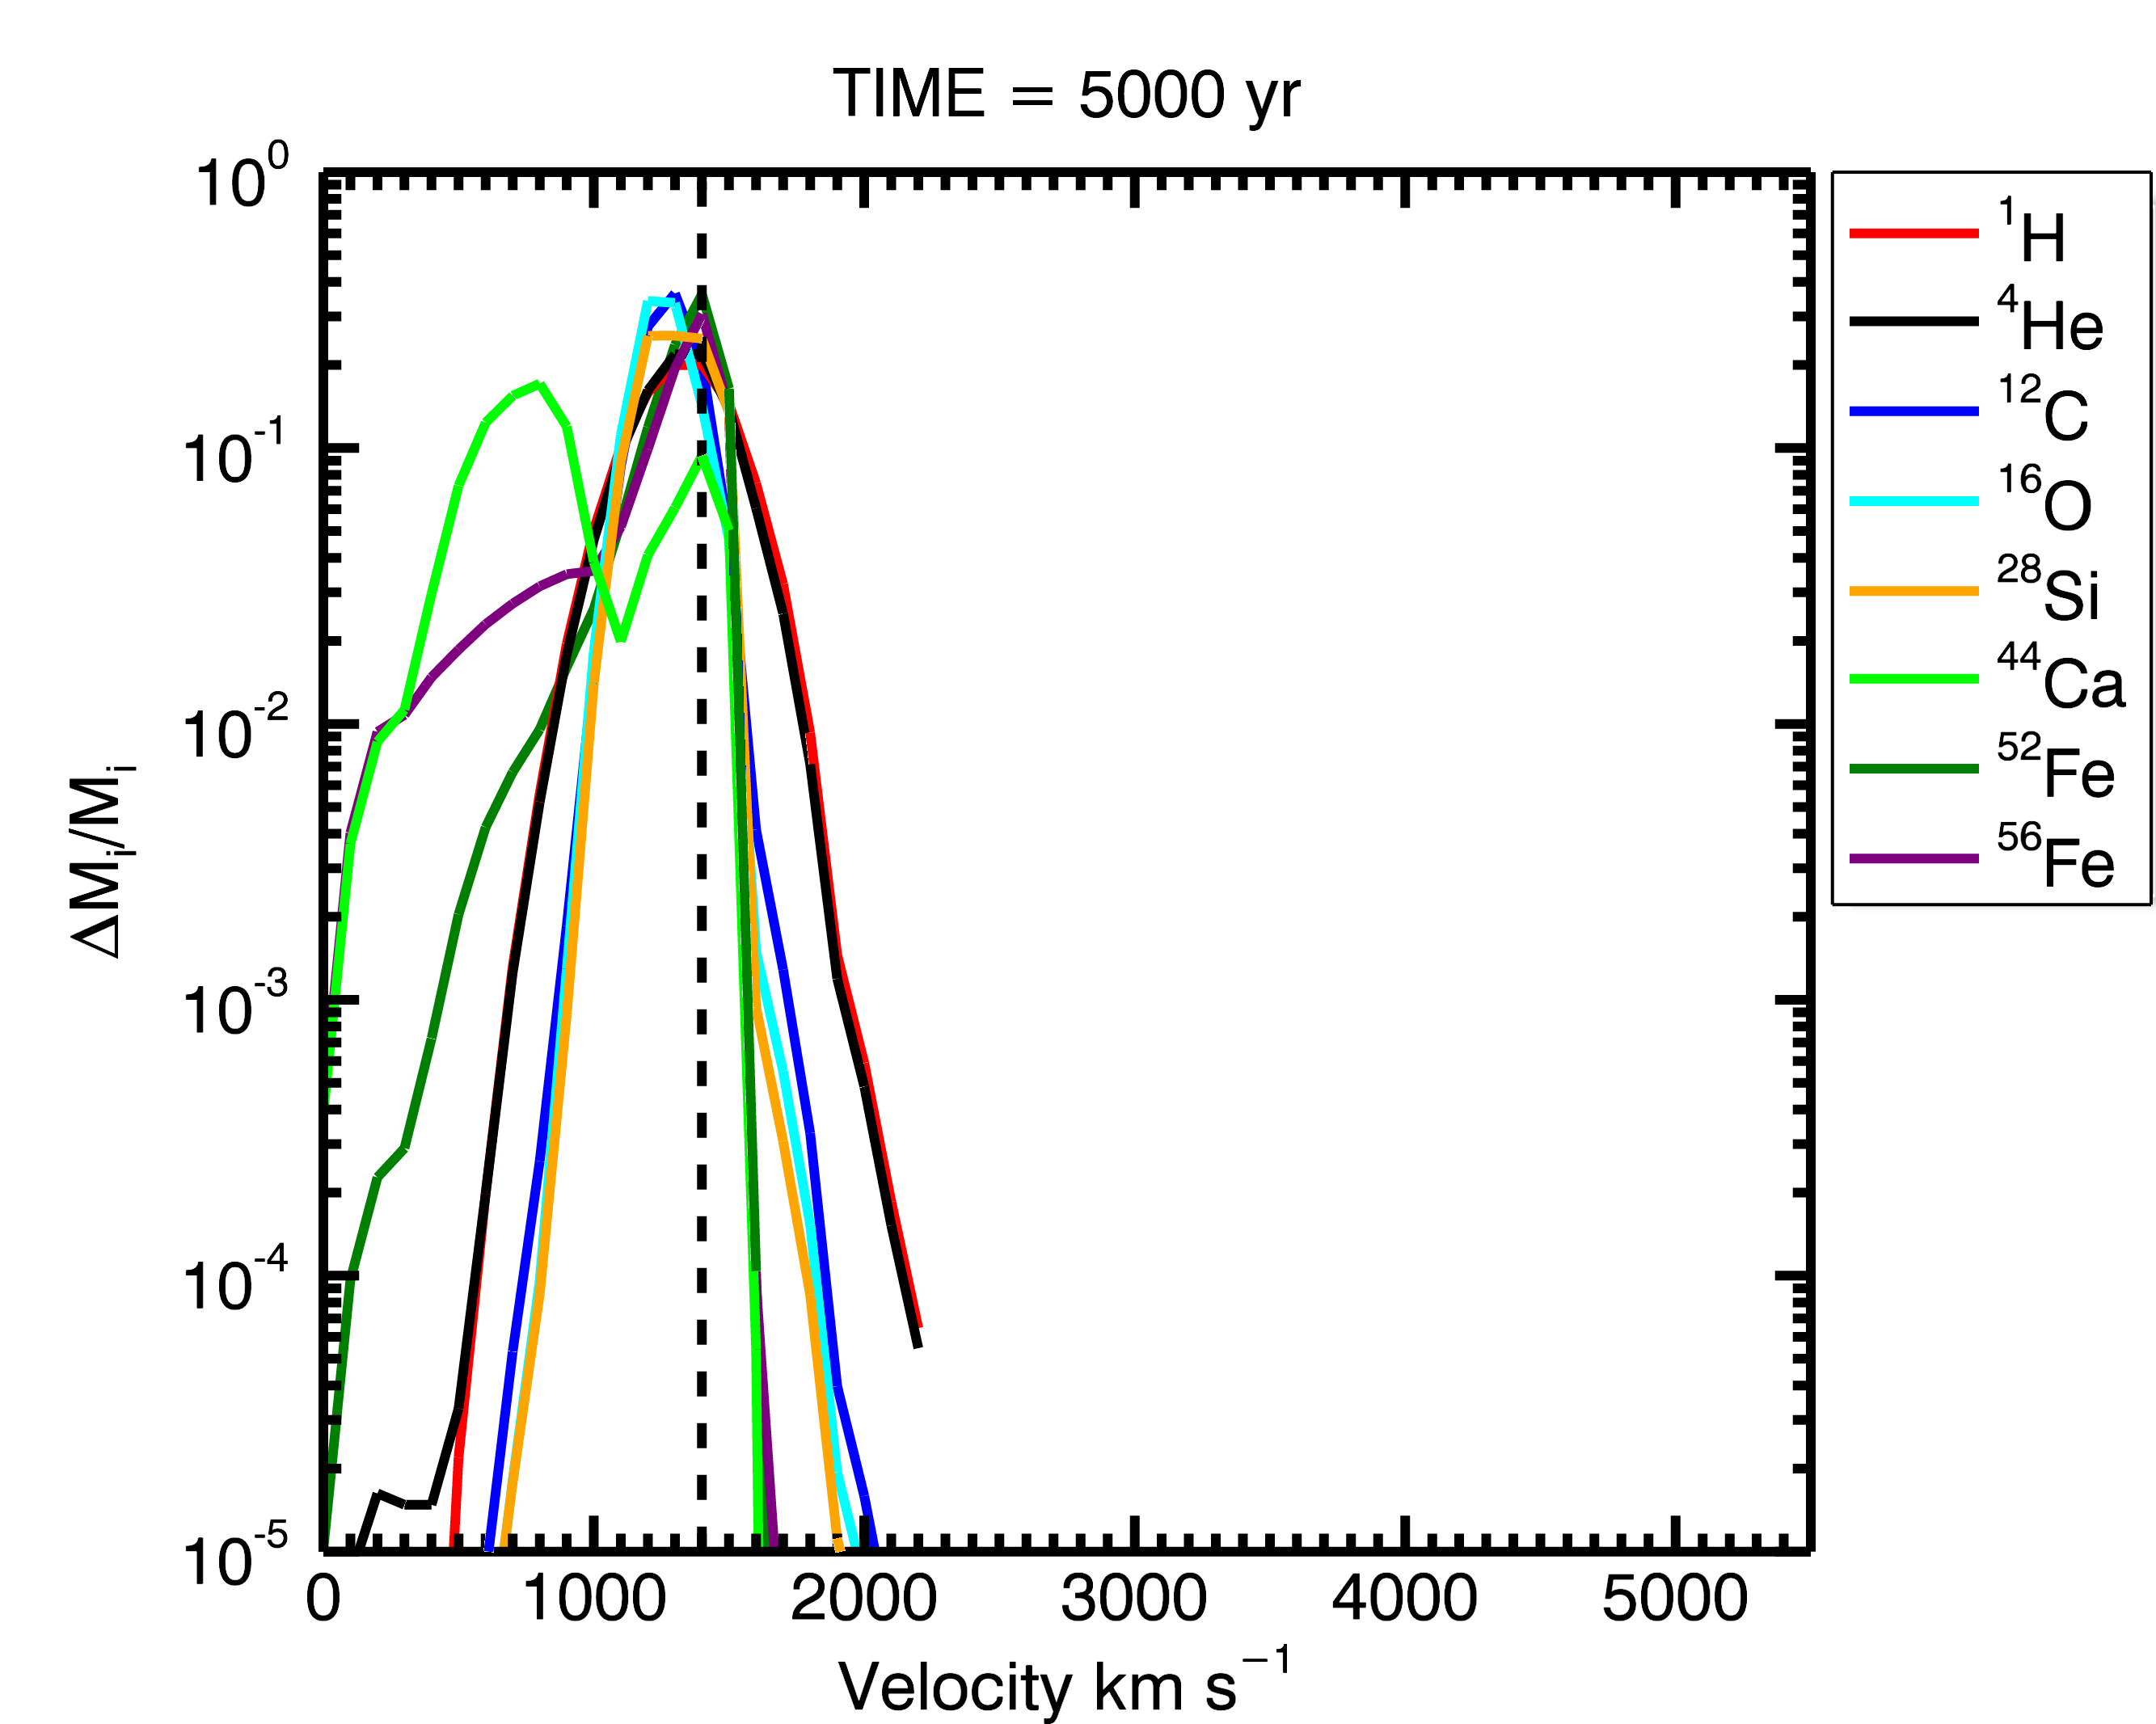
Figure 4 displays the ejecta mass distribution of selected elements versus the radial velocity, at different epochs during the remnant expansion. In the figure, is the mass of the -th element in the velocity range between and , and the velocity is binned with km s-1. The mass distribution in velocity space of 56Fe, 44Ca, 28Si, 16O and 12C, at the beginning of the simulations, are shown in the top left panel of Fig. 4. The elements appear stratified: 56Fe is concentrated in the slower and innermost part of the ejecta, approximately at of the radius of the initial remnant, inside the dense shell seen in the density distribution in Fig. 2, along with the other heavy elements (as 44Ca). 28Si envelopes the inner 56Fe, whereas 16O and 12C are prominent at the bottom of the 4He shell. The outer half of the radial ejecta distribution is dominated by 4He and 1H.
Looking at the mass distribution of the selected elements at various times we observe how the overall composition of the ejecta changes during the remnant expansion (see Fig. 4). The overall structure and composition of the unshocked ejecta, on the time-scale considered, do not change significantly, although some small differences in the innermost layers are present due to some numerical diffusivity of the code. This indicates that the unshocked ejecta expand almost homologously until they start to interact with the reverse shock. This is shown in Fig. 4, where the profiles of the elements with velocity km s-1 stay almost unchanged at all epochs. In the unshocked ejecta, we observe a large fraction of 56Fe and 44Ca, together with the low-velocity tail of the 28Si distribution. Instead, the profiles of the elements at a greater distance from the centre of the explosion, i.e. the elements with high-velocity components, are strongly influenced by their interaction with the reverse shock and the CSM. These elements are strongly decelerated in the intershock region and consequently mixed by HD instabilities. This produces a homogenization of the different profiles in these regions: the overall shapes of the high-velocity tails of the mass distributions of shocked elements are more similar to each other and characterized by steep slopes, suggesting a significant mixing between layers of different chemical composition due to HD instabilities developing at the contact discontinuity (see also Wongwathanarat et al. 2017 for the effects of HD instabilities on the mass distribution versus the radial velocity).
Nevertheless, it is important to note that the chemical distribution generated during the immediate aftermath of the SN (i.e. the onion-skin chemical layering) is roughly preserved after years of evolution. Thus, for a spherically symmetric SN explosion, it is not possible to reproduce the inversion among the innermost chemical layers (e.g. Wang & Chevalier 2002; Wang 2011; Orlando et al. 2016) as observed, for instance, in Cassiopeia A (e.g. Hughes et al. 2000), if the ejecta are characterized only by small-scale clumping.
3.2 Effect of a large-scale anisotropy
As seen in Section 3.1, the ideal case of a spherically symmetric explosion cannot reproduce the complex morphology of an evolved SNR, in good agreement with the fact that most of the CC-SNe are believed to explode asymmetrically (Maeda et al., 2008; Wongwathanarat et al., 2013; Janka et al., 2016; Janka, 2017; O’Connor & Couch, 2018; Burrows et al., 2019). The physical characteristics of the SN explosion generate asymmetric expansion and strong inhomogeneities that have a complex influence on the evolution of the SNR. Here we consider a possible example of a dynamical event that can cause strong mixing and overturning of the chemical layers in the ejecta. We studied the effects of a post-explosion anisotropy generated soon after the shock breakout. Multiwavelength observations have shown the presence of clump structures in the ejecta of CC SNRs (Aschenbach et al., 1995; Miceli et al., 2008; García et al., 2017; Park et al., 2004; Katsuda et al., 2008; Fesen et al., 2006). We model the anisotropy as a spherical clump of radius , with its center located on the axis, at a distance from the origin, as explained in Sect. 2.3.
As shown in Table 1, we explored the case of a clump located either at or at , corresponding to the initial 56Fe-rich internal layer and between the 56Fe- and 28Si-rich layers, respectively (see the top left panel in Fig. 4).
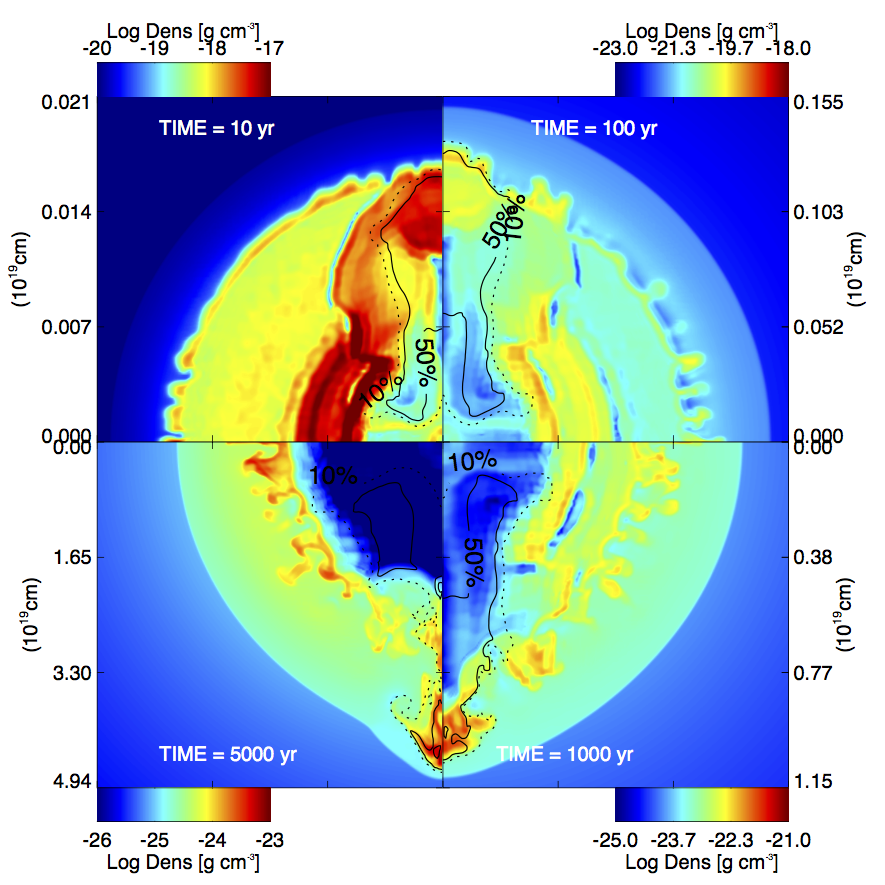
Right panel of Fig. 3 shows a 2D cross section through the () plane of density distribution of model Fe-R5-D750-V6 at four different evolution times (but qualitatively the overall evolution is similar for all the cases explored). The top left quadrant shows the system years after the beginning of the simulation, when the clump has already overcome the dense shell initially located at about of the radius of the ejecta and the topmost part of the clump has reached the reverse shock. At this stage, the clump has an elongated structure along the z-axis, from the central region of the remnant to the reverse shock. Only the head of the clump is still significantly overdense with respect to the surrounding ejecta. The top right quadrant shows the system at years. The clump has not changed its morphology, but its topmost part interacts with the intershock region. RT instabilities start to develop at the interface between ejecta and shocked CSM. After years of evolution (bottom right quadrant) the part of the clump in the intershock region is partially eroded by the HD instabilities, while the passage of the clump has left a low-density-strip region in the inner part of the ejecta. This phase lasts 2000 years, then the wake behind the ejecta clump is filled in eventually as the pressure gradient drives lateral expansion of the ejecta to fill the void. For model Fe-R5-D750-V7 and Si-R5-D600-V4 we found that at years, the clump reaches a velocity of km s-1, similarly to what was found very recently for the runaway knot in N132D ( km s-1, Law et al. 2020). The bottom left quadrant shows the clump at years and it is possible to see the characteristic supersonic bow shock of the clump protruding beyond the SNR forward shock. At this evolutionary stage, the low-density region has been filled by the surrounding material. An exception to this trend is represented by models Fe-R5-D750-V3 (see Fig. 5) and Fe-R5-D500-V3. In these two cases, the clump penetrates into the high-density shell without overcoming it, remaining stuck inside it. In this case, the clump expands together with the surrounding ejecta and, eventually, it is completely fragmented by the interaction with the reverse shock.
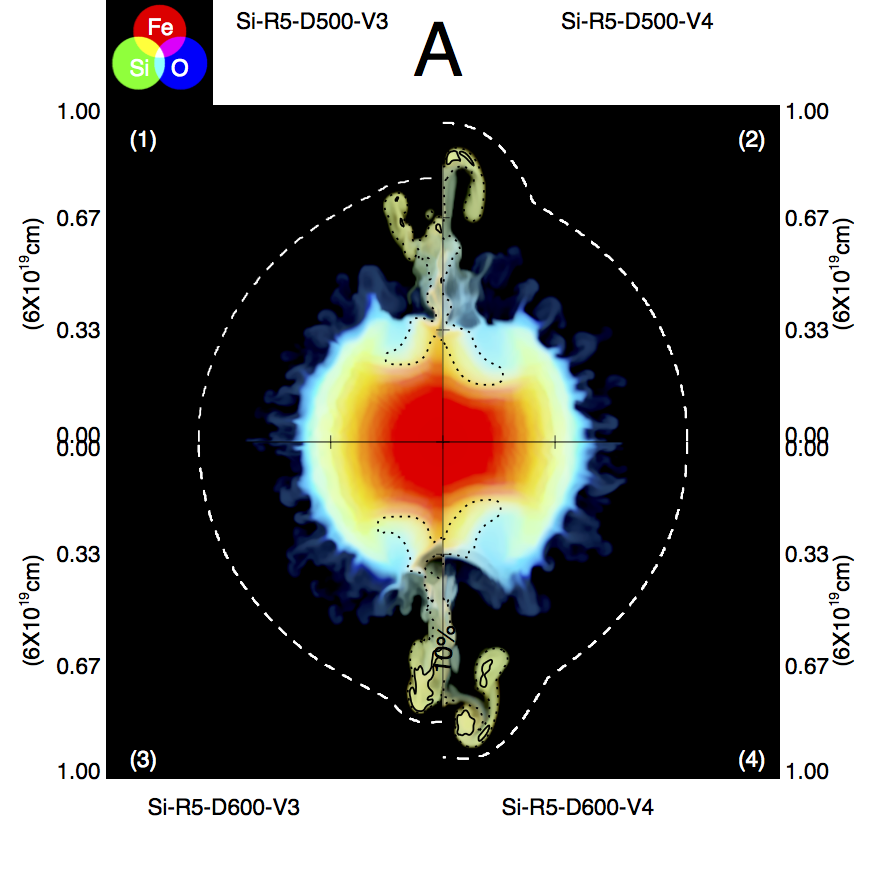
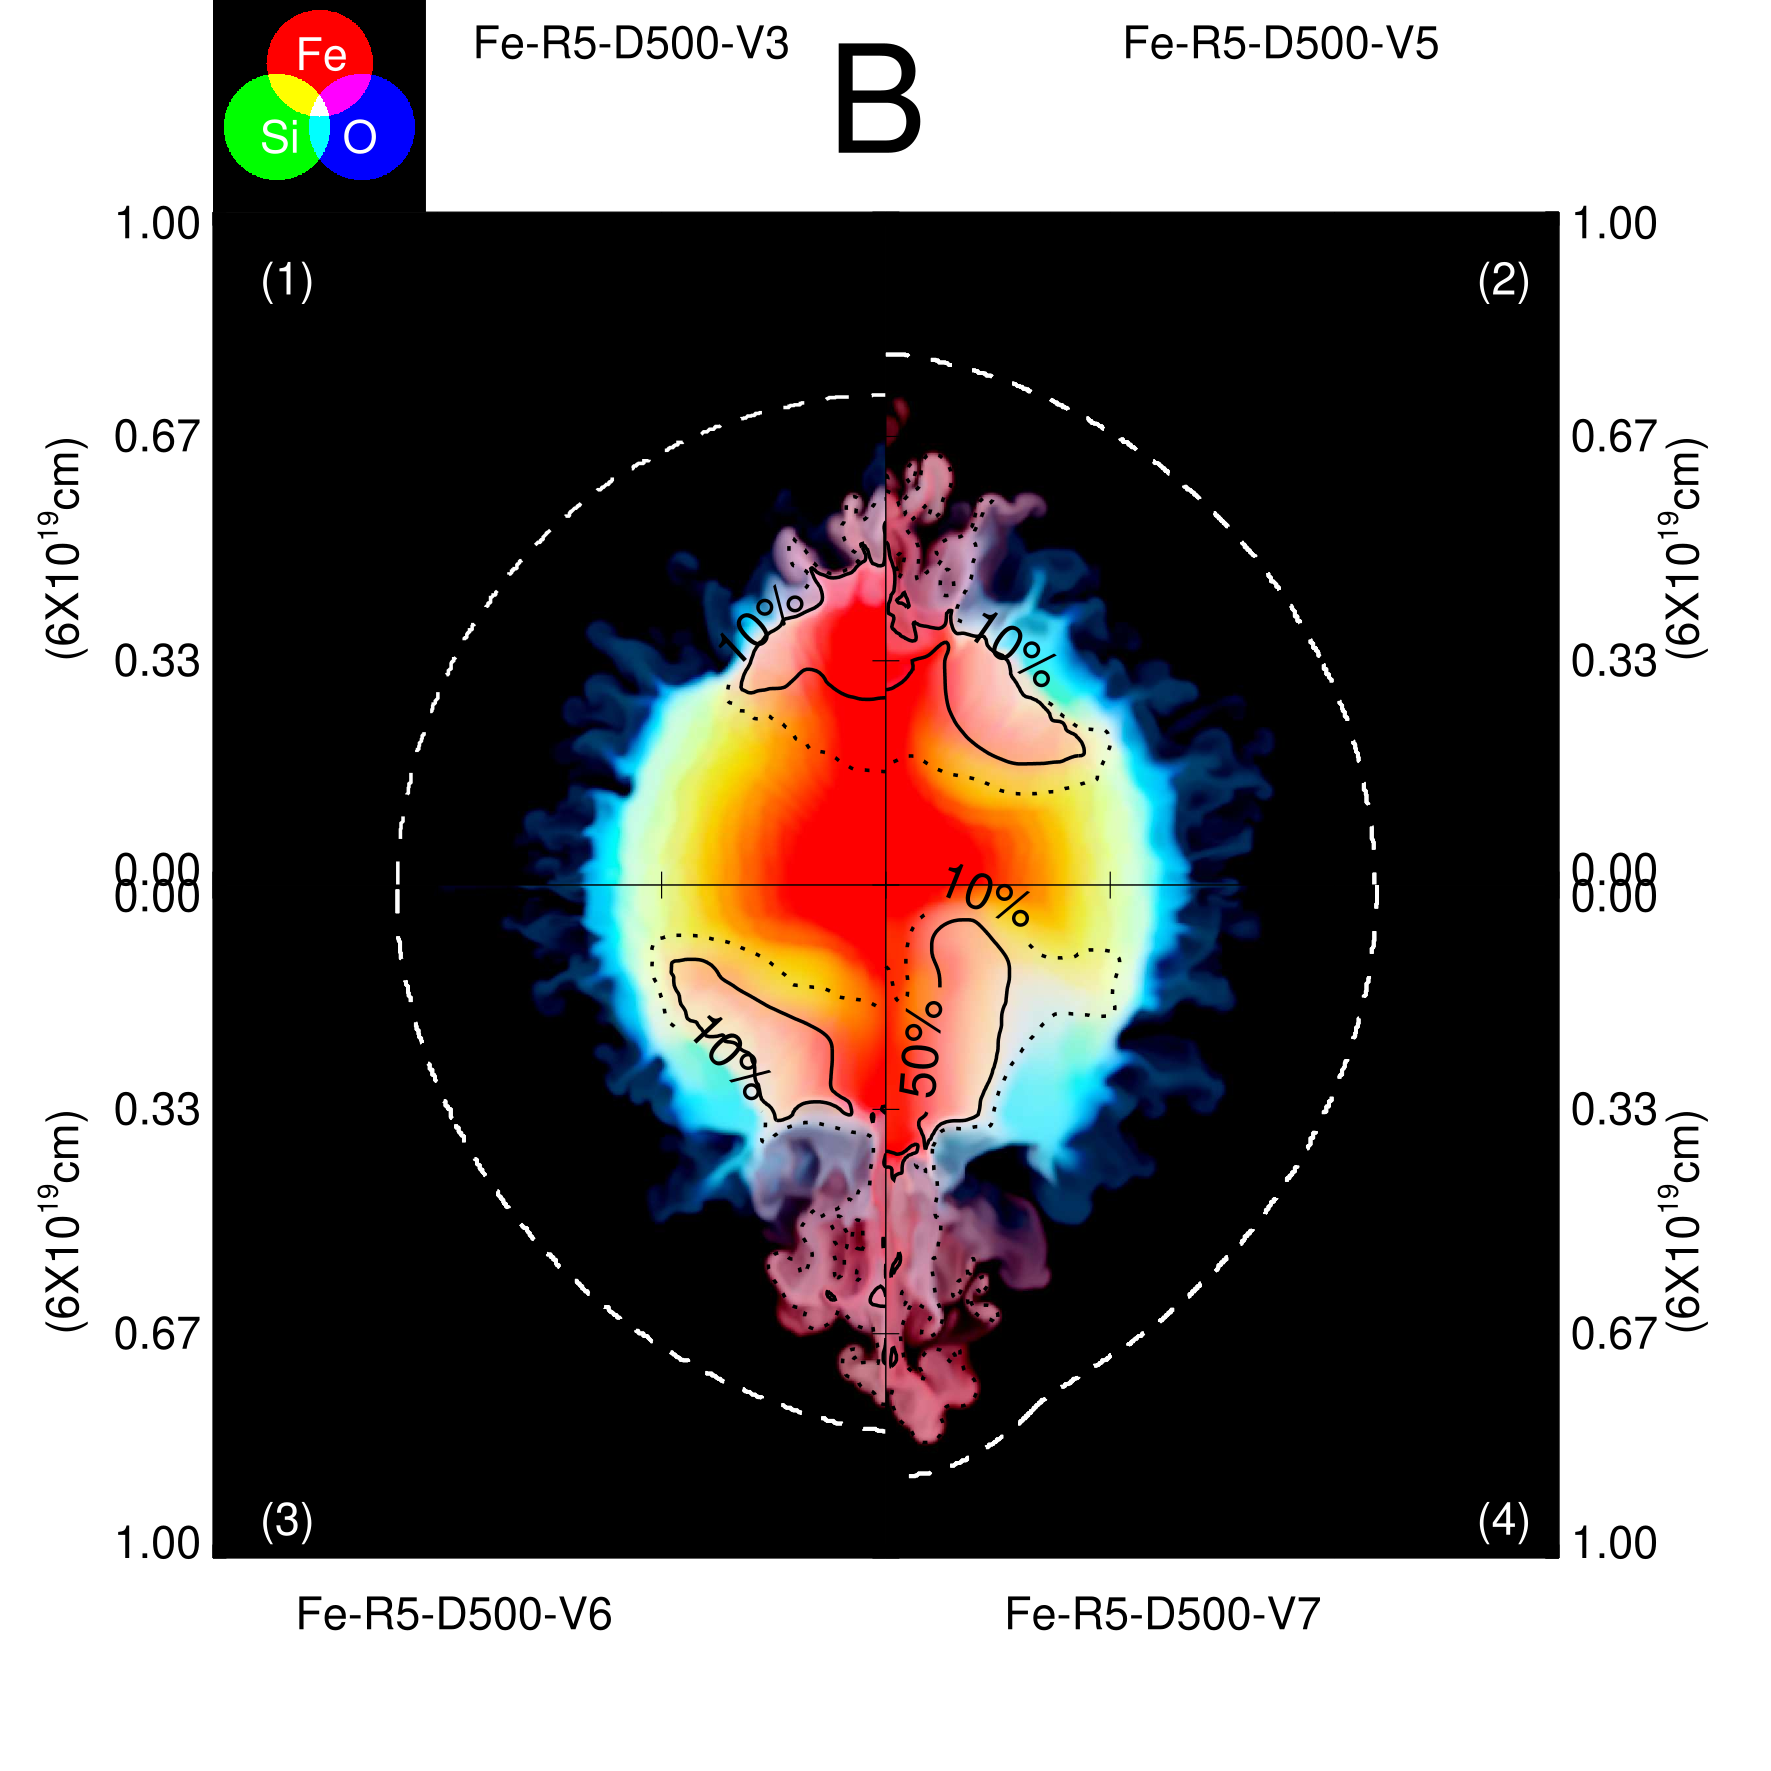
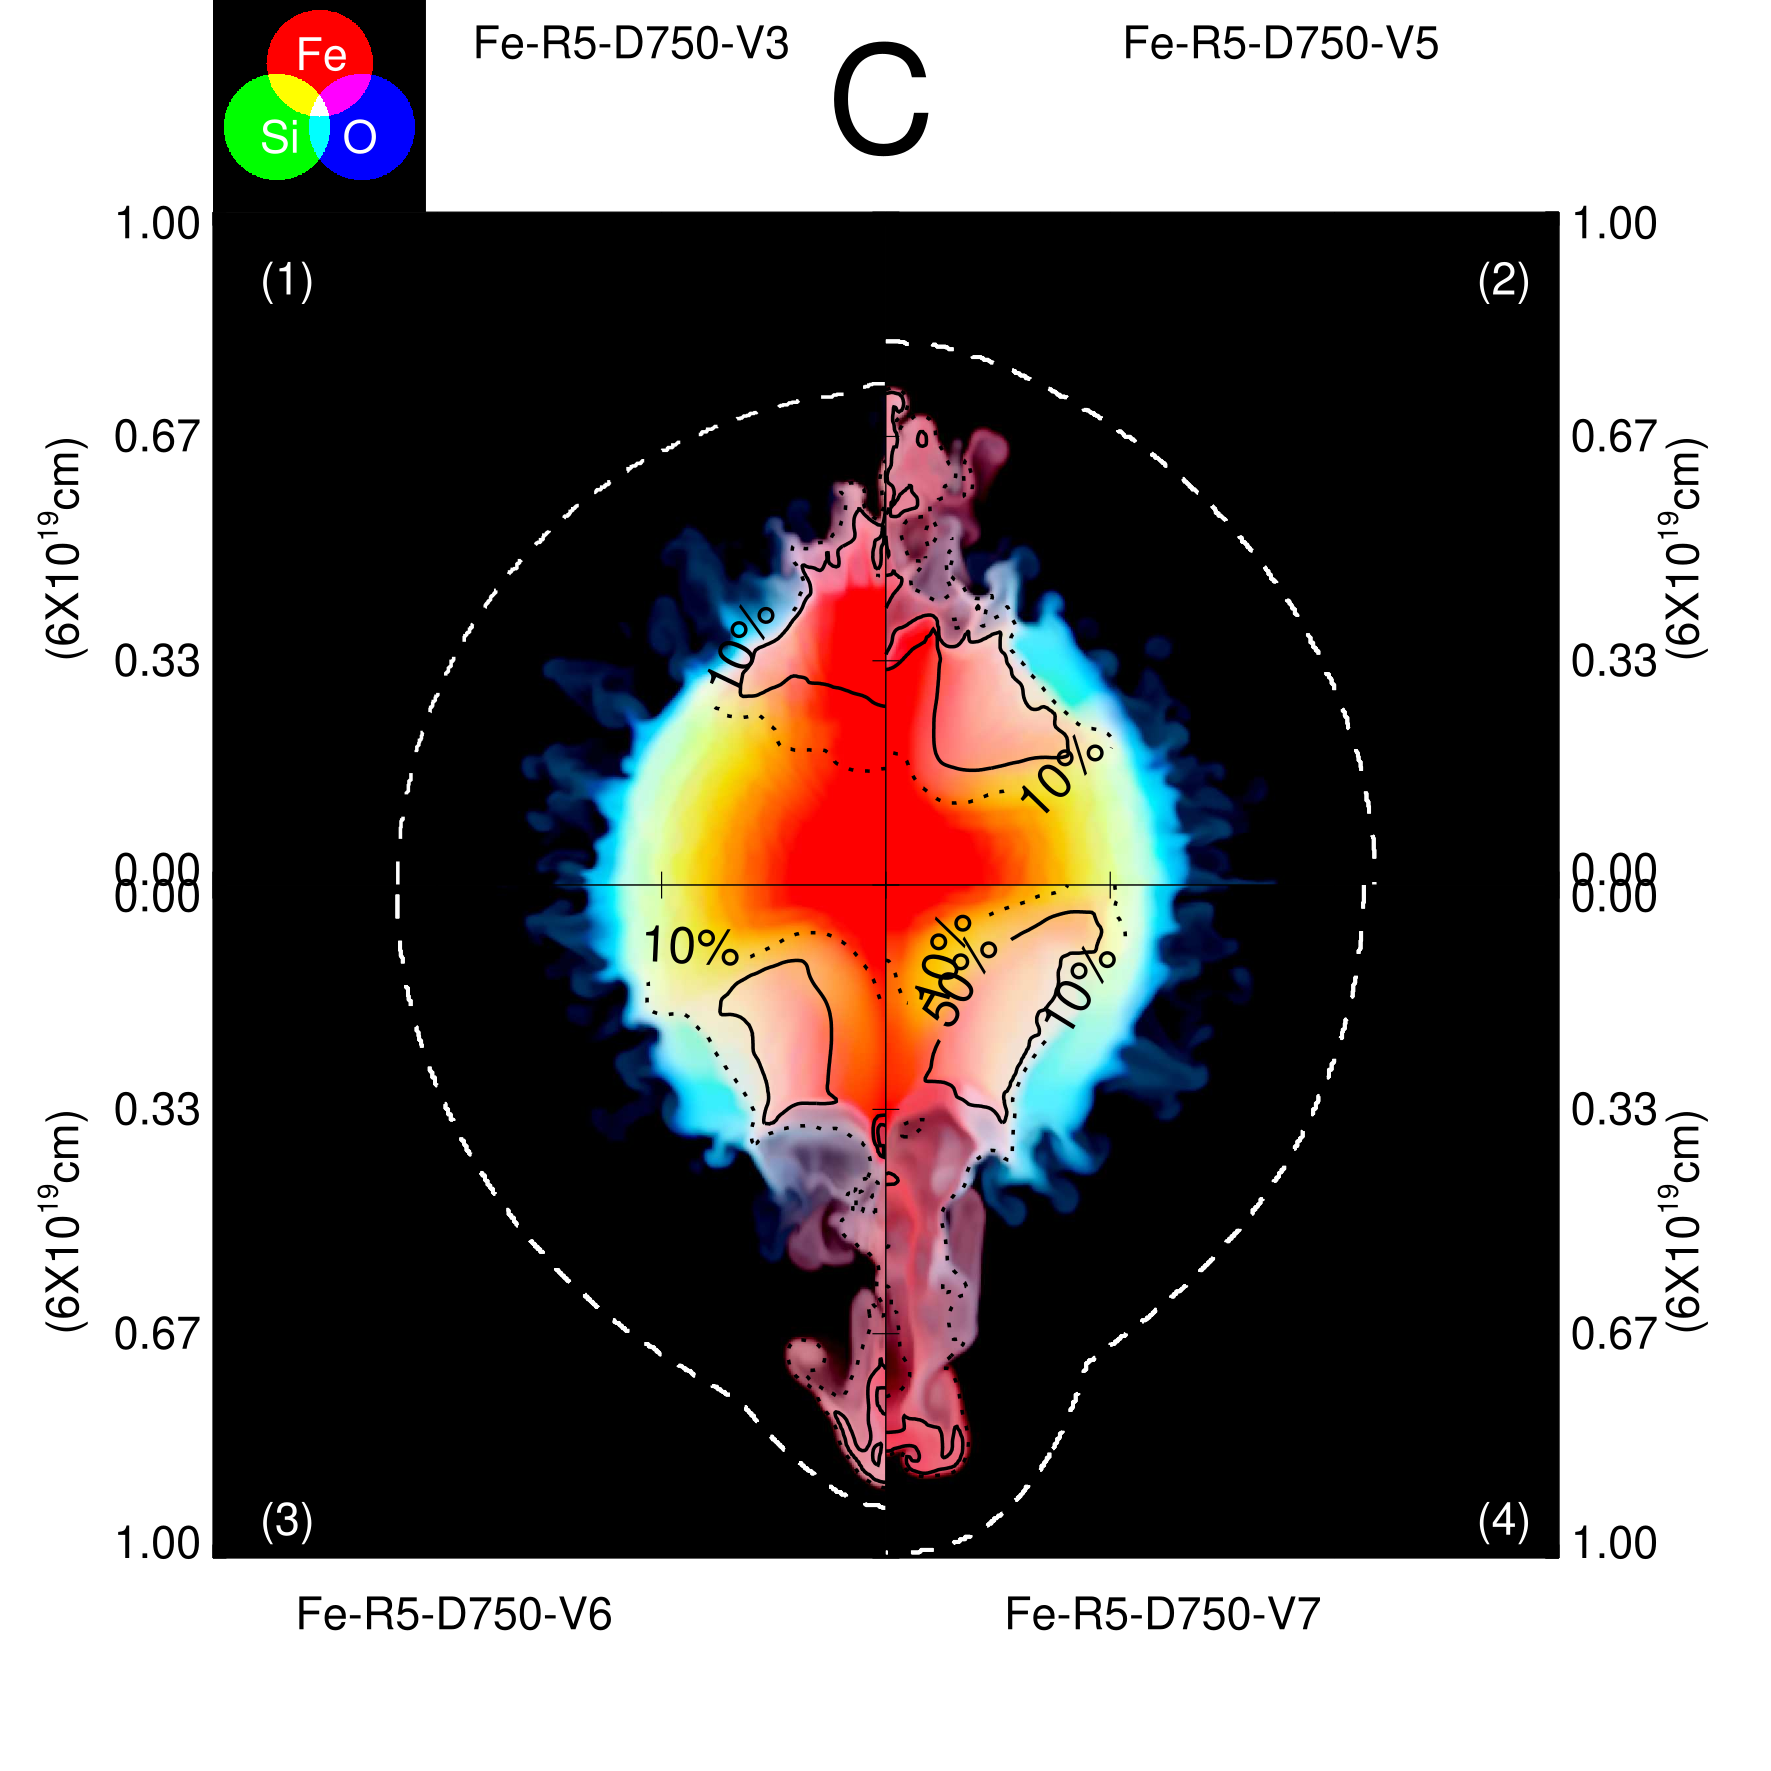
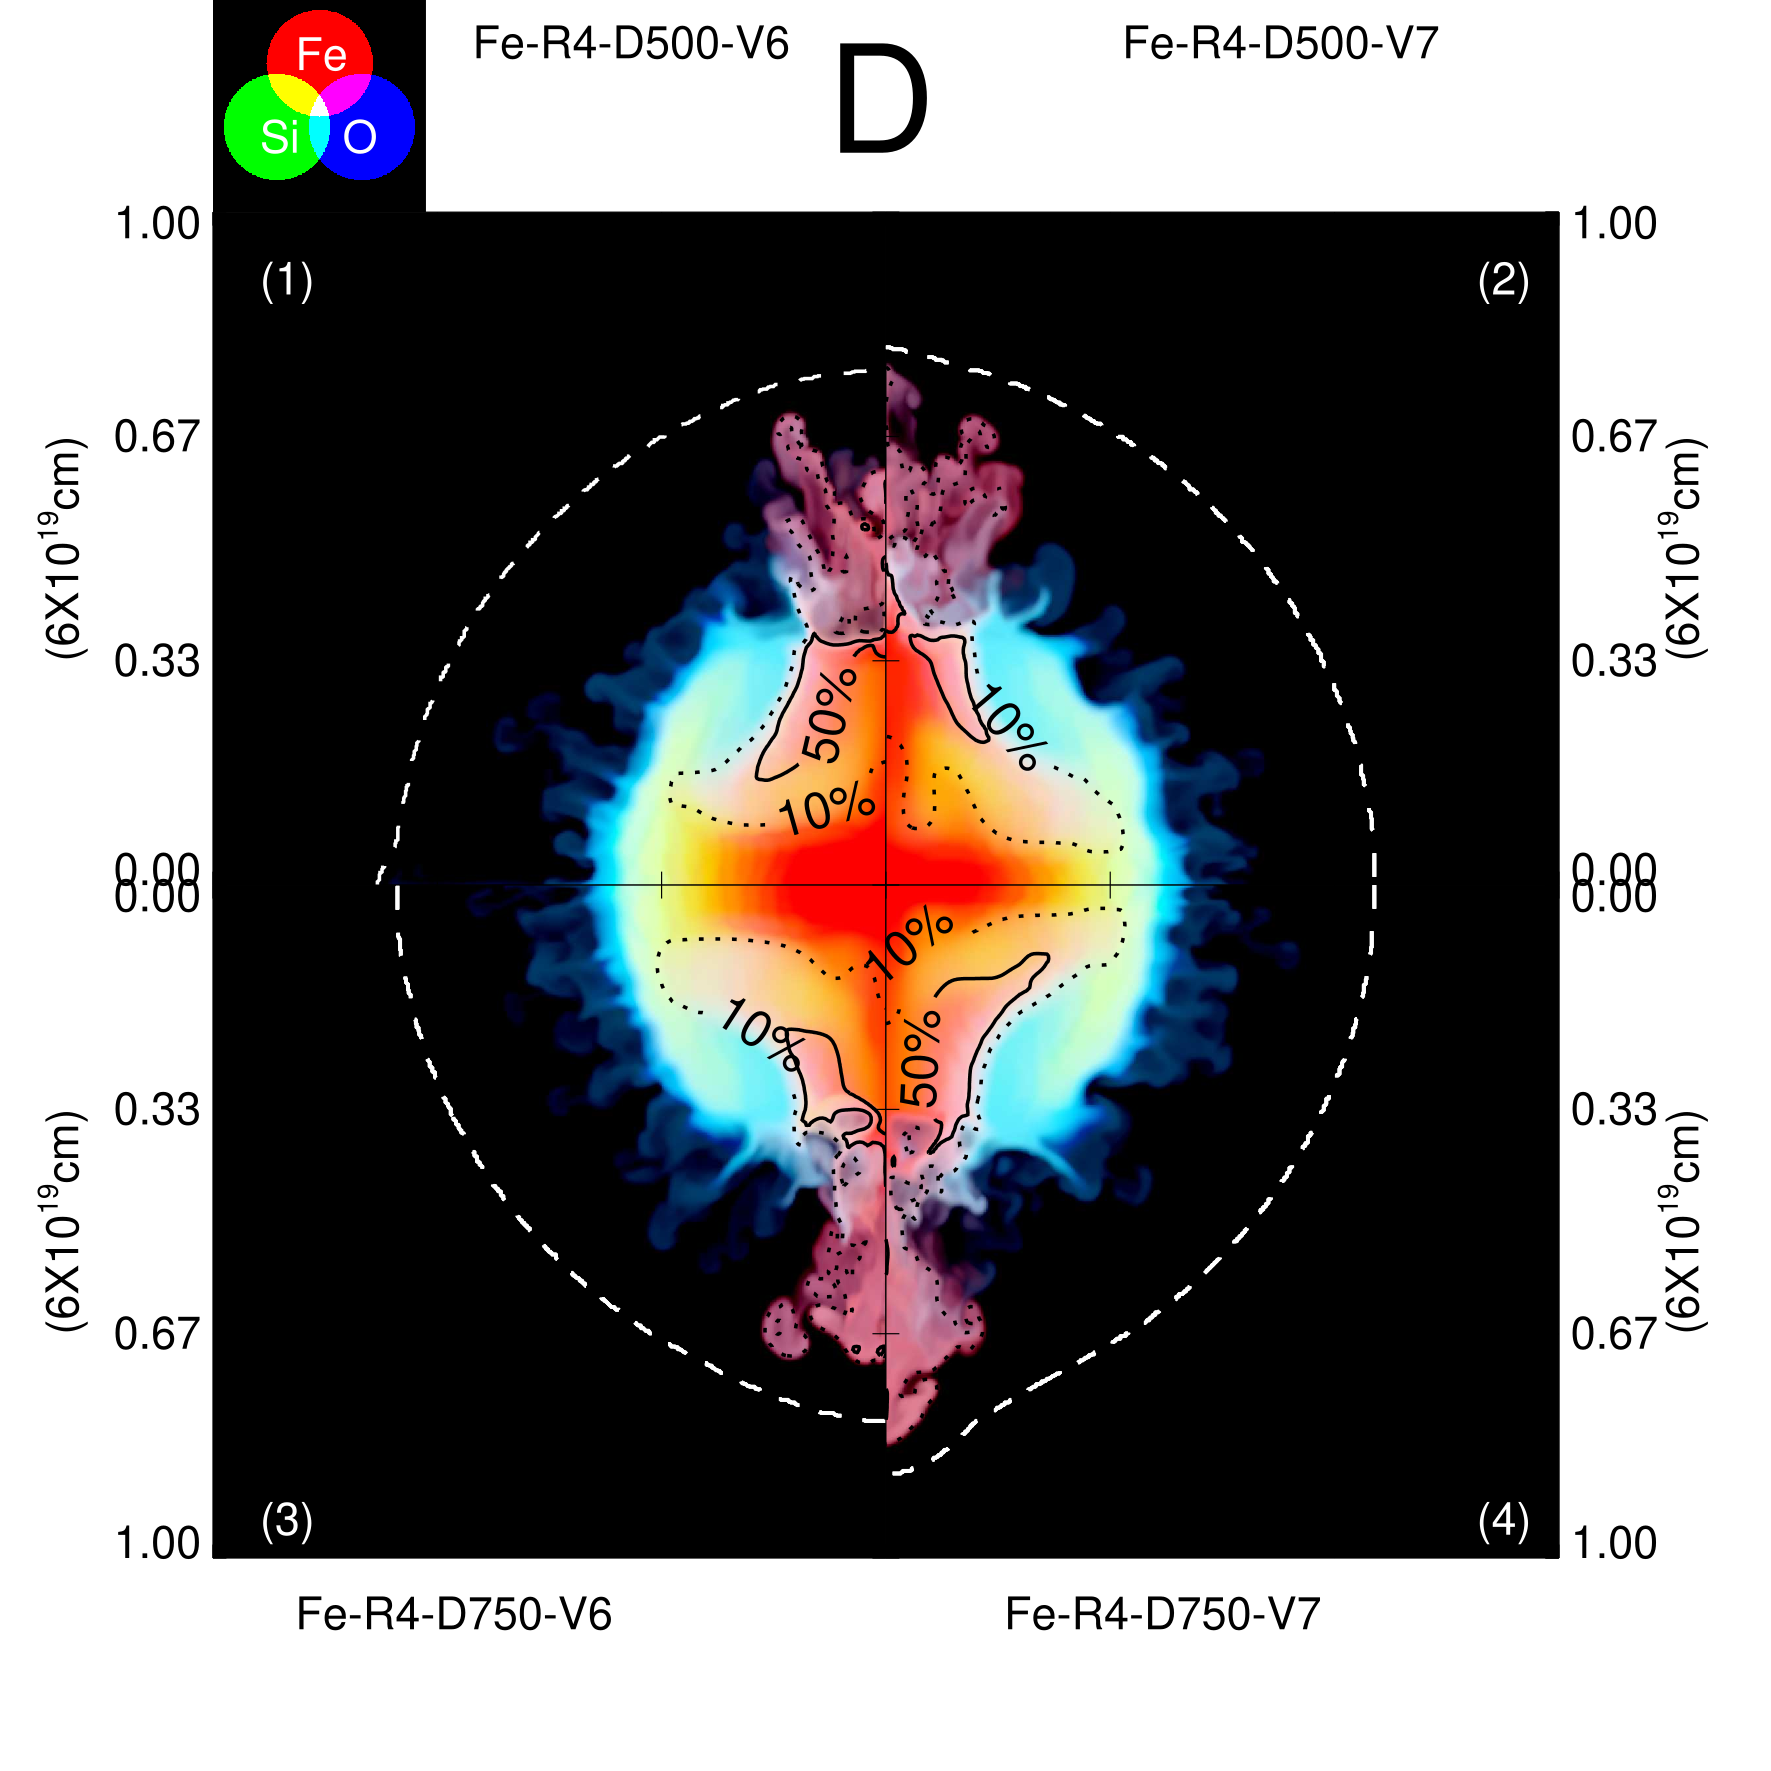
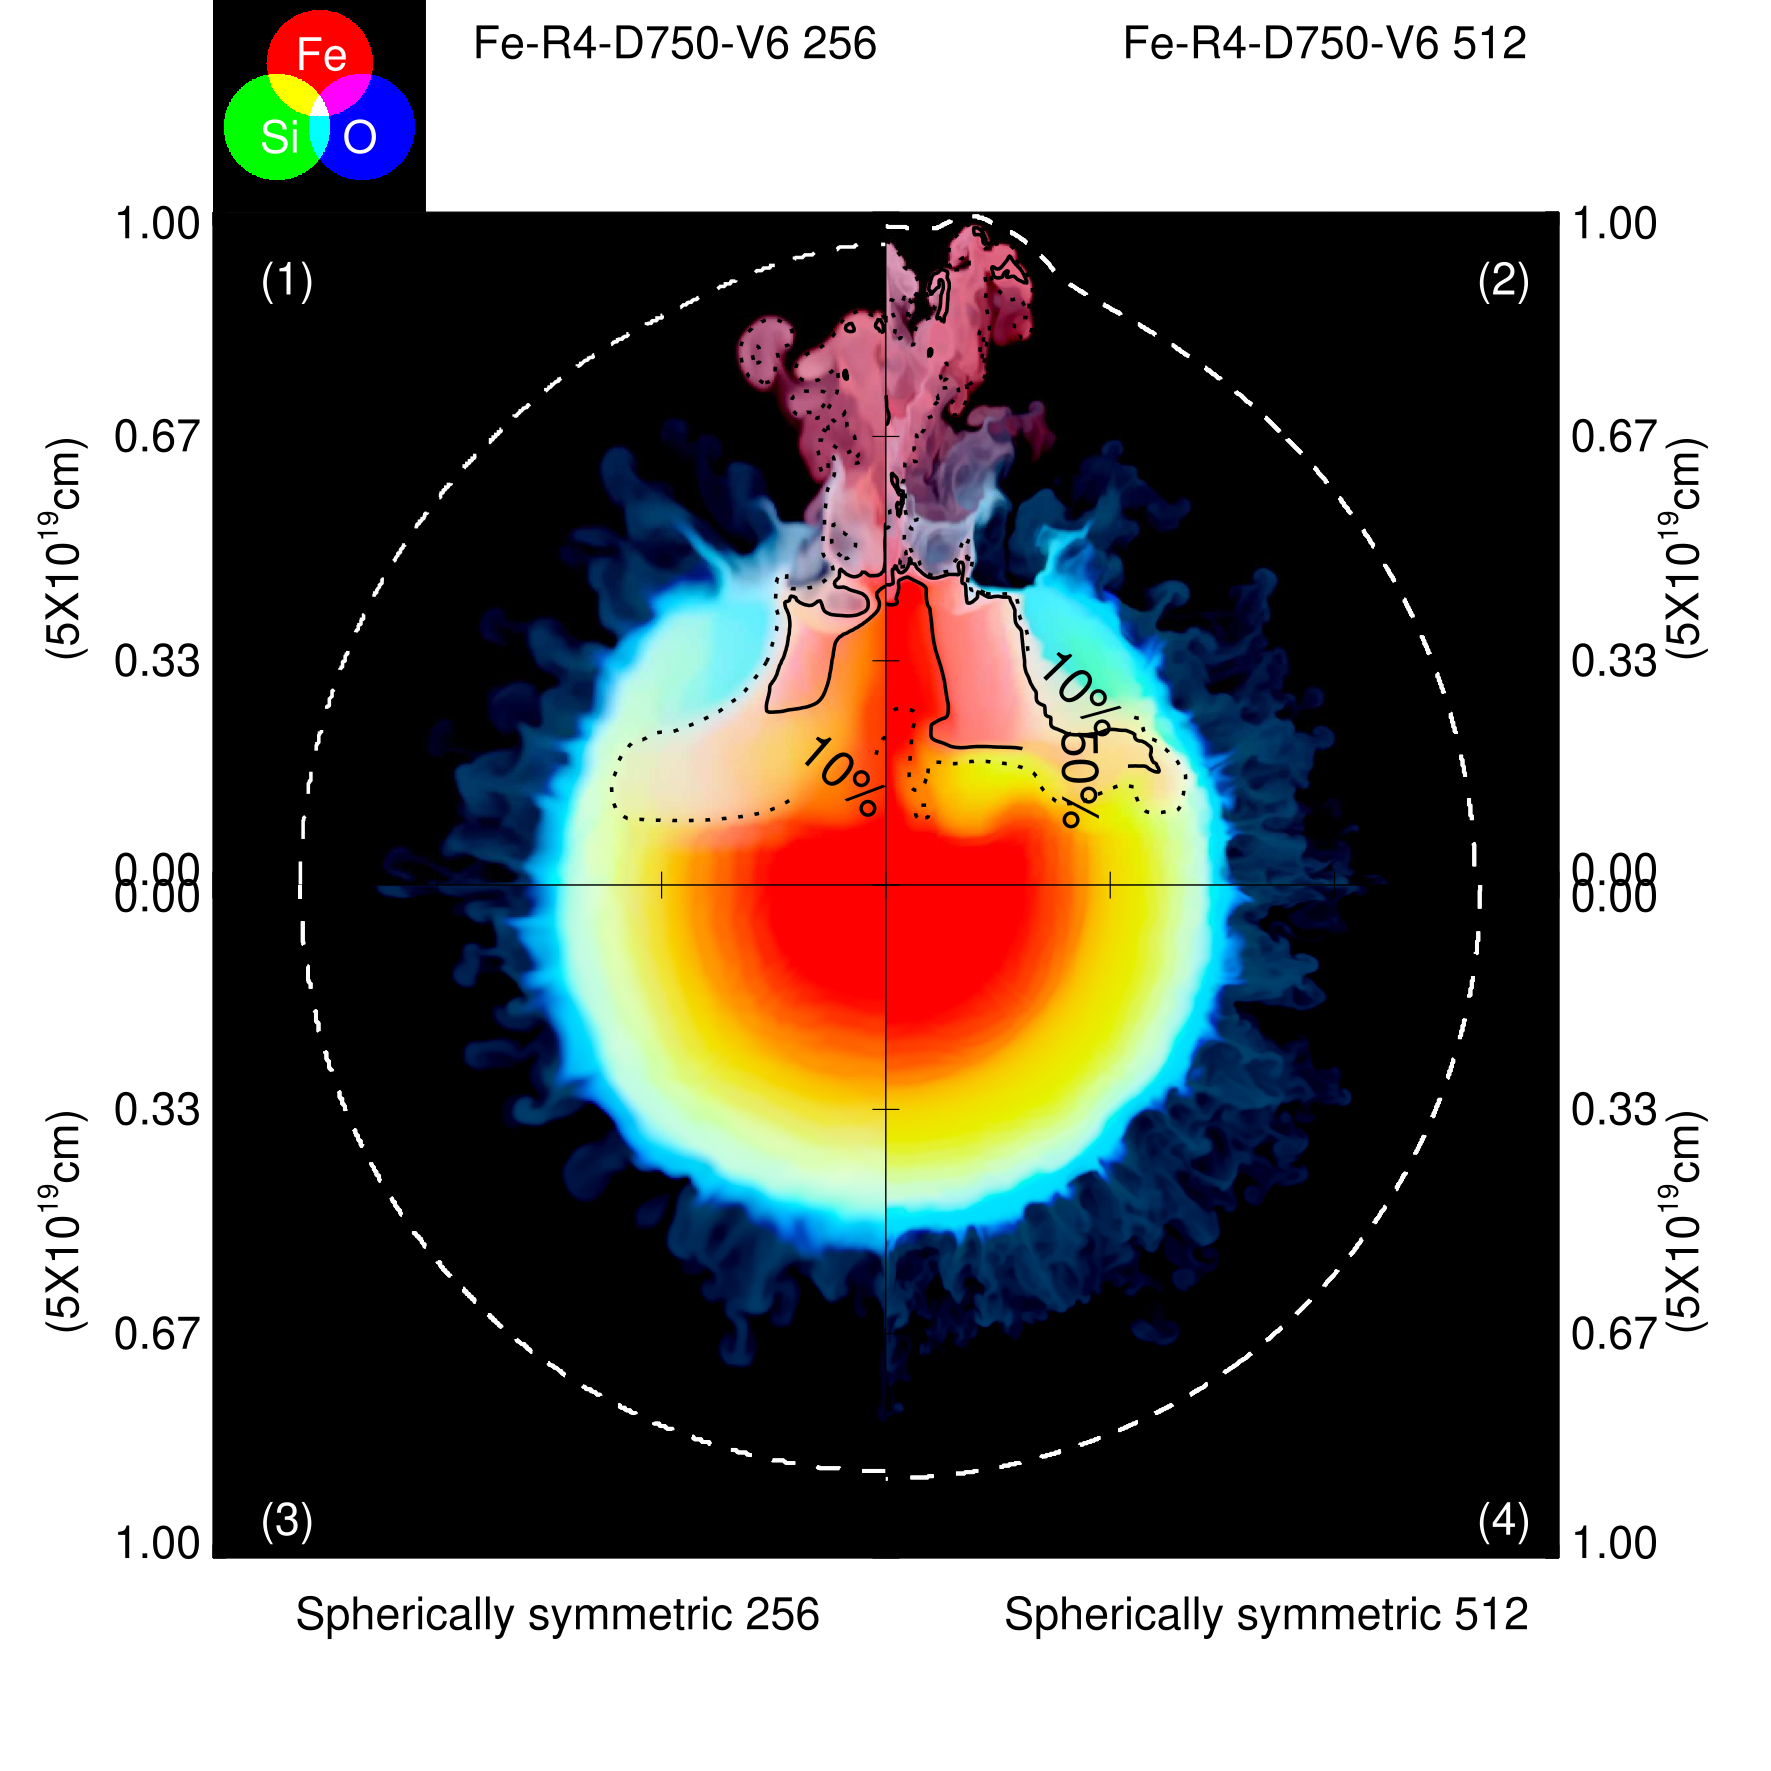
Fig. 6 (see also online Movie 3, 4, 5 and 6) shows the spatial distribution of 56Fe (red), 28Si (green) and 16O (blue) in the remnant’s ejecta at yr for different model setups (see Table 1). Fig. 6A shows four models in which the large-scale clump is initially located at , i.e. between the 28Si and the 56Fe shells, with . In each of these cases, the clump can produce a remarkable jet-like structure of 28Si-rich ejecta. This structure protrudes beyond the SNR forward shock in all cases, except for model Si-R5-D500-V3 (Fig. 6A-1). We point out that the 28Si-rich collimated structure has overcome the 16O-rich layer of ejecta at this evolutionary stage. Moreover, we found out that after years, for models Si-R5-D500-V4 (Fig. 6A-2) and Si-R5-D600-V4 (Fig. 6A-4), this Si-rich jet-like structure has already overcome the 16O layer, a similar feature observed also in the northeast and southwest regions of Cassiopeia A (e.g. DeLaney et al. 2010; Milisavljevic & Fesen 2013).
Our simulations show that a velocity contrast is necessary to allow the clump to overcome the high-density shell. The length of the jet-like feature depends on the initial density contrast of the clump, as it can be seen in quadrant (1) of Fig. 6A (, ), where the position of the bow-shock of the clump has its lowest value ( cm; pc) among the cases here considered. The shape of the jet-like structures appears somehow ”curly”, with the exception of Si-R5-D600-V3 (quadrant 3 of Fig. 6A) that has a more regular shape and is more collimated along the z-axis. The clump has been strongly eroded at this time.
The final distribution of 56Fe, 28Si and 16O in the remnant in the case of (clump entirely made of 56Fe) and is shown in Figs. 6B, C. In both cases the clump produces a 56Fe-rich region along the z-axis, extending from the center of the remnant to the intershock region where it mixes with the 16O layer. We found that the clump can protrude the forward shock only if its velocity contrast is , that is a factor of 2 higher than that obtained for . This is because, for , the clump is located in an inner and slower region (due to the ejecta’s linearly increasing velocity profile described in Section 2), therefore a higher velocity contrast is needed with respect to the case with . Moreover, for , the clump is at the inner border of the high-density shell, so the interaction with the shell occurs at the early stages of evolution, when the clump to shell mean density ratio (in the following ) is . On the other hand, for , the clump evolves in a lower-pressure region, therefore the clump undergoes a significant expansion before interacting with the dense shell and at the interaction. This effect causes the clump to struggle to overcome the dense shell, leading to a wider jet-like structure with respect to cases with . We also found that the initial clump size () does not affect the mixing of 56Fe in the outer layers (see Fig. 6D) within the range of values explored.
In the cases explored, we observed that the clump pushes the heavy elements (especially 56Fe and 28Si) into the outer and high-speed regions of the ejecta, as it has been observed in other core-collapse SNe such as SN1987A (Haas et al., 1990; Utrobin et al., 1995), Cassiopeia A (Grefenstette et al., 2014, 2017; Siegert et al., 2015), Vela (García et al., 2017) and, very recently, N132D (Law et al., 2020). According to the exploration of the parameter space we have performed, the average chemical stratification of the ejecta is roughly preserved in regions not affected by the large-scale anisotropy (e.g. x-axis in Fig. 6). In these regions, the evolution of the ejecta is similar to that described in section 3.1 and the forward shock reaches approximately the same distances in all the cases explored (the differences shown in quadrants (2) and (4) of Fig. 6B and C are due to slightly different simulation times, of the order 10 years).
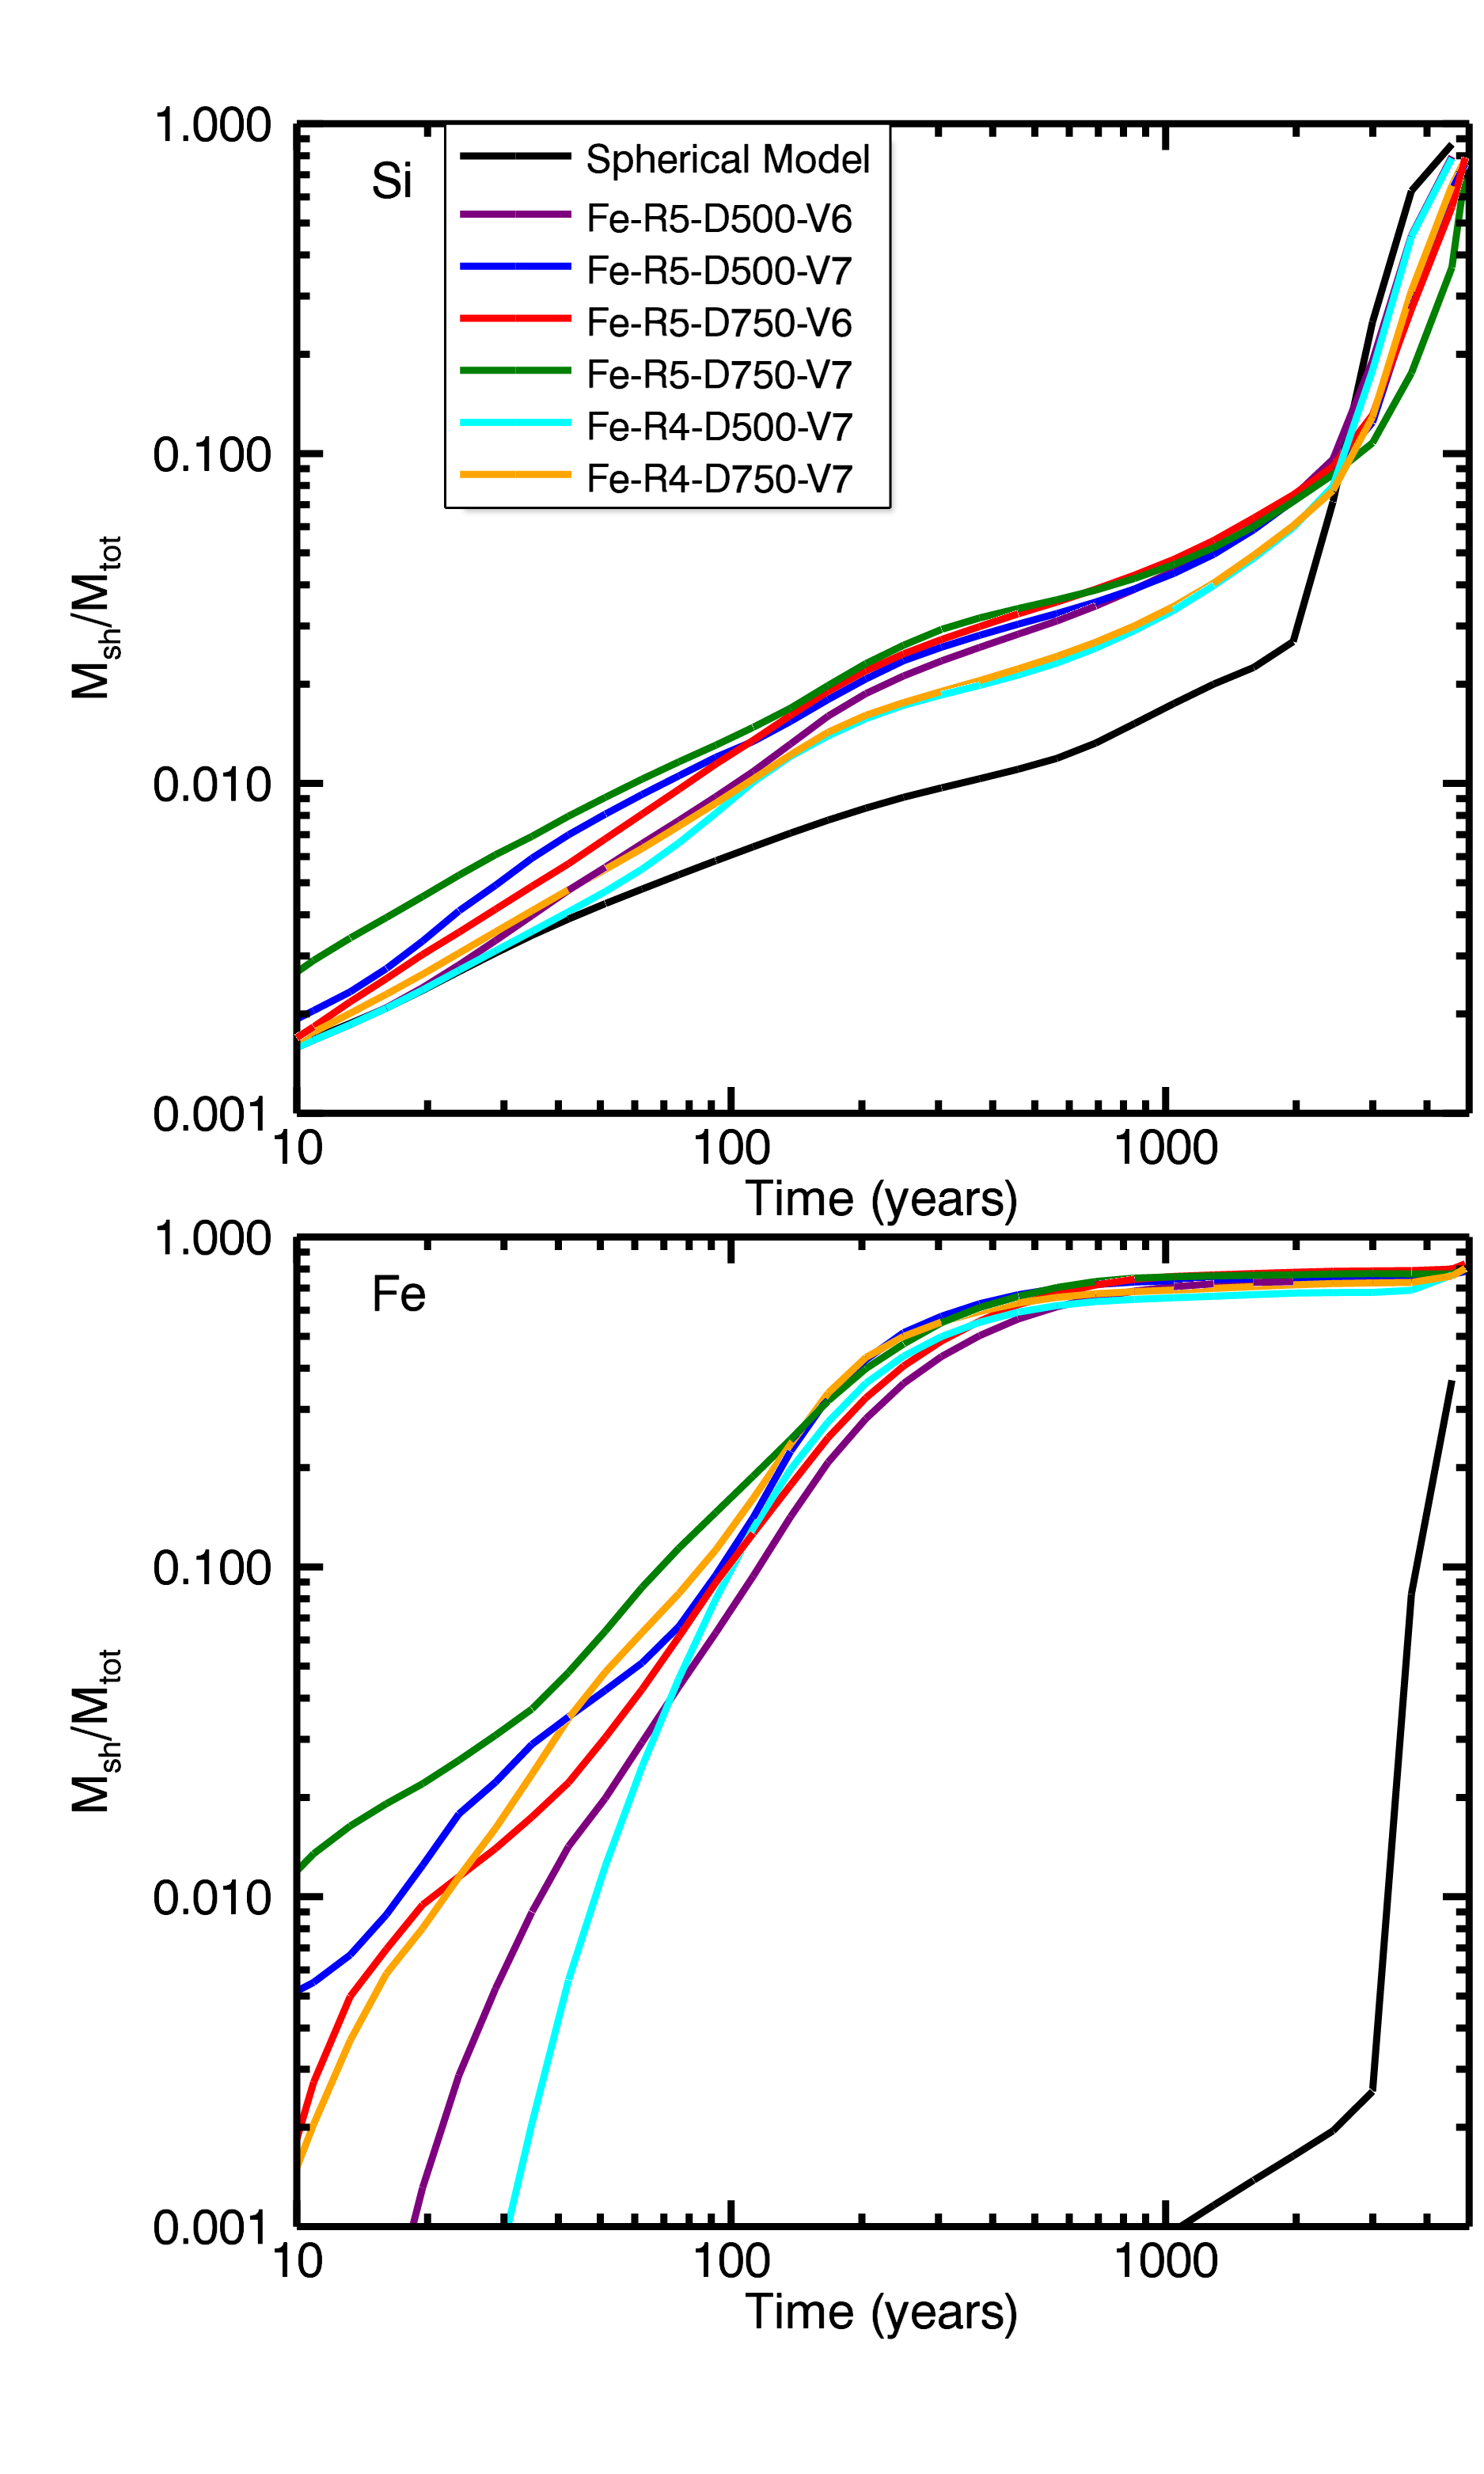
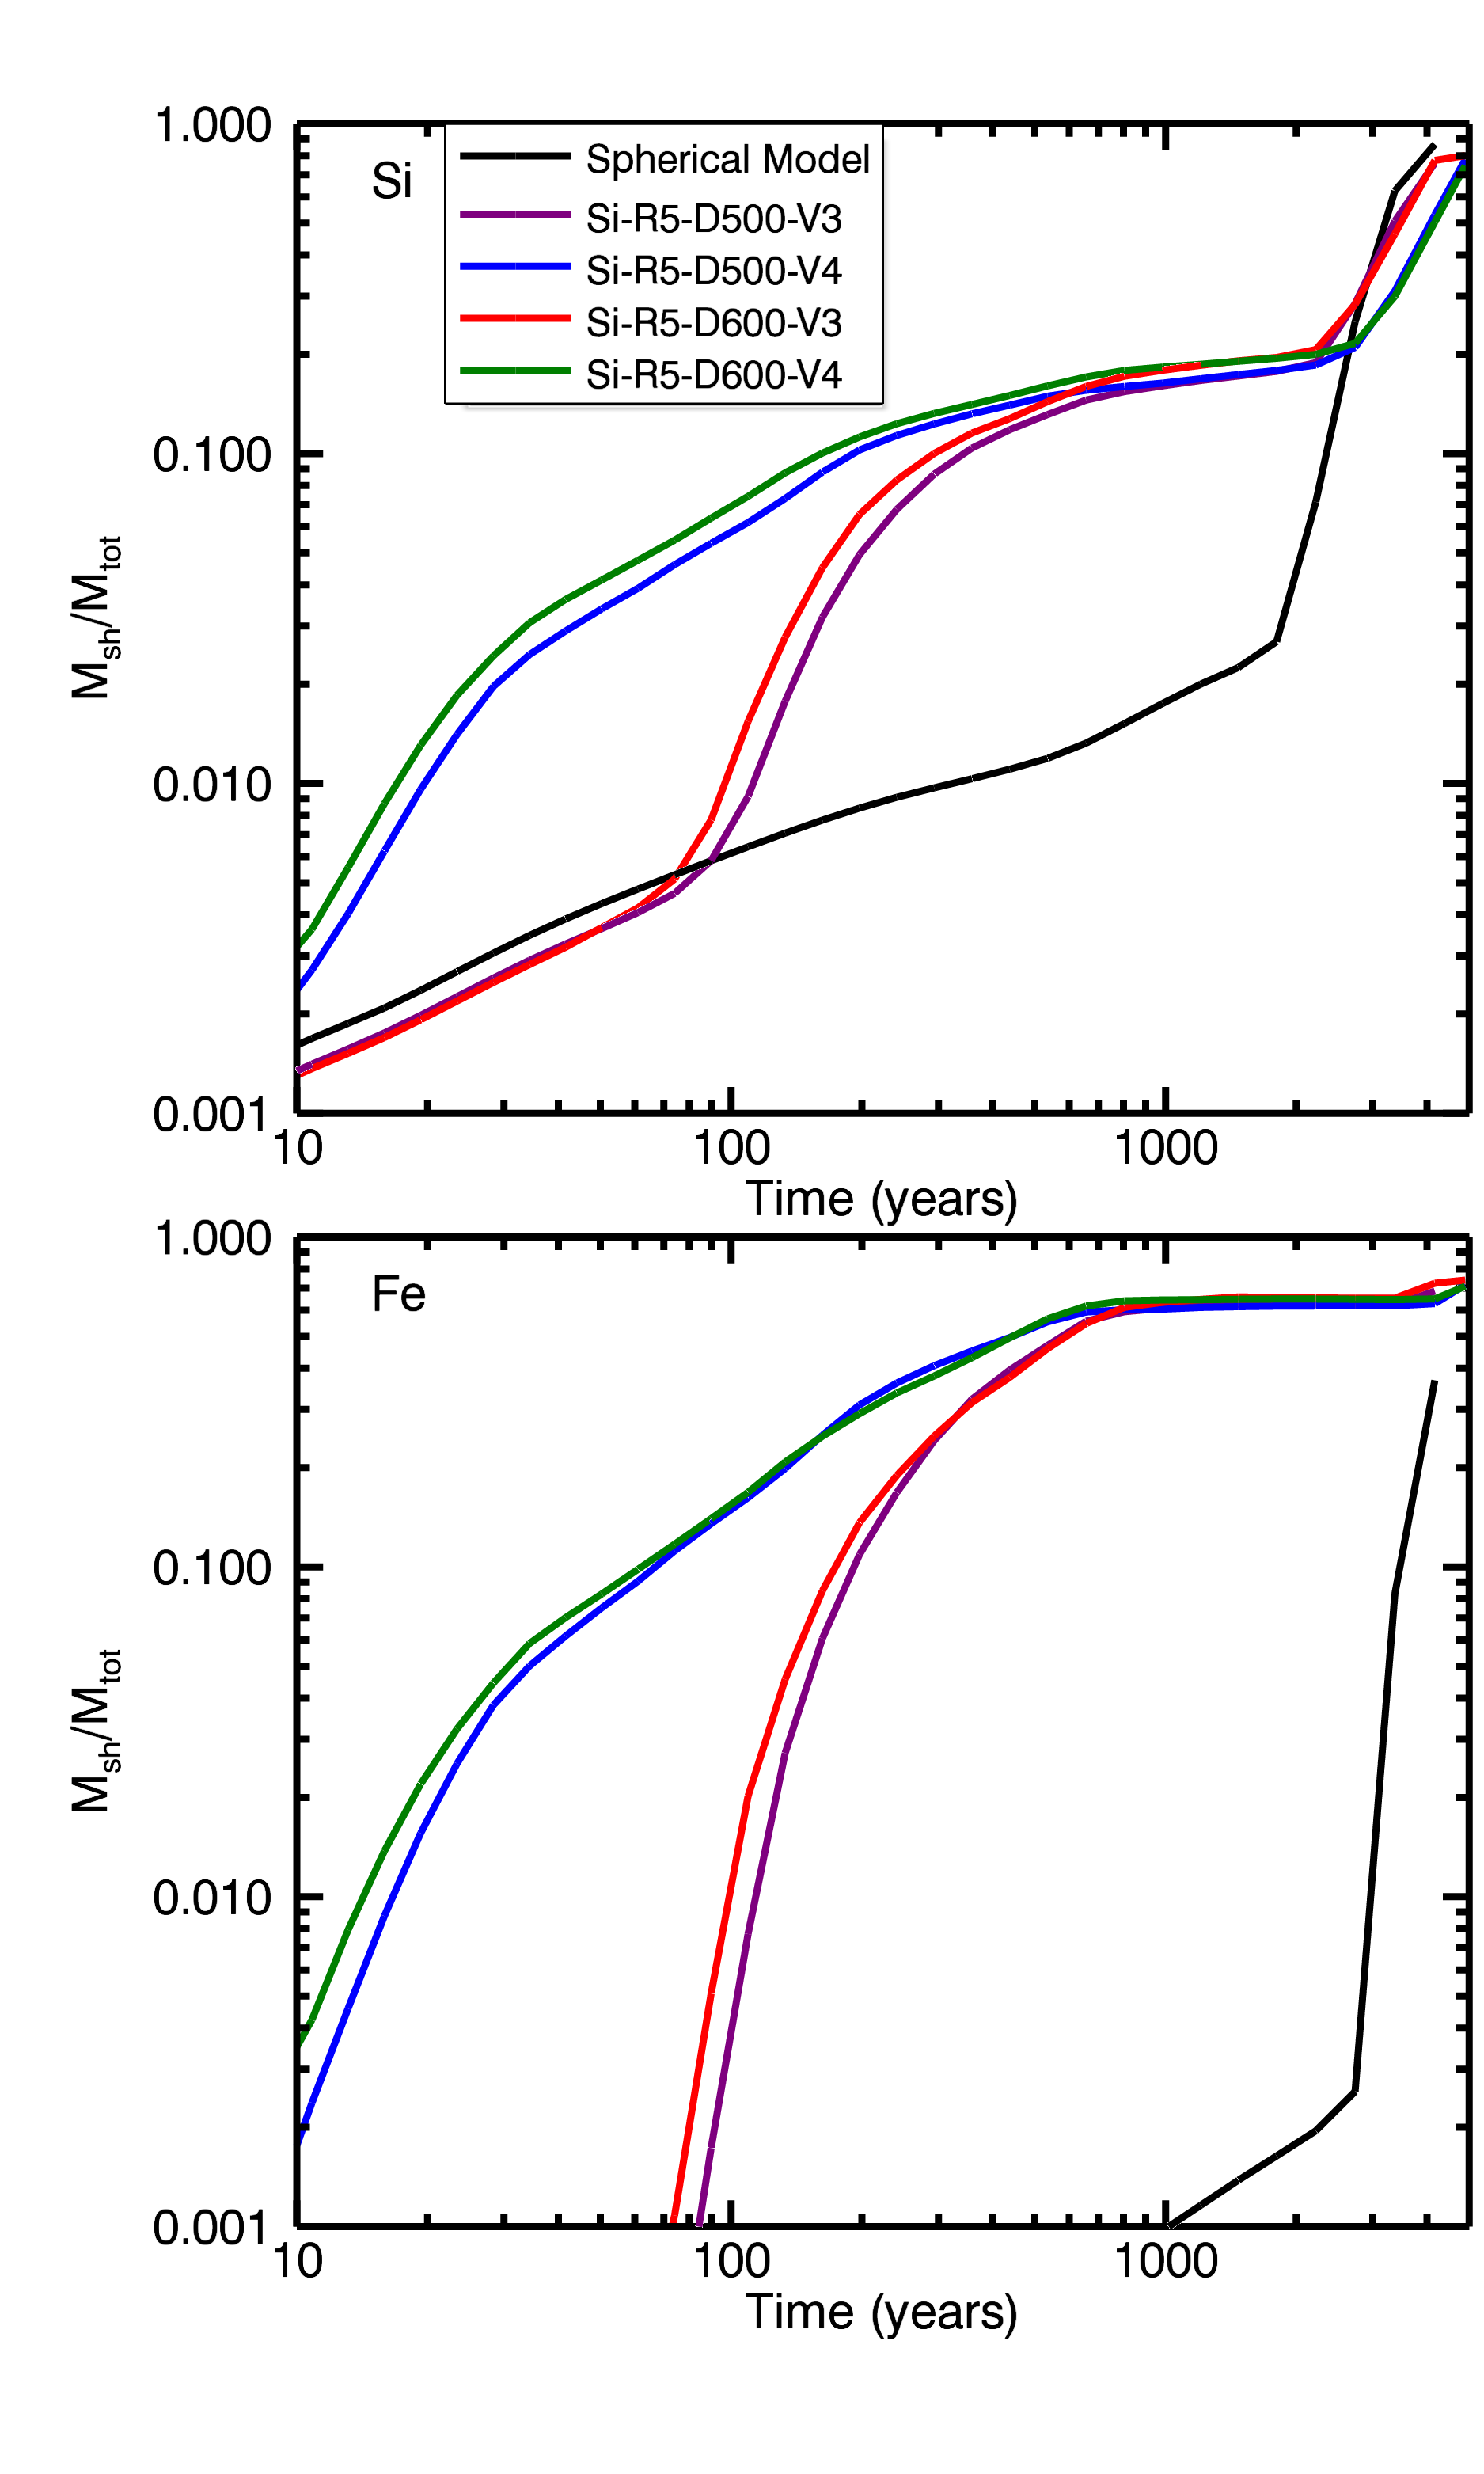
Shock-heated plasma emits X-ray thermal emission, especially through lines emission, giving us a valuable tool to measure the elemental composition and spatial distribution inside the remnant. From the simulations we derived the mass of shocked 56Fe and 28Si normalized to the value of the total mass of the respective element for the different models as a function of time (see Figs. 7- 8). Both for and , the final amount of shocked 56Fe is at least 2 times larger than that obtained for the case of a spherically symmetric explosion.
For (see Fig. 7), during the first 300 years, the amount of shocked 56Fe depends both on the size and on the initial density contrast of the clump, increasing with size and contrast. However, after 3000 yr, the reverse shock interacts with the 56Fe shell even without any initial clump, therefore the amount of shocked 56Fe observed at the end of the simulations is not entirely due to the initial clump. As for the shocked 28Si, we found that the final amount of shocked mass does not show any strong dependence on the initial clump parameters and on its initial dimension and position. The main cause of this is the interaction of the reverse shock with the Si-rich shell that shocks a relevant part of the 28Si-rich material, regardless of the presence of the initial clump, thus making the contribution of the clump negligible. For (see Fig. 8) instead, the amount of shocked 56Fe after 5000 yr is not strongly affected by the initial clump parameters. This is expected since the jet-like structure is mostly made of 28Si for models with , as shown in Fig. 6. On the other hand, the velocity contrast plays an important role in determining the beginning of the interaction between the reverse shock and the 56Fe-rich ejecta. We observed that, for , the reverse shock heats the 56Fe-rich material yr earlier than the case with (see upper panel of Fig. 8). As seen for the 56Fe, we found however that the initial velocity contrast affects the timing of the interaction between the reverse shock and the 28Si-rich ejecta, only for .
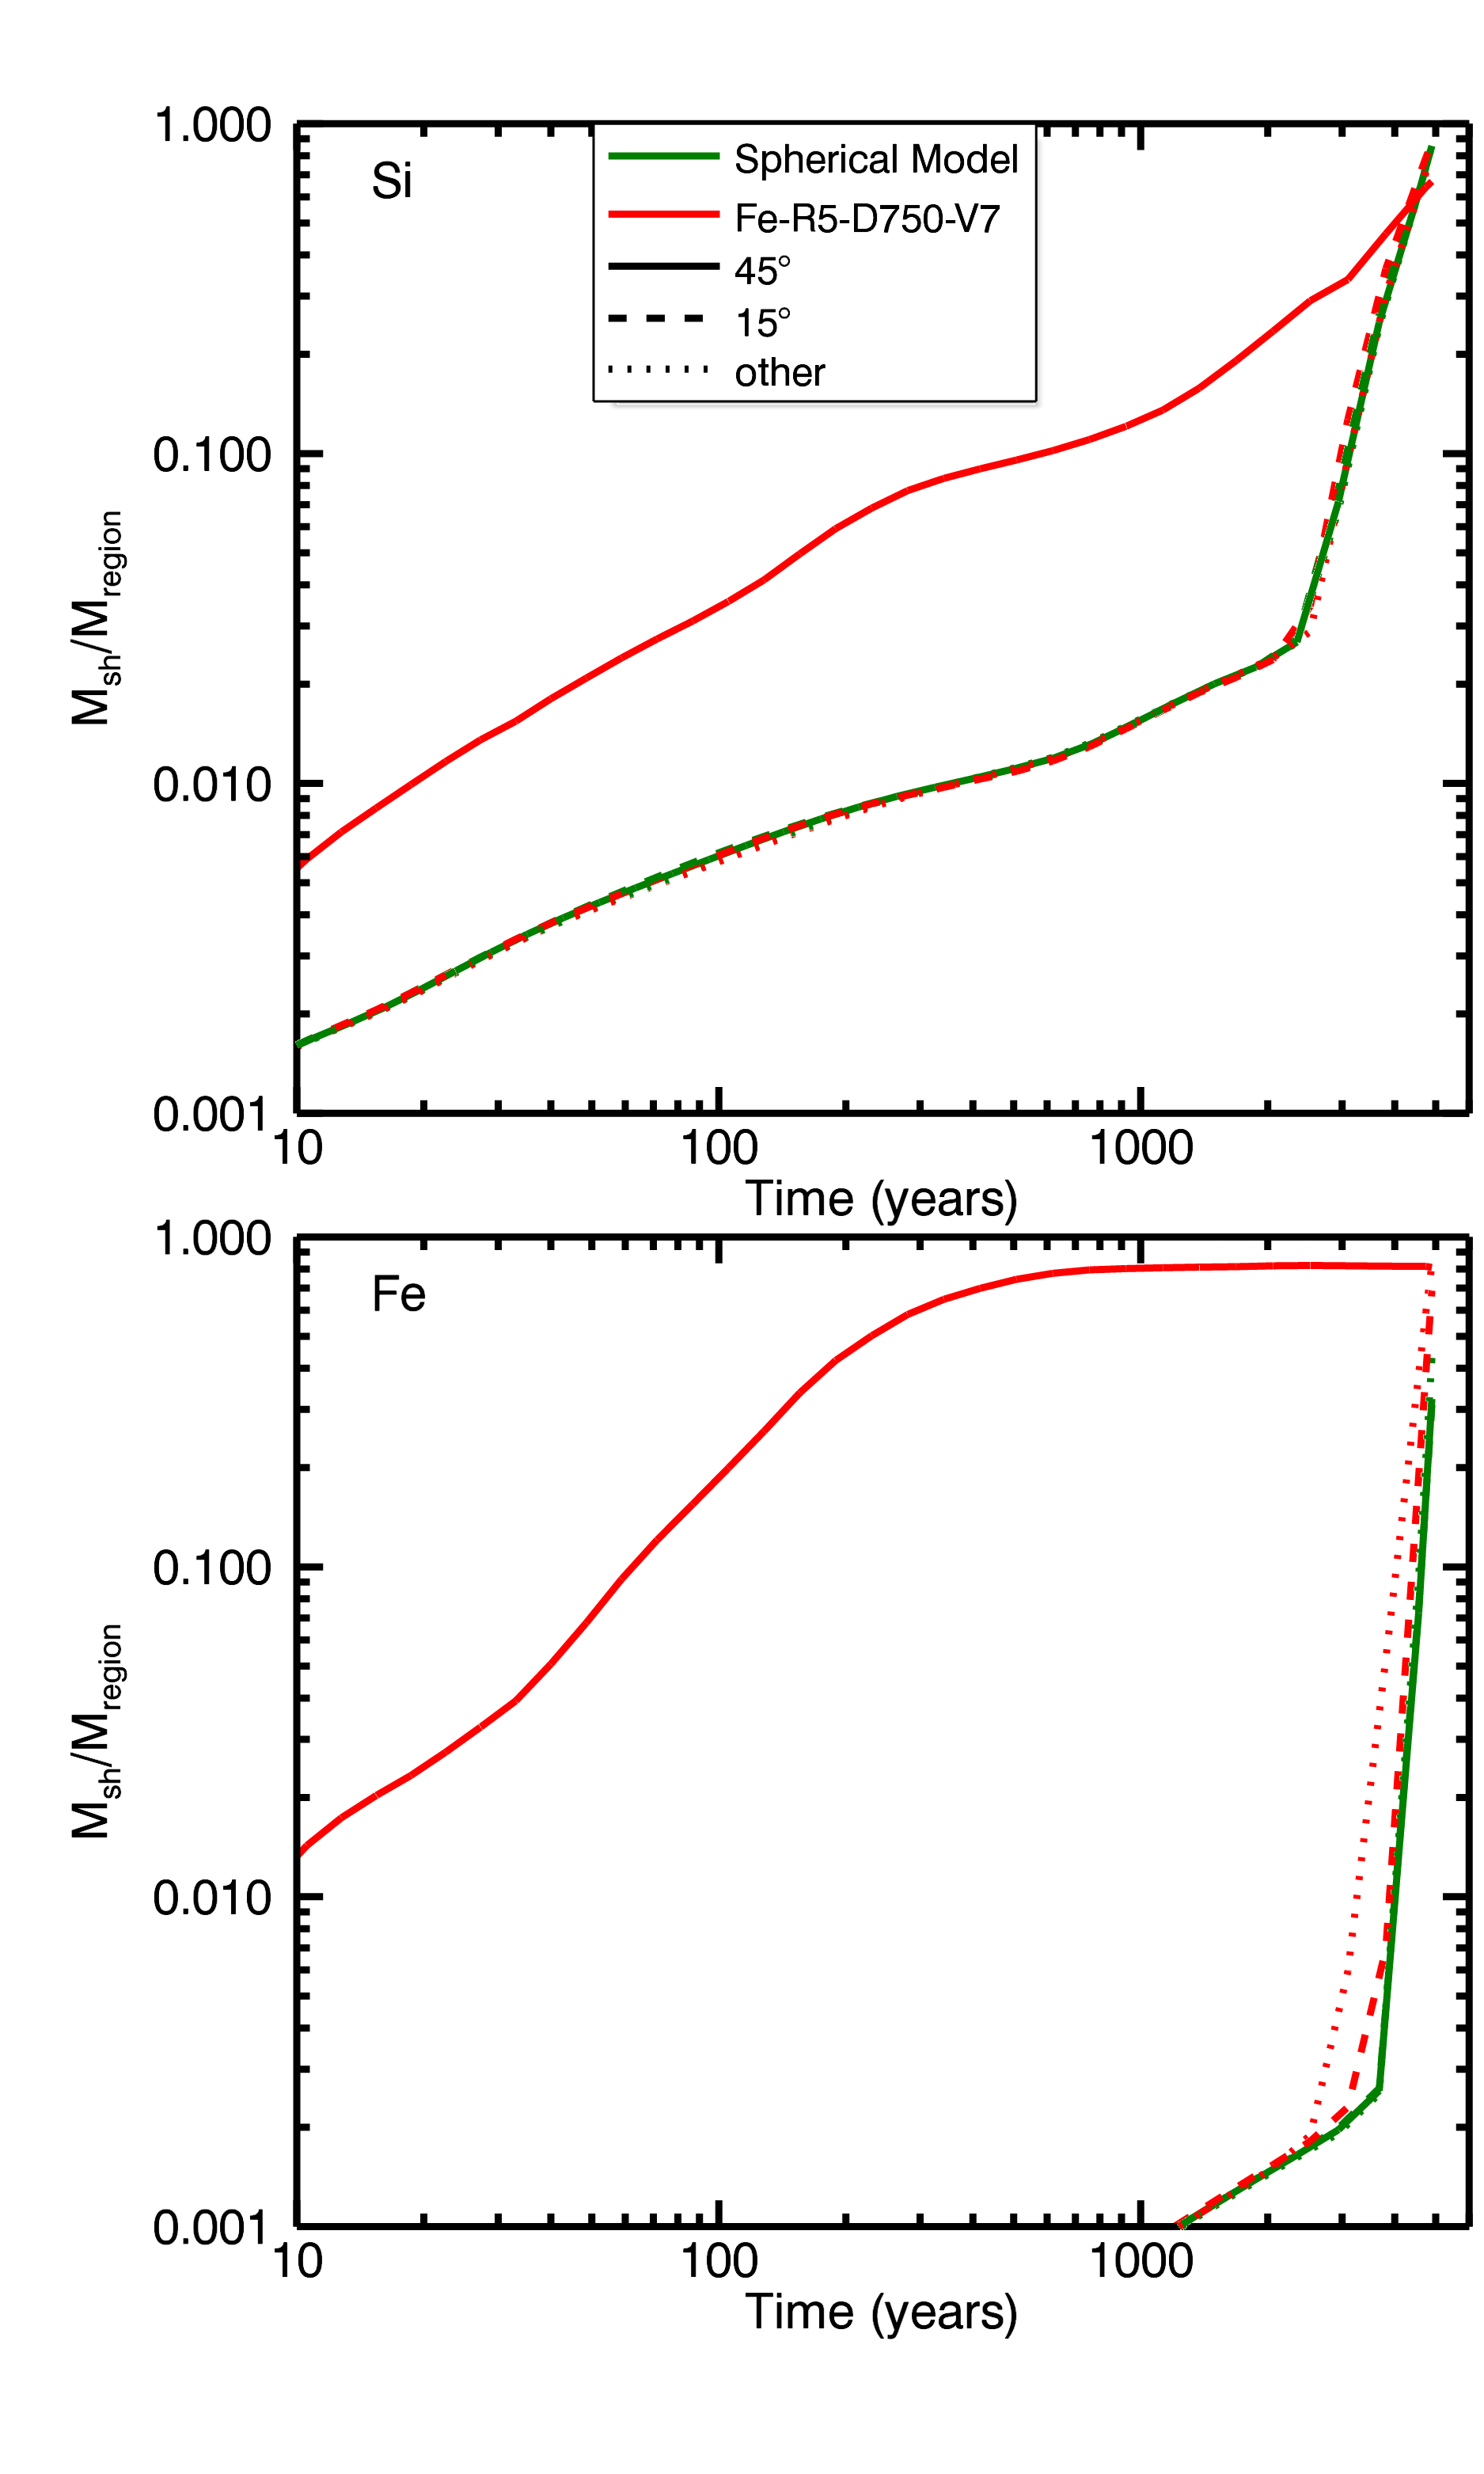
To deepen our understanding of the role played by the clump, we also computed the amount of shocked 28Si (upper panel of Fig. 9) and 56Fe (lower panel of Fig. 9) as a function of time in 3 different regions of the ejecta, namely: i) cells within of the z-axis (i.e., those enclosing the ejecta clump and mostly affected by its evolution) ii) cells within from the equatorial plane (i.e., those least affected by the clump) , and iii) all the other cells. The shocked mass is normalized to the total mass of the respective element in the corresponding region. We compared the spherically symmetric explosion (green lines) and model Fe-R5-D750-V7 (red lines, see Table 1). For model Fe-R5-D750-V7, in the region within of the z-axis the mass of the 28Si (upper panel) has been shocked by a larger fraction, compared to the other regions, but only up to yr. At odds with the 56Fe (lower panel), after yr the reverse shock reaches the 28Si layer in the regions away from the jet-like structure making these regions the main contributors to the shocked mass of 28Si. Looking at the evolution of the shocked mass of 56Fe (lower panel) for model Fe-R5-D750-V7, the effect of the clump in cells within of the z-axis) stands out, while the other regions follow the same evolution as the spherically symmetric explosion. However, the presence of the clump influences the regions within of the equatorial plane shocking more mass of the region compared to the spherically symmetric explosion.
3.3 Synthesis of X-ray emission
In this paper we showed that the presence of an anisotropy can significantly influence the shape of the remnant leading to the formation of large-scale jet-like structures and protrusions of the remnant outline. The matter-mixing strongly depends on the physical and chemical characteristics of the initial anisotropy and it is now interesting to have a probe of such mixing by looking at the X-ray spectra. When the shock wave interacts with the matter, the latter is heated up to temperatures of several millions degrees, leading to X-ray emission. Thus, X-ray spectral analysis represents a powerful tool to appreciate different spectral signatures of the regions affected by an ejecta bullet and the rest of the evolving remnant between the forward and the reverse shock.
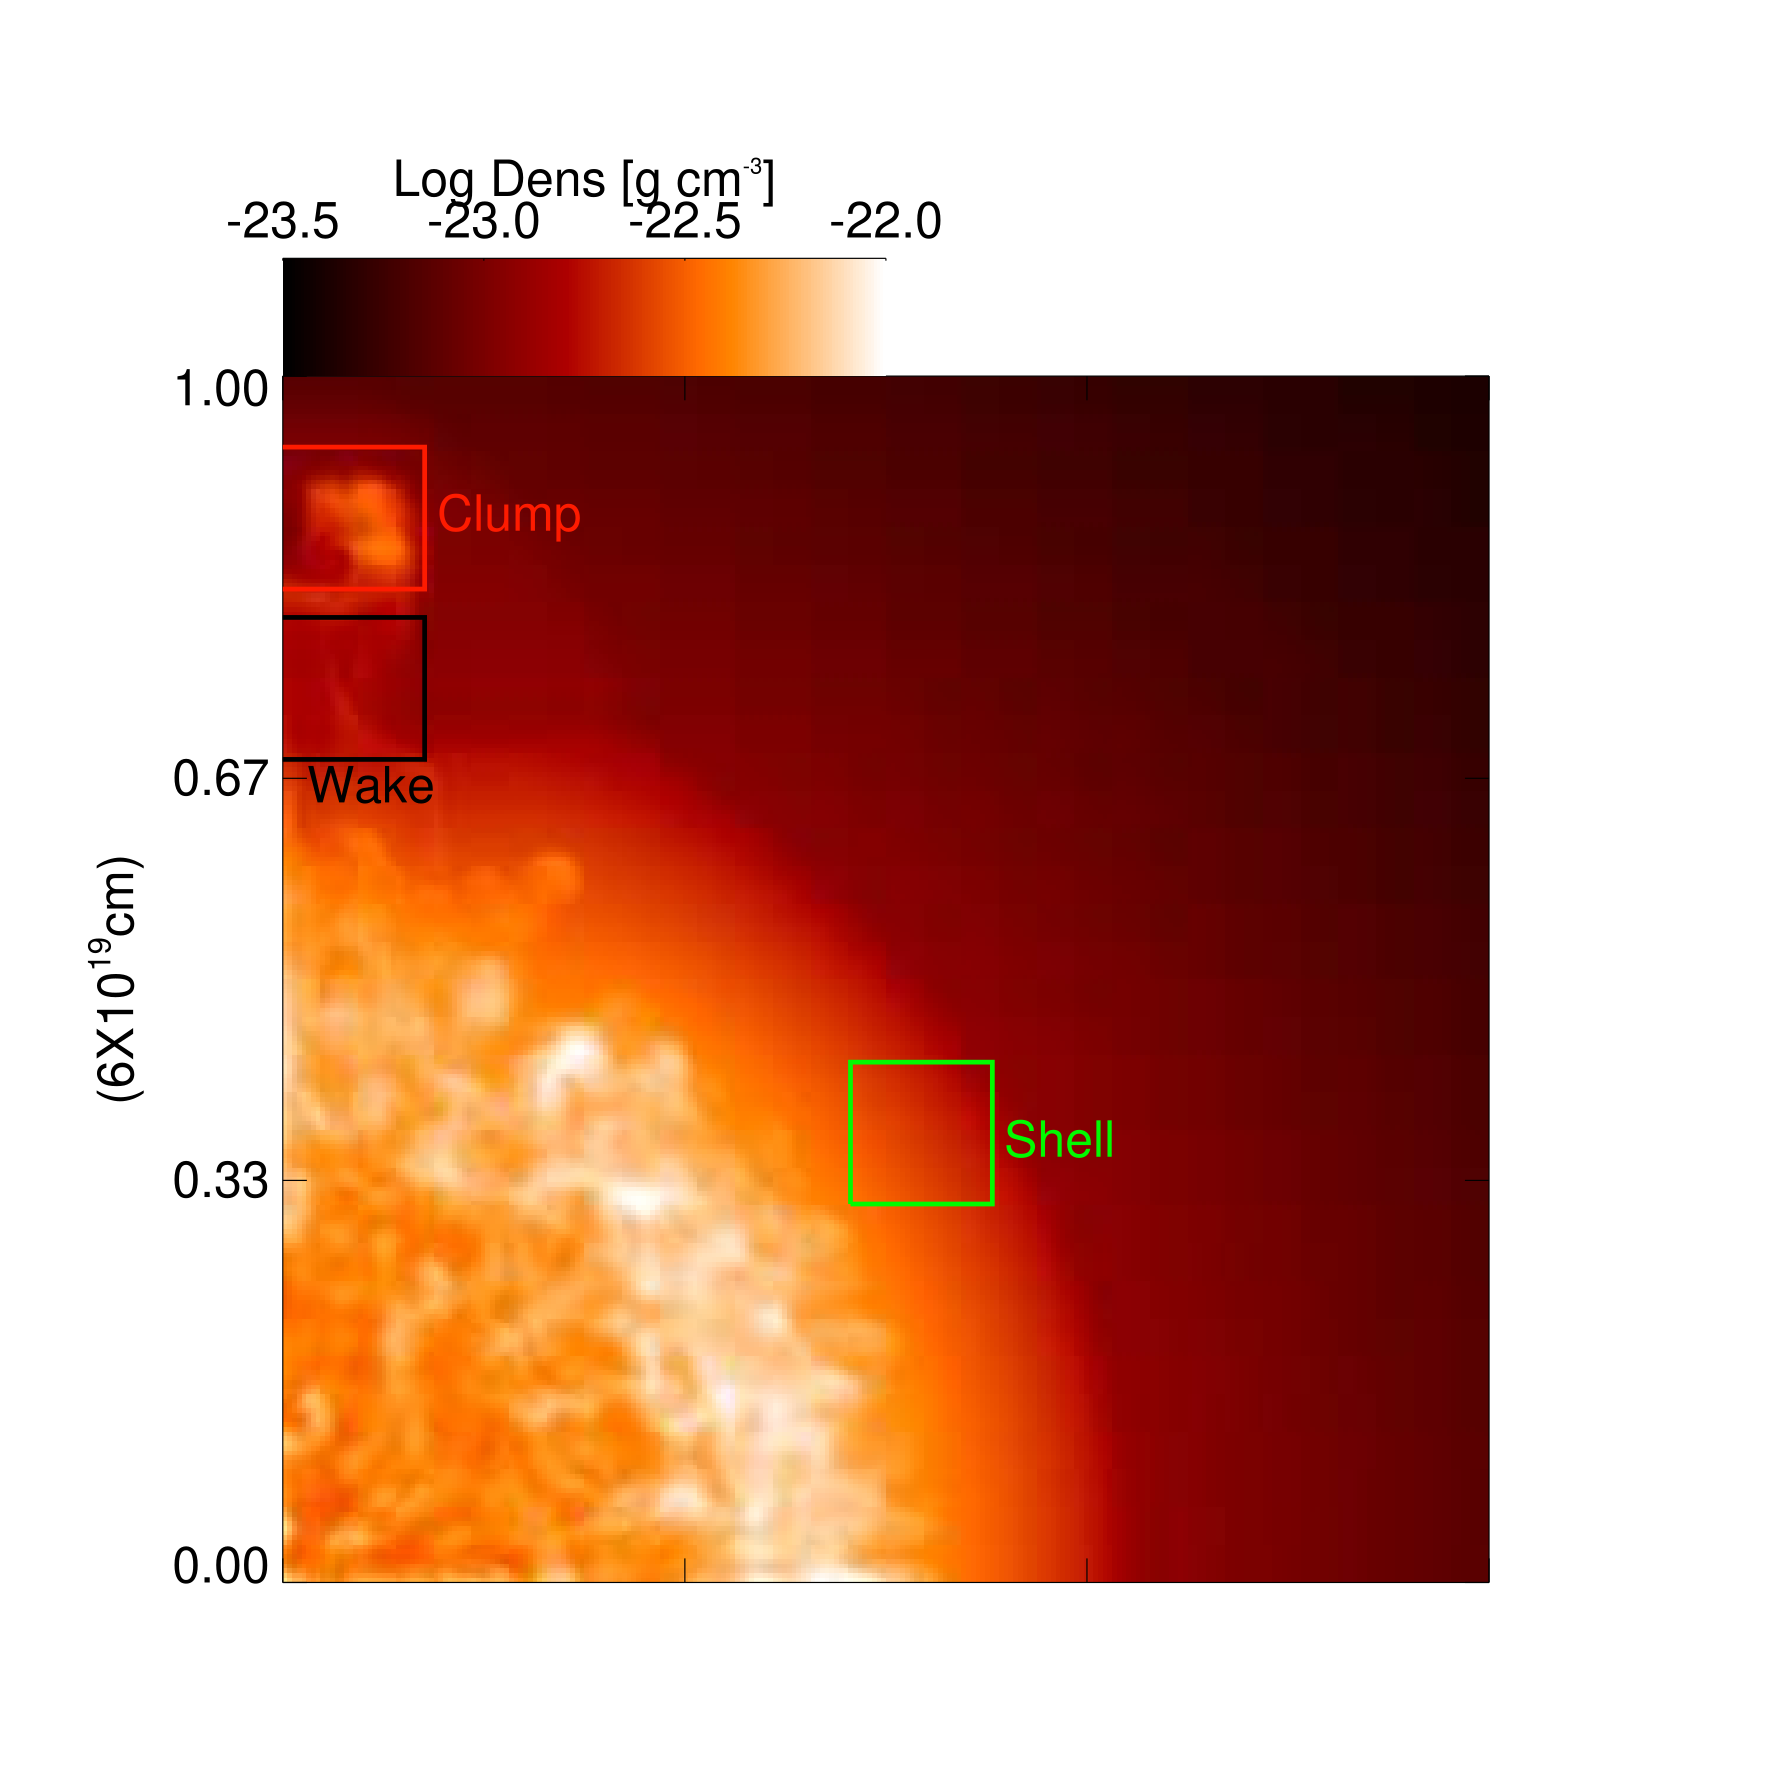
By adopting the approach described in Greco et al. 2020 (see also Miceli et al. 2019), we self-consistently synthesized X-ray spectra from our simulations in a format virtually identical to that of Chandra ACIS-S observations. The synthesis includes the deviations from equilibrium of ionization and from temperature-equilibration between electrons and protons, and takes into account the chemical composition of ejecta and ISM resulting from the simulations in each computational cell (see e.g. Miceli et al. 2019; Orlando et al. 2019 for more details). For the spectral synthesis, we assumed a distance of 1 kpc and a column density 1021 cm-2 with an exposure time of 100 ks. As an example, we analyzed run Fe-R5-D750-V7 (see Table 1) where a clear jet-like feature is evident at an age of yr. We selected three regions identified by the red, black and green boxes in the upper panel of Fig. 10 corresponding to the ejecta bullet protruding the remnant outline (in the following the clump), the wake (namely the low-density strip-region behind the clump, already mentioned in Sect. 3.2), and an area of the shell not affected by the anisotropy, respectively. For a distance from the observer of 1 kpc, each of these regions corresponds to a box with angular side . Synthetic spectra extracted from the three regions are shown in the lower panel of Fig. 10.
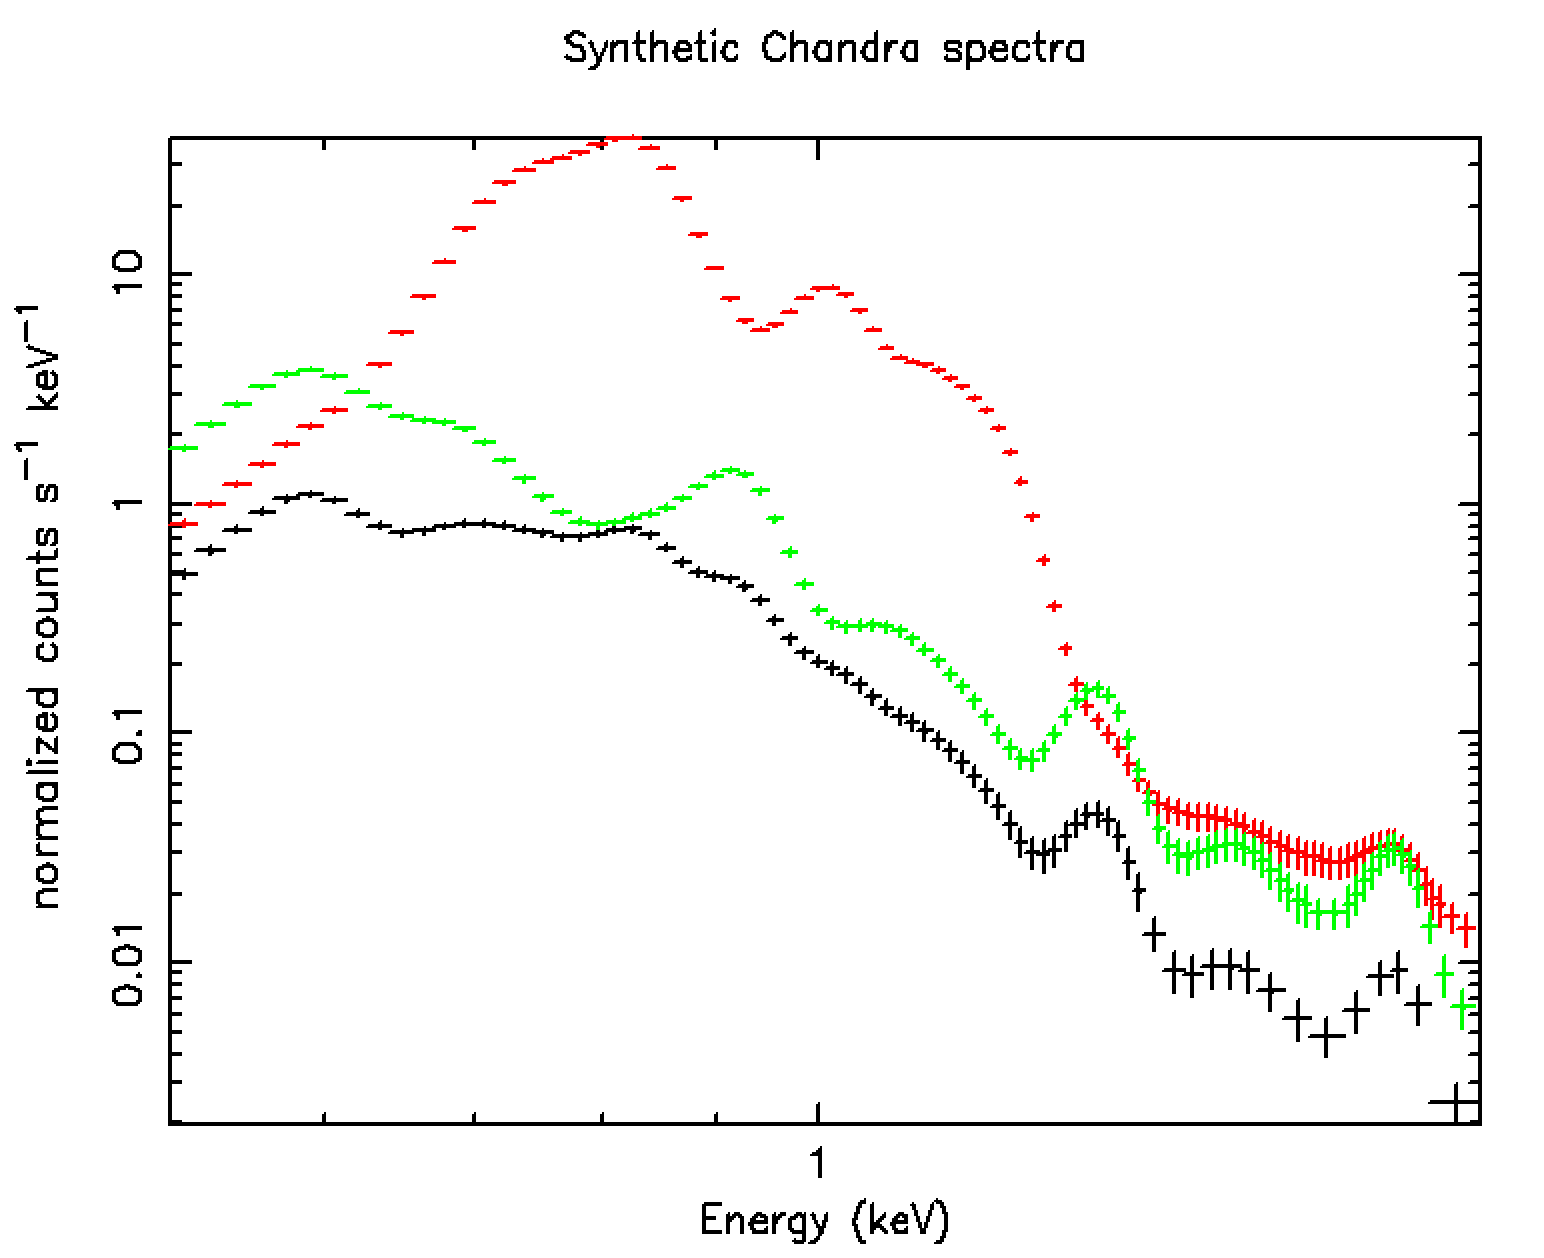
The main spectral difference between the spectrum extracted from the region enclosing the clump and the other spectra is the bright ”false-continuum” emission due to the blending of Fe XIV-XXIV emission lines at energies around 1 keV. This result shows that the clump spectrum is dominated by the emission of Fe-rich ejecta. Emission lines of other elements such as Mg ( 1.3 keV) and Si ( 1.8 keV) are fainter in the clump spectrum, since the protrusion of the Fe-rich clump drags away lighter elements. Enhanced Ne (at keV), Mg, and Si emission lines are visible in the spectrum of the shell region (green spectrum in Fig. 10). The wake spectrum (black spectrum in Fig. 10) shows bright Mg and Si emission lines, very low Fe emission, even lower than that in the shell region, and an overall lower emission measure. The emission is fainter because the density is low, as we can see in the integrated density distribution map displayed in the upper panel of Fig. 10). Our analysis shows that the effects of matter mixing in the ejecta produced by the evolution of a post-explosion anisotropy lead to spectral features in the X-ray band which are detectable through a spatially resolved analysis of X-ray spectra of SNRs.
4 Summary and conclusions
We investigated the evolution of the ejecta in core-collapse SNRs from the onset of the SN to the full-fledged remnant. The aim was to analyze how matter mixing occurs during the remnant expansion and interaction with the CSM, how the various chemically homogeneous layers at the time of the explosion map into the resulting abundance pattern observed when the remnant is fully developed, and how the presence of large-scale anisotropies affects the evolution of these layers. To this end, we developed a 3D MHD model describing the evolution of a SNR starting soon after the SN explosion and following the interaction of the SN ejecta with the CSM for 5000 years. As initial conditions for the SNR simulations, we adopted the output of a spherical SN explosion model by Ono et al. 2020 (see also Ono et al. 2013), soon after the breakout of the shock wave at the stellar surface (about 17 hours after the core-collapse). More specifically we considered the case of a M⊙ progenitor RSG which exploded as SN with an injected energy of erg. The initial ejecta structure was modeled by including small-scale clumping of material and a larger-scale anisotropy. The simulations are multi-species to trace the life cycle of elements during the whole evolution, from the nuclear reaction network of the SN, to the enrichment of the CSM through mixing of chemically homogeneous layers of ejecta.
To ascertain the effect on the matter-mixing of the spherically symmetric expansion of the remnant, we first explored a case with small-scale clumpy structures of ejecta without considering any large-scale anisotropy. The ejecta soon after the SN explosion show the original onion-like structure, with elements arranged in concentric shells. Although, after 5000 years of evolution, the onion-like structure is maintained due to the homologous expansion of the unshocked layers of the ejecta, we observed a significant matter mixing in the inter-shock region of the remnant, as also expected from previous studies (e.g. Gull 1973; Chevalier 1976; Fryxell et al. 1991; Chevalier et al. 1992; see Fig. 4). This mixing is caused by the development of HD instabilities generated by the interaction of the ejecta with the CSM. However, this mixing is not able to cause a spatial inversion between chemical layers, leaving the initial chemical configuration of the ejecta roughly preserved.
We then performed a set of simulations to study the evolution of a post-explosion large-scale anisotropy (the clump) in the ejecta and its effects on the matter-mixing, investigating the role of its initial parameters (position, dimension, density and velocity contrasts). We explored primarily two cases: 1) a clump initially located in the 56Fe/28Si region () and 2) a clump in the 56Fe region (). In both cases, the clump is located behind a thick and dense shell of lower- ejecta. This thick and dense shell requires a higher density contrast for the clump, compared to previous works (Miceli et al., 2013; Tsebrenko & Soker, 2015), to reach the forward shock. The dense-shell structure could strongly depend on the progenitor model. This because different progenitors could produce different density profiles after the explosion and, therefore, we should obtain different initial conditions and the clump would evolve in a different environment. The progenitor discussed in this paper (a M⊙ progenitor RSG) is a generic case of a RSG among the different progenitors simulated in Ono et al. (2020). The magnetic field is not relevant for the overall evolution of the remnant (being the plasma- much larger than 1) but plays some role in reducing the fragmentation of the clump by the HD instabilities that would develop at its border (Fragile et al., 2005; Shin et al., 2008; Orlando et al., 2008, 2012).
From the first 10 years of evolution, the clump rapidly assumes an elongated structure and its outermost region becomes denser. It takes 100 yr for the clump to overcome the high-density shell of lower- ejecta and start to interact with the reverse shock and the intershock region. After 1000 years the HD instabilities begin to erode the clump, by gradually fragmenting it, supported by the effects of compression and heating caused by the interaction of the clump with the reverse shock. We found that the initial position of the clump strongly affects the morphology of the clump at yr. A clump initially located at , i.e. attached to the high-density shell (see right quadrant of Fig. 2), overcomes entirely the high-density shell and, at the end of the simulation, only a small fraction of the clump is left behind the reverse shock (e.g., top left panel of Fig. 6 where contours enclosing cells with more than 10% of the original clump material are shown). Nevertheless, a clump initially located at expands significantly before interacting with the shell. This involves a minor density contrast of the clump at the interaction with the shell, and consequently a major difficulty to overcome the shell. This translates in a higher density contrast of the clump required to overcome the high-density shell of lower- ejecta and a bigger fraction of the clump left behind the reverse shock at the end of simulation time (see top right and bottom left panels of Fig. 6).
Furthermore, we found that for a clump is able to protrude the forward shock with an initial velocity contrast , while for is required. For a smaller clump () only in model Fe-R4-D750-V7 ( = 750, = 7) the clump is able to protrude the forward shock.
The chemical stratification in the ejecta is strongly affected by the clump, especially in the region along the z-axis. The initial onion-like structure is not preserved, as the clump, propagating through the remnant, forms a stream of 28Si(56Fe) ejecta, for (), from the inner regions up to the intershock region. The clump makes its way out to the external layer of the remnant by piercing the chemically homogeneous shells and pushing the layers on the side of the stream. These streams cause a spatial inversion of the chemical layers, bringing the 28Si/56Fe externally to the 16O shell (see Figs. 6 and 10). Where the effects of the clump’s passage are not relevant, i.e. in the plane, the evolution of the chemical layer is analogous to that described by the spherically symmetric model (see Fig. 9). The main effect of this inversion is on the amount of shocked mass of both 56Fe and 28Si as shown in Figs. 8, 7 and 9. We found that a clump initially located in the 56Fe/28Si region does not increase the final amount of shocked 28Si, whereas it doubles the amount of shocked 56Fe. Although the density contrast () does not produce large effects, the velocity contrast () has an important role in determining the age of the shocking time of the elements: a higher contrast causes an earlier interaction. As a result, this will produce an earlier appearance of X-ray emission from shocked ejecta. In particular, we found that for a spherically symmetric expansion the 28Si (56Fe) begin to be shocked after yr ( yr), while the presence of the clump causes an early interaction of both elements with the reverse shock at most yr in advance. For a clump initially located in the Fe shell (i.e. ), we found that the trend over time of the shocked 28Si mass is not affected by the presence of the initial large-scale anisotropy, while on the contrary the final amount of shocked 56Fe increase with increasing size, velocity and density contrast of the clump.
Our simulations allowed us to study the effect of a large scale anisotropy on the evolution and matter-mixing of the remnant’s ejecta and provided a valuable tool to reproduce observable properties in SNRs. By synthesizing X-ray spectra from the model we found that it is possible to obtain a deeper level of diagnostics of ejecta inhomogeneities in CC-SNe by carefully comparing X-ray observations of SNRs with numerical simulations. Thus, our findings can be a useful guide in the interpretation of observations as, for instance, the Si-rich shrapnel protruding beyond the front of its primary blast shock wave in the Vela SNR (García et al., 2017) or the fast runaway knot with a significantly high Si abundance recently detected in N132D (Law et al., 2020).
Acknowledgements.
We acknowledge that the results of this research have been achieved using the PRACE Research Infrastructure resource Marconi based in Italy at CINECA (PRACE Award N.2016153460). The PLUTO code is developed at the Turin Astronomical Observatory (Italy) in collaboration with the Department of General Physics of Turin University (Italy) and the SCAI Department of CINECA (Italy). The SN simulation has been performed with the FLASH code, developed by the DOE-supported ASC/Alliance Center for Astrophysical Thermonuclear Flashes at the University of Chicago (USA). The numerical computations of the SN simulation were carried out complementarily on XC40 (YITP, Kyoto University), Cray XC50 (Center for Computational Astrophysics, National Astronomical Observatory of Japan), HOKUSAI (RIKEN). SO, MM, FB and EG acknowledge financial contribution from the agreement ASI-INAF n.2017- 14-H.O, and partial financial support by the main-stream INAF grant “Particle acceleration in galactic sources in the CTA era”. This work is supported by JSPS Grants-in-Aid for Scientific Research “KAKENHI” Grant Numbers JP26800141 and JP19H00693. SN, MO and GF wish to acknowledge the support from the Program of Interdisciplinary Theoretical & Mathematical Sciences (iTHEMS) at RIKEN (Japan). SN also acknowledges the support from Pioneering Program of RIKEN for Evolution of Matter in the Universe (r-EMU).References
- Ahmad et al. (2006) Ahmad, I., Greene, J. P., Moore, E. F., et al. 2006, Phys. Rev. C, 74, 065803
- Aschenbach et al. (1995) Aschenbach, B., Egger, R., & Trümper, J. 1995, Nature, 373, 587
- Bear & Soker (2018) Bear, E. & Soker, N. 2018, MNRAS, 478, 682
- Blondin et al. (1998) Blondin, J. M., Wright, E. B., Borkowski, K. J., & Reynolds, S. P. 1998, ApJ, 500, 342
- Burrows et al. (2019) Burrows, A., Radice, D., & Vartanyan, D. 2019, MNRAS, 485, 3153
- Chevalier (1976) Chevalier, R. A. 1976, ApJ, 207, 872
- Chevalier et al. (1992) Chevalier, R. A., Blondin, J. M., & Emmering, R. T. 1992, ApJ, 392, 118
- Crowther (2001) Crowther, P. A. 2001, in Astrophysics and Space Science Library, Vol. 264, The Influence of Binaries on Stellar Population Studies, ed. D. Vanbeveren, 215
- DeLaney et al. (2010) DeLaney, T., Rudnick, L., Stage, M. D., et al. 2010, ApJ, 725, 2038
- Diehl et al. (2006) Diehl, R., Halloin, H., Kretschmer, K., et al. 2006, Nature, 439, 45
- Dwarkadas (2005) Dwarkadas, V. V. 2005, ApJ, 630, 892
- Dwarkadas & Chevalier (1998) Dwarkadas, V. V. & Chevalier, R. A. 1998, ApJ, 497, 807
- Ferrand & Safi-Harb (2012) Ferrand, G. & Safi-Harb, S. 2012, Advances in Space Research, 49, 1313
- Ferrand et al. (2019) Ferrand, G., Warren, D. C., Ono, M., et al. 2019, ApJ, 877, 136
- Fesen et al. (2006) Fesen, R. A., Hammell, M. C., Morse, J., et al. 2006, ApJ, 636, 859
- Fragile et al. (2005) Fragile, P. C., Anninos, P., Gustafson, K., & Murray, S. D. 2005, ApJ, 619, 327
- Fryxell et al. (1991) Fryxell, B., Mueller, E., & Arnett, D. 1991, ApJ, 367, 619
- Fryxell et al. (2000) Fryxell, B., Olson, K., Ricker, P., et al. 2000, ApJS, 131, 273
- Gabler et al. (2017) Gabler, M., Janka, H.-T., & Wongwathanarat, A. 2017, in IAU Symposium, Vol. 331, Supernova 1987A:30 years later - Cosmic Rays and Nuclei from Supernovae and their Aftermaths, ed. A. Marcowith, M. Renaud, G. Dubner, A. Ray, & A. Bykov, 141–147
- García et al. (2017) García, F., Suárez, A. E., Miceli, M., et al. 2017, A&A, 604, L5
- Gawryszczak et al. (2010) Gawryszczak, A., Guzman, J., Plewa, T., & Kifonidis, K. 2010, A&A, 521, A38
- Greco et al. (2020) Greco, E., Vink, J., Miceli, M., et al. 2020, A&A, 638, A101
- Green (2014) Green, D. A. 2014, Bulletin of the Astronomical Society of India, 42, 47
- Grefenstette et al. (2017) Grefenstette, B. W., Fryer, C. L., Harrison, F. A., et al. 2017, ApJ, 834, 19
- Grefenstette et al. (2014) Grefenstette, B. W., Harrison, F. A., Boggs, S. E., et al. 2014, Nature, 506, 339
- Gull (1973) Gull, S. F. 1973, MNRAS, 161, 47
- Haas et al. (1990) Haas, M. R., Colgan, S. W. J., Erickson, E. F., et al. 1990, ApJ, 360, 257
- Hughes et al. (2000) Hughes, J. P., Rakowski, C. E., Burrows, D. N., & Slane, P. O. 2000, ApJ, 528, L109
- Janka (2017) Janka, H.-T. 2017, Neutrino-Driven Explosions (ISBN 978-3-319-21845-8. Springer International Publishing AG), 1095
- Janka et al. (2016) Janka, H.-T., Melson, T., & Summa, A. 2016, Annual Review of Nuclear and Particle Science, 66, 341
- Joggerst et al. (2010) Joggerst, C. C., Almgren, A., & Woosley, S. E. 2010, ApJ, 723, 353
- Joggerst et al. (2009) Joggerst, C. C., Woosley, S. E., & Heger, A. 2009, ApJ, 693, 1780
- Katsuda et al. (2008) Katsuda, S., Mori, K., Tsunemi, H., et al. 2008, ApJ, 678, 297
- Kifonidis et al. (2006) Kifonidis, K., Plewa, T., Scheck, L., Janka, H.-T., & Müller, E. 2006, A&A, 453, 661
- Law et al. (2020) Law, C. J., Milisavljevic, D., Patnaude, D. J., et al. 2020, arXiv e-prints, arXiv:2004.00016
- Lee et al. (2015) Lee, S.-H., Patnaude, D. J., Raymond, J. C., et al. 2015, ApJ, 806, 71
- Maeda et al. (2008) Maeda, K., Kawabata, K., Mazzali, P. A., et al. 2008, Science, 319, 1220
- Miceli et al. (2008) Miceli, M., Bocchino, F., & Reale, F. 2008, ApJ, 676, 1064
- Miceli et al. (2019) Miceli, M., Orlando, S., Burrows, D. N., et al. 2019, Nature Astronomy, 3, 236
- Miceli et al. (2013) Miceli, M., Orlando, S., Reale, F., Bocchino, F., & Peres, G. 2013, MNRAS, 430, 2864
- Miceli et al. (2006) Miceli, M., Reale, F., Orlando, S., & Bocchino, F. 2006, A&A, 458, 213
- Mignone et al. (2007) Mignone, A., Bodo, G., Massaglia, S., et al. 2007, ApJ, 170, 228
- Milisavljevic & Fesen (2013) Milisavljevic, D. & Fesen, R. A. 2013, ApJ, 772, 134
- Nadyozhin (1994) Nadyozhin, D. K. 1994, ApJS, 92, 527
- Nagataki (2000) Nagataki, S. 2000, ApJS, 127, 141
- Nagataki et al. (1997) Nagataki, S., Hashimoto, M.-a., Sato, K., & Yamada, S. 1997, ApJ, 486, 1026
- Nagataki et al. (1998) Nagataki, S., Hashimoto, M.-a., Sato, K., Yamada, S., & Mochizuki, Y. S. 1998, ApJ, 492, L45
- O’Connor & Couch (2018) O’Connor, E. P. & Couch, S. M. 2018, ApJ, 865, 81
- Ono et al. (2020) Ono, M., Nagataki, S., Ferrand, G., et al. 2020, ApJ, 888, 111
- Ono et al. (2013) Ono, M., Nagataki, S., Ito, H., et al. 2013, ApJ, 773, 161
- Orlando et al. (2012) Orlando, S., Bocchino, F., Miceli, M., Petruk, O., & Pumo, M. L. 2012, ApJ, 749, 156
- Orlando et al. (2008) Orlando, S., Bocchino, F., Reale, F., Peres, G., & Pagano, P. 2008, ApJ, 678, 274
- Orlando et al. (2019) Orlando, S., Miceli, M., Petruk, O., et al. 2019, A&A, 622, A73
- Orlando et al. (2015) Orlando, S., Miceli, M., Pumo, M. L., & Bocchino, F. 2015, ApJ, 810, 168
- Orlando et al. (2016) Orlando, S., Miceli, M., Pumo, M. L., & Bocchino, F. 2016, ApJ, 822, 22
- Orlando et al. (2020) Orlando, S., Ono, M., Nagataki, S., et al. 2020, A&A, 636, A22
- Orlando et al. (2005) Orlando, S., Peres, G., Reale, F., et al. 2005, A&A, 444, 505
- Park et al. (2004) Park, S., Hughes, J. P., Slane, P. O., et al. 2004, ApJ, 602, L33
- Parker (1958) Parker, E. N. 1958, ApJ, 128, 664
- Patnaude et al. (2015) Patnaude, D. J., Lee, S.-H., Slane, P. O., et al. 2015, ApJ, 803, 101
- Shin et al. (2008) Shin, M.-S., Stone, J. M., & Snyder, G. F. 2008, ApJ, 680, 336
- Siegert et al. (2015) Siegert, T., Diehl, R., Krause, M. G. H., & Greiner, J. 2015, A&A, 579, A124
- Sukhbold et al. (2016) Sukhbold, T., Ertl, T., Woosley, S. E., Brown, J. M., & Janka, H.-T. 2016, ApJ, 821, 38
- Takiwaki et al. (2009) Takiwaki, T., Kotake, K., & Sato, K. 2009, ApJ, 691, 1360
- Tessore et al. (2017) Tessore, B., Lèbre, A., Morin, J., et al. 2017, A&A, 603, A129
- Tsebrenko & Soker (2015) Tsebrenko, D. & Soker, N. 2015, MNRAS, 453, 166
- Utrobin et al. (1995) Utrobin, V. P., Chugai, N. N., & Andronova, A. A. 1995, A&A, 295, 129
- Utrobin et al. (2015) Utrobin, V. P., Wongwathanarat, A., Janka, H.-T., & Müller, E. 2015, A&A, 581, A40
- Wang (2011) Wang, C.-Y. 2011, MNRAS, 415, 83
- Wang & Chevalier (2001) Wang, C.-Y. & Chevalier, R. A. 2001, ApJ, 549, 1119
- Wang & Chevalier (2002) Wang, C.-Y. & Chevalier, R. A. 2002, ApJ, 574, 155
- Wongwathanarat et al. (2013) Wongwathanarat, A., Janka, H. T., & Müller, E. 2013, A&A, 552, A126
- Wongwathanarat et al. (2017) Wongwathanarat, A., Janka, H.-T., Müller, E., Pllumbi, E., & Wanajo, S. 2017, ApJ, 842, 13
Appendix A: Effect of spatial resolution
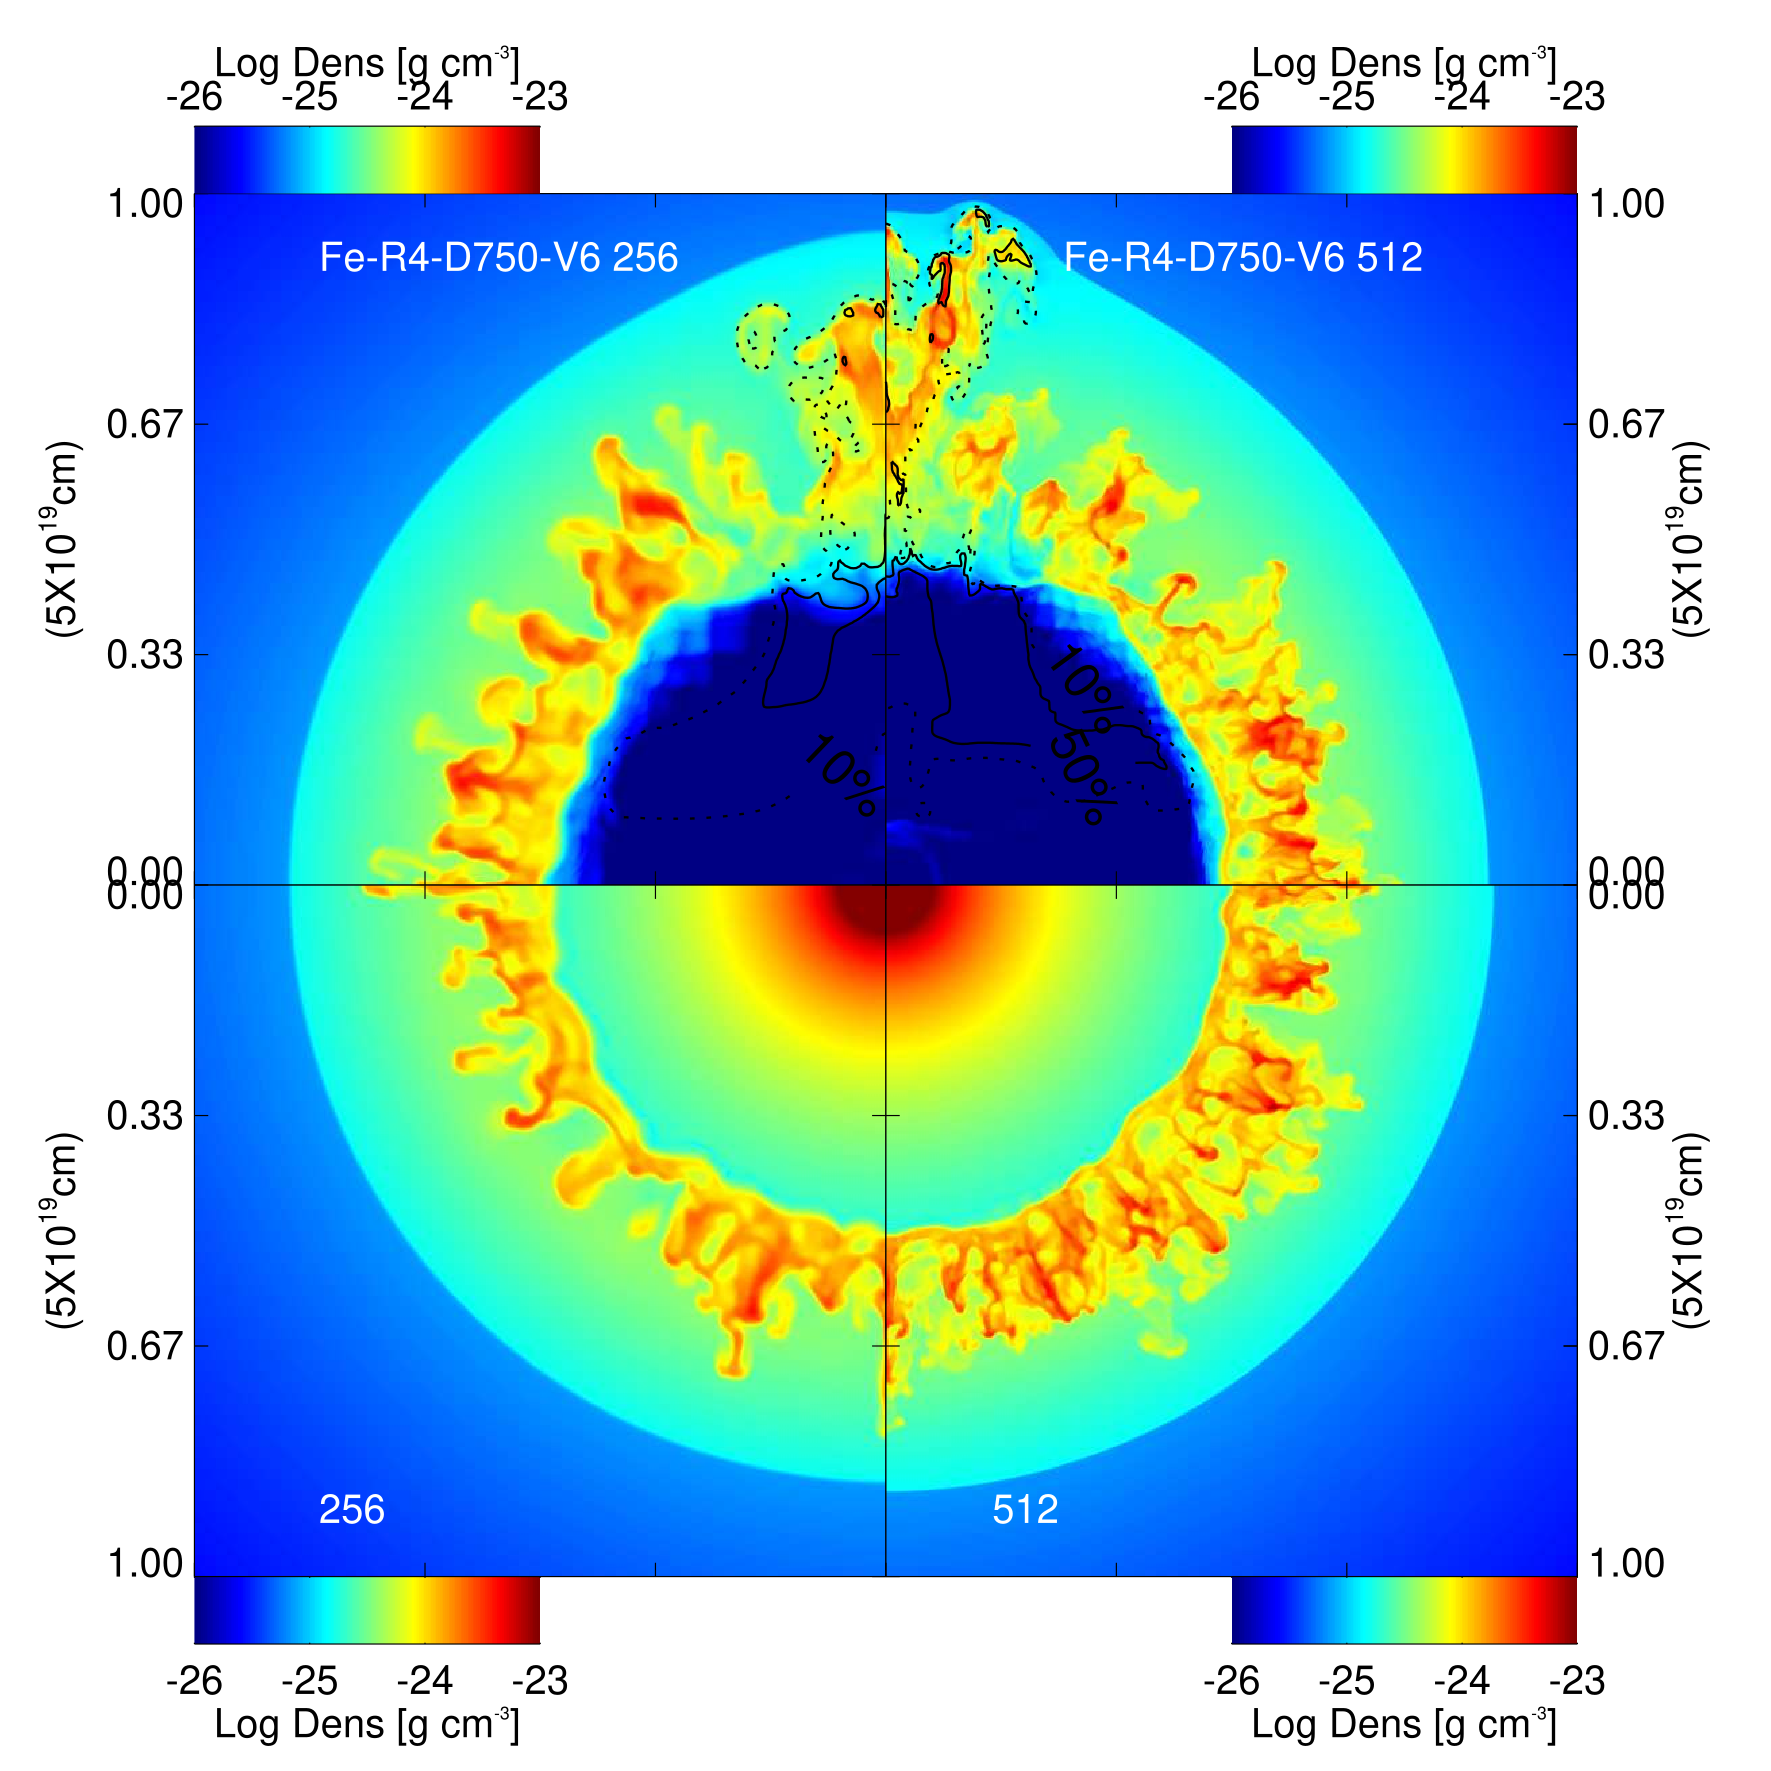
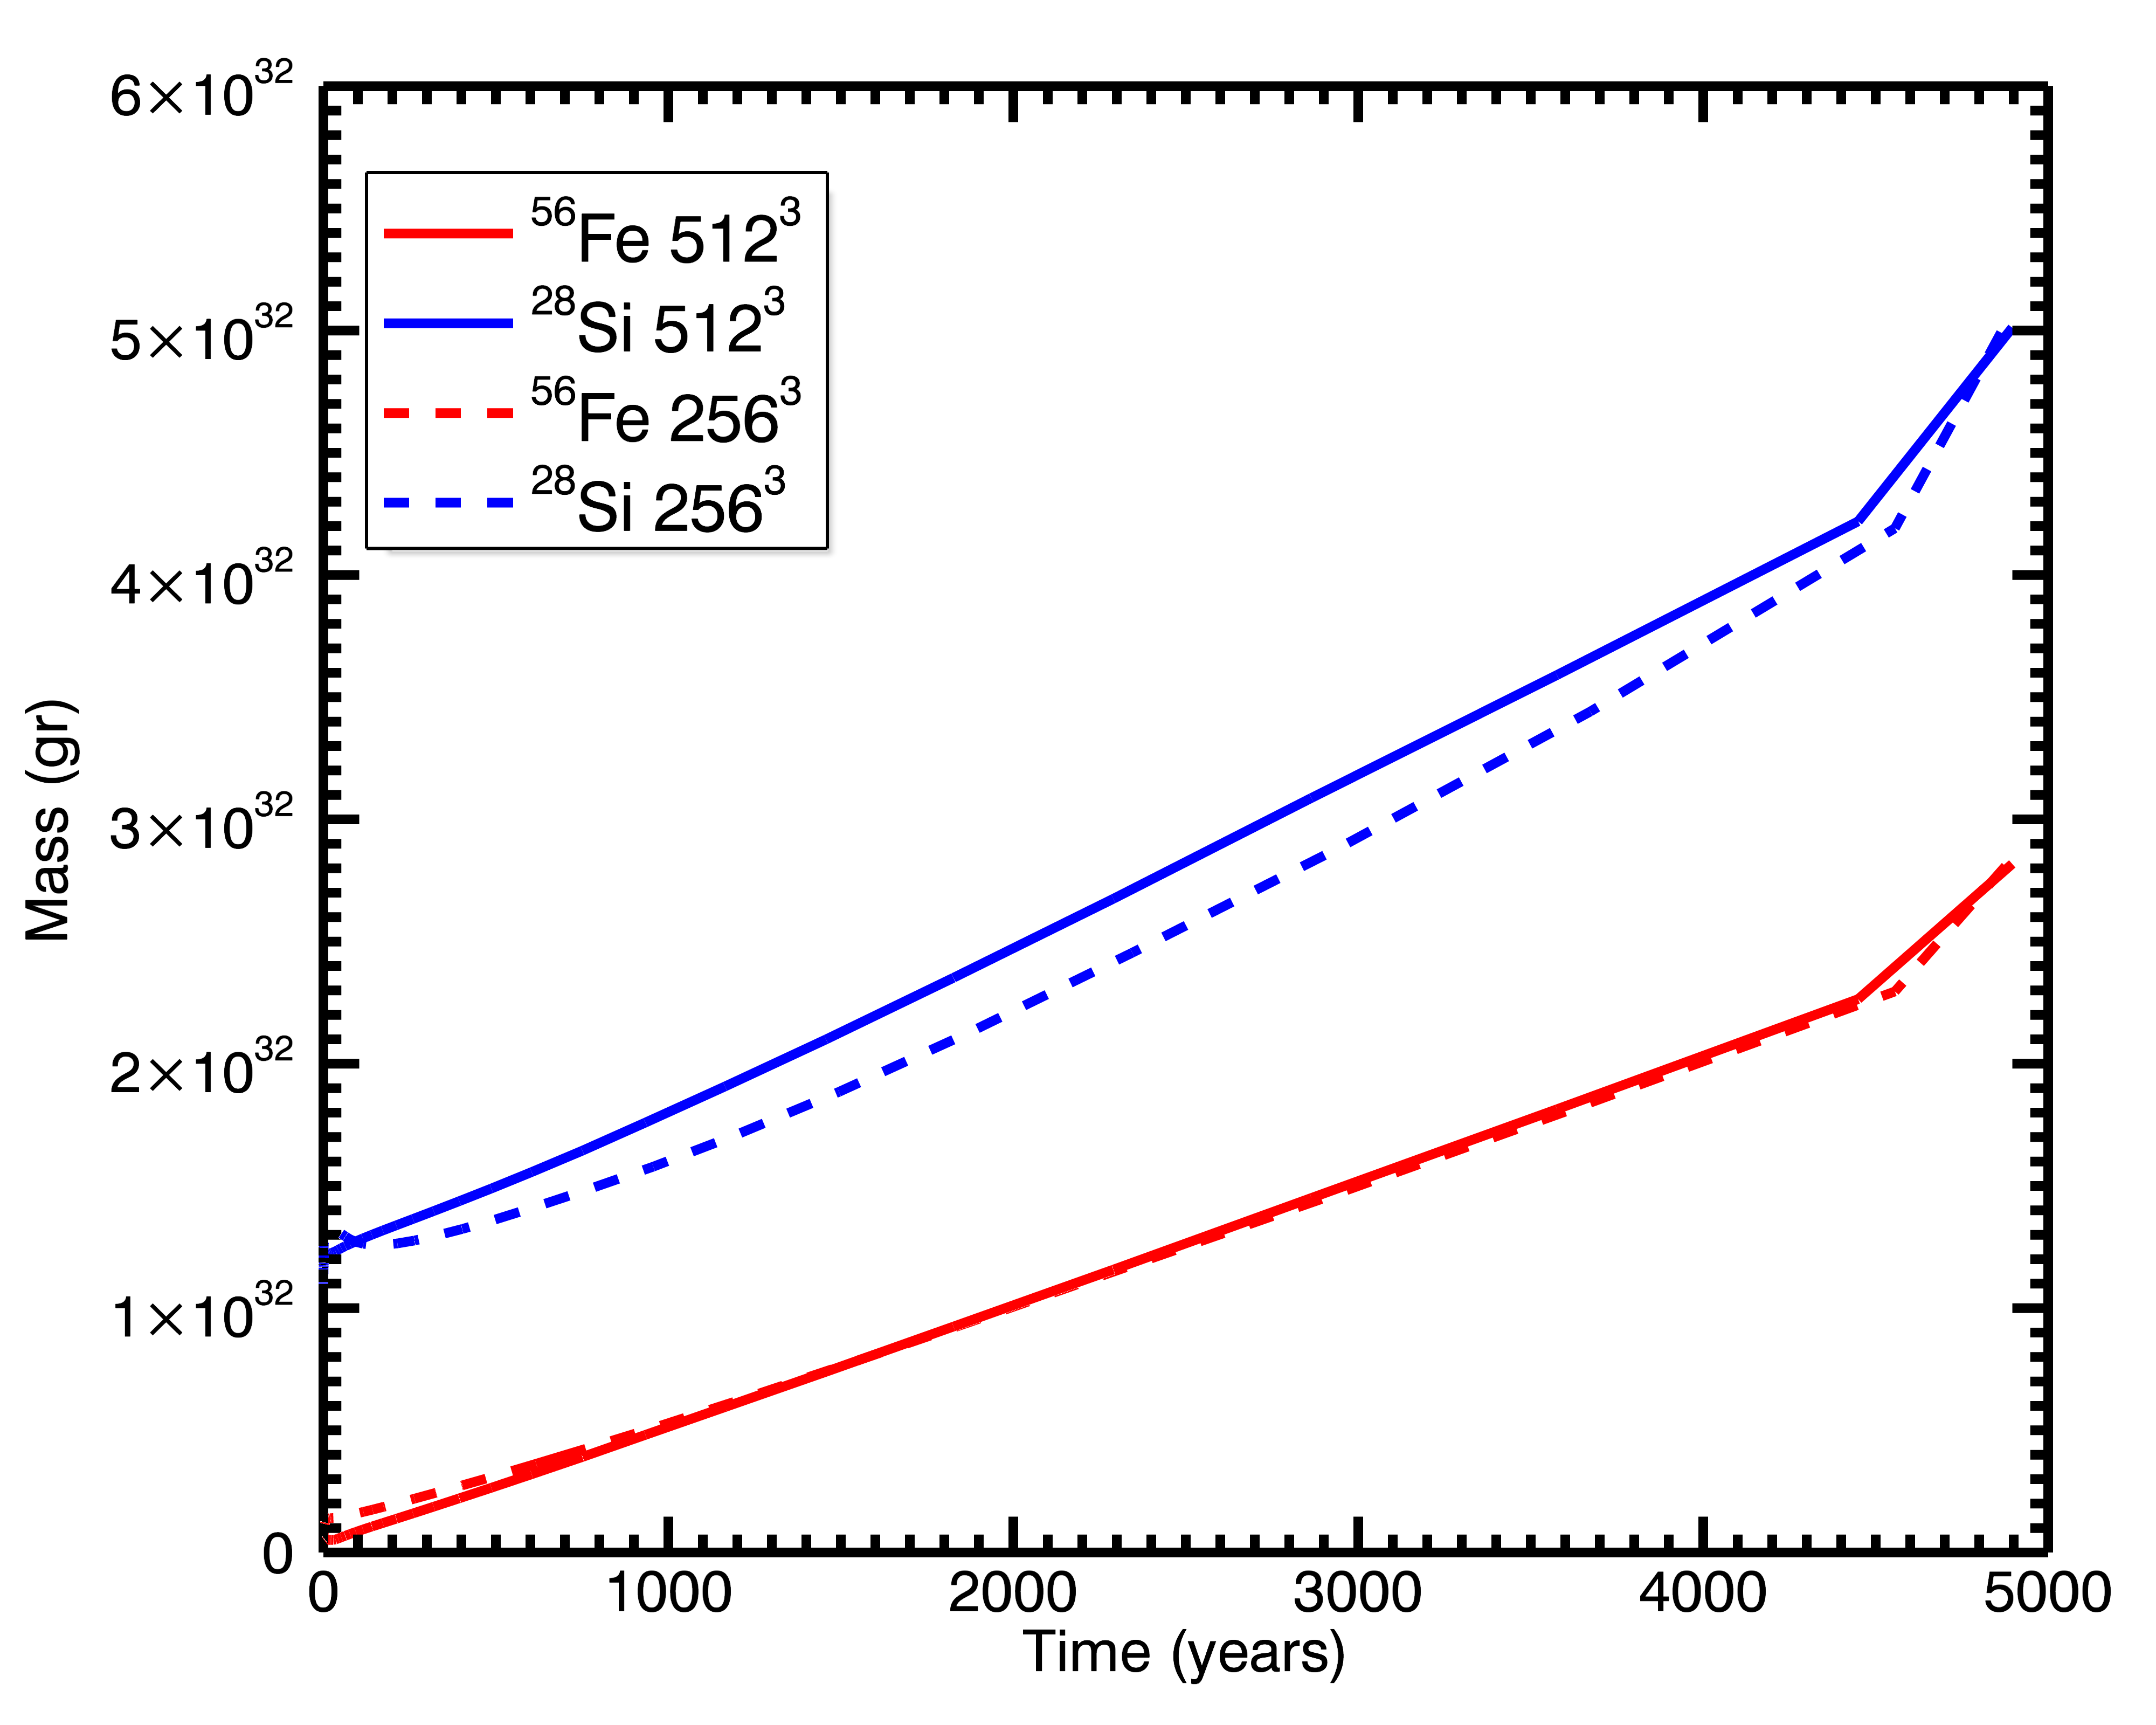
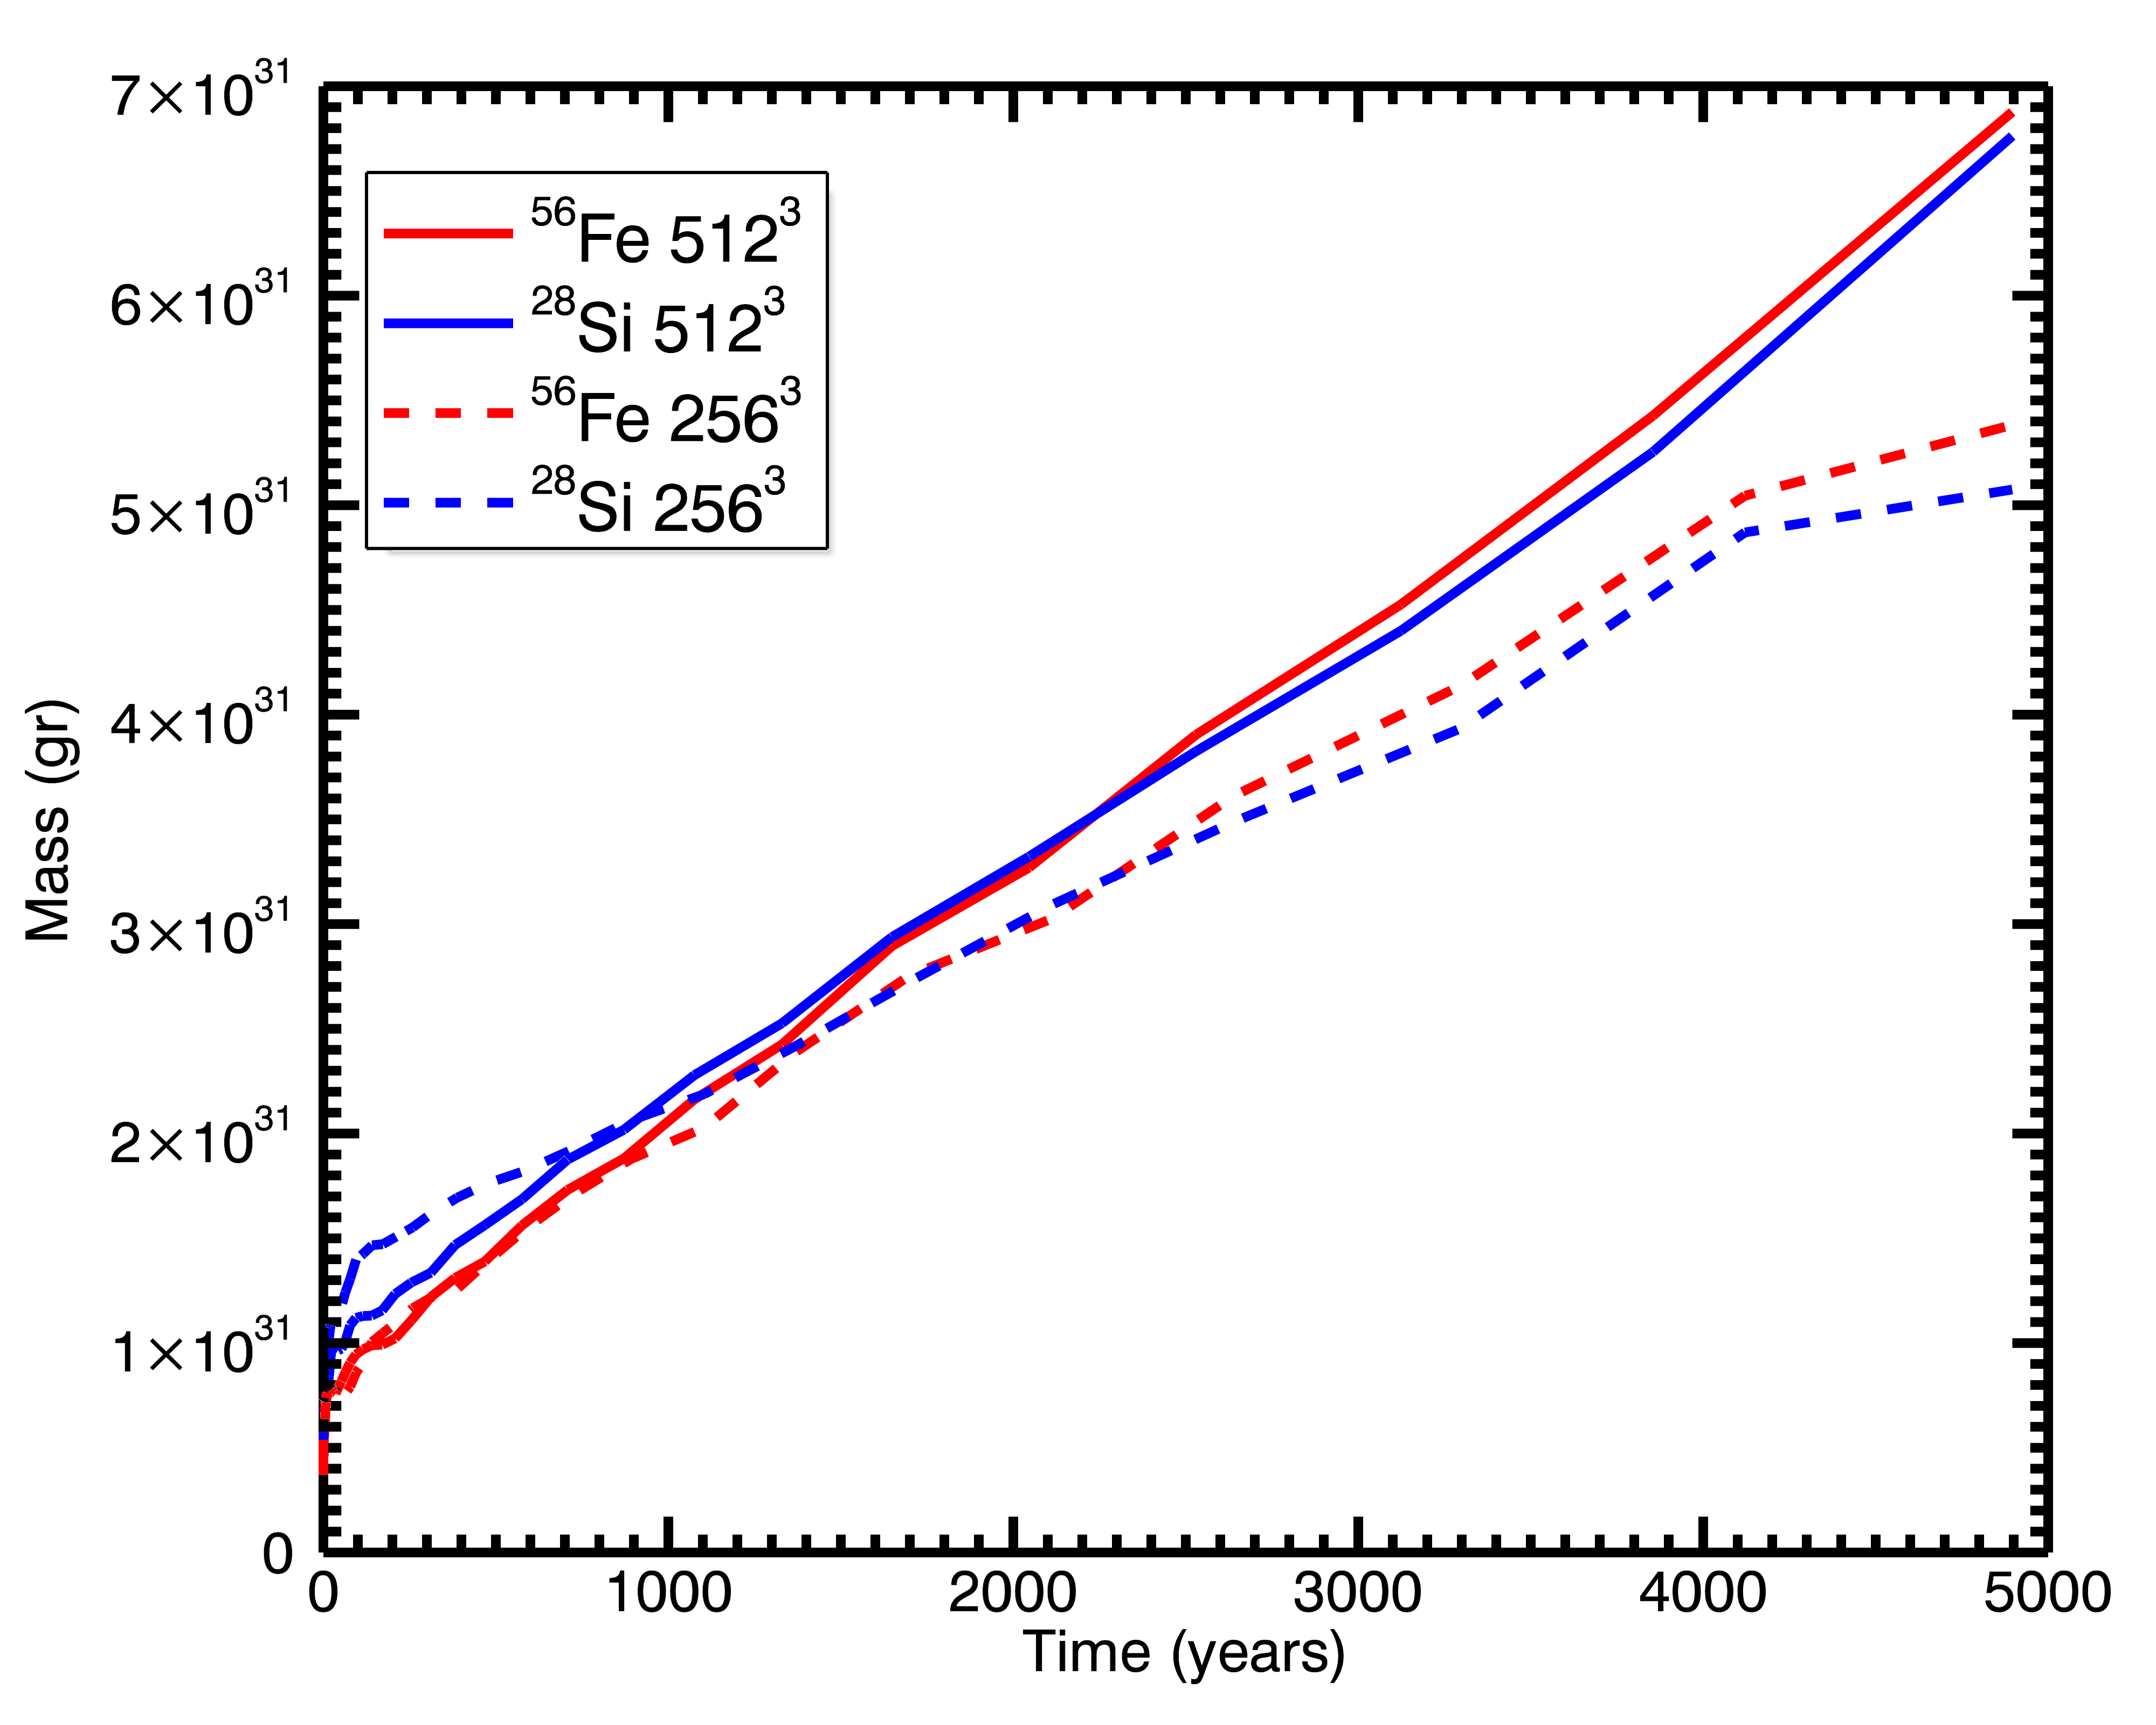
To ensure that the resolution used to perform the simulations ( grid zones) is sufficient to catch the basic properties of the system evolution, we repeated simulation Fe-R4-D750-V6 but using a uniform grid of grid zones (hereafter simulation Fe-R4-D750-V6-512pt) and we did the same for the spherically symmetric explosion simulation. Left panel of Fig. 11 shows density distributions in the () plane at the end of simulation time for both models at different resolutions. Right panel of Fig. 11 shows the same as left but for color coded images of the logarithm of the mass fraction distributions of 56Fe, 28Si, and 16O. As expected, the spatial resolution mainly affects the structure of the RT instability: the RT fingers appear more extended and branched in the case of higher spatial resolution (see right quadrants in the panels of Fig. 11). As a consequence, the spatial resolution changes the clump structure during its evolution. We also computed the distance of the center of mass of Fe-rich ejecta from the origin of the explosion for models Fe-R4-D750-V6 and Fe-R4-D750-V6-512pt, obtaining a value of cm and cm respectively, thus showing a slight discrepancy, of the order of 10%, in the distribution of 56Fe in the two cases. We checked that simulations Fe-R4-D750-V6 and Fe-R4-D750-V6-512pt yield similar results in terms of the amount of shocked material. We were mainly interested in the mixing between different chemical layers, we therefore computed the amount of 56Fe and 28Si within the cells where the mixing is more relevant for both spherical (left panel of Fig. 12) and non-spherical (right panel of Fig. 12) models. The profiles shown in Fig. 12 are in good agreement between the two models. This proves that, even if the small scale density structures developing during the propagation of the ejecta bullet depend on the spatial resolution, a resolution of uniform grid zones is able to capture the basic properties of the system evolution and of the matter-mixing among different chemical layers.
Appendix B: Boundary effects
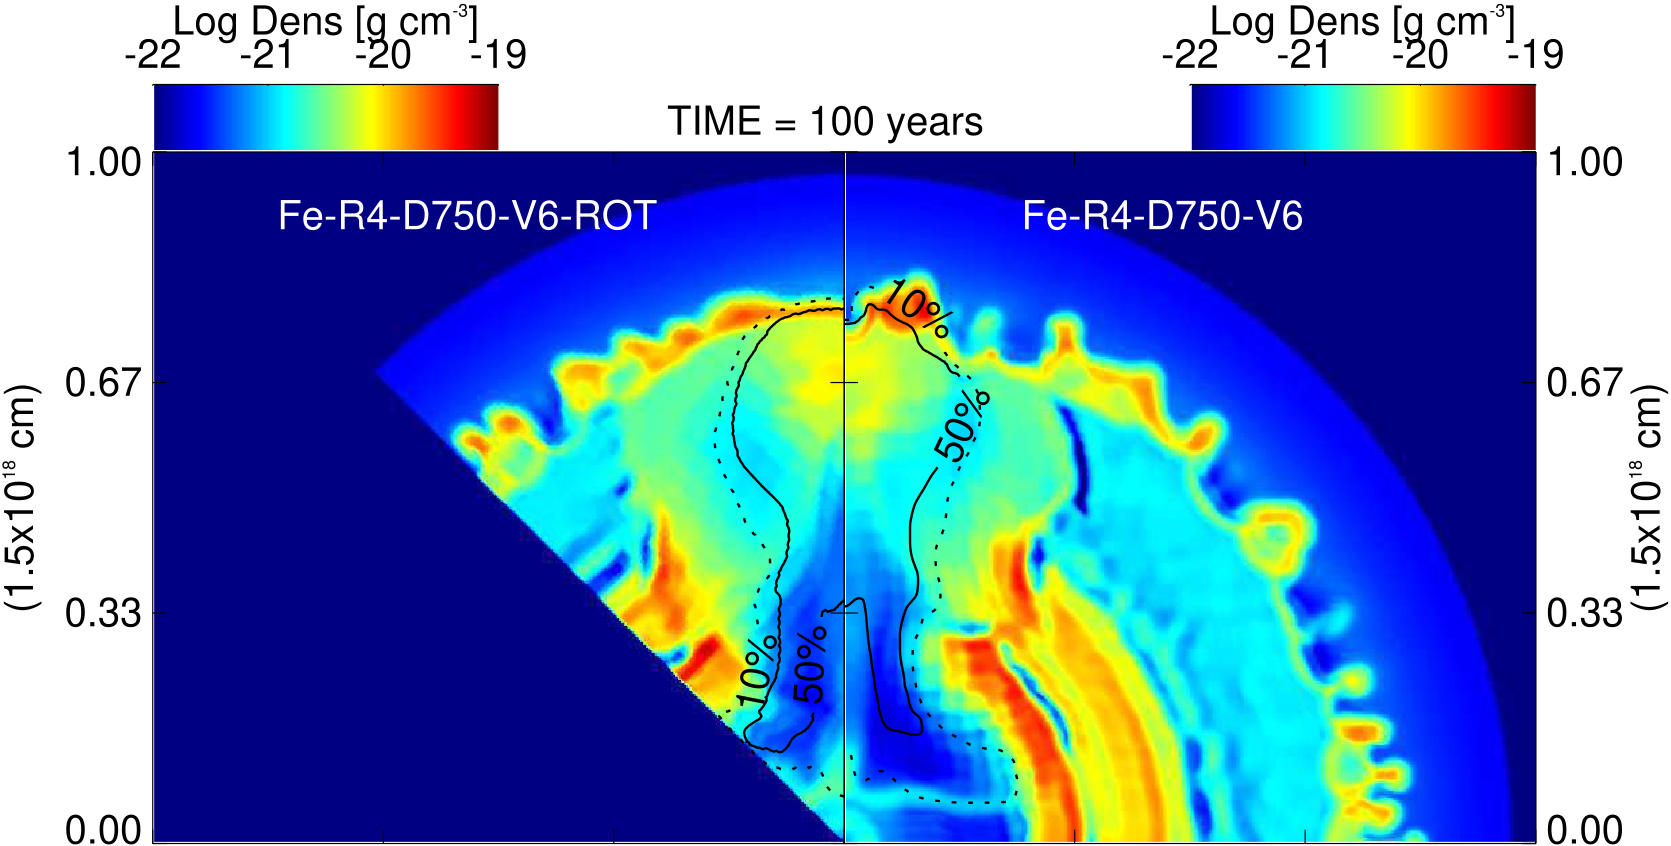
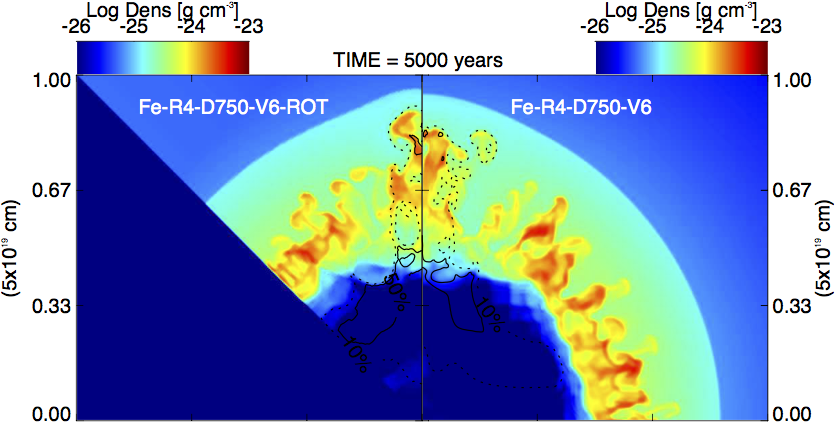
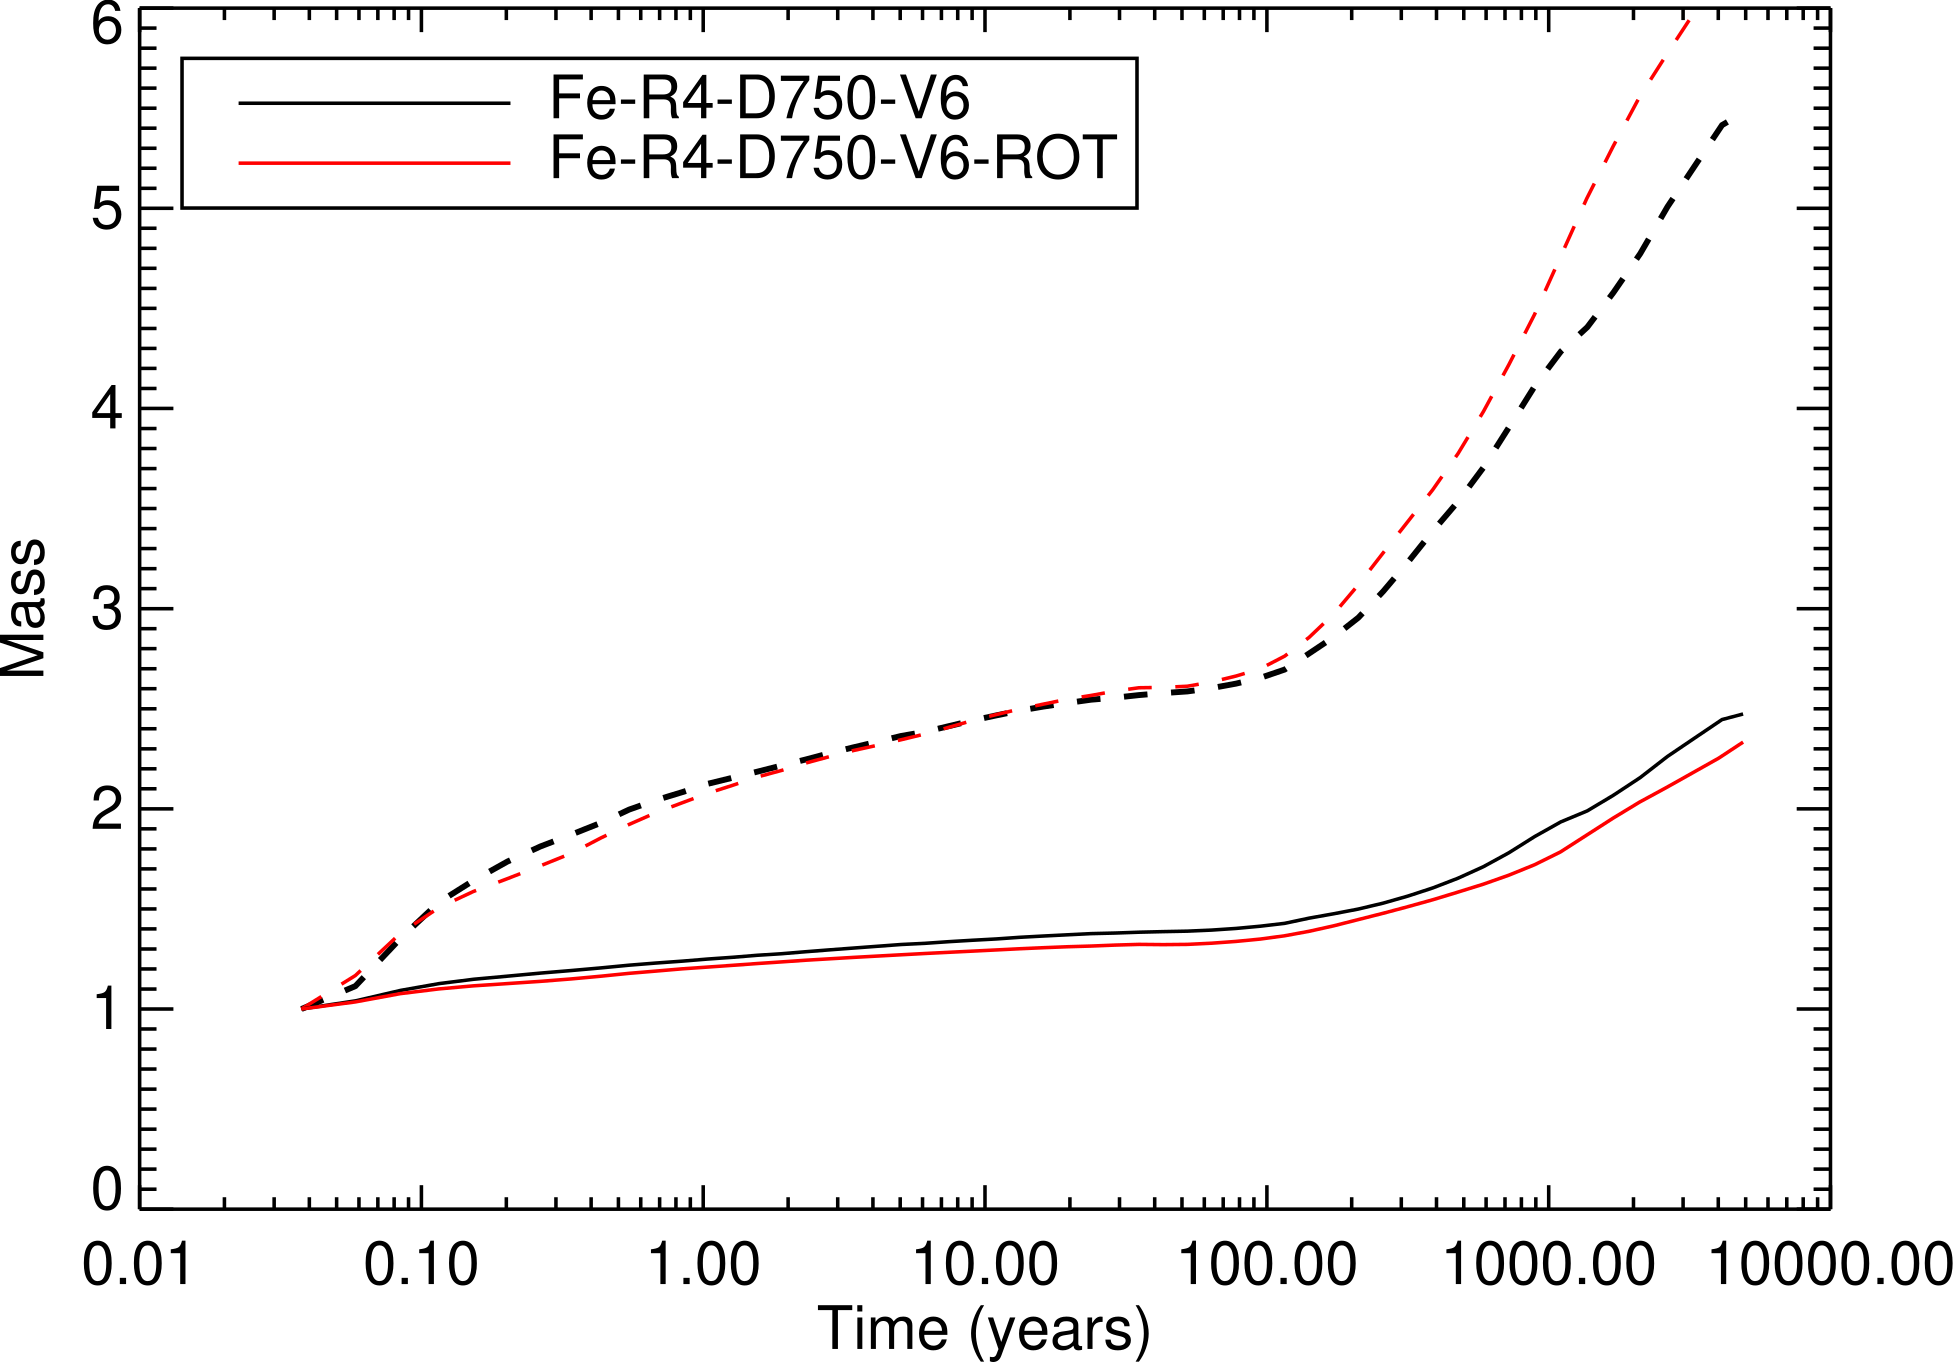
In our numerical setup the large scale anisotropy, or clump, has been described as a sphere with its center located on the z-axis of the domain (see Sec. 2.3). In Section 3.2 we have shown that the presence of this clump can cause a jet-like structure in the SNR that generates a strong mixing between different chemical layers. To ensure that the arise of this structure is not due to numerical artifacts caused by the proximity of the axis to the clump, we repeated simulation Fe-R4-D750-V6 placing the center of the clump at in the (x,0,z) plane (hereafter run Fe-R4-D750-V6-ROT). In Figure 13 we compare both models after years of evolution and at the end of the simulation, namely years after the explosion. The evolution and final density distribution does not change significantly rotating the initial position of the clump out from the z-axis. More specifically, we noted that the evolution of the ejecta bullet is indistinguishable in the two cases during the first phase of the simulations (the first 30 years), namely before the wake of the bullet reaches the (reflective) boundaries in run Fe-R4-D750-V6-ROT. In this latter case, the interaction of the wake with the boundaries produces reflection of material which propagates back into the domain. After yr (see upper panel in Fig. 13), when the clump overcome the high-density shell of ejecta and start to interact with the inter-shock region, we observe a lower presence of HD instabilities in the model Fe-R4-D750-V6-ROT (left panel) and also some artifacts due to the reflection of material on the boundary during the expansion. For this reason, the mixing of anisotropy material in the two models is slightly different after yr of evolution (see Fig. 14). The perturbation of the inner portion of the remnant by the material reflected at the boundaries in run Fe-R4-D750-V6-ROT is the reason why we preferred to consider the bullet propagating along the axis rather than at angle from all axes. Nevertheless, even with the perturbations in run Fe-R4-D750-V6-ROT, the evolution of the ejecta bullet in both simulations is very similar with no significant effects on the final remnant structure (see Sec. 3.2). In the light of this, we can affirm that the jet-like structures observed in the simulations discussed in the paper do not arise from numerical artifacts.