AstroSat UVIT Detections of Chandra X-ray Sources in M31
Abstract
An ultraviolet survey of M31 has been carried out during 2017-19 with the UVIT instrument onboard the AstroSat Observatory. Here we match the M31 UVIT source catalog (Leahy et al., 2020) with the Chandra source catalog (Vulic et al., 2016). We find 67 UVIT/Chandra sources detected in a varying number of UV and X-ray bands. The UV and X-ray photometry is analyzed using powerlaw and blackbody models. The X-ray types include 15 LMXBs and 5 AGNs. Cross-matches with catalogs of stars, clusters and other source types yield the following. 20 of the UVIT/Chandra sources match with M31 globular clusters and 9 with foreground stars. 3 more globular clusters and 2 more foreground stars are consistent with the UVIT source positions although outside the Chandra match radius of . The UV emission of the UVIT/Chandra sources associated with globular clusters is consistent with emission from blue horizontal branch stars rather than from the X-ray source. The LMXBs in globular clusters are among the most luminous globular clusters in M31. Comparison with stellar evolutionary tracks shows that the UVIT/Chandra sources with high UV blackbody temperatures are consistent with massive (10 to 30 M⊙) stars in M31.
1 Introduction
M31 is our closest neighboring large galaxy and is a spiral similar in many ways to the Milky Way. Studies of large numbers of stars have been done in detail for our own Galaxy, but have uncertainties related often to uncertain distances or to strong extinction. The advantage of studying objects in M31 is that it is at a well known distance (783 kpc, McConnachie et al. 2005).
A UV instrument was launched on 28 September 2015 as part of the AstroSat mission (Singh et al., 2014). AstroSat has four instruments, covering near and far ultraviolet (NUV and FUV) with the UVIT telescope, and soft through hard X-rays with the SXT, LAXPC and CZTI instruments. The UVIT telescope and its calibration are described in Tandon et al. (2020), Tandon et al. (2017a), Tandon et al. (2017b), Postma et al. (2011) and references therein. The UVIT observations have high spatial resolution (1 arcsec), thus have the capability of resolving individual stellar clusters and a large number of individual stars in M31.
This paper presents an analysis of sources in M31 detected in both UV and X-rays. It utilizes the M31 UVIT catalog (Leahy et al., 2020) and M31 Chandra catalog (Vulic et al., 2016). We briefly describe the observations in section 2. The source cross-identification and the analysis of the photometry is presented in section 3. We discuss source properties in section 4 and summarize the results in section 6.
2 Observations
UVIT is comprised of two 38 cm telescopes, one for far ultraviolet (FUV) (130 to 180 nm) wavelengths and one for near ultraviolet (NUV) (200 to 300 nm) and visible (VIS) (320 to 550 nm) wavelengths. The FUV, NUV and VIS channels each have a number of filters with different bandpasses. The pixel scale for UVIT images is 0.4168 arcsec per pixel. Point sources in the UVIT images have FWHM 1 arcsec in the FUV and NUV channels. To create the M31 UVIT catalog a new analysis of the UVIT photometric and astrometric errors was carried out (Leahy et al., 2020). The following filters were used for the M31 UVIT survey: CaF2 (123 to 173 nm), BaF2 (135 to 173 nm), Sapphire (146 to 175 nm), Silica (165 to 178 nm), NUVB15 (206 to 233 nm) and NUVN2 (275 to 284 nm).
The UVIT instrument (Tandon et al., 2017a) consists of an FUV telecsope and a NUV/VIS telescope. The latter has a beam splitter to direct the NUV and VIS light onto 2 different detectors. The VIS channel is used for spacecraft pointing, so normally science observations are carried out simultaneously in FUV and NUV channels. The NUV channel failed in early 2018, so that science observations since then have been carried out in FUV only. Whenever two or more FUV filters or two or more NUV filters are utilized, the observations must take place at different times. The BJD (Barycentric Julian Dates) of the start times of the observations of M31 are given in Table 1 of Leahy et al. (2020).
The field of view of each UVIT telescope is 28 arcmin in diameter, thus to cover the large area of M31 19 different fields (listed in Table 1 of Leahy et al. 2020) were required. For M31, the observation times are clustered in 3 20-60 day intervals around BJD2457700, BJD2458080 and BJD2458400, separated by 1 year. The observations in different FUV and NUV filters for a given field were observed within 0.2 to 0.5 days, with exposure times of between 1900 and 15000 s. There were no repeated observations of any field in any single filter.
The FUVCaF2 filter was used for 18 of the 19 fields of M31; NUVN2 filter for 9 fields; NUVB15 filter for 10 fields; FUVSilica filter for 10 fields; FUV Sapphire filter for 6 fields; and FUV BaF2 filter for 1 field. This, combined with the wide bandwidth of FUV CaF2 filter (500 nm) compared to the other filters meant that the CaF2 observations detected the largest number of sources. We used a threshold of 3 sigma excess above local background to identify potential point sources. Then we perform a PSF (point spread function) fit to the source and kept the source if total counts in the fit was more than 8 sigma above background. Thus the likelihood of false detections is small among the 30,000 sources detected in the CaF2 filter, or among the total number of detections of 70,000 for all filters.
The position uncertainties for UVIT were determined as follows. The images were registered to optical position calibrators from Gaia. The standard deviation of the resulting Gaia-UVIT offsets ranged from 0.15 arcsec to 0.7 arcsec (Table 2 of Leahy et al. 2020). Then the offsets between sources in the same field measured in different filters were measured (Fig. 15 of Leahy et al. 2020), showing a peak for real matches at separation of 0 to 0.4 arcsec, and a rise for separations 2 arcsec consistent with the expected number of accidental matches.
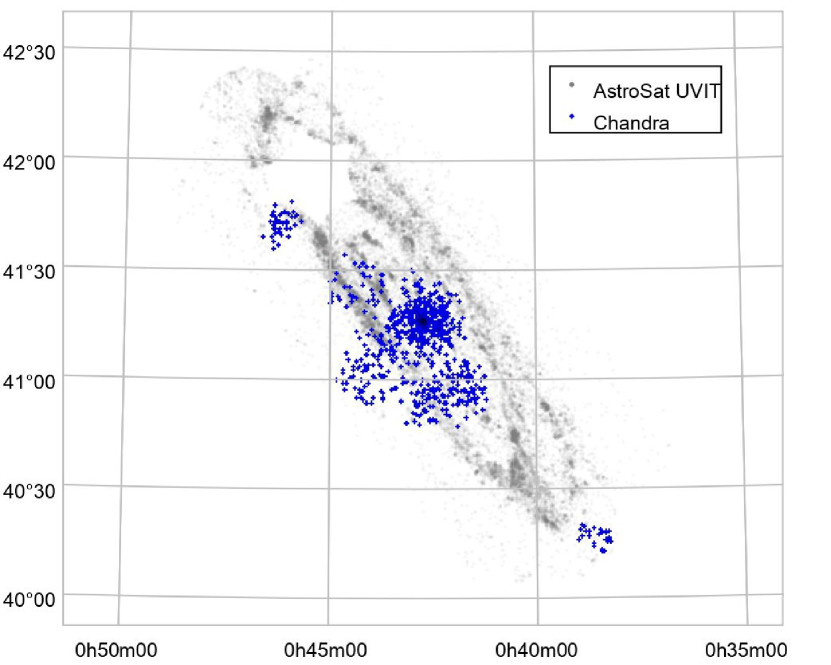
A description of the Chandra source catalog for M31 is given in Vulic et al. (2016). The Chandra images were registered to the CHFT i-band image of M31, which was corrected to match the Two Mirocn All Sky Survey, which is accurate to better than 0.2 arcsec. The position errors listed in the source catalog were taken as standard deviations of the PSF in the extraction region and are typically 0.3 arcsec. A map of the positions of the 31337 sources detected in the UVIT CaF2 filter is shown in Figure 1. Overlaid on the UVIT source positions are the positions of the 935 X-ray sources in the Chandra catalog.
3 Analysis
3.1 Cross-matching sources
In order to cross-match the catalogs, we compared the position uncertainties of Chandra and UVIT sources and determined an appropriate match radius. In the Chandra catalog, position uncertainties are typically , with more than below . The UVIT position uncertainties close to the bulge (where most Chandra sources are located) are on average -. Therefore, we expect the majority of Chandra sources and UVIT sources that are correlated to be separated by of each other. Some UVIT and Chandra sources have position uncertainty above , meaning that a separation of is also possible.
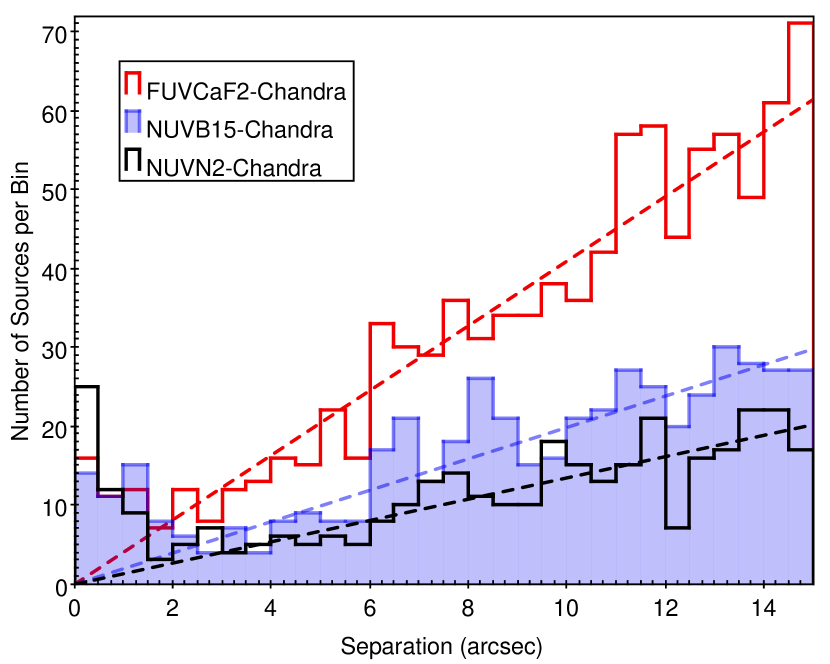
In Figure 2, we plot the separation distribution between FUVCaF2 sources and Chandra sources; between NUVB15 sources and Chandra sources; and between NUVN2 sources and Chandra sources. We exclude FUVSapphire and FUVSilica sources from the analysis of separation distributions because there were not enough of them. All three distributions become approximately linear above a separation of , where UVIT and Chandra sources are no longer correlated. A linear function for number of matches per unit radius, , is expected for a random distribution of sources because the differential increase in area is . We fit a linear function to each distribution using only points above a separation of , plotted as dashed lines in Figure 2. We then extrapolated the line of best-fit to small separations to estimate the number of accidental matches.
According to the line of best-fit, accidental matches are negligible for separations between - but become significant for separations around - for all three distributions. We assume that FUVSapphire and FUVSilica sources follow the same pattern as well. Therefore, to minimize accidental matches while keeping as many real matches as possible, we chose as the match radius for cross-matching UVIT and Chandra sources, and took only the closest match within the radius. In total, we matched 67 UVIT sources with 67 Chandra sources. 1 source is detected in 5 UVIT bands; 17 sources in 4 bands; 24 sources in 3 bands; 8 sources in 2 bands; and 17 sources in 1 band. The 67 UVIT/Chandra sources are listed in Table 1.
From Figure 2 we estimate the number of accidental/spurious matches between the different UVIT filter bands with separation : for CaF2 9; for NUVB15 5; and for NUVN2 3. We separated the total matches into those with separation and those with 1-2′′. The numbers are: for CaF2 27 in plus 15 in 1-2′′; for NUVB15 25 in plus 19 in 1-2′′; for NUVN2: 37 in plus 9 in 1-2′′. To indicate the higher probability of accidental match, sources that match within 1-2′′ are marked in Table 1 with an asterisk for the appropriate UVIT band. The fraction of total matches wth separations 1-2′′ is highest (43%) for NUVB15 and lowest (20%) for NUVN2. The expected fraction of accidental matches with separations 1-2′′ is highest for CaF2 (6 of 15) and smaller for NUVB15 (3.5 of 19) and NUVN2 (2 of 9).
3.2 UV spectrum analysis
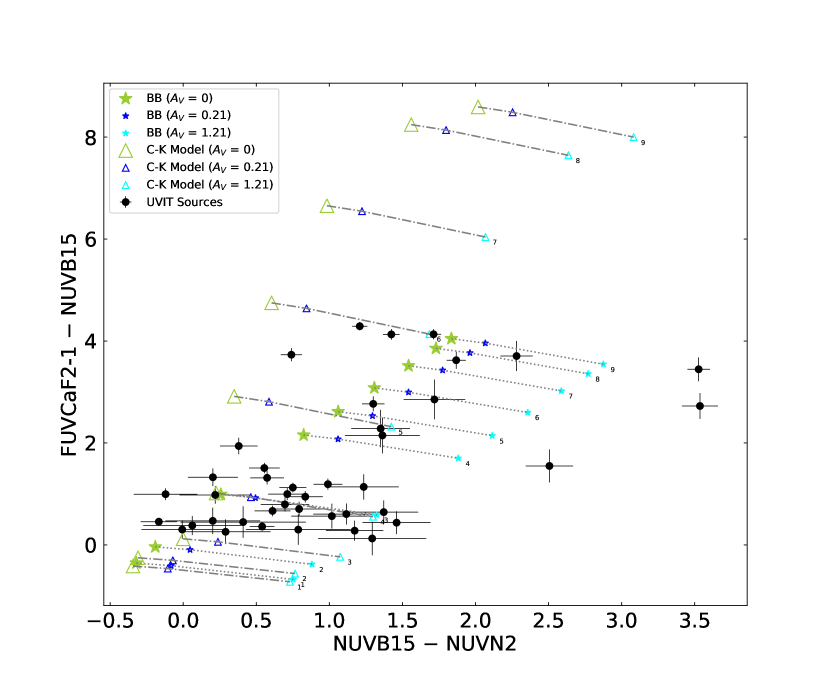
The color-color diagram using FUVCaF2, NUVB15, and NUVN2 magnitudes is shown in Figure 3. 41 of the 67 matched sources were detected in these three UV bands. The extinction curve has a peak at 4.59 (218 nm) with a half-width of nm (Fitzpatrick & Massa, 2007). This peak coincides with the NUVB15 filter. As a result, the FUVCaF2-NUVB15 color becomes bluer and the NUVB15-NUVN2 color becomes redder as extinction increases, as seen in Figure 3.
A series of black bodies of different temperatures, and a series of stellar models (from Castelli & Kurucz 2004) that correspond to different main-sequence stars, are plotted in Figure 3. Three different extinctions111We use the extinction curve of Fitzpatrick & Massa (2007). , and are connected by dotted lines. is the expected foreground extinction to M31 from our Galaxy. The data points right of the model points could be caused by higher extinction than .
The CK models for stars are redder than blackbodies in NUVB15-NUVN2 color for some Teff and bluer for other Teff. A bigger difference is seen in FUVCaF2-NUVB15 color: The CK models are much redder for T K and not much different in color for higher Teff. It is seen that the data are roughly consistent with blackbodies with temperatures in the range K to 30000 K, or with stellar spectra with temperatures in the range K to 15000 K. The reason is that the UV emission of stellar spectra is more sensitive to temperature than for blackbodies. For bluer sources (FUVCaF2-NUVB152) the blackbodies and stellar models cover nearly the same region.
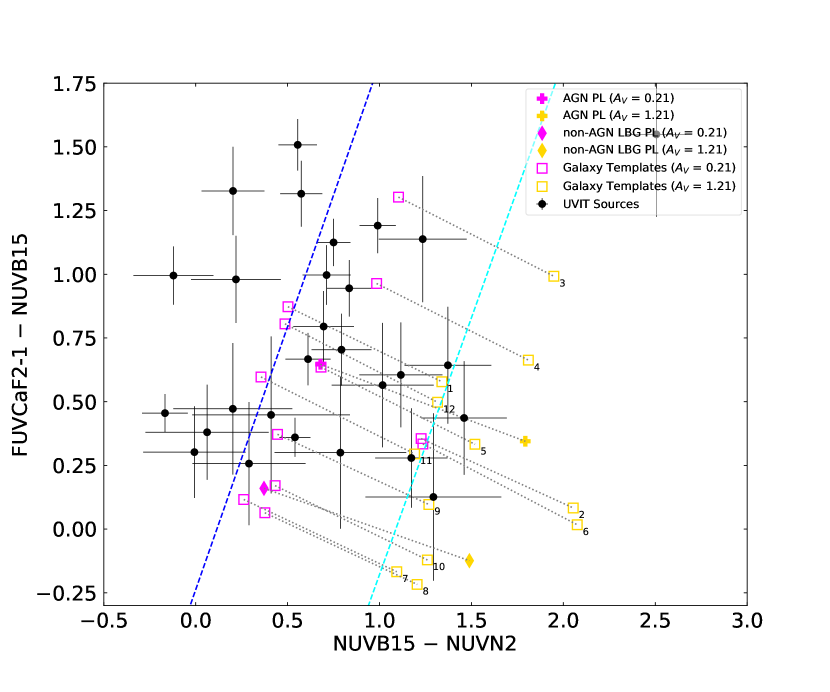
Figure 4 is an expanded plot, where we show the 28 sources at the bottom left of Figure 3. On this diagram, we mark a series of points using template galaxy spectra as well as power law continuum of AGNs and non-AGN Lyman-break galaxies222Galaxy templates are from the Kinney- Calzetti Spectal Atlas of Galaxies at STScI; AGN and Lyman-break galaxy templates are from Hainline et al. (2011).. The lines joining black bodies with (blue dashed line) and (cyan dashed line) are shown333 is the Milky Way foreground reddening and we estimate internal extinction in M31 of 0 to 1. The galaxy templates include internal reddening, depending on galaxy type. Thus all three contributions to reddening are included. . This illustrates that the region covered by blackbodies (from Figure 3) overlaps that of galaxies, which makes it hard to distinguish stars from galaxies in the UV color-color diagram. Only bulges and Sc galaxies are significantly offset from the stars region: they are redder in NUVB15-NUVN2 color, yet similar in FUVCaF2-NUVB15 color.
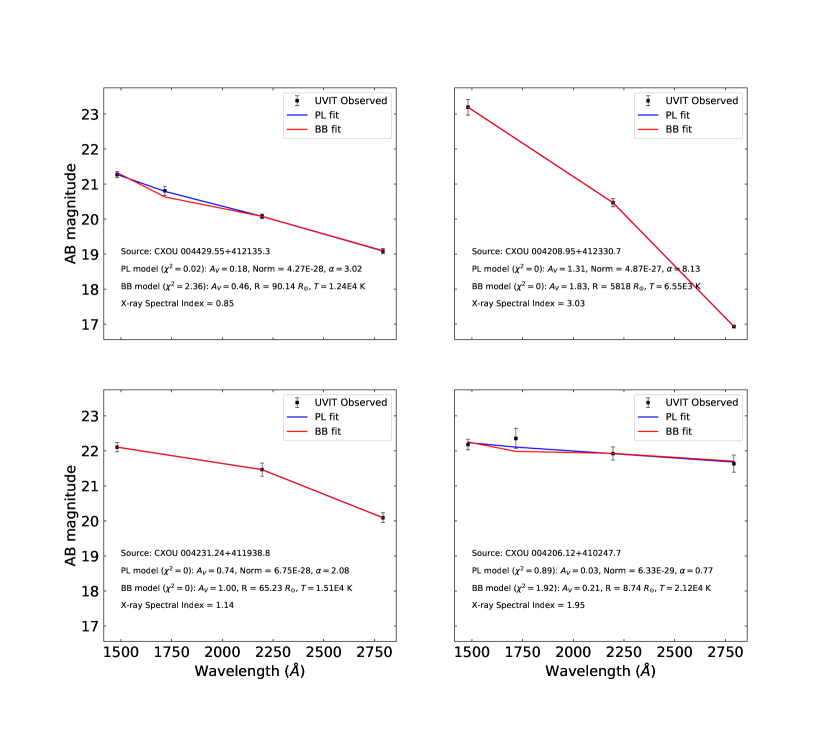
For the 41 matched sources with three or more UV magnitudes, we fit their UV magnitudes using: i) a black body (BB) function with parameters temperature, radius, and ; and ii) with a power-law (PL) function with parameters normalization, PL index, and . For the PL, we use the form , with Hz and is the PL energy index. We use least-squares fitting, minimizing , with and data and error for filter i and the model with parameter set .
Fig. 5 shows spectra for four of the sources and their best-fit BB and PL models. The source in the upper-right panel has a power law index of 8.1, which is unphysical. The probable correct interpretation is a thermal model, where the steep slope is caused by fitting a power law to the Wien tail of a thermal spectrum. The best-fit parameters and values for each source, for both BB and PL fits, are shown in Table 2. The errors in parameters were calculated by varying the fit parameters to obtain equal to the best-fit value plus 6.21 for the case of 3 parameters (see Chapter 15 in Press et al. 2002).
For the 8 sources with only two magnitudes, we assume a fixed extinction of and fit the 2 data points with two parameter BB or PL models to obtain the parameters (temperature, radius for BB or normalization and index for PL). The errors were obtained as above except that for the case of 2 parameters we use best-fit value plus 4.61. Sources with only one magnitude have no fit (no index or ) and are not listed in Table 2.
3.3 UV and X-ray comparison
Each source in the Chandra catalog has a summed soft band (- keV) flux and a summed hard band (- keV) flux. We use the ratio of the two fluxes to obtain an X-ray PL energy index, . Results are shown in the tenth column of Table 1. Some UVIT-Chandra sources have no measured hard band flux (given as in the Chandra catalog). For these sources, we were unable to obtain a powerlaw index, so those entries are left blank in the table.
For each matched source, we utilise the UV flux and the X-ray flux to obtain an UV to X-ray PL energy index, . We calculate the index by taking the ratio between the summed soft band X-ray flux and the UV flux in the band with the highest energy. The index for each source is given in column eleven of Table 1. For both X-ray PL index and UV to X-ray PL index, the error is obtained from the photometric errors using error propagation.
4 Results
4.1 Identifications of the UVIT/Chandra sources
Table 1 lists previous identifications of source types in X-ray and optical. In X-ray, Vulic et al. (2016) identified a subset of their sources as LMXBs or as AGNs. The LMXBs were identified using Stiele et al. (2011). The AGNs were identified by matching to the background galaxies and AGN from Johnson et al. (2015), quasars from the LAMOST survey (Huo et al., 2015) and AGN listed in NED, SIMBAD and SDSS DR12. 15 of our 67 sources have LMXB identifications and 5 have AGN identifications. Sasaki et al. (2018) gave X-ray identifications for the XMM-Newton survery of the northern disk of M31444Matching to the catalog of Sasaki et al. (2018) used a cutoff (2 position error).. Their X-ray sources were classified as: foreground star (fgstar), X-ray binary (XRB), supernova remnant (SNR), Galaxy, or hard, using a combination of methods. They indicated candidate sources by putting the classification in angle brackets (e.g. XRB). 2 of our sources are XRB, 4 are XRB, 2 are fgstar, and 1 is SNR.
In optical, Johnson et al. (2015) identified stellar clusters and background galaxies in the PHAT survey, with 2753 clusters and 2270 galaxies identified555Matching to the catalog of Johnson et al. (2015) used a cutoff (2 position error).. In Table 1 we mark the 13 UV/X-ray sources identified as stellar clusters by C in the last column. None of our UV/X-ray sources matched background galaxies from Johnson et al. (2015). Williams et al. (2018) compared Chandra and HST observations of M31 to study X-ray sources666Matching to the catalog of Williams et al. (2018) used a cutoff (2 position error).. They identified the X-ray sources as point source (labelled p), background galaxy, star cluster (c), foreground star (f), SNR (s), or no PHAT counterpart (n). We include their classification in the last column of Table 1. Our list of UV/X-ray sources includes 2 star clusters, and 1 each of p, f, s and n categories. We also matched to their list of HMXB candidates and found none of our sources matched those.
The sources in Table 1 were searched for identifications using the VizieR catalog search tool (http://webviz.u-strasbg.fr/viz-bin/VizieR) with a search radius of of the Chandra position. Associations with separation are marked with an asterisk in Table 1. Those with separation are probably not associated with the X-ray source, and some with separation are chance alignments. Those were kept because of the larger UVIT source position errors: some could be associated with the UVIT sources although most are likely chance alignments. Those found in the Gaia DR2 catalog (Gaia Collaboration et al., 2018) with Gaia distances (Bailer-Jones et al., 2018) are indicated in Table 1 by GD or GD*. If the UVIT photometry was consistent with being a foreground star, the source was marked as GDfg or GDfg*. Sources identified as globular clusters in M31 (Caldwell & Romanowsky 2016, Sakari et al. 2016) are marked as GC or GC*.
4.2 Fits to the UVIT photometry
The results of our UV spectrum fits are given in Table 2. For the 10 foreground stars (source number with (fg)), the radius in column 6 is calculated using the Gaia distance. We compare the values for the BB and PL fits to find if the fits are statistically good (marked Bestfit in the last column). To label a model a bestfit model, we require for at least one of BB or PL. If both models have and the fit with the higher has less than the of the bestfit plus 1, we mark both PL and BB as bestfit models. For 11 of the 49 sources in Table 2, neither BB nor PL gives a good fit to the UV spectrum. For 29 sources, both BB and PL give a good fit. For 6 sources only BB gives a good fit and for 3 sources only PL gives a good fit.
4.2.1 Blackbody fits
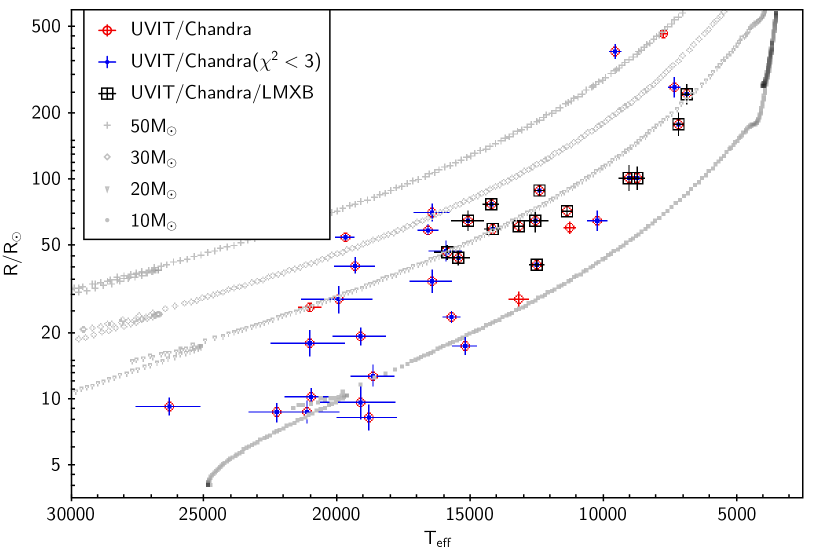
Figure 6 shows , and 90% errors from the blackbody fits to the UVIT photometry, excluding the sources identified as foreground stars. Evolutionary tracks777These tracks are from simple stellar models constructed using EZ-Web at astro.wisc.edu/ townsend. for stars of mass 10, 20, 30, 50 and 100 are plotted for comparison. The good fits, with , are marked with blue symbols. Comparison of the good fits to the models shows consistency with evolved stars with mass between 10 and 30 . The six sources with fit radii above the 100 evolutionary track could be compact clusters of massive stars. E.g., a hundred 30 stars of radius 500 have an effective radius 10 times that of a single 30 consistent with the fits.
4.2.2 Powerlaw fits
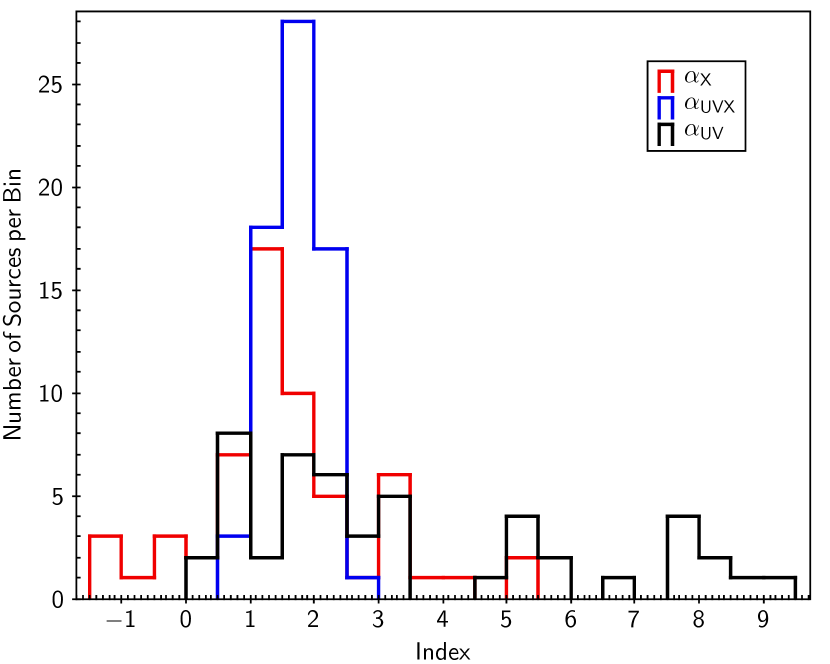
Table 1 lists both X-ray PL index () and UV to X-ray PL index (). Table 2 lists UV PL index (). Figure 7 shows the distribution of X-ray indices, UV to X-ray indices and of UV indices. The X-ray indices span a wide range, -1.5 to 5.5. The most negative index expected is -2, corresponding to the Rayleigh-Jeans long wavelength side of a blackbody, and high values can be from the Wien side (high energy tail) of a blackbody. Nonthermal spectra have expected indices in the range 0 to 2. The UV to X-ray indices cover a narrow range, 0.5 to 2.5, roughly consistent with standard non-thermal spectra from UV to X-ray. The UV indices cover a wide range, 0 to 9. The ones from 0 to 2 are consistent with standard non-thermal spectra. The ones that are higher likely indicate the Wien tail of a thermal spectrum which has temperature lower than the longest wavelength UV band observed for that source. E.g. if measured in NUVN2 filter, the source has a temperature less than 10,000 K. None of the UV or UV to X-ray indices is , showing that from near UV to far UV and from far UV to soft X-ray, the spectra are all decreasing with increasing energy. The sources with X-ray index are likely caused by a hard X-ray excess, as expected for HMXBs.
4.3 Analysis of broadband UV and X-ray photometry
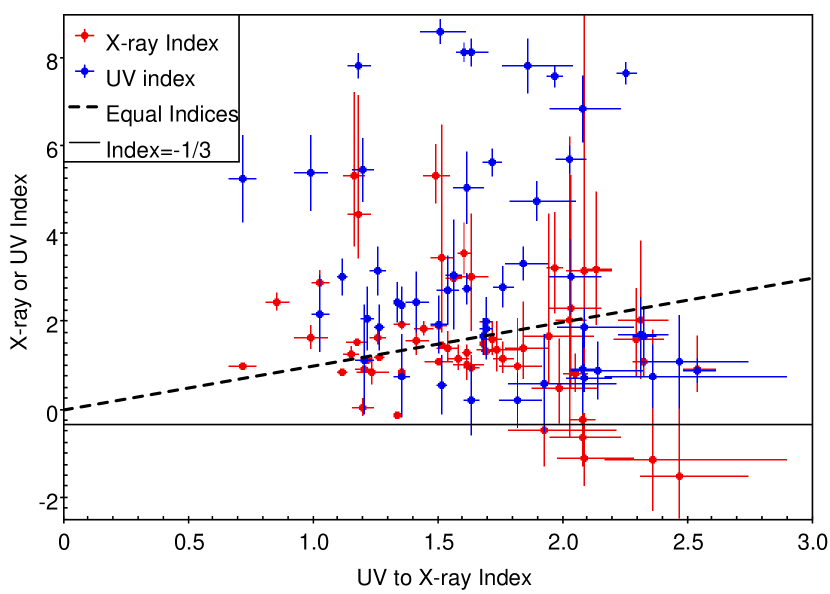
Figure 8 shows X-ray index and UV index vs UV to X-ray index for the sources. The line of agreement of indices is shown as the dashed black line. Agreement of and shows that the spectrum from X-ray to UV (excluding the low energy UV bands) is consistent with a single PL. Of the 59 sources both indices, and agree within 90% errors for 16 sources. Thus for 1/4 of the sources the indices match well; for 1/4 of the sources the indices are consistent within 3; and for the remaining 1/2, the indices are significantly different. Similarly, agreement of and shows that the spectrum from X-ray (excluding the high energy X-ray band) to UV is consistent with a single PL. About 1/3 sources (10 of 31) show agreement within the 90% errors. In addition, there are several cases where vs. agree to within the 3 errors.
The PL index falls in the range of 1 to 3 for sources with consistent and or and . For all 22 cases with steep UV PL index (3), the BB fit is better than or as good as the PL fit. This confirms that the spectrum is most likely a thermal spectrum. The temperatures for these BB fits are all below 12000 K, and steeper values of index are related with lower temperatures, further confirming that the spectra are BB or stellar.
The line of X-ray PL index is marked on Figure 8, which corresponds to the spectrum expected for a multi-temperature accretion disk (Makishima et al., 1986). This is the spectrum expected for an LMXB which is dominated by emission from the accretion disk if the inner disk temperature is as high as the hard X-ray band (2-8 keV) used for the X-ray catalog (Vulic et al., 2016). From Table 1, we find 8 of the sources (nos. 2, 27, 32, 40, 46, 49, 57 and 60) have X-ray index consistent or near this value. Of these 8, only nos. 27 and 57 were previously identified as LMXBs. Most identified LMXBs have X-ray PL index between 1 and 2. This can be explained if the inner disk temperature is lower than 2 keV, which is expected for many LMXBs. None of these 8 sources has consistent with -1/3, which indicates that the X-ray to UV spectrum is not described by a disk blackbody. This could be caused by several reasons, including an outer disk temperature hotter than the shortest UV wavelength (temperature of 20,000 K) or a companion star which contributes to the UV fluxes.
5 Discussion
Here we study the properties of X-ray sources associated with UV sources in M31 made possible by the high spatial resolution of UVIT. The most numerous identified X-ray type is LMXB, with 15 sources. Here (Table 1) we found that all 15 LMXBs which are detected with UVIT are associated with globular clusters. This is not surprising because the expected UV emission from an LMXB at the distance of M31 is below the sensitivity limit of UVIT, whereas the UV emission from BHB stars in a globular cluster in M31 is readily detectable.
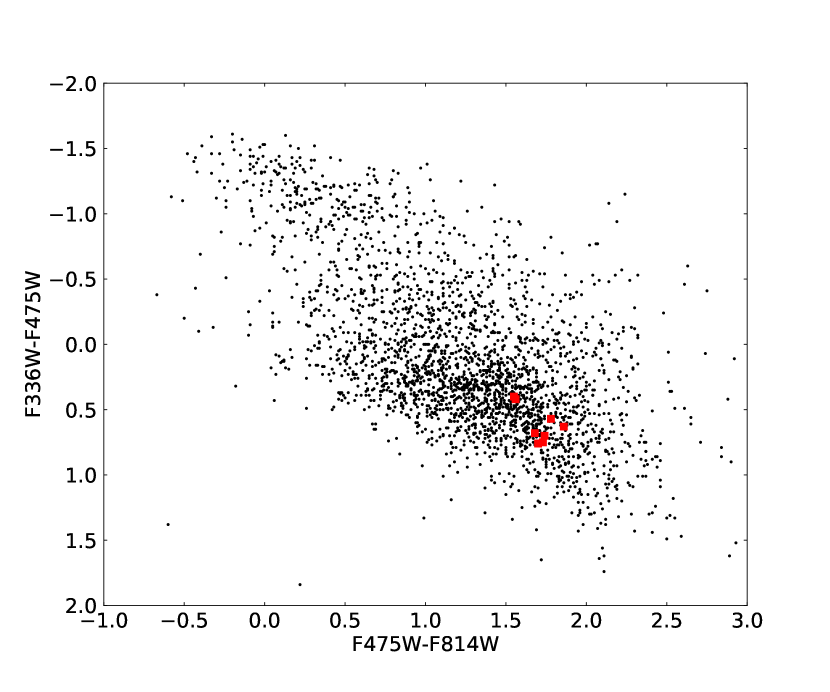
9 of those were identified with stellar clusters (using Johnson et al. 2015). Their synthetic cluster analysis (Fig. 10 in Johnson et al. 2015) shows that the detection percentage for clusters as a function of cluster age is roughly constant as a function of log(age). Thus a significant number () of their cluster IDs should correspond to old clusters, with age yr. The UVIT/X-ray LMXB sources which have stellar cluster identifications from Johnson et al. (2015) are plotted in a color-color diagram in the left panel of Figure 9 as red points. We find that the UVIT/X-ray/LMXB/cluster sources are all located in the region where luminous globular clusters reside (Johnson et al., 2015). This is also seen in the color-magnitude diagram in the right panel of Figure 9: the UVIT/Chandra/LMXB/cluster sources reside in some of the most luminous globular clusters in M31.
In Figure 6 the LMXBs are marked by black squares. The LMXBs make up many of the UVIT/Chandra sources in the cool part of the vs. plot. The UVIT emission associated with LMXBs is properly interpreted as globular cluster emission rather than as single evolved massive stars. In particular, blue horizontal branch stars (BHB) have luminosity and effective temperatures and luminosities, that depends on stellar mass, which are 100 to 2000 L⊙ and 5,000 to 12,000 K, for masses up to 5 M⊙. The horizontal branch lifetime is 10-30% of the main sequence lifetime. Thus a globular cluster with stars with 1% BHB will have a stellar BHB luminosity L⊙, comparable to what is implied by the blackbody fits to the UVIT photometry. I.e. the UVIT luminosity is dominated by BHB stars for the globular cluster associated LMXBs.
The next most common X-ray type is AGN, with 5 in Table 1. These have X-ray PL index between 1 and 2. The UVIT photometry for No.30 is consistent with PL (index 1.7) or hot star (T17 K); for No.36, it is more consistent with PL (index 0.9) than hot star (T21K); for No.39 and No.43, it is not consistent with either PL or hot star; for No.55, it is consistent with both PL (index 0.5) or hot star (T19K). As noted above, hot star spectra and galaxy/AGN spectra are not distinguishable for sources with only 3 bands of UVIT photometry.
Many sources in Table 1 had no previous X-ray identification in Vulic et al. (2016) or optical identification in Johnson et al. (2015). We expanded the number of identifications by searching the recent Gaia DR2 catalogs and newer catalogs of sources such as globular clusters in M31. Of the 67 UVIT/Chandra sources, 9 are found to be foreground stars (separation ) and 2 more are found where the UVIT sources is likely a foreground star (separation ). 20 are found to be associated with globular clusters () and 3 more where the UVIT sources is likely a globular cluster ().
The SNR is source No.34, with steep X-ray PL index indicating a thermal X-ray spectrum. Neither BB nor PL fits the UV spectrum, thus the SNR UV emission could be dominated by UV emission lines like Galactic SNRs.
6 Conclusion
We utilize the new UVIT catalog of M31 to find matches with the Chandra catalog of M31, and carry out a study of the nature of the sources. The UV color-color diagram shows consistency with stellar UV colors for a range of main sequence stars (Fig. 3), or with galaxies and AGN (Fig. 4). Spectral fits to the UVIT photometry with BB and PL models were carried out. The BB models give good fits for 35 cases, consistent with evolved stars with mass between and 30 (Fig. 6). Thus a number of our sources are likely associated with massive stars, excepting those associated with globular clusters as discussed below.
The PL models give good fits to the UVIT photometry for 32 sources, and are an alternate description. However, all cases with PL index are fit better with BB models. We derive PL indices from the two-bands of X-ray photometry, yielding , and from the hardest UV band and softest X-ray band, yielding . Comparing , and (Fig. 8), we find approximately 3 groups of sources: those with equal indices in different bands (lying near the line of equal indices); those with steep UV index which are better fit with BB spectra; and a small group with , consistent with accretion disk spectra. The latter group has between 1 and 2.5, showing that the accretion disk spectrum does not extend down to the UV band.
Cross-matches was carried out using the VizieR tool to catalogs of stars, clusters and other source types. We matched up to separation to include all possible matches to the UVIT sources. The X-ray source position errors are smaller, so only matches are likely matches to the X-ray sources. 20 of the UVIT/Chandra sources match with M31 globular clusters and 9 with foreground stars to . 3 more globular clusters and 2 more foreground stars are consistent with the UVIT source positions with separation . The UV emission of the UVIT/Chandra sources associated with globular clusters is consistent with emission from blue horizontal branch stars rather than from the X-ray source. The LMXBs associated with globular clusters are among the most luminous globular clusters in M31.
The UVIT/Chandra sources are generally faint in UV (AB magnitudes to 23), thus deeper UV photometry is needed to better study these sources and more accurate positions are needed to verify source identifications in optical and X-ray. Future work includes obtaining better photometry and more accurate positions for sources in M31 in the UVIT bands.
References
- Bailer-Jones et al. (2018) Bailer-Jones, C. A. L., Rybizki, J., Fouesneau, M., et al. 2018, AJ, 156, 58
- Caldwell & Romanowsky (2016) Caldwell, N. & Romanowsky, A. J. 2016, ApJ, 824, 42
- Castelli & Kurucz (2004) Castelli, F., & Kurucz, R. L. 2004, arXiv:astro-ph/0405087
- Fitzpatrick & Massa (2007) Fitzpatrick, E. L., & Massa, D. 2007, ApJ, 663, 320
- Gaia Collaboration et al. (2018) Gaia Collaboration, Brown, A. G. A., Vallenari, A., et al. 2018, A&A, 616, A1
- Hainline et al. (2011) Hainline, K. N., Shapley, A. E., Greene, J. E., et al. 2011, ApJ, 733, 31
- Huo et al. (2015) Huo, Z.-Y., Liu, X.-W., Xiang, M.-S., et al. 2015, Research in Astronomy and Astrophysics, 15, 1438
- Johnson et al. (2015) Johnson, L. C., Seth, A. C., Dalcanton, J. J., et al. 2015, ApJ, 802, 127
- Kang et al. (2009) Kang, Y., Bianchi, L., & Rey, S.-C. 2009, ApJ, 703, 614
- Leahy et al. (2020) Leahy, D. A., Postma, J., Chen, Y., et al. 2020, ApJS, 247, 47
- Makishima et al. (1986) Makishima, K., Maejima, Y., Mitsuda, K., et al. 1986, ApJ, 308, 635
- McConnachie et al. (2005) McConnachie, A. W., Irwin, M. J., Ferguson, A. M. N., et al. 2005, MNRAS, 356, 979
- Ochsenbein et al. (2000) Ochsenbein, F., Bauer, P., & Marcout, J. 2000, A&AS, 143, 23
- Postma et al. (2011) Postma, J., Hutchings, J. B., & Leahy, D. 2011, PASP, 123, 833
- Press et al. (2002) Press, W. H., Teukolsky, S. A., Vetterling, W. T., et al. 2002, Numerical recipes in C++ : the art of scientific computing by William H. Press. xxviii
- Sakari et al. (2016) Sakari, C. M., Shetrone, M. D., Schiavon, R. P., et al. 2016, ApJ, 829, 116
- Sasaki et al. (2018) Sasaki, M., Haberl, F., Henze, M., et al. 2018, A&A, 620, A28
- Singh et al. (2014) Singh, K.P., Tandon, S.N., Agrawal, P.C. et al 2014, SPIE, 9144E, 1S.
- Stiele et al. (2011) Stiele, H., Pietsch, W., Haberl, F., et al. 2011, A&A, 534, A55
- Tandon et al. (2017a) Tandon, S. N., Subramaniam, A., Girish, V., et al. 2017, AJ, 154, 128
- Tandon et al. (2017b) Tandon, S. N., Hutchings, J. B., Ghosh, S. K., et al. 2017, Journal of Astrophysics and Astronomy, 38, 28
- Tandon et al. (2020) Tandon, S. N., Postma, J., Joseph, P., et al. 2020, AJ, 159, 158
- Vulic et al. (2016) Vulic, N., Gallagher, S. C., & Barmby, P. 2016, MNRAS, 461, 3443
- Williams et al. (2018) Williams, B. F., Lazzarini, M., Plucinsky, P. P., et al. 2018, ApJS, 239, 13
| No. | CXOU | RA | Dec | F148W | F169M | F172M | N219M | N279N | X-ray | UV-to-X-ray | X-ray | Optical |
|---|---|---|---|---|---|---|---|---|---|---|---|---|
| (deg) | (deg) | indexa | indexb | Classc | Ctptd | |||||||
| 1 | 004344.61+412409.9 | 10.9359 | 41.4028 | 22.99(.13)* | XRB 2E161v | |||||||
| 2 | 004342.68+412606.8 | 10.9279 | 41.4352 | 21.18(.06) | 20.19(.10) | 20.31(.19)* | ||||||
| 3 | 004233.13+410328.8 | 10.6381 | 41.0580 | 21.21(.07) | 20.91(.14) | 20.09(.06) | 19.34(.07) | LMXB | GC | |||
| 4 | 004231.29+410437.1 | 10.6304 | 41.0770 | 22.09(.09)* | 21.62(.20) | 21.11(.14)* | 20.89(.20) | |||||
| 5 | 004429.55+412135.3 | 11.1231 | 41.3598 | 21.27(.09) | 20.81(.13) | 20.08(.06) | 19.09(.08) | LMXB, XRBv | C, c, GC | |||
| 6 | 004234.38+405709.1 | 10.6433 | 40.9525 | 21.91(.10) | 21.40(.13) | 20.59(.08) | 20.02(.09) | LMXB | GC | |||
| 7 | 004152.83+404709.9 | 10.4702 | 40.7861 | 21.11(.07) | 21.11(.09) | 20.87(.14) | 19.60(.07)* | 19.05(.08) | LMXB | GC* | ||
| 8 | 004311.64+410605.7 | 10.7985 | 41.1016 | 23.03(.18)* | ||||||||
| 9 | 004316.36+411630.0 | 10.8182 | 41.2750 | 20.89(.07) | 16.60(.04) | 15.40(.04) | GDfg | |||||
| 10 | 004220.45+412639.8 | 10.5852 | 41.4444 | 23.69(.25)* | ||||||||
| 11 | 004245.93+411036.3 | 10.6914 | 41.1768 | 23.37(.23)* | ||||||||
| 12 | 004208.95+412330.7 | 10.5373 | 41.3919 | 23.19(.23)* | 20.47(.12)* | 16.93(.04) | GDfg | |||||
| 13 | 004241.08+411101.7 | 10.6712 | 41.1838 | 24.21(.34)* | ||||||||
| 14 | 004253.64+412551.0 | 10.7235 | 41.4308 | 23.14(.22) | ||||||||
| 15 | 004240.89+412216.2 | 10.6704 | 41.3712 | 21.57(.10) | 17.44(.04)* | 16.02(.04) | GDfg | |||||
| 16 | 004321.06+411750.5 | 10.8378 | 41.2974 | 21.48(.09) | 21.18(.15) | 21.19(.23) | ||||||
| 17 | 004243.66+411241.8 | 10.6819 | 41.2116 | 22.22(.14)* | 21.66(.20) | 20.64(.19) | C, GC* | |||||
| 18 | 004241.43+411523.8 | 10.6727 | 41.2566 | 21.13(.09) | 20.34(.11) | 19.64(.12) | LMXB | C, GC | ||||
| 19 | 004250.81+411707.3 | 10.7117 | 41.2854 | 21.78(.12) | 21.34(.19) | 19.88(.13) | C, GC | |||||
| 20 | 004236.60+411350.3 | 10.6525 | 41.2307 | 22.75(.18) | 21.57(.19) | GDfg | ||||||
| 21 | 004303.86+411804.8 | 10.7661 | 41.3014 | 21.15(.09) | 20.45(.11) | 19.66(.12) | LMXB | C, GC | ||||
| 22 | 004231.24+411938.8 | 10.6302 | 41.3275 | 22.11(.13) | 21.47(.19) | 20.09(.14) | LMXB | C, GC | ||||
| 23 | 004246.08+411736.1 | 10.6920 | 41.2934 | 23.56(.29) | C, GC | |||||||
| 24 | 004336.63+410811.8 | 10.9027 | 41.1366 | 22.63(.17) | 21.49(.18) | 20.26(.16) | LMXB | C, GC | ||||
| 25 | 004240.73+411004.3 | 10.6697 | 41.1679 | 22.03(.12) | 18.30(.05)* | 17.56(.05) | GDfg | |||||
| 26 | 004218.63+411401.7 | 10.5776 | 41.2338 | 20.64(.07) | 19.70(.09) | 18.86(.09) | LMXB | C, GC | ||||
| 27 | 004314.36+410721.1 | 10.8099 | 41.1225 | 20.91(.08) | 19.91(.09) | 19.20(.10) | LMXB | GC | ||||
| 28 | 004226.14+412551.9 | 10.6089 | 41.4311 | 22.86(.18)* | 22.41(.25)* | 22.00(.35) | ||||||
| 29 | 004353.65+411655.0 | 10.9736 | 41.2820 | 23.39(.24)* | <XRB> | n, NGC224* | ||||||
| 30 | 004244.35+411608.6 | 10.6848 | 41.2691 | 20.00(.06) | 19.33(.08) | 18.72(.09) | AGN | |||||
| 31 | 004315.41+411124.6 | 10.8142 | 41.1902 | 21.92(.12) | 21.32(.17) | 20.20(.15) | LMXB | C, GC | ||||
| 32 | 004438.33+412530.3 | 11.1597 | 41.4251 | 21.64(.10)* | 21.20(.34) | 21.26(.16) | 21.19(.30) | |||||
| 33 | 004412.20+413148.2 | 11.0509 | 41.5301 | 21.41(.09)* | 21.39(.17)* | <XRB> | p | |||||
| 34 | 004451.08+412904.9 | 11.2129 | 41.4847 | 19.31(.05) | 18.88(.12) | 18.86(.06)* | 19.02(.11) | <SNR> | s | |||
| 35 | 004118.65+405158.6 | 10.3277 | 40.8663 | 22.31(.16) | 20.93(.14) | 18.68(.05) | 16.82(.04) | GDfg | ||||
| 36 | 004206.12+410247.7 | 10.5255 | 41.0466 | 22.18(.15) | 22.36(.29) | 21.93(.19) | 21.64(.24) | AGN | GC | |||
| 37 | 004210.36+405149.2 | 10.5432 | 40.8637 | 21.78(.13)* | 21.10(.15) | 21.50(.15)* | 20.33(.13)* | GD* | ||||
| 38 | 004143.44+410504.7 | 10.4310 | 41.0846 | 21.03(.09) | 19.30(.07) | 16.90(.04) | 15.18(.03) | GDfg | ||||
| 39 | 004126.25+405326.0 | 10.3594 | 40.8906 | 21.98(.14) | 21.70(.20) | 20.65(.10)* | 20.45(.14) | AGN | ||||
| 40 | 004200.45+405942.7 | 10.5019 | 40.9952 | 22.50(.18) | 22.63(.31) | 22.03(.19)* | 21.83(.26) | |||||
| 41 | 004205.62+405713.4 | 10.5234 | 40.9537 | 19.32(.05) | 18.96(.07) | 18.96(.06)* | 18.42(.06) | |||||
| 42 | 004234.98+404838.8 | 10.6458 | 40.8108 | 21.90(.14) | 20.86(.14) | 19.96(.08)* | 19.58(.10) | |||||
| 43 | 004241.80+405154.6 | 10.6742 | 40.8652 | 21.34(.14) | 20.06(.11) | 18.57(.06) | 17.27(.05) | AGN | M32 | |||
| 44 | 003823.84+401250.0 | 9.5993 | 40.2139 | 22.35(.17)* | 22.14(.14) | GD* | ||||||
| 45 | 004432.46+410533.7 | 11.1353 | 41.0927 | 23.00(.22) | 21.08(.13) | 19.56(.07)* | 16.03(.04)* | GDfg* | ||||
| 46 | 004410.16+411830.4 | 11.0424 | 41.3085 | 22.56(.19) | 21.81(.19) | 22.26(.23)* | 21.48(.28) | |||||
| 47 | 004356.41+412202.2 | 10.9850 | 41.3673 | 24.13(.33) | 21.85(.15) | 20.50(.13) | LMXB, <XRB> | C, c, GC | ||||
| 48 | 004229.72+405247.8 | 10.6239 | 40.8800 | 23.54(.29) | 21.99(.15) | 19.48(.07) | GD | |||||
| 49 | 004257.63+412137.6 | 10.7402 | 41.3605 | 24.29(.35) | 21.44(.18)* | 19.72(.12) | ||||||
| 50 | 004337.27+411443.6 | 10.9053 | 41.2455 | 23.92(.29) | 21.77(.20) | 20.41(.16) | LMXB | C, GC | ||||
| 51 | 004301.62+411052.7 | 10.7568 | 41.1813 | 23.81(.28) | 20.10(.10) | 17.82(.06) | GDfg | |||||
| 52 | 004248.11+411729.5 | 10.7005 | 41.2915 | 22.12(.26)* | ||||||||
| 53 | 004409.84+412813.9 | 11.0410 | 41.4705 | 21.33(.16)* | 18.97(.11)* | fgStar | GDfg* | |||||
| 54 | 004227.41+405936.1 | 10.6142 | 40.9934 | 22.21(.22) | 20.55(.14) | LMXB | GC | |||||
| 55 | 004137.85+410108.2 | 10.4077 | 41.0190 | 20.89(.11) | 20.49(.14) | AGN | ||||||
| 56 | 004115.38+410102.5 | 10.3141 | 41.0174 | 21.50(.15) | 20.45(.14) | |||||||
| 57 | 004301.42+413017.3 | 10.7560 | 41.5048 | 21.98(.20) | 20.22(.13) | LMXB, <XRB> | GC | |||||
| 58 | 004616.82+414300.4 | 11.5701 | 41.7168 | 22.23(.22) | GD | |||||||
| 59 | 004229.35+405750.1 | 10.6223 | 40.9639 | 19.65(.07) | GD | |||||||
| 60 | 004318.45+411142.2 | 10.8269 | 41.1951 | 22.62(.15) | 22.49(.29) | 21.20(.23)* | ||||||
| 61 | 004230.10+411841.8 | 10.6254 | 41.3116 | 20.65(.18) | GC, GD | |||||||
| 62 | 004248.83+411512.9 | 10.7035 | 41.2536 | 19.94(.14) | GC, GD | |||||||
| 63 | 004325.64+411537.4 | 10.8568 | 41.2604 | 20.73(.19) | C, GC | |||||||
| 64 | 004431.98+412519.5 | 11.1333 | 41.4221 | 20.84(.25) | fgStar | f, GDfg | ||||||
| 65 | 004225.04+405719.3 | 10.6044 | 40.9554 | 20.99(.18)* | GC* | |||||||
| 66 | 004258.77+405901.6 | 10.7449 | 40.9838 | 18.92(.08)* | ||||||||
| 67 | 004321.97+405754.7 | 10.8416 | 40.9652 | 21.01(.19)* | GD* |
| No. | CXOU | UVIT filter | Model | Bestfit | |||||
|---|---|---|---|---|---|---|---|---|---|
| BB | AV$a$$a$footnotemark: | R (R⊙)$b$$b$footnotemark: | T ( K) | $c$$c$footnotemark: | |||||
| PL | AV$a$$a$footnotemark: | norm () | index | $c$$c$footnotemark: | |||||
| 2 | 004342.68+412606.8 | F1,F4,F5 | BB | N/A | ✓ | ||||
| PL | N/A | ||||||||
| 3 | 004233.13+410328.8 | F1,F3,F4,F5 | BB | ||||||
| PL | ✓ | ||||||||
| 4 | 004231.29+410437.1 | F1,F3,F4,F5 | BB | ✓ | |||||
| PL | |||||||||
| 5 | 004429.55+412135.3 | F1,F3,F4,F5 | BB | ||||||
| PL | ✓ | ||||||||
| 6 | 004234.38+405709.1 | F1,F3,F4,F5 | BB | ✓ | |||||
| PL | |||||||||
| 7 | 004152.83+404709.9 | F1,F2,F3,F4,F5 | BB | ||||||
| PL | |||||||||
| 9(fg) | 004316.36+411630.0 | F1,F4,F5 | BB | N/A | |||||
| PL | N/A | ||||||||
| 12(fg) | 004208.95+412330.7 | F1,F4,F5 | BB | N/A | ✓ | ||||
| PL | N/A | ✓ | |||||||
| 15(fg) | 004240.89+412216.2 | F1,F4,F5 | BB | N/A | |||||
| PL | N/A | ||||||||
| 16 | 004321.06+411750.5 | F1,F4,F5 | BB | N/A | ✓ | ||||
| PL | N/A | ✓ | |||||||
| 17 | 004243.66+411241.8 | F1,F4,F5 | BB | N/A | ✓ | ||||
| PL | N/A | ✓ | |||||||
| 18 | 004241.43+411523.8 | F1,F4,F5 | BB | N/A | ✓ | ||||
| PL | N/A | ✓ | |||||||
| 19 | 004250.81+411707.3 | F1,F4,F5 | BB | N/A | ✓ | ||||
| PL | N/A | ✓ | |||||||
| 20(fg) | 004236.60+411350.3 | F1,F4 | BB | N/A | ✓ | ||||
| PL | N/A | ✓ | |||||||
| 21 | 004303.86+411804.8 | F1,F4,F5 | BB | N/A | ✓ | ||||
| PL | N/A | ✓ | |||||||
| 22 | 004231.24+411938.8 | F1,F4,F5 | BB | N/A | ✓ | ||||
| PL | N/A | ✓ | |||||||
| 24 | 004336.63+410811.8 | F1,F4,F5 | BB | N/A | ✓ | ||||
| PL | N/A | ✓ | |||||||
| 25(fg) | 004240.73+411004.3 | F1,F4,F5 | BB | N/A | |||||
| PL | N/A | ||||||||
| 26 | 004218.63+411401.7 | F1,F4,F5 | BB | N/A | ✓ | ||||
| PL | N/A | ✓ | |||||||
| 27 | 004314.36+410721.1 | F1,F4,F5 | BB | N/A | ✓ | ||||
| PL | N/A | ✓ | |||||||
| 28 | 004226.14+412551.9 | F1,F4,F5 | BB | N/A | ✓ | ||||
| PL | N/A | ✓ | |||||||
| 30 | 004244.35+411608.6 | F1,F4,F5 | BB | N/A | ✓ | ||||
| PL | N/A | ✓ | |||||||
| 31 | 004315.41+411124.6 | F1,F4,F5 | BB | N/A | ✓ | ||||
| PL | N/A | ✓ | |||||||
| 32 | 004438.33+412530.3 | F1,F3,F4,F5 | BB | ✓ | |||||
| PL | ✓ | ||||||||
| 33 | 004412.20+413148.2 | F1,F4 | BB | N/A | ✓ | ||||
| PL | N/A | ✓ | |||||||
| 34 | 004451.08+412904.9 | F1,F3,F4,F5 | BB | ||||||
| PL | |||||||||
| 35(fg) | 004118.65+405158.6 | F1,F3,F4,F5 | BB | ||||||
| PL | |||||||||
| 36 | 004206.12+410247.7 | F1,F3,F4,F5 | BB | ||||||
| PL | ✓ | ||||||||
| 37$d$$d$footnotemark: | 004210.36+405149.2 | F1,F3,F4,F5 | BB | ✓ | |||||
| PL | |||||||||
| 38(fg) | 004143.44+410504.7 | F1,F3,F4,F5 | BB | ||||||
| PL | |||||||||
| 39 | 004126.25+405326.0 | F1,F3,F4,F5 | BB | ||||||
| PL | |||||||||
| 40 | 004200.45+405942.7 | F1,F3,F4,F5 | BB | ✓ | |||||
| PL | ✓ | ||||||||
| 41 | 004205.62+405713.4 | F1,F3,F4,F5 | BB | ✓ | |||||
| PL | |||||||||
| 42 | 004234.98+404838.8 | F1,F3,F4,F5 | BB | ||||||
| PL | |||||||||
| 43 | 004241.80+405154.6 | F1,F3,F4,F5 | BB | ||||||
| PL | |||||||||
| 44 | 003823.84+401250.0 | F1,F2 | BB | N/A | ✓ | ||||
| PL | N/A | ✓ | |||||||
| 45(fg) | 004432.46+410533.7 | F1,F3,F4,F5 | BB | ||||||
| PL | |||||||||
| 46 | 004410.16+411830.4 | F1,F3,F4,F5 | BB | ✓ | |||||
| PL | |||||||||
| 47 | 004356.41+412202.2 | F1,F4,F5 | BB | N/A | ✓ | ||||
| PL | N/A | ✓ | |||||||
| 48 | 004229.72+405247.8 | F1,F4,F5 | BB | N/A | ✓ | ||||
| PL | N/A | ✓ | |||||||
| 49 | 004257.63+412137.6 | F1,F4,F5 | BB | N/A | ✓ | ||||
| PL | N/A | ✓ | |||||||
| 50 | 004337.27+411443.6 | F1,F4,F5 | BB | N/A | ✓ | ||||
| PL | N/A | ✓ | |||||||
| 51(fg) | 004301.62+411052.7 | F1,F4,F5 | BB | N/A | ✓ | ||||
| PL | N/A | ✓ | |||||||
| 53(fg) | 004409.84+412813.9 | F4,F5 | BB | N/A | ✓ | ||||
| PL | N/A | ✓ | |||||||
| 54 | 004227.41+405936.1 | F4,F5 | BB | N/A | ✓ | ||||
| PL | N/A | ✓ | |||||||
| 55 | 004137.85+410108.2 | F4,F5 | BB | N/A | ✓ | ||||
| PL | N/A | ✓ | |||||||
| 56 | 004115.38+410102.5 | F4,F5 | BB | N/A | ✓ | ||||
| PL | N/A | ✓ | |||||||
| 57 | 004301.42+413017.3 | F4,F5 | BB | N/A | ✓ | ||||
| PL | N/A | ✓ | |||||||
| 60 | 004318.45+411142.2 | F1,F4,F5 | BB | N/A | ✓ | ||||
| PL | N/A | ✓ |
Note. — Only sources detected in two or more UVIT filters (minimum requirement for fitting) are included in this table.