Preliminary Target Selection for the DESI Quasar (QSO) Sample
Abstract
The DESI survey will measure large-scale structure using quasars as direct tracers of dark matter in the redshift range and using quasar Ly- forests at . We present two methods to select candidate quasars for DESI based on imaging in three optical () and two infrared () bands. The first method uses traditional color cuts and the second utilizes a machine-learning algorithm.
Introduction
DESI (DESI Collaboration et al., 2016) will precisely measure the baryon acoustic feature imprinted on large-scale structure, as well as the effect of redshift-space distortions on galaxy clustering. The most distant large-scale structures will be measured using quasars (or QSOs). In the redshift range , QSOs will be used as direct tracers of dark matter. At higher redshifts, DESI will analyze the foreground neutral-hydrogen absorption systems at Å (rest frame) that comprise the Ly- forest.
DESI will primarily target QSOs using optical imaging in the bands combined with WISE infrared photometry in and . Results presented here use such imaging from the DR8 release111http://legacysurvey.org/dr8/ of the DESI Legacy Imaging Surveys (Dey et al., 2019). DESI will allocate 260 fibers deg-2 (i.e. fibers) to QSO targets, requiring at least 120 (50) of those to be QSOs at redshift ().
Quasar Target Selection
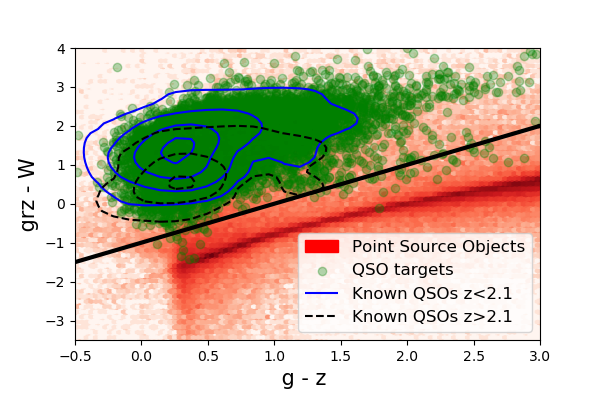
QSOs are powered by accretion onto supermassive black holes at the centers of galaxies. The resulting emission can greatly outshine that of the host galaxy, and the “nuclear” emitting regions of even the nearest QSOs are too small to resolve. QSO selection is challenging at optical wavelengths, because the colors and point-like morphologies of QSOs mimic faint blue stars. Without -band imaging, selections based on the “UV excess of QSOs compared to stars cannot be implemented (as for, e.g., BOSS and eBOSS; Ross et al., 2012; Myers et al., 2015). Crucially, though, QSOs are magnitudes brighter in the near-infrared at all redshifts compared to stars of similar optical magnitude and color, thus providing a powerful method to discriminate QSOs from contaminating stars.
For DESI, we have investigated two methods to select QSOs, one based on color cuts and the other on a machine-learning algorithm. We will finalize a method during DESI Survey Validation, a four-month period prior to the start of the main survey. We restrict both selections to objects with stellar morphology, to avoid an almost 10-fold contamination by galaxies, and we impose a depth limit of . We also require that the targets are not in corrupted imaging pixels, nor pixels that are in the vicinity of bright stars, globular clusters, or nearby galaxies. Such “masked” sources have MASKBITS of 1, 5, 6, 7, 10, 12 or 13 set in Legacy Surveys catalogs.
Our color-cut selection uses to select redder sources, and W vs. (where is a weighted average of and fluxes with flux()=0.75flux()+0.25flux()) to reject stars based on the “infrared excess” of QSOs (see Figure 1). We impose and to avoid regions in color space almost solely populated by stars. We also restrict the magnitude range to and .0, where is a weighted average of the three band fluxes (flux() = (flux() + 0.8flux() + 0.5flux() / 2.3)—at brighter magnitudes, QSOs are rare and stars abundant. To further reduce stellar contamination, we apply a stricter cut to sources near the stellar locus in vs. . We also impose a minimum signal-to-noise ratio in both WISE bands.
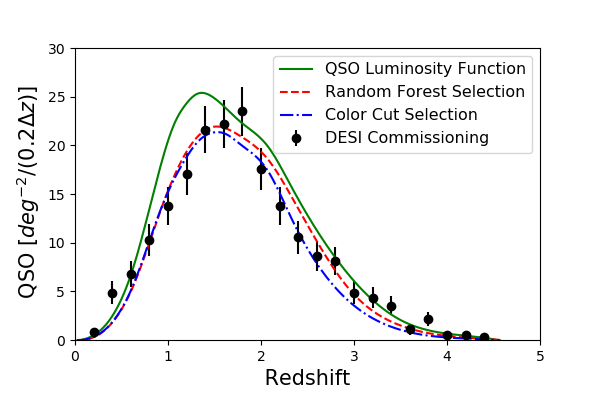
Neural-network-based algorithms implemented in BOSS (Yèche et al., 2010) were found to increase QSO selection efficiency by % compared to color cuts. Similarly, to improve the success rate for DESI, we use a machine-learning algorithm based on Random Forests (RF). We train the RF on 230,000 known QSOs in the DESI footprint, and 210,000 “stars” defined as unresolved sources that are not known QSOs and do not exhibit QSO-like variations in their SDSS light curve. We normalized the -band number counts of the stars to match the QSOs and trained the RF selection using colors and -band magnitude, varying the probability threshold with . In addition to this RF covering the whole redshift range, we trained a specific RF to target much rarer high-redshift QSOs (). To implement the RF approach, we therefore split our 260 deg-2 fiber budget; dedicating 245 deg-2 fibers to the all-redshift RF, and 15 deg-2 to the high-redshift RF. This approach improves targeting for high-redshift QSOs by %, with only a small loss of low-redshift QSOs.
The RF selection performs better than color cuts, particularly at or at faint magnitudes. The expected QSO redshift distribution is shown in Figure 1. Accounting for the completeness of both algorithms as a function of redshift and magnitude, the luminosity function of Palanque-Delabrouille et al. (2016) implies 195 (180) QSOs deg-2, of which 60 (48) deg-2 are at for our RF (color-cut) selection. We were able to confirm these results in a deg2 field observed during DESI commissioning. The spectra were visually inspected to confirm the source classification and redshift. In this field, the RF (color-cut) approaches selected () deg-2 QSOs, including (4) at . About of the QSOs selected by the color-cut approach are also contained in the RF selection.
Conclusion
We propose two QSO selections that meet DESI targeting requirements, and make the target catalog from the preliminary RF selection public222Available at https://data.desi.lbl.gov/public/ets/target/catalogs/ and detailed at https://desidatamodel.readthedocs.io. We will test these two approaches during DESI Survey Validation (SV), and choose an algorithm for the subsequent DESI main survey. During SV, we will also test complementary quasar selections such as a dropout technique to select very high-redshift quasars () and a highly homogeneous selection based on quasar variability in WISE.
References
- DESI Collaboration et al. (2016) DESI Collaboration, Aghamousa, A., Aguilar, J., et al. 2016, arXiv e-prints, arXiv:1611.00036
- Dey et al. (2019) Dey, A., Schlegel, D. J., Lang, D., et al. 2019, AJ, 157, 168
- Myers et al. (2015) Myers, A. D., Palanque-Delabrouille, N., Prakash, A., et al. 2015, ApJS, 221, 27
- Palanque-Delabrouille et al. (2016) Palanque-Delabrouille, N., Magneville, C., Yèche, C., et al. 2016, A&A, 587, A41
- Ross et al. (2012) Ross, N. P., Myers, A. D., Sheldon, E. S., et al. 2012, ApJS, 199, 3
- Yèche et al. (2010) Yèche, C., Petitjean, P., Rich, J., et al. 2010, A&A, 523, A14