Superorbital Modulation in the High-Mass X-ray Binary 4U 153852, and Possible Modulation in IGR J163934643
Abstract
Hard X-ray observations with the Neil Gehrels Swift Observatory Burst Alert Telescope (BAT) reveal superorbital modulation in the wind-accreting supergiant high-mass X-ray binary (HMXB) 4U 153852 at a period of 14.9130 0.0026 days that is consistent with four times the 3.73 day orbital period. These periods agree with a previously suggested correlation between superorbital and orbital periods in similar HMXBs. During the 14 years of observations the superorbital modulation changes amplitude, and since MJD 57,650 it was no longer detected in the power spectrum, although a peak near the second harmonic of this was present for some time. Measurements of the spin period of the neutron star in the system with the Fermi Gamma-ray Burst Monitor show a long-term spin-down trend which halted towards the end of the light curve, suggesting a connection between and superorbital modulation, as proposed for 2S 0114+650. However, an earlier torque reversal from INTEGRAL observations was not associated with superorbital modulation changes. B and V band photometry from the Las Cumbres Observatory reveals orbital ellipsoidal photometric variability, but no superorbital optical modulation. However the photometry was obtained when the 14.9130 day period was no longer detected in the BAT power spectrum. We revisit possible superorbital modulation in BAT observations of IGR J163934643 but cannot conclusively determine whether this is present, although is not persistent. We consider superorbital modulation mechanisms, and suggest that the Corotating Interaction Region model, with small deviations from orbital synchronization, appears promising.
Subject headings:
stars: individual (4U 153852, 4U 1538522, QV Nor, IGR J163934643) — stars: neutron — X-rays: stars1. Introduction
1.1. Superorbital Periods in Wind-accretion HMXBs
Superorbital periods (periods longer than the orbital period) in high-mass X-ray binaries (HMXBs) have been known for some time (e.g. Kotze & Charles, 2012). The superorbital periods in the earliest known systems such as Her X-1, SMC X-1, and LMC X-4 could be accounted for as being due to precession of the accretion disk, formed because the mass donating primary star fills, or is close to filling, its Roche lobe (e.g. Townsend & Charles, 2020, and references therein). Such modulation had not been expected for systems where accretion occurs from the wind of the primary. In these systems the low angular momentum of the accreted material should not, for most sources, lead to the formation of a persistent accretion disk, although in some cases a transient disk might form (e.g. Taam & Fryxell, 1988, 1989; Jenke et al., 2012; Romano et al., 2015; Xu & Stone, 2019).
However, there are now a number of wind-accreting HMXBs which do indeed show persistent superorbital modulation. This was first found for 2S 0114+650 by Farrell et al. (2006, 2008). Subsequently, superorbital periods were found for the wind-accreting HMXBs IGR J16493-4348, 4U 1909+07 (= X 1908+075), IGR J16418-4532, and IGR J16479-4514 (Corbet et al., 2010; Corbet & Krimm, 2013). There is still no generally accepted model to explain superorbital modulation in these systems, although several have been proposed. Detailed studies of IGR J16493-4348 have been made by Pearlman et al. (2019) and Coley et al. (2019) and candidate models are reviewed therein.
1.2. The Wind-accretion HMXB 4U 153852
4U 153852 (occasionally referred to as “4U 1538522”) is a bright eclipsing high-mass X-ray binary containing a neutron star accreting from the wind of QV Nor, a B0 Iab star. It is a well-studied system in X-rays and at other wavelengths. For a recent review of observations of this system see Hemphill et al. (2019). The neutron star spins at a period of 526 seconds with long-term spin-rate changes (Rubin et al., 1997; Baykal et al., 2006; Malacaria et al., 2020). The system exhibits regular total eclipses with a period of 3.73 days. Although there have been a number measurements of the orbital parameters from orbital Doppler shifts in the pulsation period, the eccentricity is still rather uncertain. An eccentricity of 0.18 has been reported by Clark (2000) and Mukherjee et al. (2006), although an eccentricity of 0.08 0.05 was reported by Makishima et al. (1987), and a circular orbit may also be possible (e.g. Corbet et al., 1993; Baykal et al., 2006; Rawls et al., 2011). The orbital ephemeris was recently updated by Hemphill et al. (2019) from eclipse timing, and these authors found marginal evidence for a change in the orbital period. In this paper we use this orbital ephemeris for definition of orbital period and eclipse center.
Optical photometry of 4U 153852 was carried out by Ilovaisky et al. (1979) and Pakull et al. (1983). Both groups reported ellipsoidal variations due to tidal distortion of the primary star with two maxima and minima per orbital cycle. However, in addition to the periodic modulation there was also cycle-to-cycle variability. Rawls et al. (2011) also report on BVI photometry of 4U 153852 and derive a low mass for the neutron star in the system (0.870.07 for an eccentric orbit and 1.00 0.10 for a circular orbit) from a fit to the orbital photometric modulation.
We report here the detection using data from the Swift BAT of superorbital modulation in 4U 153852 at a period of 14.9130 0.0026 days, which is consistent with being exactly four times the orbital period of the system. Measurements of the pulse frequency of 4U 153852 obtained with the Fermi Gamma-Ray Burst Monitor (GBM) cover a large fraction of the BAT light curve and we compare changes in superorbital modulation with pulse frequency variations. We also report on optical photometry of 4U 153852 made with the Las Cumbres Observatory (LCO) telescope network.
1.3. The Wind-accretion HMXB IGR J163934643
IGR J163934643 is thought to be an HMXB containing a neutron star accreting from the wind of its companion. For a summary of its properties see Coley et al. (2015) and references therein. The spectral type of the mass donor has not yet been determined, although Bodaghee et al. (2012) suggest that it may be a B-type main-sequence star. The source has an orbital period of 4.2 days as determined from modulation of the X-ray light curve seen with the BAT (Corbet & Krimm, 2013; Coley et al., 2015). The minimum in the orbital modulation has been interpreted as an eclipse, and from measurements of this Coley et al. (2015) found that the half-angle would be consistent with stars of spectral type B0 V and B0-5 III. However, Kabiraj et al. (2020) also investigated the X-ray light curve of IGR J163934643 using Swift X-ray Telescope observations and proposed that the minimum in the orbital light curve, rather than being caused by an eclipse, is due to absorption in a stellar corona. We previously noted a possible superorbital period in IGR J163934643 of 14.971 0.005 days on the basis of small peaks seen at this period and its second harmonic in the power spectrum of the BAT light curve (Corbet & Krimm, 2013). While the statistical significance of the superorbital modulation was very low, we noted that power spectra of light curves from the Rossi X-ray Timing Explorer PCA Galactic Plane Scan and INTEGRAL IBIS observations also both showed small peaks at the candidate superorbital period. In addition, it was noted that the combination of superorbital and orbital periods would be close to the 4.4 and 15.18 day orbital and superorbital periods of 4U 1909+07. Here we reexamine the previously suggested superorbital period in IGR J163934643 (Corbet & Krimm, 2013). For IGR J163934643 we find that we cannot yet definitely conclude whether superorbital modulation is present or not.
2. Data and Analysis
2.1. BAT X-ray Observations of 4U 153852 and IGR J163934643
The Swift BAT is a hard X-ray telescope that uses a coded mask to provide a wide field of view (Barthelmy et al., 2005). Here we use light curves from the Swift BAT transient monitor (Krimm et al., 2013), which are available shortly after observations have been performed and cover the energy range 15 - 50 keV. In this energy range, the Crab gives a count rate of 0.22 cts cm-2 s-1. The transient monitor light curves are available with time resolutions of Swift pointing durations (“orbital light curves”), and also daily averages.
For 4U 153852 the observation durations of the orbital light curve range from 64 to 2640 s and the mean duration is 666 s. The light curve of 4U 153852 considered here covers a time range of MJD 53,416 to 58,880 (2005-02-15 to 2020-02-01).
For IGR J163934643 the BAT light curve considered by Corbet & Krimm (2013) covered the time range of MJD 53,416 to 56,452 (2005 February 15 to 2013 June 9). In contrast, the light curve of IGR J163934643 now also covers until MJD 58,880, a duration of 5464 days, and hence is 2428 days (80 %) longer. The durations of the individual observations of IGR J163934643 again range from 64 to 2640 s and the mean is 685 s.
Unless otherwise stated, our data analysis here uses the orbital light curves rather than the daily averages. Our analysis was similar to that described in Corbet & Krimm (2013). We only use data for which the quality flag (“DATA_FLAG”) was 0, indicating good quality. In addition, as in our previous work, we removed points with very low fluxes which also had implausibly small uncertainties. While changes to the transient light curve processing have reduced this problem, some anomalous low flux points were still present before processing.
As in our previous work (e.g. Corbet & Krimm, 2013; Corbet et al., 2017) we used discrete Fourier Transforms to create power spectra of the BAT light curves. Because the individual BAT observations vary considerably in exposure it is advantageous to weight them when calculating the Fourier transform. Scargle (1989) notes that the weighting of data points in calculating power spectra can be compared to combining individual data points. The semi-weighted mean is a generalization of the weighted mean (Cochran, 1937, 1954) which allows for cases where the variation of data values is significant compared to the size of their uncertainties. It is equivalent to the conventional weighted mean when data value variation is small compared to the uncertainties. We therefore employ a technique based on the semi-weighted mean where each data point’s contribution to the power spectrum is weighted by a factor which depends on both the uncertainty on each point and the excess variability of the light curve. Significance of peaks in power spectra are given as a false alarm probability (FAP; Scargle, 1982) and period uncertainties are obtained via the expression of Horne & Baliunas (1986). Although the calculation of the FAP depends on the number of independent frequencies, which depends on the frequency resolution, and this is not precisely defined for unevenly sampled data (e.g. Koen, 1990), we have found that using the inverse of the length of the light curve provides a good approximation for BAT observations (Corbet et al., 2017).

2.2. Fermi GBM X-ray Observations of 4U 153852
The Fermi GBM (Meegan et al., 2009) is a set of 12 sodium iodide and 2 bismuth germanate scintillators primarily used to detect gamma-ray bursts. In addition to this, the wide field of view and the high time resolution of the GBM have been used to monitor bright X-ray sources, including measurements of the spin periods of X-ray pulsars (e.g. Finger et al., 2009; Jenke et al., 2012; Malacaria et al., 2020) in a similar way to previously undertaken with the Compton Gamma-Ray Observatory (CGRO) Burst and Transient Source Experiment (BATSE). We used measurements on the spin frequency of 4U 153852 that are provided online by the GBM team111https://gammaray.msfc.nasa.gov/gbm/science/pulsars.html. These measurements cover from MJD 54,690 (2008-08-12) to 58,852 (2020-01-04).
2.3. LCO Optical Photometry of 4U 153852
The LCO (Brown et al., 2013) is a global network of 0.4-m, 1-m, and 2-m telescopes that operate as a single observatory. Observations of QV Nor, the optical counterpart of 4U 153852, were obtained in two groups. The first set of observations was obtained between MJD 58,345 to 58,390 (2018-08-15 to 2018-09-29) using 1-m telescopes, and the second set was obtained between 58,624 to 58,724 (2019-05-21 to 2019-08-29) using 2-m telescopes. Observations were primarily obtained with B and V filters with a small number of observations with other filters. Here we report only on the B and V observations. During the first set of observations 24 B and 21 V measurements were obtained, with individual exposures of 15s and 5s respectively. During the second set of observations, 63 B and V measurements were obtained with individual exposures of 30 s and 15 s respectively. A log of the observations is given in Table 1 and the times of the two sets of observations are indicated in Figure 1. Photometric measurements were obtained using the “X-ray Binary New Early Warning System” pipeline (XB-NEWS; Russell et al., 2019). XB-NEWS provides photometry using several different aperture sizes. Here, based on advice from the XB-NEWS team, we use the measurements obtained with apertures which were 1.0 times the Point Spread Function Full-Width half-maximum (FAP_1P0) for all stars on each frame, although this differs from frame to frame. The first set of observations, which were taken with a 1m telescope and used shorter exposures, were found to have considerably larger error bars than the second set of observations which were obtained with a 2m telescope with longer exposures. For the first set of observations the mean uncertainties are 0.02 mag. for V and 0.046 mag. for B, while for the second set of observations the mean uncertainty of the V observations is 0.005 mag. and the mean uncertainty of the B observations is 0.01 mag. There is also a shift between the mean B magnitude by about 0.3 between the two sets of observations, although no such shift is seen for the V-band observations. For these reasons we primarily use the data from the second set of observations that were obtained with longer exposures on a 2m telescope. The 100 day time span covered by this set of observations corresponds to 26.8 orbital and 6.7 superorbital cycles.
3. Results
3.1. BAT X-ray Results on 4U 153852
The BAT light curve of 4U 153852 is shown in Figure 1 (bottom panel). The power spectrum of this, from a period of 0.07 days to the length of the light curve (5464 days) is shown in Figure 2 (bottom panel). This shows a very strong peak at the orbital period of 4U 153852 at 3.72836 0.00006 days, consistent with the period of 3.728354 0.000009 days reported by Hemphill et al. (2019). Large peaks are also seen at the second (1.86416 0.00001 days Porb = 3.72832 0.00003 days), third (1.242777 0.000007 days Porb = 3.72833 0.00002 days) ), and fourth (0.932084 0.000006 days Porb = 3.72834 0.00003 days) harmonics of the orbital period.
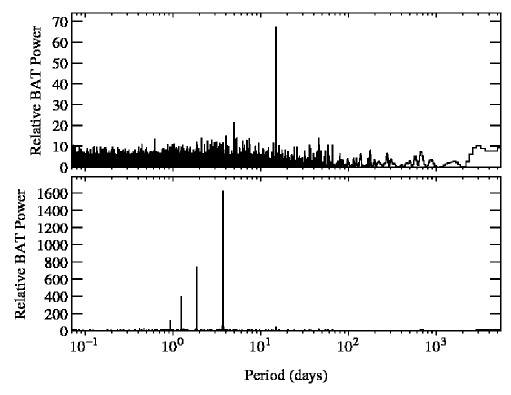
In addition to the peaks associated with the orbital period, we also noted a much smaller peak at 14.9126 0.0031 days at a height of 44 times the mean power level over the entire period range and 24 times the local power level. While significantly smaller than the peaks related to the orbital period, the height of this peak compared to the local power level corresponds to a nominal FAP of 3 and so is highly statistically significant. While some types of period search techniques can produce signals at “sub-harmonics” of the true modulation period, i.e. multiples of the intrinsic modulation period, this effect does not occur in direct Fourier-based analyses which quantify the sine-wave components of the modulation. Therefore, modulation at an integer multiple of the orbital period cannot be an artifact of the analysis procedure. However, the 3.73 day period of the system must be the orbital period as this is derived from both the Doppler modulation of the neutron star pulse period and the occurrence of total eclipses.
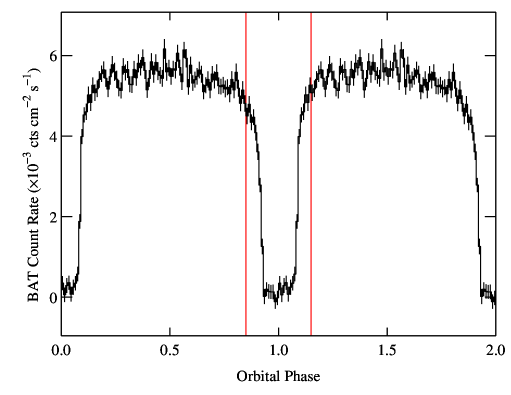
To investigate this longer-period modulation we then wished to remove the potentially confounding effects of the orbital modulation on the light curve. The BAT light curve folded on the orbital period is shown in Figure 3. The dominant contribution to orbital modulation is the total eclipse. Therefore, to remove this modulation from the light curve we excluded observations between orbital phases of 0.85 to 1.15, where phase 1.0 is the center of the eclipse. The power spectrum of this edited light curve for the same period range is shown in the upper panel of Figure 2. The orbital modulation is no longer visible in the power spectrum, and the strongest peak is now at 14.9130 0.0026 days and its height has increased to 67 times the mean power level. Taking the local power level, the relative peak height is 33 with an associated FAP of 4. The ratio between superorbital period and orbital period is thus 3.9999 0.0007. i.e. the ratio is within 0.018% of exactly a factor of four.
As a check that the window function caused by the excision of data around the eclipse in the light was not causing apparent modulation at four times the orbital period, we created a light curve with the same sampling, but with the data values replaced by a pure sine wave modulation with a period equal to that of the orbital period. For the sampling of the original light curve, the power spectrum of the “fake” light curve only showed a peak at the orbital period. For the sampling of the light curve with eclipse phases removed, the power spectrum of this fake light curve did also show additional peaks at higher frequency harmonics of the orbital period, but not at lower frequencies, including around the 14.9 day superorbital period.
To characterize the modulation near 14.9 days in 4U 153852 we also made a sine wave fit to the modified light curve. Leaving the period free we find a value of 14.9148 0.0019 days, consistent with the period obtained from the power spectrum. The mean count rate is 0.0055 cts cm-2 s-1 (approximately 25 mCrab) and the sine wave semi-amplitude is 0.00046 0.00003 cts cm-2 s-1, approximately 2.1 0.1 mCrab. The epoch of maximum flux is MJD 56,106.4 0.2, which is 0.25 0.2 days after the time of eclipse center, i.e. an orbital phase of 0.07 0.05. We note that because of the exact ratio between the superorbital and orbital periods and the relative phasing, we are not measuring the flux at either the implied maximum or minimum of the superorbital modulation, if it is sinusoidal, because these would occur during the eclipses. The BAT light curve folded on this superorbital period is shown in Figure 4. In the bottom panel we plot the unedited light curve folded into 100 bins and the orbital eclipses are strongly present. In the middle panel we plot the folded light curve with the eclipses removed in which the times of the eclipses are seen as gaps. In the top panel we plot the light curve with eclipses removed folded into 12 bins to more clearly show the modulation on the superorbital period.

To investigate the long-term behavior of this modulation we calculated a dynamic power spectrum. To obtain this we calculated the power spectrum of a segment of the light curve, and then shifted the start time of the segment by an offset and calculated the power spectrum of that. The individual power spectra are thus not statistically independent. The choice of the length of the light curve segments is a compromise between the segment being long enough to enable modulation to be significantly detected, but not being so long that changes in the modulation become smeared out. We experimented with different segment lengths and found that in order for the superorbital modulation to be seen it was necessary to use segments at least several hundred days long. Here we show results using a segment length of 750 days, although the overall results are essentially the same if somewhat different segments lengths are used. The resulting dynamic power spectrum is shown in Figure 5. It is found that there are two main intervals when the superorbital modulation is most prominent, from around the start of the light curve to approximately MJD 55,000 when the modulation is briefly not detectable in the dynamic power spectrum, and then from approximately MJD 56,000 to 57,500 when it is detected again at a comparable level to the earlier portion of the light curve. Most recently the superorbital modulation is not clearly visible in the dynamic power spectrum. Instead, the maximum power occurs near the second harmonic of the superorbital period. To characterize this we calculated power spectra of the most recent observations with different start and end times to determine what selection of time range maximized the signal at the harmonic. From this, we find that the power near the harmonic has its strongest signal relative to the mean power if observations from approximately MJD 57,650 (2016-09-19) to 58,800 (2019-11-13) are used. For this subset, the strongest peak in the power spectrum is at a period of 7.430 0.006 days and has a height of 17.8 compared to the mean power over the period range from 0.07 days to 1145 days, the length of that subset of the light curve, and the associated FAP is 3. This period is close to half the superorbital period derived from the entire light curve of 7.4565 0.0013 days, although they are nominally statistically different from each other at 4.
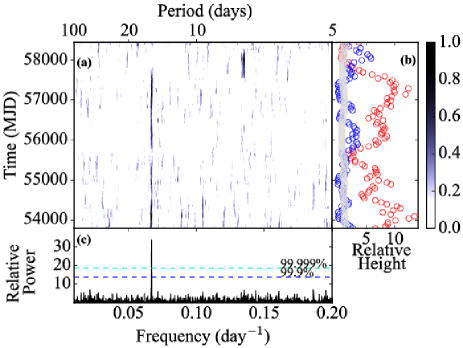
To illustrate this change, in Figure 6 we show the power spectrum of the BAT light curve covering the region of the orbital period to the second harmonic for (i) the entire light curve, (ii) the light curve from the start until MJD 57,650, and (iii) the power spectrum of the light curve from MJD 57,650 until 58,800. From this, the superorbital period is only seen in the first two power spectra, and the absolute power of this modulation is stronger for time interval “(ii)”. In Figure 7 we show the BAT light curve of 4U 153852 folded on the 14.9130 day superorbital period for the same three time ranges. Thus, there appears to have been a change in the shape of the superorbital modulation during the interval MJD 57,650 to 58,800 with the profile now having a more pronounced maximum near a superorbital phase of 0.85 and a hint of a secondary small maximum near phase 0.3.


3.2. Fermi GBM Pulse Frequency Measurements of 4U 153852
The GBM measurements of the pulse frequency 4U 153852, together with the pulsed flux, are shown in Figure 1 (top and middle panels respectively). We also overplot the pulse frequency measurements reported from INTEGRAL measurements by Hemphill et al. (2013). Although there is considerable fluctuation during the GBM observations, the overall trend is for an initial decrease in spin frequency (“spin down”) followed by a flattening of the frequency changes and a slight trend towards increasing spin frequency (“spin up”). Due to the fluctuations and the uncertainties on the frequency measurements, the time of the transition between the two trends is not well defined, but appears to occur near approximately MJD 58,230 (2018-04-22). Fitting linear trends to the frequency measurements before and after this time we find spin frequency changes of = -9.8 0.1 10-12 s-1 and +1.0 0.5 10-12 s-1. For comparison Rubin et al. (1997) found an overall spin-up trend of +9.6 10-12 s-1 with BATSE over a four year period, although with fluctuations around this trend, and an implied earlier spin-down rate of = -8 10-12 s-1 from more scattered measurements made with a variety of satellites. Neither the pulsed flux measured with the GBM nor the BAT flux measurements (Figure 1) show any large change associated with the change in .
3.3. Results of LCO Optical Photometry of 4U 153852
To search for modulation in the LCO photometry we calculated the power spectra of the light curves, using only observations obtained with 2m telescopes with longer exposures because of their smaller uncertainties, and these are shown in Figure 8. For both the B- and V-band light curves the strongest peak is at half the orbital period. This is expected because the orbital modulation is driven by ellipsoidal variability which gives two maxima and two minima per orbit. In Figure 9 we show the B- and V-band light curves folded on the orbital period. In the power spectra, however, we do not see any indication of modulation at the superorbital period. For the B- and V-bands we determine 90% upper limits on the semi-amplitude of modulation on the superorbital period of 0.01 mag. for both wavebands. In both power spectra we see a second peak near a period of 2.15 days. As a check on whether the secondary peak may be due to aliasing, for each LCO photometric light curve (B and V) we fitted a sine wave with a period fixed to half the orbital period, and then subtracted this from the light curve. While the minimum at phase 0.5 due to ellipsoidal modulation is expected to be deeper than the minimum at phase 0.0, subtracting a single sine wave with a period of half the orbital period was found to be sufficient to remove the orbital modulation from both power spectra. In addition, the power spectra no longer showed modulation near 2.15 days, suggesting that it is indeed due to aliasing of the orbital modulation. The semi-amplitudes of the fitted sine waves to the orbital modulation were 0.024 0.003 mag. and 0.021 0.003 mag. for the B- and V-bands respectively.


We also calculated power spectra of only the observations obtained with the 1m telescopes, and these do not show a significant detection of the orbital modulation on their own. Calculating weighted power spectra of the combined 1m and 2m observations together did not show significant differences from the power spectra from just the 2m observations.
3.4. Results of BAT Observations of IGR J163934643
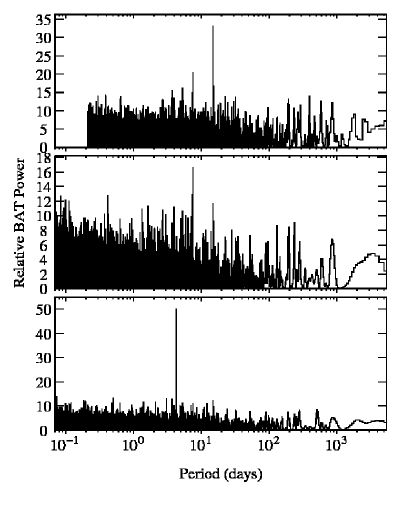
In Figure 11 we show three versions of the power spectrum of the BAT light curve of IGR J163934643. The lower panel shows the power spectrum of the entire light curve. This shows a very prominent peak at the orbital period of 4.2376 0.0002 days, which is consistent with our previously derived period and the more precise value of 4.23810 0.00007 days obtained by Coley et al. (2015) from eclipse timing. However, no other strong peaks are seen in the power spectrum. We then, in a similar fashion to our analysis of 4U 153852, removed points around the minimum of the orbital light curve. To facilitate comparison with the results presented in Corbet & Krimm (2013) we adopt the same convention for the definition of the orbital minimum and place this at phase 0.5 at a time of MJD 54,352.50 and remove times corresponding to orbital phases 0.35 to 0.65, as illustrated in Figure 10. We also employ the orbital period that we determine from the BAT power spectrum. The power spectrum of the light curve with times around orbital minimum is shown in the middle panel of Figure 11. The two highest peaks, although not very strong, are at the fundamental (14.9814 0.0055 days) and second harmonic (7.4903 0.011 days Psuper = 14.9805 0.0022 days) of the previously suggested superorbital period. We next, in order to perform a more sensitive search for non-sinusoidal modulation, took the power spectrum of the light curve with orbital minimum points removed, and replaced each data point in the power spectrum with the sum of the point and its second and third harmonics. This is shown in the top panel of Figure 11. The highest peak is now at 14.980 days, near the previously proposed 14.971 0.005 day superorbital period, with a relative height of 33. The light curve folded on this period is shown in Figure 12. The possible superorbital modulation is similar to that determined previously (Corbet & Krimm, 2013), and is rather “bumpy” and not sinusoidal, consistent with the presence of multiple harmonically-related peaks in the power spectrum.


To investigate the long-term properties of this candidate signal, we calculated the dynamic power spectrum of the BAT light curve of IGR J163934643 in a similar way to that employed for 4U 153852. However, in addition to removing data around the orbital minimum of the light curve, we also applied harmonic summing up to the third harmonic in the same way as in the upper panel of Figure 11. Light curve subsections of length 1000 days were used, with increments between sections of 10 days. The resulting dynamic power spectrum is shown in Figure 13. The candidate period is only apparent in approximately the first half of the light curve. We therefore investigated the power spectrum of the BAT light curve of IGR J163934643 using only data obtained before MJD 56,500 (2013-07-27). In a similar way to the power spectra of the entire light curve shown in Figure 11, we calculated power spectra of the full light curve up to this time, with orbital minima removed, and the summed harmonic power spectrum of this subset of the light curve. The resulting power spectra are shown in Figure 14. We find that there is only a very modest increase of the size of the peak at the candidate superorbital period.


4. Discussion
4.1. 4U 153852
The BAT light curve of 4U 153852 has a highly significant superorbital modulation at a period consistent with exactly four times the orbital period. In order to compare the superorbital properties of 4U 153852 with the previously known systems, in Figure 15 we plot superorbital period against orbital period for wind-accretion supergiant HMXBs, and also the ratio of superorbital period to orbital period as a function of orbital period. It was noted in Corbet & Krimm (2013) that, with only five data points, there appeared to be a correlation between superorbital period and orbital period. Although there are still only six sources, the addition of the periods for 4U 153852 is consistent with such a relationship. It is notable that both the orbital period and superorbital period of 4U 153852, and hence the ratio between the two, are very similar to those of IGR J16418-4532. It is also striking that for 4U 153852, within the uncertainties, the superorbital period is consistent with being exactly four times the orbital period (Figure 15, Table 2) with the implied time of superorbital maximum and minimum for sinusoidal modulation occurring during the orbital eclipses.

The strength of the superorbital modulation in 4U 153852 is found to vary, but the length of the period and the phasing of the modulation do not show obvious changes during most of the observations. However, in the most recent observations (after MJD 57,650) there is a distinct change in the modulation profile which results in the decrease of the peak at the fundamental in the power spectrum and the presence of a peak near the second harmonic of the period. For comparison, in IGR J16493-4348 BAT observations also showed changes in the strength of the superorbital modulation (Coley et al., 2019), but with the modulation preserving the phase and shape of the modulation before and after an interval where the modulation significantly weakened. Similarly, for 2S 0114+650 Hu et al. (2017) reported that the superorbital period was stable, but that the modulation amplitude was highly variable. In this case, Hu et al. (2017) reported that the neutron star exhibited a long term increase in rotational frequency, but that reductions in superorbital modulation amplitude were associated with times when the spin frequency was not increasing as rapidly.
For 4U 153852, measurements by Rubin et al. (1997) and Bildsten et al. (1997) with BATSE demonstrated that a previous long-term spin-down trend changed to spin up, with a torque reversal in approximately 1990. This spin up trend was found to continue from observations made by Baykal et al. (2006) in 2003 with the Rossi X-ray Timing Explorer. Since then a second torque reversal occurred as shown by the GBM pulse frequency measurements (Finger et al., 2009) and also observed with INTEGRAL (Hemphill et al., 2013). This torque reversal occurred during the BAT observations, but before the start of the GBM observations. The continued observations with the GBM show that the long-term spin down initially continued, with a more recent flattening of pulse frequency changes (Figure 1). Although the long-term spin period changes of 4U 153852 are in the opposite direction from 2S 0114+650, there is at least a suggestion that the flattening of the trend might be associated with the properties of the superorbital modulation. However, to determine whether this is more than coincidental, further similar changes of superorbital properties that occur at the same time as changes in would need to be seen. In particular, the lack of any clear change in superorbital modulation during the torque reversal primarily found with INTEGRAL may argue against a simple connection between superorbital modulation and .
4.2. IGR J163934643
For IGR J163934643, while manipulating the power spectrum by removing eclipses and adding harmonics does show an apparently significant modulation, we do not yet consider that the superorbital modulation is definitely present due to the amount of manipulation of the data, and because the candidate superorbital period is not detected in the new statistically independent data obtained beyond that in Corbet & Krimm (2013). i.e. the signal is not seen in observations obtained since MJD 56,452 (Figure 13). However, the orbital period and candidate superorbital period are consistent with the possible correlation between these parameters (Figure 15, Table 2).
For 4U 153852 there is a possible connection between the change in the superorbital modulation and the second of the two torque changes on the neutron star (Section 4.1). For IGR J163934643 there are only a few measurements of the neutron star pulse period with long intervals between them (Bodaghee et al., 2016) and the most recent measurement is from 2014-06- 27 (MJD 56,835). Thus, although torque changes are implied for IGR J163934643 from these measurements, we cannot clearly associate a possible cessation of superorbital modulation with such a change.
4.3. Models
4.3.1 Model Overview
Several mechanisms have been proposed for the origin of the superorbital modulation, see for example the discussion in Coley et al. (2019), including a precessing accretion disk, a triple stellar system, precession of the donor star, corotating interaction regions (CIRs) in the stellar wind, and tidal oscillations in the primary. While a precessing disk and a triple system were both considered to be unlikely, the other proposed models could not be excluded. The orbital and superorbital periods of 4U 153852 are consistent with the possible correlation between these periods previously noted (Corbet & Krimm, 2013), although there are still only six systems with definite superorbital periods. Such a correlation would require modulation mechanism which would produce this, but it is still unclear how any of the proposed models would achieve this.
4.3.2 Corotating Interaction Regions
In the CIR model (Bozzo et al., 2017) the frequency of the superorbital modulation is the difference between the orbital frequency and the rotation frequency of the CIR structure. For 4U 153852 the superorbital period is consistent to better than 0.02% with being exactly four times the orbital period. Thus, depending on whether the CIR is rotating more or less rapidly than the orbital frequency, the rotation period of the CIR would be either 2.9827 0.0003 or 4.9712 0.0003 days respectively, which are consistent with ratios of (4/5) and (4/3) the 3.73 day orbital period, respectively. However, it is only for 4U 153852 and not the other similar systems where such a “resonance” would be present.
In the lower panel of Figure 16 we plot the implied rotation periods of the CIR for each source in Table 2, including IGR J163934643, assuming the superorbital period is caused by the beat between the orbital and CIR periods. For each source two periods are mathematically possible, one longer than the orbital period and one shorter. In Figure 16 very strong correlations are seen between the CIR periods and the orbital period with linear correlation coefficients of 0.9999 and 0.9997 for the shorter and longer periods respectively. While the nominal probabilities, “”, of achieving such a level of correlation with random data are very low at 10-10 and 10-9 respectively, we note that since the CIR frequency is derived from the orbital frequency, modified by the superorbital frequency, the parameters are not completely statistically independent. The relationship between calculated CIR period and orbital period can be fit with either a linear function or a power law (a linear fit to the log of the periods):
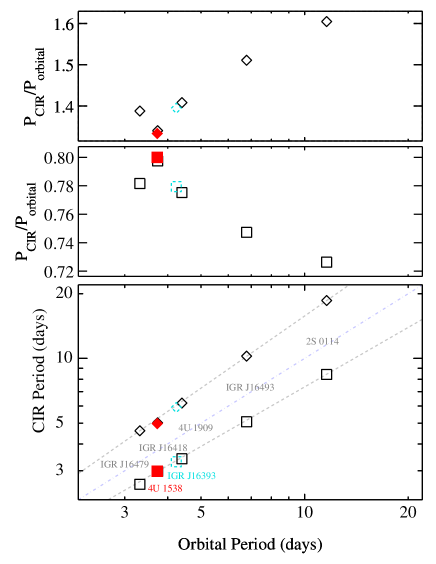
In the middle and upper panels of Figure 16 we plot the implied CIR periods as a fraction of the orbital period for the shorter and longer CIR periods respectively. The shorter CIR period is found to range between 0.73 to 0.8 of the orbital period, with 4U 153852 having the largest implied CIR period as a fraction of orbital period. The longer CIR period is found to range between 1.33 and 1.60 times the orbital period, with 4U 153852, in this case, having the lowest ratio. For both the shorter and the longer periods there is some correlation between period ratio and orbital period with linear correlation coefficients of 0.92 ( = 0.003) and 0.95 ( = 0.001) respectively. Bozzo et al. (2017) pointed out that multiple CIRs might exist in the wind. The small range of implied CIR period to orbital period that we find suggests that, within the context of this model, while such multiple regions may cause features in the light curve, they would not have caused us to find superorbital periods which are actually an integer fraction of the underlying true period.
If the CIR rotation period was identical to the rotation period of the primary star, and the rotation of the primary was tidally locked to the orbital period, then the CIR period would be identical to the orbital period and no beat-period superorbital modulation could be produced. Therefore, for this model, the primary star rotation period must be non-synchronous with the orbital period and/or the CIR rotation period must differ from the primary star’s rotation period. In addition, for all of the systems, Figure 16 shows that the relative period ratio is roughly the same for all systems. This CIR structure is thought to be linked to stellar spots (Lobel & Blomme, 2008) and, at least in principle, its rotation frequency could differ from that of the primary star (Bozzo et al., 2017).
We suggest that there are two possible mechanisms where the CIR period will be close to, but not exactly, the orbital period. First, we propose that the primary stars are at rotating at a rate driven by tidal synchronization. However, for eccentric systems, tidal synchronization is driven by the orbital speed at periastron (e.g. Lurie et al., 2017). This will result in the primary star’s rotation period being “pseudo-synchronized” at a rate faster than for a circular orbit (Hut, 1981; Lurie et al., 2017). Alternatively, the deviation of the CIR period from the orbital period might be driven by differential rotation of the primary star. For the isolated O4I(n)fp star Pup, Ramiaramanantsoa et al. (2018) proposed that the CIR was linked to spots at higher latitudes on the star that were rotating faster than at lower latitudes. We note that from Kepler observations Lurie et al. (2017) found a population of late-type eclipsing binaries where stellar rotation periods were 13% slower than synchronous, and they attributed this to differential rotation of high-latitude star spots. Thus, at least in those stars, differential rotation was able to persist despite tidal synchronization of the rotation rate at lower stellar latitudes. We cannot discriminate between the case where the CIR is rotating more rapidly or more slowly than the orbital frequency. However, the modest spread of ratio of implied CIR period to orbital period might be a hint that it is the same situation, i.e. faster or slower, for all systems.
We note that if the CIR rotation period is approximately a fixed fraction or multiple of the orbital period, then this in itself would lead to a correlation between superorbital and orbital periods. If the CIR period is a factor “” times the orbital period, then the superorbital period will be . In the case that the fractional difference between CIR period and orbital period increases with orbital period, as is a possibility hinted at by the middle and top panels of Figure 16, then the ratio of superorbital period to orbital period will decrease, as may be seen in the top panel of Figure 15. Systems that do not have significant co-rotating structure in their winds, or where the CIR period is equal to the orbital period, will not exhibit superorbital modulation. This may account for the significant number of wind-accretion HMXBs where superorbital modulation has not yet been detected (Corbet & Krimm, 2013).
In the CIR model, a change in the modulation properties with the second harmonic becoming stronger would be accounted for by a change in the CIR structures in the stellar wind, for example the appearance of multiple regions (Bozzo et al., 2017). Such a change in superorbital modulation profiles has not yet been seen in 2S 0114+650 or IGR J16493-4348 despite changes in the amplitude of the modulation (Hu et al., 2017; Coley et al., 2019, respectively). For IGR J163934643 the “bumpy” shape of the light curve folded on the candidate superorbital period (Figure 12) could perhaps be most directly explained by the CIR model with the presence of several corotating regions in the stellar wind, each of which gives rise to peaks of different strength.
4.3.3 Tidally Induced Pulsations
In the tidally induced pulsation model (Zahn, 1975; Koenigsberger et al., 2006; Moreno et al., 2005, 2011), this is only predicted to generate superorbital modulation for circular systems as for eccentric systems the pulsations would be expected to occur on the orbital period. While for 4U 153852 the eccentricity is unclear, some of the other systems with superorbital modulation do have detectable eccentricities (Table 2). Perhaps for 4U 153852 the presence of pulsations of the primary in resonance with the orbital period could be imagined, but this would not apply to the other systems where superorbital and orbital periods are further from an integer ratio.
Similar to the case of the CIR model, if the rotation of the primary star is not tidally synchronized to the orbital period, then modulation could potentially be caused by a beat between a pulsation period and the orbital period. In this case, the “CIR” periods in Figure 16 could be interpreted as intrinsic pulsation periods.
4.3.4 General Considerations
While there also appear to be correlations between superorbital and orbital period for HMXBs powered by Roche-lobe overflow, and for Be star systems (Corbet & Krimm, 2013; Townsend & Charles, 2020) these other systems are likely to be physically different as we do not expect the presence of a persistent accretion disk in wind-accreting HMXBs, although for some such it may be possible that a transient accretion disk could form (e.g. Xu & Stone, 2019).
There are also other clues that hint at the nature of the mechanism. Similar to what has been seen in IGR J16493-4348 (Coley et al., 2019) and 2S 0114+650 (Hu et al., 2017), the strength of the superorbital modulation is variable, and the most recent observations with the BAT show a change in the superorbital modulation profile. At the same time, pulse frequency measurements with the Fermi GBM show that the spin-down rate of the pulsar decreased. If this is a persistent feature of the system then it would be similar to that noted by Hu et al. (2017) for 2S 0114+650 who reported that when the system was no longer spinning up, the superorbital modulation amplitude decreased. However, we note that the large spin-up event that occurred during the initial part of the BAT observations was not accompanied by any apparent change in superorbital modulation. Hu et al. (2017) attributed the apparent connection between superorbital modulation and spin period changes to the behavior of a transient accretion disk in 2S 0114+650, and this is also discussed by Wang & Tong (2020). The presence of such a disk in 4U 153852 seems less likely as no evidence for this has been seen from optical spectroscopy (Reynolds et al., 1992). For IGR J16493-4348, when the modulation amplitude decreased, and then increased again, the phasing of the modulation was unchanged, implying that the system had a “memory” of this, which is challenging to explain with a transient accretion disk. Another long-term change that has been observed in 4U 153852 is the energy of a cyclotron resonance scattering feature in its X-ray spectrum, although Hemphill et al. (2019) consider that it is not yet possible to definitely associate changes in this with torque reversals on the neutron star. Even if 4U 153852 does not possess a, perhaps transient, accretion disk, there do nevertheless appear to be changes in the nature of the accretion process that result in spin-down and spin-up trends that continue for durations of years.
The optical photometry of 4U 153852/QV Nor, similarly to previous observations, shows the presence of significant ellipsoidal modulation due to the tidal distortion of the primary star by the neutron star. While there are no explicit predictions of the degree of optical modulation on the superorbital period for any model, some models may have at least the possibility of resulting in some level of modulation. For example, a transient disk may be expected to produce optical emission, and tidally induced oscillations should also produce changes in optical brightness at some level. While our optical photometry does not show any significant modulation at the superorbital period, the observations were obtained after the 14.9130 day modulation in the BAT light curve was no longer strongly present. Continued optical monitoring of 4U 153852 would both enable a steady increase in the sensitivity to detection of periodic optical modulation on the superorbital period and would be important to compare if/when the 14.9130 day X-ray modulation strengthens again.
5. Conclusion
4U 153852 is now an additional member of the class of wind-accretion supergiant HMXBs which show superorbital modulation. The orbital and superorbital periods are consistent with the possible correlation between these that we previously noted. The driving mechanism for superorbital modulation remains mysterious and such a correlation is challenging to explain. However, a model based on the beat between a CIR and the orbit, where the CIR period has a modest deviation from tidal synchronization due to either orbital eccentricity or differential rotation of the primary, appears promising.
If 4U 153852 was fainter, it would not have been possible to detect the superorbital modulation as the superorbital peak in the power spectrum is much smaller than the orbital peak. The difficulty of detecting superorbital modulation is compounded when the modulation can either decrease in strength, as in IGR J16493-4348 (Coley et al., 2019) or 2S 0114+650 (Hu et al., 2017), or change modulation shape, as for 4U 153852. Thus the possibility remains that low-level superorbital modulation could be present in other similar systems where it has not yet been seen because they are either fainter and/or the superorbital modulation is less persistent.
For IGR J163934643, although it is not yet certain that the candidate modulation is real, it would be similar to the other superorbital systems in that it would also be variable in its properties. In addition, its superorbital and orbital periods would be consistent with the possible correlation between these periods (Figure 15). If the modulation is real, and the physical conditions that cause it, whether it is the presence of CIRs, a transient accretion disk, or something else, return we would expect to see the superorbital modulation again. In that case, an investigation of other properties of the system, including its X-ray spectrum and any accretion torque changes, may be revealing.
Continued long-term observations of both 4U 153852 and IGR J163934643 have the potential to give insights into the physics of superorbital modulation in supergiant HMXBs. The relative brightness of 4U 153852 in X-rays is advantageous for continued long-term studies. If we can continue to monitor both the superorbital modulation and the pulse frequency changes to further explore a tentative connection between these. If 4U 153852 is about to enter an extended spin-up phase we will have the opportunity to investigate the effects of this on the superorbital modulation. The brightness of the optical counterpart QV Nor also facilitates long-term photometric monitoring and so a search for any long-term changes in this waveband.
References
- Barthelmy et al. (2005) Barthelmy, S. D., Barbier, L. M., Cummings, J. R., et al. 2005, Space Sci. Rev., 120, 143
- Baykal et al. (2006) Baykal, A., Inam, S. Ç., & Beklen, E. 2006, A&A, 453, 1037
- Bildsten et al. (1997) Bildsten, L., Chakrabarty, D., Chiu, J., et al. 1997, ApJS, 113, 367
- Bodaghee et al. (2012) Bodaghee, A., Rahoui, F., Tomsick, J. A., et al. 2012, ApJ, 751, 113
- Bodaghee et al. (2016) Bodaghee, A., Tomsick, J. A., Fornasini, F. M., et al. 2016, ApJ, 823, 146
- Bozzo et al. (2017) Bozzo, E., Oskinova, L., Lobel, A., et al. 2017, A&A, 606, L10
- Brown et al. (2013) Brown, T. M., Baliber, N., Bianco, F. B., et al. 2013, PASP, 125, 1031
- Clark (2000) Clark, G. W. 2000, ApJ, 542, L131
- Cochran (1937) Cochran, W. G. 1937, Supplement to the Journal of the Royal Statistical Society, 4, 102
- Cochran (1954) Cochran, W. G. 1954, Biometrics, 10, 101
- Coley et al. (2015) Coley, J. B., Corbet, R. H. D., & Krimm, H. A. 2015, ApJ, 808, 140
- Coley et al. (2019) Coley, J. B., Corbet, R. H. D., Fürst, F., et al. 2019, ApJ, 879, 34
- Corbet et al. (1993) Corbet, R. H. D., Woo, J. W., & Nagase, F. 1993, A&A, 276, 52
- Corbet et al. (2010) Corbet, R. H. D., Barthelmy, S. D., Baumgartner, W. H., Krimm, H. A., Markwardt, C. B., Skinner, G. K., & Tueller, J. 2010, The Astronomer’s Telegram, 2599, 1
- Corbet & Krimm (2013) Corbet, R. H. D., & Krimm, H. A. 2013, ApJ, 778, 45
- Corbet et al. (2017) Corbet, R. H. D., Coley, J. B., & Krimm, H. A. 2017, ApJ, 846, 161
- Farrell et al. (2006) Farrell, S. A., Sood, R. K., & O’Neill, P. M. 2006, MNRAS, 367, 1457
- Farrell et al. (2008) Farrell, S. A., Sood, R. K., O’Neill, P. M., & Dieters, S. 2008, MNRAS, 389, 608
- Finger et al. (2009) Finger, M. H., Beklen, E., Narayana Bhat, P., et al. 2009, arXiv e-prints, arXiv:0912.3847
- Hemphill et al. (2013) Hemphill, P. B., Rothschild, R. E., Caballero, I., et al. 2013, ApJ, 777, 61
- Hemphill et al. (2019) Hemphill, P. B., Rothschild, R. E., Cheatham, D. M., et al. 2019, ApJ, 873, 62
- Horne & Baliunas (1986) Horne, J. H., & Baliunas, S. L. 1986, ApJ, 302, 757
- Hu et al. (2017) Hu, C.-P., Chou, Y., Ng, C.-Y., et al. 2017, ApJ, 844, 16
- Hut (1981) Hut, P. 1981, A&A, 99, 126
- Ilovaisky et al. (1979) Ilovaisky, S. A., Chevalier, C., & Motch, C. 1979, A&A, 71, L17
- Jenke et al. (2012) Jenke, P. A., Finger, M. H., Wilson-Hodge, C. A., et al. 2012, ApJ, 759, 124
- Kabiraj et al. (2020) Kabiraj, S., Islam, N., & Paul, B. 2020, MNRAS, 491, 1491
- Koen (1990) Koen, C. 1990, ApJ, 348, 700
- Koenigsberger et al. (2006) Koenigsberger, G., Georgiev, L., Moreno, E., et al. 2006, A&A, 458, 513
- Kotze & Charles (2012) Kotze, M. M., & Charles, P. A. 2012, MNRAS, 420, 1575
- Krimm et al. (2013) Krimm, H. A., Holland, S. T., Corbet, R. H. D., et al. 2013, ApJS, 209, 14
- Lobel & Blomme (2008) Lobel, A. & Blomme, R. 2008, ApJ, 678, 408
- Lurie et al. (2017) Lurie, J. C., Vyhmeister, K., Hawley, S. L., et al. 2017, AJ, 154, 250
- Makishima et al. (1987) Makishima, K., Koyama, K., Hayakawa, S., et al. 1987, ApJ, 314, 619
- Malacaria et al. (2020) Malacaria, C., Jenke, P., Roberts, O. J., et al. 2020, arXiv e-prints, arXiv:2004.00051
- Martínez-Núñez et al. (2015) Martínez-Núñez, S., Sander, A., Gímenez-García, A., et al. 2015, A&A, 578, A107
- Meegan et al. (2009) Meegan, C., Lichti, G., Bhat, P. N., et al. 2009, ApJ, 702, 791
- Moreno et al. (2005) Moreno, E., Koenigsberger, G., & Toledano, O. 2005, A&A, 437, 641
- Moreno et al. (2011) Moreno, E., Koenigsberger, G., & Harrington, D. M. 2011, A&A, 528, A48
- Mukherjee et al. (2006) Mukherjee, U., Raichur, H., Paul, B., et al. 2006, Journal of Astrophysics and Astronomy, 27, 411
- Pakull et al. (1983) Pakull, M., van Amerongen, S., Bakker, R., et al. 1983, A&A, 122, 79
- Pearlman et al. (2019) Pearlman, A. B., Coley, J. B., Corbet, R. H. D., et al. 2019, ApJ, 873, 86
- Ramiaramanantsoa et al. (2018) Ramiaramanantsoa, T., Moffat, A. F. J., Harmon, R., et al. 2018, MNRAS, 473, 5532
- Rawls et al. (2011) Rawls, M. L., Orosz, J. A., McClintock, J. E., et al. 2011, ApJ, 730, 25
- Reynolds et al. (1992) Reynolds, A. P., Bell, S. A., & Hilditch, R. W. 1992, MNRAS, 256, 631
- Romano (2015) Romano, P. 2015, Journal of High Energy Astrophysics, 7, 126
- Romano et al. (2015) Romano, P., Bozzo, E., Mangano, V., et al. 2015, A&A, 576, L4
- Rubin et al. (1997) Rubin, B. C., Finger, M. H., Scott, D. M., et al. 1997, ApJ, 488, 413
- Russell et al. (2019) Russell, D. M., Bramich, D. M., Lewis, F., et al. 2019, Astronomische Nachrichten, 340, 278
- Scargle (1982) Scargle, J. D. 1982, ApJ, 263, 835
- Scargle (1989) Scargle, J. D. 1989, ApJ, 343, 874
- Taam & Fryxell (1988) Taam, R. E., & Fryxell, B. A. 1988, ApJ, 327, L73
- Taam & Fryxell (1989) Taam, R. E., & Fryxell, B. A. 1989, ApJ, 339, 297
- Townsend & Charles (2020) Townsend, L. J., & Charles, P. A. 2020, arXiv e-prints, arXiv:2004.14207
- Wang & Tong (2020) Wang, W., & Tong, H. 2020, MNRAS, 492, 762
- Xu & Stone (2019) Xu, W., & Stone, J. M. 2019, MNRAS, 488, 5162
- Zahn (1975) Zahn, J.-P. 1975, A&A, 41, 329
| Site | Telescope | Instrument | Filter | Start Night | End Night | Number | Exposure (s) |
|---|---|---|---|---|---|---|---|
| SAAO | 1m010 | fl16 | B | 2018-08-15 | 2018-09-22 | 12 | 15 |
| SAAO | 1m010 | fl16 | V | 2018-08-15 | 2018-09-22 | 1 | 5 |
| SAAO | 1m012 | fl06 | B | 2018-08-22 | 2018-09-28 | 5 | 15 |
| SAAO | 1m012 | fl06 | V | 2018-08-22 | 2018-09-28 | 5 | 5 |
| SSO | 1m003 | fl11 | B | 2018-09-21 | 2018-09-29 | 5 | 15 |
| SSO | 1m003 | fl11 | V | 2018-09-21 | 2018-09-29 | 4 | 5 |
| SSO | 1m011 | fl12 | B | 2018-08-20 | 2018-08-21 | 2 | 15 |
| SSO | 1m011 | fl12 | V | 2018-08-20 | 2018-08-21 | 2 | 5 |
| SSO | 2m002 | fs01 | B | 2019-05-21 | 2019-08-29 | 63 | 30 |
| SSO | 2m002 | fs01 | V | 2019-05-21 | 2019-08-29 | 63 | 15 |
| Name | Porb | Psuper | Psuper/Porb | Pspin | Spectral Type | Eccentricity | SFXT? |
|---|---|---|---|---|---|---|---|
| (days) | (days) | (s) | |||||
| IGR J16479-4514 | 3.31961 0.00004 (a) | 11.880 0.002 | 3.58 | ? | O8.5 I/O9.5 Iab | ? | Y |
| 4U 1538-52 | 3.728354 0.000009 | 14.9130 0.0026 | 4.00 | 526 | B0 Iab | 0.2 | N |
| IGR J16418-4532 | 3.73881 0.00002 (a) | 14.730 0.006 | 3.94 | 1212 | O8.5 | ? | N (b) |
| 4U 1909+07 | 4.4003 0.0004 | 15.180 0.003 | 3.45 | 605 | B0-3 I (c) | 0.02 0.04 | N |
| IGR J16493-4348 | 6.7828 0.0004 (d) | 20.058 0.007 (e) | 2.96 | 1093 | B0.5 Ia (d) | 0.2 (d) | N |
| 2S 0114+650 | 11.591 0.003 | 30.76 0.03 | 2.65 | 9700 | B1 Ia | 0.18 0.05 | N |
| IGR J16393-4643 | 4.23810 0.00007 (a) | (14.981 0.002) | (3.53) | 910 | ? | ? | N |
Note. — The superorbital period for IGR J16393-4643 is considered to be a candidate and not a definite detection. The table is updated from Table 1 in Corbet & Krimm (2013) based on: (a) Coley et al. (2015), (b) Romano (2015), (c) Martínez-Núñez et al. (2015), (d) Pearlman et al. (2019), (e) Coley et al. (2019). For parameters of 4U 153852, apart from the superorbital period, see Section 1.2. The SFXT column indicates whether a source is known to be a Supergiant Fast X-ray Transient.