The nearby magnetic cool DZ white dwarf PM J081863110
Abstract
We present an analysis of photometric, spectroscopic and spectropolarimetric data of the nearby, cool, magnetic DZ white dwarf PM J081863110. High dispersion spectra show the presence of Zeeman splitted spectral lines due to the presence of a surface average magnetic field of 92 kG. The strong magnesium and calcium lines show extended wings shaped by interactions with neutral helium in a dense, cool helium-rich atmosphere. We found that the abundance of heavy elements varied between spectra taken ten years apart but we could not establish a time-scale for these variations; such variations may be linked to surface abundance variations in the magnetized atmosphere. Finally, we show that volume limited samples reveal that about 40% of DZ white dwarfs with effective temperatures below 7000 K are magnetic.
keywords:
stars: individual: PM J08186-3110 – white dwarfs – stars: magnetic field – stars: atmospheres1 Introduction
Magnetic fields are detected among all spectral classes of white dwarfs. The incidence of magnetism was reported to be significantly higher in white dwarfs polluted with heavy elements compared to the incidence of magnetism in the general white dwarf population (Kawka & Vennes, 2014; Hollands, Gänsicke & Koester, 2015; Kawka et al., 2019). In polluted hydrogen-rich (DAZ) white dwarfs, the incidence of magnetism is % for white dwarfs with effective temperatures K and all of these have magnetic field strengths below 1 MG (Kawka & Vennes, 2014; Kawka et al., 2019). Only two magnetic DAZ white dwarfs are known with K, NLTT 53908 ( K, Kawka & Vennes, 2014) and WD 2105820 ( K, Landstreet et al., 2012; Gentile Fusillo et al., 2018). The incidence of magnetism in pure-hydrogen DA white dwarfs, i.e., those apparently devoid of heavy elements, may also be age dependent with a higher prevalence at cooler temperatures, K (Rolland & Bergeron, 2015). A study of the local sample (Giammichele, Bergeron & Dufour, 2012) does indicate a peak incidence of 20% among cool DA white dwarfs (Kawka et al., 2019). However, the polluted, magnetic DA white dwarfs (DAZH) show a much narrower field spread ( MG) than their unpolluted counterparts (DAH) and they appear to form a distinct population. It is not known whether the magnetic fields in these two populations have a common origin.
In the case of polluted helium-rich white dwarfs (DZ),111In this paper, the spectroscopic label “DZ” simply refers to polluted, helium-rich white dwarfs, and the label “DAZ” refers to polluted, hydrogen-rich white dwarfs. However, we note that ultra cool ( K), polluted, hydrogen-rich white dwarfs with vanishing Balmer lines (not encountered in the present study) may be assimilated to the DZ white dwarfs in the same fashion that ultra cool DA white dwarfs maybe assimilated to the featureless DC white dwarfs. the incidence of magnetism is about % for white dwarfs with K and magnetic field strengths ranging from a few hundred kG up to about 30 MG (Hollands, Gänsicke & Koester, 2015; Hollands, 2017). SDSS J1242+0829 is the only known magnetic DZ with K (Coutu et al., 2019). Continuum polarization measurements may reveal the presence of a strong magnetic field in unpolluted DC white dwarfs. The detection of continuum polarization in three DC white dwarfs that lie within 20 pc of the Sun (Bagnulo & Landstreet, 2020) suggests that the incidence of magnetism in DC white dwarfs is also high, but with much stronger magnetic fields ( MG) than in their polluted (DZ) counterparts.
Two scenarios have been proposed to explain the higher incidence of magnetism in cool, polluted white dwarfs. In the first scenario an old white dwarf encounters and collides with a gaseous planet giving rise to differential rotation in the white dwarf envelope. This differential rotation would then generate a relatively weak magnetic field (Farihi et al., 2011; Kawka et al., 2019). The chance of such a collision increases with time and Farihi et al. (2011) estimated that such a stellar encounter has a 50% probability of occurring every 0.5 Gyr. In the second scenario proposed the magnetic field in DAZ and DZ white dwarfs is generated in the core of the parent giant stars (Kissin & Thompson, 2015; Hollands, 2017). Here, a planet or a low mass stellar companion could generate a dynamo between the radiative and convective envelopes during the shell burning phases. This dynamo would create the magnetic field which would remain hidden below the non-magnetic envelope for about 1 to 2 Gyr. In either scenario, this magnetic field was created by the engulfment of a planet, it is likely that other planets or asteroids may have survived and over time they would move toward the white dwarf and become the source of pollution in the white dwarf atmosphere.
The carbon-rich, hot DQ white dwarfs ( K) form another class of objects showing a significantly higher incidence of magnetism. These stars have an incidence of at least 70% (Dufour et al., 2013) and they are also fast rotators, with periods ranging from a few minutes to a couple of days (Dunlap & Clemens, 2015; Williams et al., 2016). These rare objects also have an average mass that is higher than that of the general white dwarf population. The combined properties suggest that these stars have formed in double degenerate mergers (Dunlap & Clemens, 2015; Kawka, Vennes, & Ferrario, 2020) rather than following the engulfment of a planet as suggested in the case of DZ white dwarfs. Coutu et al. (2019) have extended this class of massive DQs to lower temperatures ( K) and showed that these stars have a higher carbon abundance than DQ white dwarfs with normal masses (M M⊙).
PM J081863110 was identified as a white dwarf candidate by Lépine (2005) and Subasavage et al. (2005) due to its colour and large proper motion. Follow-up spectroscopy revealed it to be a cool DZ white dwarf (Subasavage et al., 2008) and Bagnulo & Landstreet (2019) reported PM J081863110 to have a weak magnetic field based on spectropolarimetric measurements. Finally, a parallax measurement of mas obtained by Subasavage et al. (2017) places PM J081863110 within 20 pc of the Sun.
In this paper, we present a photometric, spectroscopic and spectropolarimetric analysis of PM J081863110. Observations of PM J081863110 are presented in Section 2. Our analysis of the atmosphere and magnetic field strength is presented in Section 3 and in Section 4 we revisit the incidence of magnetism in DZ white dwarfs. Finally, we present our conclusions in Section 5.
2 Observations
We first observed PM J081863110 with the FORS1 spectrograph attached to the Very Large Telescope (VLT) of the European Southern Observatory (ESO) at Paranal on UT 2007 October 22. We used the 600 lines mm-1 grism centred at 4650 Å. The slit width was set to 1 arcsec providing a resolution of Å. The observations were conducted in the spectropolarimetric mode where we obtained an exposure of 480 s with the retarder plate rotated to , immediately followed by another exposure of 480 s with the retarder plate rotated to .
These FORS1 spectra revealed PM J081863110 to be a cool DZ with a weak magnetic field. We also obtained two 1200 s observations of PM J081863110 with the R-C spectrograph attached to the 4 m telescope at Cerro Tololo Inter-American Observatory (CTIO) on UT 2008 February 23. We used the KPGL2 (316 lines/mm) grating with the WG360 order blocking filter. We set the slit width to 1.5 arcsec providing a resolution of Å. This spectrum showed the asymmetric Mg i optical line triplet characteristic of cool DZ white dwarfs and appeared as a lower quality replica of the FORS1 spectrum.
Consequently, we obtained a higher resolution spectrum with the X-shooter spectrograph (Vernet et al., 2011) attached to the VLT at ESO. The spectrum was obtained on UT 2017 October 23 with the slit width set to 0.5, 0.9 and 0.6 arcsec with total exposure times of 2975 s, 3040 s and 3060 s for the UVB, VIS and NIR arms, respectively. This set up provided a resolving power of 9700, 8900 and 5600 for the UVB, VIS, and NIR arms, respectively. We removed telluric absorption bands using molecfit recipes (Kausch et al., 2015).
We collected photometric optical measurements from the SkyMapper survey (Onken et al., 2019) and infrared photometric measurements from the Two degree All Sky Survey (2MASS; Skrutskie et al., 2006) and the Wide-field Infrared Survey Explorer (WISE; Cutri et al., 2014). We also obtained astrometric and photometric measurements from Gaia (Gaia Collaboration et al., 2018). Table 1 lists available astrometric and photometric data.
PM J081863110 was observed with the Transiting Exoplanet Survey Satellite ( Ricker et al., 2015) in Sector 7 from 2019 January 1 to February 2. The spectral range of the bandpass is from to Å. Since PM J081863110 (TIC 147018085) was a target of interest, 2 min cadence images were available. We used the pre-search data conditioning simple aperture photometry.
| Parameter | Measurement | Ref. | |||
| RA (J2000) | 08h18m4026 | 1 | |||
| Dec (J2000) | -31°10′203 | 1 | |||
| (″yr-1) | 1 | ||||
| (″yr-1) | 1 | ||||
| (mas) | 1 | ||||
| Photometry | |||||
| Band | Measurement | Ref. | Band | Measurement | Ref. |
| 15.4080.001 | 1 | 15.4320.005 | 2 | ||
| 15.6390.003 | 1 | 15.5150.006 | 2 | ||
| 15.0720.003 | 1 | 14.9160.036 | 3 | ||
| 16.6590.034 | 2 | 14.7280.073 | 3 | ||
| 16.8270.016 | 2 | 14.8290.122 | 3 | ||
| 15.5310.006 | 2 | 14.6800.036 | 4 | ||
| 15.3760.017 | 2 | 15.0140.070 | 4 | ||
3 Analysis
New model atmospheres appropriate for the analysis of low-dispersion (FORS1, R.-C. spec.) and high-dispersion X-shooter spectra have been computed with a mixed H/He composition including a selection of trace elements (C, N, O, Na, Mg, Al, Si, Ca, Cr, Mn, Fe, Ni). The models are in a joint radiative and convective equilibrium adopting the mixing-length convection theory. Although the presence of a magnetic field may inhibit convective motion (Tremblay et al., 2015), Bédard, Bergeron, & Fontaine (2017), Kawka et al. (2019) found that deep convection zones cannot be suppressed in cool white dwarfs such as PM J081863110.
3.1 Models
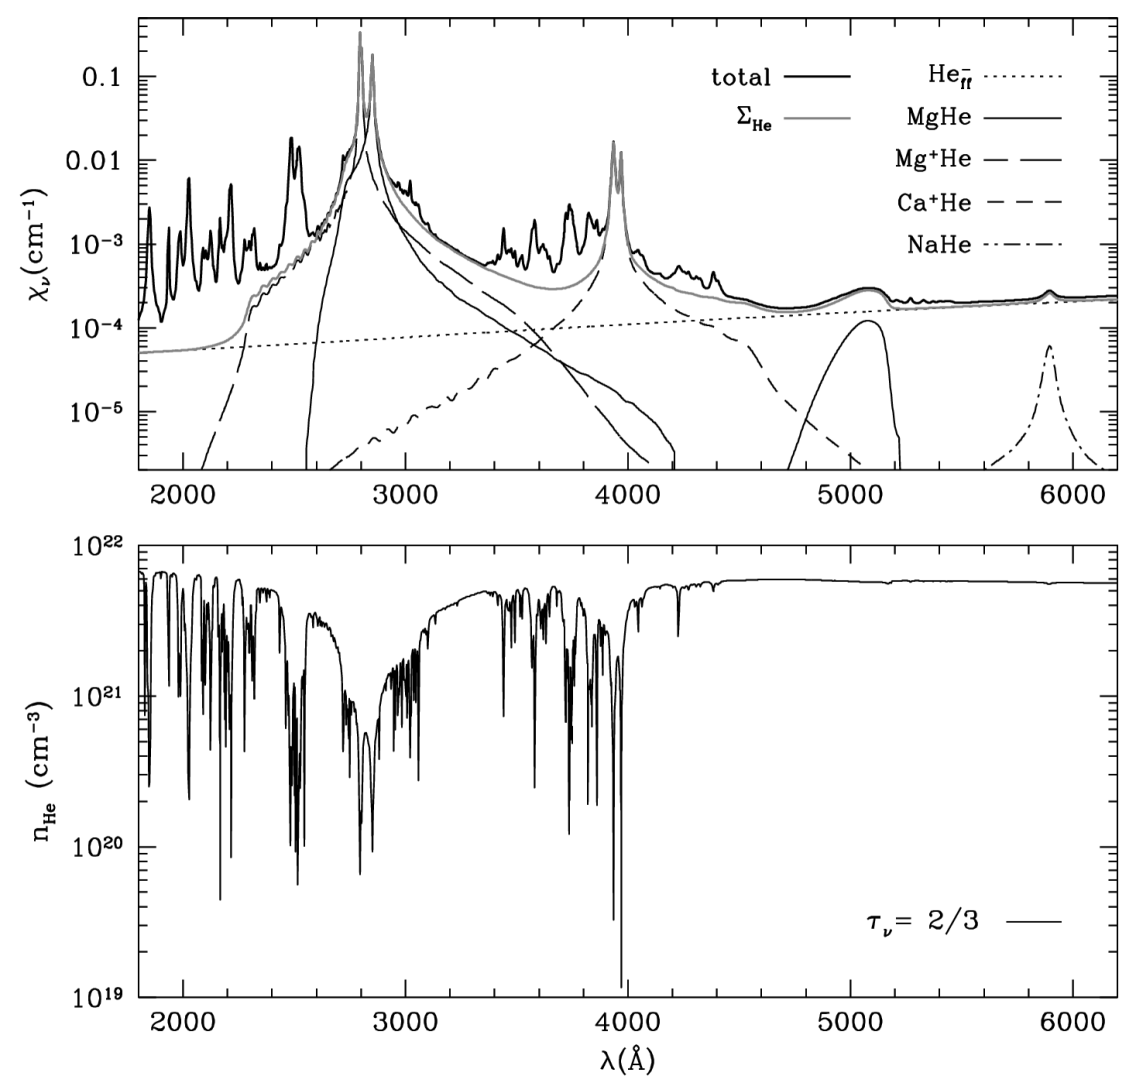
The model atmospheres are converged to a tolerance of 0.1% in the depth-dependant integrated flux. The input parameters are the effective temperature (), surface gravity (), and the chemical composition expressed as the number density relative to helium. The total radiative opacity includes dominant contributions displayed in Fig. 1 (top panel) for a representative model. Line profiles of most spectral lines are described by Voigt functions with the width of the Lorentzian component dominated by neutral helium collisions. However, cool helium-rich white dwarfs require a specific treatment for line broadening, owing to the high helium densities that are involved in their atmospheres (bottom of Fig. 1). New theoretical profiles were very accurately determined in a unified theory of collisional line profiles valid at very high densities using ab initio calculations of potential energy and transition dipole moments. Beyond the symmetrical Lorentzian core at low density, profiles are asymmetrical (see, e.g., for the Mg i triplet, (Allard et al., 2016b) and top of Fig. 1). These calculations are available for dominant spectral lines (see below). For other lines we employ hydrogen line collision parameters from Barklem, Piskunov, & O’Mara (2000) and scaled for helium collisions.
Fig. 1 (bottom panel) also shows the neutral helium density at a monochromatic optical depth , which corresponds to a photon escape probability of 50%, across the optical spectrum for the same model. For example, the Mg i triplet and Na i doublet form at a density cm-3, while the strong CaH&K doublet forms at a range of density from to cm-3.
Details of the line profile calculations that include interactions with neutral helium atoms in dense atmospheres are available for Na-He, Mg-He, Mg+-He, Ca-He, and Ca+-He interactions. The optical Mg i-He 5167, 5173, 5183Å lines show strong asymmetric blue-shifted wing due to the Mg-He interaction (Allard et al., 2016b). We tabulated theoretical line profiles at 6 000 K and helium density at to 22.5 in steps of 0.1 dex. The tables encompass the range of neutral helium density found in the atmosphere of the cool DZ white dwarf PM J081863110. A single, representative temperature was adopted for the line forming region.
The ultraviolet resonance lines Mg ii 2896, 2803 Å (P1/2, P3/2) and Mg i 2852 Å are shaped by Mg+-He and Mg-He interactions, respectively (Allard et al., 2016a, 2018). The line wings extending toward longer wavelengths are clearly detected in the UVB/X-shooter spectrum. We tabulated the Mg ii and the Mg i line cross-sections at neutral helium densities from to 22.0 in steps of 0.2 dex, and at 6 000 K. Lorentzian profiles are adopted at lower densities.
The Ca i 4226Å resonance line is shaped by Ca-He interactions (Blouin et al., 2019). We tabulated the line cross-sections from to 23.0 in steps of 0.1 dex, and at 6 000 K. Lorentzian profiles were adopted at lower densities with a full-width at half-maximum adjusted to match the Ca-He profile at .
The resonance Ca ii H&K shaped by Ca+He interactions (Allard & Alekseev, 2014) were tabulated at , 19.3, 19.6, 19.9, 20.0, 20.3, 20.6, 20.9, 21.0, 21.3, 21.6, 21.9, 22.0, 22.3, and 22.6, covering the range of neutral helium density encountered in the atmosphere of PM J081863110 (Fig. 1).
Finally, the resonance Na i is shaped by Na-He interactions (Allard, 2013). We tabulated the line cross-sections at , to 22.0 in steps of 0.5 dex at a temperature of 6 000 K.
Other lines currently modelled with Lorentzian profiles should eventually be modelled with line profiles including quasi-molecular interactions, e.g., Fe-He, Ni-He, and others.
The negative helium ion opacity (He-) dominates the optical red to infrared spectrum (Fig. 1). The main contributors to the electron density are magnesium and hydrogen (Fig. 2). Lowering of the ionization potential in the high density helium environment contributes to an increase in the electron density. We adopted a simple prescription for the ionization potential of C, Na, Mg, Ca, and Fe as a function of temperature and density described in Blouin (2019).

Individual abundances of light and heavy elements are either measured directly or, in the absence of a detection, they are scaled on iron using abundance ratios measured in chondrite meteorites (Lodders, Palme, & Gail, 2009). Lacking clear detections, Coutu et al. (2019) scaled the abundance of iron () and other elements on the measured calcium abundance () using the chondrite meteorites abundance ratios. The presence of hydrogen may be felt indirectly from its large contribution to the electron density and, consequently, the He- opacity (see Coutu et al., 2019). The broad spectral range covered in our spectra should allow us to measure the effect of hydrogen on the continuum shape. Subasavage et al. (2017) fixed the hydrogen abundance at while Coutu et al. (2019) fixed the abundance at the detection limit of . Other sources of electrons in outer atmospheric layers include elements with low first ionization potential.
A weak field of 92kG was applied to the spectral synthesis (see Section 3.3). At the spectral resolution offered by X-shooter, this effect is apparent in the Ca ii IR triplet.
3.2 Stellar parameters
We first constrained the likely effective temperature and surface gravity with the Gaia distance measurement and the total flux emitted by PM J081863110. We integrated the flux from the ultraviolet to the infrared. In the ultraviolet and visual we used the UVB and VIS X-shooter spectra scaled to the SkyMapper photometric measurements. We extended the flux to the infrared with a model spectrum that is scaled to and photometric measurements. We then calculated the radius using the Gaia distance measurement for a range of effective temperatures. Finally, we used the mass-radius relations for hydrogen-deficient white dwarfs of Camisassa et al. (2017) to determine the corresponding mass and surface gravity. Table 2 lists the parameters that were constrained by the Gaia distance measurement.
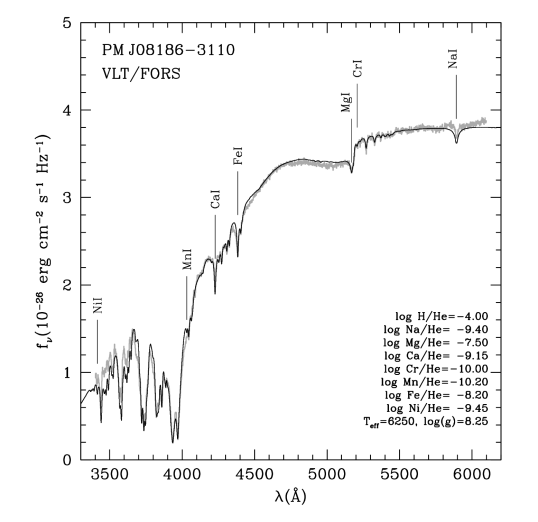
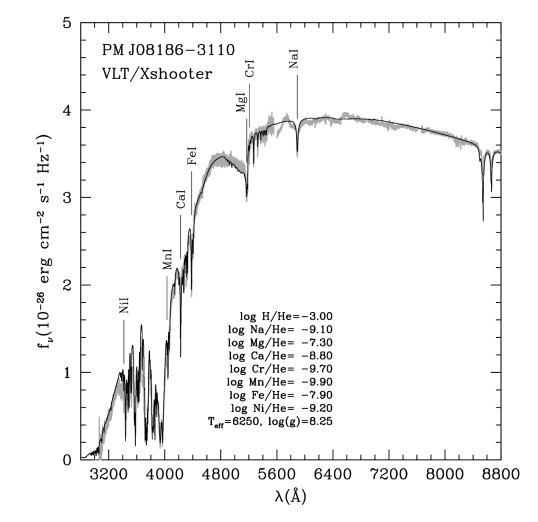
We have fitted both the VLT/FORS1 and VLT/X-shooter spectra to determine the atmospheric parameters. The CTIO/R-C spectrum appeared identical to the FORS1 spectrum and was not analyzed further. Fig. 3 shows the best-fitting model spectra compared to the observed FORS1 and X-shooter spectra and Table 3 summarises the parameters of PM J081863110. We found that the best-fitting model to the VLT/FORS1 and X-shooter spectra correspond to an effective temperature of 6250 K and surface gravity . However, the abundances in the X-shooter spectrum are systematically higher than those measured in the FORS1 spectrum by a factor of two, suggesting that the abundances vary over time. The atmosphere appears enriched in magnesium, and in the FORS1 and X-shooter spectra, respectively, and to a lesser extent calcium, (FORS1) and (X-shooter), relative to other elements. The presence of hydrogen is felt indirectly with a notable downward inflexion of the optical spectrum toward shorter wavelength. The hydrogen abundance measured in the X-shooter spectrum is a factor of ten larger than measured in the FORS1 spectrum. We noted a discrepancy between the best fit calcium abundance and the strength of the Ca ii IR triplet suggesting that Lorentzian profiles are inadequate in this case, and require line profiles inferring both a unified theory of spectral line broadening and accurate ab initio potential energies. The mass and cooling age were calculated using the evolutionary mass-radius relations of Camisassa et al. (2017). Although the mass and radius of Camisassa et al. (2017) and Benvenuto & Althaus (1999) are consistent, the cooling age differs significantly due to additional mechanisms being included in mass-radius relations of Camisassa et al. (2017). We estimate the errors on the temperature and surface gravity at 100 K and dex, respectively. Error bars on abundance measurements stem from the error bars on and are are estimated at 0.2 dex on average. Note that FORS1 and X-shooter abundance measurements vary in concert.
The variable abundances are most likely due to the magnetic field distribution on the white dwarf surface which can result in abundance spots. A variable magnetic field strength across the surface of the white dwarf is supported by changes in the longitudinal magnetic field noted in two spectropolarimetric measurements reported by Bagnulo & Landstreet (2019). Photometric variability will most likely be strongest in the and bands because this is where metal lines are strongest, although due to flux redistribution some variability should be present in the red and infrared spectral range as well. We searched for variability in the available photometric measurements but we did not find any significant variations. Using the 2 min cadence, we measured an upper limit on the semi-amplitude of flux variations of 1.8%. Binning the measurements to a 10 min cadence we reduced the limit on flux variations to 1.2%. The best-fitting model spectra from the FORS1 and X-shooter data predict a 1.4% variation over the bandpass, which is consistent with the measured upper limit. Photometric variability has been detected in several magnetic white dwarfs. Rotating white dwarfs with very strong magnetic fields, magnetic dichroism can explain the photometric observations, e.g., EUVE J0317-85.5 (Vennes et al., 2003). In cool white dwarfs with weak magnetic fields, star spots have been proposed as the likely cause (Brinkworth et al., 2013). The variations in these white dwarfs are a few percent, comparable to our upper limit. Finally, Kilic et al. (2019) showed that the spectroscopic and photometric variations observed in G18335 were caused by a variable magnetic field and a chemically inhomogeneous surface composition rotating on a period of about 4 hr.
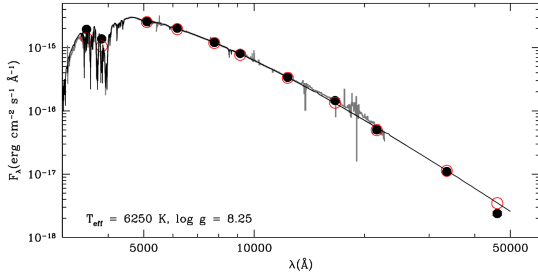
We compared the best-fitting model spectra to the observed photometric measurements. We used the X-shooter best-fitting spectrum to calculate model magnitudes. First we convolved the model spectrum with the SkyMapper (Bessell et al., 2011), 2MASS (Skrutskie et al., 2006) and WISE (Wright et al., 2010) bandpasses and then we calculated absolute magnitudes using the evolutionary mass-radius relations of Benvenuto & Althaus (1999). Fig. 4 shows the observed apparent magnitudes compared to the model magnitudes which were converted from absolute magnitudes to apparent magnitudes using the Gaia distance. The comparison shows that the short wavelength bands, Skymapper and , are systematically above the X-shooter flux level and show evidence of abundance variations.
| (K) | Mass () | Radius () | |
|---|---|---|---|
| 5800 | 8.02 | 0.572 | 0.01230 |
| 5900 | 8.07 | 0.606 | 0.01188 |
| 6000 | 8.13 | 0.639 | 0.01149 |
| 6100 | 8.18 | 0.672 | 0.01112 |
| 6200 | 8.22 | 0.705 | 0.01076 |
| 6300 | 8.27 | 0.736 | 0.01042 |
| 6400 | 8.31 | 0.767 | 0.01010 |
| 6500 | 8.36 | 0.796 | 0.00979 |
Some atmospheric parameters of PM J081863110 were published in the past and the effective temperatures from these studies are systematically higher than what we have obtained, although individual measurements are consistent with our own within 1 error bars. Using low resolution spectroscopy and assuming , Subasavage et al. (2008) measured an effective temperature of K and . A slightly lower effective temperature of K, also assuming , was determined by Giammichele, Bergeron & Dufour (2012) along with . Subasavage et al. (2017) measured a parallax of mas and combined with photometric measurements and low resolution spectra they constrained the parameters of PM J081863110 to K, corresponding to a mass of . They also measured . Using the Gaia parallax, photometry, and low resolution spectroscopy, Coutu et al. (2019) constrained the parameters of PM J081863110 and obtained K, and , corresponding to a mass of . The present analysis is more comprehensive than earlier ones as it benefited from a complete spectral coverage and a detailed abundance analysis.
| Parameter | Measurement | |
|---|---|---|
| FORS | X-shooter | |
| (K) | ||
| (cgs) | ||
| Mass (M⊙) | ||
| Distance (pc) | ||
| Age (Gyr) | 4.2 | |
| (kG) | … | |
| (kG) | … | |
3.3 Magnetic field
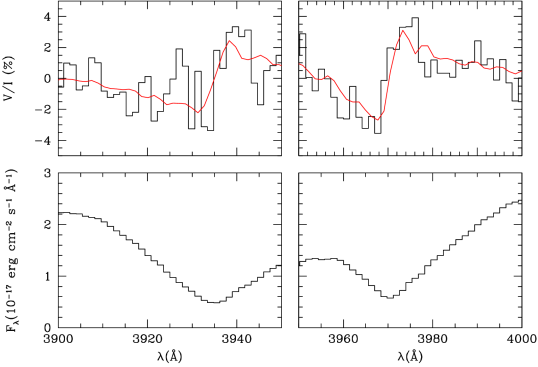
The average surface field strength () can be estimated from the splitted Zeeman components of spectral lines (see Kawka & Vennes, 2011, for details). We used the Ca ii 8542 and 8662 Å lines in the X-shooter spectrum to measure kG. We measured a Barrycentric corrected radial velocity of km s-1. Fig. 5 shows the Zeeman splitted or broadened Ca ii and Ca i lines observed in the X-shooter spectrum. We checked the average surface field strength is consisted with other lines where the Zeeman splitting is less pronounced but we clearly see a broadened core, these include Fe i 4271.76 and Fe i 5269.537 Å.

We calculated the longitudinal magnetic field strength ( in G) using the circularly polarised spectra obtained with FORS1 using
| (1) |
where is the degree of circular polarization, is the total intensity, is the wavelength in Å, and is the flux gradient. Fig. 6 shows the circular polarization and flux spectra of the Ca ii lines with the best fitting spectrum for a longitudinal magnetic field strength of kG. Bagnulo & Landstreet (2019) measured a similar field of kG using the same set of observations. Note that the sign of circular polarization in Bagnulo & Landstreet (2019) is opposite to the sign used in the present paper. The second circular polarization spectrum obtained by Bagnulo & Landstreet (2019) suggests that the magnetic field is variable supporting the likelihood of a varying abundance on the white dwarf surface.
3.4 Kinematics
We calculated the Galactic velocity components from the distance, proper motion and radial velocity of PM J081863110 using Johnson & Soderblom (1987). We corrected for the Solar motion relative to the local standard of rest using () km s-1 (Schönrich, Binney, & Dehnen, 2010). We measured a Barrycentric corrected radial velocity of km s-1 using the X-shooter spectrum. We subtracted a gravitational redshift of km s-1 to obtain a stellar velocity of km s-1. The Galactic velocity components of km s-1 place PM J081863110 in the thick disc (Soubiran, Bienaymé, & Siebert, 2003). We also calculated the Galactic orbit properties using galpy (Bovy, 2015) where we use the MWPotential2014 Galactic potential. The eccentricity and the -component of the angular momentum kpc km s-1 also places PM J081863110 in the thick disc following Pauli et al. (2006).
The age of the Galactic thick disc is about 10 Gyr (Sharma et al., 2019) and therefore the total age of PM J081863110 should be comparable. However, the cooling age of PM J081863110 is 4.2 Gyr and assuming a thick disc metallicity, the mass and lifetime of the progenitor should be about and 600 Myr (Romero, Campos, & Kepler, 2015), respectively. Therefore, assuming single star evolution, the total age of PM J081863110 should be significantly lower than 10 Gyr.
The cooling age was calculated using the evolutionary tracks of Camisassa et al. (2017) for hydrogen-deficient white dwarfs. They show that in cool helium rich white dwarfs the high density atmosphere plays an important role in regulating their cooling rates. Although PM J081863110 is a cool helium-rich star, it is also polluted by heavy elements and the electrons contributed by these elements, in particular iron, help increase the He- opacity and push the atmosphere to shallower depths than found in pure-helium atmospheres. This is also likely to affect the cooling age estimate.
4 Discussion
The number of magnetic, polluted white dwarfs is growing and the incidence of magnetism was found to be higher in cool polluted white dwarfs than in the general white dwarf population. For polluted hydrogen-rich (DAZ) white dwarfs the incidence was found to be as high as 50% for K (Kawka & Vennes, 2014; Kawka et al., 2019). For helium-rich white dwarfs this incidence is % (Hollands, Gänsicke & Koester, 2015; Hollands, 2017).
4.1 Incidence of magnetism
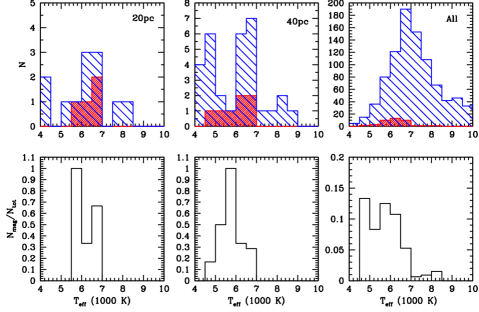
Recently, new magnetic DZ white dwarfs have been discovered in the Solar neighbourhood (e.g., Bagnulo & Landstreet, 2019; Tremblay et al., 2020), and therefore their incidence can be revisited. We have assembled a sample of known DZ white dwarfs using the extensive lists of Coutu et al. (2019) and Hollands (2017). We also included new DZ white dwarfs that lie within 40pc of the Sun (Tremblay et al., 2020). We cross-correlated this sample with the Gaia DR2 catalogue to obtain parallax measurements. These measurements allow us to build volume limited samples.
There are 12 DZ white dwarfs within 20pc of the Sun, and of these 4 are magnetic. Fig. 7 shows that the magnetic DZs are all cooler than 7000 K and the incidence of magnetism for DZs in this temperature range is 40%. Extending the volume to 40pc, a total of 32 DZ white dwarfs are known, out of which 7 are magnetic. Again, they are all below 7000 K, however the incidence of magnetism goes down to 27% ( K). Fig. 7 also plots the incidence of magnetism for all known DZ white dwarfs and it shows that there are few magnetic DZs with a temperature between 7000 and 8500 K. Larger volume limited samples are needed to confirm whether the trend of an increased incidence of magnetism with decreasing temperature is real.
4.2 Abundance evolution
The kinematics of PM J081863110 suggest that it is an old, thick disc star, and if we assumed that the white dwarf atmosphere was polluted through the accretion or merging with a planet or a low mass star, the abundance ratios of elements heavier than helium would depend on the age, hence composition of the parent stellar system. Spina et al. (2016) and Bedell et al. (2018) have shown that the abundance of elements lighter than Fe should be higher in older stars and this should be reflected in the composition of the accreted material onto polluted white dwarfs. Magnesium is enriched in PM J081863110 as compared to iron, chromium and manganese, which is predicted in old stellar systems. However, diffusion alters the observed abundance ratios in white dwarf atmospheres relative to the abundance pattern in the accretion sources. In this regard, Heinonen et al. (2020) have shown that additional mixing criteria may have a significant effect on the diffusion time scales of elements relative to each other. They also show that diffusion coefficients at the bottom of the deep convection zone of helium-rich white dwarfs may require considerable revision which prevents us from reaching firm conclusions on the evolution of abundance ratios as a function of the age of the source material. Moreover, the effect of magnetic field on diffusion time scales remains largely unknown.
5 Conclusions
We have presented a spectroscopic analysis of the cool, He-rich, magnetic white dwarf PM J081863110, showing that it has an atmosphere enriched in magnesium relative to to sodium, calcium, chromium, manganese, iron and nickel. It is not know whether the magnesium dominance is a characteristic of an old, Fe-poor, parent environment, or it occurred later on during the accretion process. A population of Mg-rich polluted white dwarfs has already been identified and is representative of Earth-mantle material (Hollands, Gänsicke & Koester, 2018). The presence of hydrogen in the atmosphere of PM J081863110 suggests that the accreted material, e.g., broken-up asteroids, contained ice. The recent detection of ice/water in the prototypical asteroid Ceres (Raymond et al., 2020) supports this scenario. Signatures of accreted water in white dwarfs were detected in a handful of DZ white dwarfs (Farihi, Gänsicke, & Koester, 2013; Gentile Fusillo et al., 2017). This is the first time an abundance pattern was measured for PM J081863110, with previous spectroscopic analyses resulted in the abundance measurements of calcium, only. We have also shown that the abundance pattern changes between the FORS1 and X-shooter spectra taken 10 yr apart, suggesting that PM J081863110 has abundance spots due to the distribution of the magnetic field on the surface of the white dwarf. These abundance spots will reveal themselves as abundance variations over the rotational period, which could be a few hours, such as was observed in G183-35 (Kilic et al., 2019). This hypothesis is supported by noted variations in the longitudinal field measured with FORS1 spectropolarimetry and, independently, with WHT/ISIS spectropolarimetry (Bagnulo & Landstreet, 2019) . The X-shooter spectrum allowed us to measure a weak surface average field of 92 kG.
The kinematics of PM J081863110 suggests that it belongs to the thick disk, however, when using evolutionary models, the total age of PM J081863110 is significantly lower than the age of thick disc. This could mean that either PM J081863110 is not part of the thick disc but rather an outlier of the old thin disc population, or that additional factors or events could slow down the cooling rate of magnetic DZ white dwarfs. The third possibility could be that PM J081863110 is the result of a merger and therefore its cooling age was reset following the merging event.
We have shown that the incidence of magnetism in cool DZ white dwarfs is very high, similar to the incidence of magnetism in cool DAZ white dwarfs. Both populations are lacking counterparts in their warmer and younger counterparts which suggests that the magnetic field formation and pollution of the atmosphere are linked to an accretion event that happens late in the life of the white dwarf.
Acknowledgements
This study is based on observations made with ESO telescopes at the La Silla Paranal Observatory under programmes 080.D-0521 and 0100.D-0531. We thank Pierre Bergeron for a useful review of the paper.
Data Availability
The data underlying this article are available in the ESO Science Archive at http://archive.eso.org, and can be accessed under programmes 080.D-0521 and 0100.D-0531.
References
- Allard (2013) Allard N. F., 2013, EAS, 63, 403
- Allard & Alekseev (2014) Allard N. F., Alekseev V. A., 2014, AdSpR, 54, 1248
- Allard et al. (2016a) Allard N. F., Guillon G., Alekseev V. A., Kielkopf J. F., 2016a, A&A, 593, A13
- Allard et al. (2016b) Allard N. F., Leininger T., Gadéa F. X., Brousseau-Couture V., Dufour P., 2016b, A&A, 588, A142
- Allard et al. (2018) Allard N. F., Kielkopf J. F., Blouin S., Dufour P., Gadéa F. X., Leininger T., Guillon G., 2018, A&A, 619, A152
- Bagnulo & Landstreet (2019) Bagnulo S., Landstreet J. D., 2019, A&A, 630, A65
- Bagnulo & Landstreet (2020) Bagnulo S., Landstreet J. D., 2020, A&A, arXiv:2010.05795
- Barklem, Piskunov, & O’Mara (2000) Barklem P. S., Piskunov N., O’Mara B. J., 2000, A&AS, 142, 467
- Bedell et al. (2018) Bedell M., Bean J. L., Meléndez J., Spina L., Ramírez I., Asplund M., Alves-Brito A., et al., 2018, ApJ, 865, 68
- Benvenuto & Althaus (1999) Benvenuto O. G., Althaus L. G., 1999, MNRAS, 303, 30
- Bessell et al. (2011) Bessell M., Bloxham G., Schmidt B., Keller S., Tisserand P., Francis P., 2011, PASP, 123, 789
- Bédard, Bergeron, & Fontaine (2017) Bédard A., Bergeron P., Fontaine G., 2017, ApJ, 848, 11
- Blouin (2019) Blouin S. 2019, PhD Thesis, Univ. Montréal
- Blouin et al. (2019) Blouin S., Allard N. F., Leininger T., Gadéa F. X., Dufour P., 2019, ApJ, 875, 137
- Bovy (2015) Bovy J., 2015, ApJS, 216, 29
- Brinkworth et al. (2013) Brinkworth C. S., Burleigh M. R., Lawrie K., Marsh T. R., Knigge C., 2013, ApJ, 773, 47
- Camisassa et al. (2017) Camisassa M. E., Althaus L. G., Rohrmann R. D., García-Berro E., Torres S., Córsico A. H., Wachlin F. C., 2017, ApJ, 839, 11
- Coutu et al. (2019) Coutu S., Dufour P., Bergeron P., Blouin S., Loranger E., Allard N. F., Dunlap B. H., 2019, ApJ, 885, 74
- Cutri et al. (2014) Cutri R. M., et al., 2014, yCat, II/328
- Dufour et al. (2013) Dufour P., Vornanen T., Bergeron P., Fontaine B., 2013, in Krzesinski J., Stachowski G., Moskalik P., Bajan K., eds, ASP Conf. Ser., Vol. 469, 18th European White Dwarf Workshop. Astron. Soc. Pac. San Fransisco, p. 167
- Dunlap & Clemens (2015) Dunlap B. H., Clemens J. C., 2015, in Dufour P., Bergeron P., Fontaine G., eds, ASP Conf. Ser., Vol 493, 19th European White Dwarf Workshop. Astron. Soc. Pac. San Fransisco, p. 547
- Farihi et al. (2011) Farihi J., Dufour P., Napiwotzki R., Koester D., 2011, MNRAS, 413, 2559
- Farihi, Gänsicke, & Koester (2013) Farihi J., Gänsicke B. T., Koester D., 2013, Sci, 342, 218
- Gaia Collaboration et al. (2018) Gaia Collaboration, et al., 2018, A&A, 616, A1
- Giammichele, Bergeron & Dufour (2012) Giammichele N., Bergeron P., Dufour P., 2012, ApJS, 199, 29
- Gentile Fusillo et al. (2017) Gentile Fusillo N. P., Gänsicke B. T., Farihi J., Koester D., Schreiber M. R., Pala A. F., 2017, MNRAS, 468, 971
- Gentile Fusillo et al. (2018) Gentile Fusillo N. P., Tremblay P.-E., Jordan S., Gänsicke B. T., Kalirai J. S., Cummings J., 2018, MNRAS, 473, 3693
- Heinonen et al. (2020) Heinonen R. A., Saumon D., Daligault J., Starrett C. E., Baalrud S. D., Fontaine G., 2020, ApJ, 896, 2
- Hollands (2017) Hollands, M. A. 2017, PhD Thesis, Univ. Warwick
- Hollands, Gänsicke & Koester (2015) Hollands M. A., Gänsicke B. T., Koester D., 2015, MNRAS, 450, 681
- Hollands, Gänsicke & Koester (2018) Hollands M. A., Gänsicke B. T., Koester D., 2018, MNRAS, 477, 93
- Johnson & Soderblom (1987) Johnson D. R. H., Soderblom D. R., 1987, AJ, 93, 864
- Kausch et al. (2015) Kausch W., et al., 2015, A&A, 576, A78
- Kawka & Vennes (2011) Kawka A., Vennes S., 2011, A&A, 532, A7
- Kawka & Vennes (2014) Kawka A., Vennes S., 2014, MNRAS, 439, L90
- Kawka et al. (2019) Kawka A., Vennes S., Ferrario L., Paunzen E., 2019, MNRAS, 482, 5201
- Kawka, Vennes, & Ferrario (2020) Kawka A., Vennes S., Ferrario L., 2020, MNRAS, 491, L40
- Kilic et al. (2019) Kilic M., Rolland B., Bergeron P., Vanderbosch Z., Benni P., Garlitz J., 2019, MNRAS, 489, 3648
- Kissin & Thompson (2015) Kissin Y., Thompson C., 2015, ApJ, 809, 108
- Landstreet et al. (2012) Landstreet J. D., Bagnulo S., Valyavin G. G., Fossati L., Jordan S., Monin D., Wade G. A., 2012, A&A, 545, A30
- Lépine (2005) Lépine S., 2005, AJ, 130, 1247
- Lodders, Palme, & Gail (2009) Lodders K., Palme H., Gail H.-P., 2009, Landolt Bornstein, 4B, 712
- Onken et al. (2019) Onken C. A., et al., 2019, PASA, 36, e033
- Pauli et al. (2006) Pauli E.-M., Napiwotzki R., Heber U., Altmann M., Odenkirchen M., 2006, A&A, 447, 173
- Raymond et al. (2020) Raymond C. A., et al., 2020, NatAs, 4, 741
- Ricker et al. (2015) Ricker G. R., et al., 2015, J. Astron. Telesc. Instrum. Syst., 1, 014003
- Rolland & Bergeron (2015) Rolland B., Bergeron P., 2015, in Dufour P., Bergeron P., Fontaine G., eds, ASP Conf. Ser., Vol 493, 19th European White Dwarf Workshop. Astron. Soc. Pac. San Fransisco, p. 53
- Romero, Campos, & Kepler (2015) Romero A. D., Campos F., Kepler S. O., 2015, MNRAS, 450, 3708
- Schönrich, Binney, & Dehnen (2010) Schönrich R., Binney J., Dehnen W., 2010, MNRAS, 403, 1829
- Sharma et al. (2019) Sharma S., 2019, MNRAS, 490, 5335
- Skrutskie et al. (2006) Skrutskie M. F., et al., 2006, AJ, 131, 1163
- Soubiran, Bienaymé, & Siebert (2003) Soubiran C., Bienaymé O., Siebert A., 2003, A&A, 398, 141
- Spina et al. (2016) Spina L., Meléndez J., Karakas A. I., Ramírez I., Monroe T. R., Asplund M., Yong D., 2016, A&A, 593, A125
- Subasavage et al. (2005) Subasavage J. P., Henry T. J., Hambly N. C., Brown M. A., Jao W.-C., Finch C. T., 2005, AJ, 130, 1658
- Subasavage et al. (2008) Subasavage J. P., Henry T. J., Bergeron P., Dufour P., Hambly N. C., 2008, AJ, 136, 899
- Subasavage et al. (2017) Subasavage J. P., et al., 2017, AJ, 154, 32
- Tremblay et al. (2015) Tremblay P.-E., Fontaine G., Freytag B., Steiner O., Ludwig H.-G., Steffen M., Wedemeyer S., et al., 2015, ApJ, 812, 19
- Tremblay et al. (2020) Tremblay P.-E., et al., 2020, MNRAS, 497, 130
- Vennes et al. (2003) Vennes S., Schmidt G. D., Ferrario L., Christian D. J., Wickramasinghe D. T., Kawka A., 2003, ApJ, 593, 1040
- Vernet et al. (2011) Vernet J., et al., 2011, A&A, 536, A105
- Williams et al. (2016) Williams K. A., Montgomery M. H., Winget D. E., Falcon R. E., Bierwagen M., 2016, ApJ, 817, 27
- Wright et al. (2010) Wright E. L., et al., 2010, AJ, 140, 1868