On the origin and structure of the first sharp diffraction peak of amorphous silicon
Abstract
The structure of the first sharp diffraction peak (FSDP) of amorphous silicon (a-Si) near 2 Å-1 is addressed with particular emphasis on the position, intensity, and width of the diffraction curve. By studying a number of continuous random network (CRN) models of a-Si, it is shown that the position and the intensity of the FSDP are primarily determined by radial atomic correlations in the amorphous network on the length scale of 15 Å. A shell-by-shell analysis of the contribution from different radial shells reveals that key contributions to the FSDP originate from the second and fourth radial shells in the network, which are accompanied by a background contribution from the first shell and small residual corrections from the distant radial shells. The results from numerical calculations are complemented by a phenomenological discussion of the relationship between the peaks in the structure factor in the wavevector space and the reduced pair-correlation function in the real space. An approximate functional relation between the position of the FSDP and the average radial distance of Si atoms in the second radial shell in the network is derived, which is corroborated by numerical calculations.
I Introduction
Professor David Drabold has contributed significantly in the field of amorphous materials. It is therefore an opportune moment to contribute to his Festschrift on a topic which is very close to his heart. The first sharp diffraction peak (FSDP) is a distinct feature of many noncrystalline solids, which are characterized by the presence of a peak in the low wavevector region (1–2 Å-1) of the structure factor of the solids. Although the origin of the FSDP in many multinary glasses is not yet fully understood from an atomistic point of view, it has been shown that the FSDP is primarily associated with the presence of the short-range and medium-range order, which entail voids, chemical ordering, large ring structures, local topology, and atomic correlations between constituent atoms in the amorphous environment of the solids Salmon et al. (2005); D’ Angelo et al. (2010); Elliott (1995); Uhlherr and Elliott (1995); Crupi et al. (2016).
The FSDP is ubiquitous in many disordered condensed-phase systems. Numerous experimental Salmon et al. (2005); D’ Angelo et al. (2010); Bychkov et al. (2005); Uemura et al. (1975); Susman et al. (1988) and theoretical Elliott (1995); Vashishta et al. (1989); Price et al. (1989) studies have reported the (near) universal presence of the FSDP in glasses and liquids/melts. In glasses, the origin of the FSDP can be largely attributed to the presence of layered structures Busse and Nagel (1981), interstitial voids Elliott (1995); Uhlherr and Elliott (1995); Crupi et al. (2016), chemical disorder Uhlherr and Elliott (1995), and large ring structures Susman et al. (1988) in the networks, which constitute a real-space description of atomic correlations on the nanometer length scale. Elliott Elliott (1995) has shown that the FSDP in binary glasses can be interpreted as a prepeak in the concentration-concentration structure factor, which is caused by the presence of the chemical ordering between constituent atoms in the networks. Likewise, the interstitial voids have been found to play an important role in the formation of the FSDP in tetrahedral amorphous semiconductors Uhlherr and Elliott (1995), e.g., a-Si. On the other hand, Susman et al. Susman et al. (1988) have reported that in binary AX2 glasses, the A–A and A–X correlations within the extended ring structures can give rise to the FSDP. Busse and Nagel Busse and Nagel (1981) have suggested that the existence of the FSDP in g-As2Se3 can be ascribed to the inter-layer atomic correlations in the glassy network. Experimental studies on GeSe3 and GeSe5 glasses by Armand et al. Armand et al. (1994) have indicated that the Ge–Ge atomic correlation on the length scale of 6-7 Å is the primary cause of the FSDP, which is supported by molecular-dynamics studies by Vashishta et al. Vashishta et al. (1989).
The behavior of the FSDP in covalent glasses often shows an anomalous dependence with respect to temperature D’ Angelo et al. (2010); Susman et al. (1991a), pressure Susman et al. (1991a); Inamura et al. (1997), and composition Bychkov et al. (2005); Lee and Elliott (1995). Following the well-known Debye-Waller Debye (1913) behavior, one may assume that the peaks in the structure factor should decrease with the increase of the temperature of the system. However, the first (sharp) diffraction peak of many glassy systems has been found to remain either invariant or become more intense and narrower at high temperature D’ Angelo et al. (2010); Inamura et al. (2007). A notable exception is vitreous silica (v-SiO2), which does not follow the behavior stated above. The intensity of the FSDP of v-SiO2 has been observed to decrease with increasing temperature, due to the thermally induced motion of the atoms and the associated diffused scattering DWn , leading to the broadening of the first peak Susman et al. (1991a). Likewise, the position and the width of the FSDP have been observed to vary with the pressure or density of the glasses Inamura et al. (2007, 1997). Neutron diffraction Susman et al. (1991b) and molecular-dynamics studies of densified v-SiO2 Pilla et al. (2003) have indicated that the intensity and the width of the FSDP can change with the density of the samples/models. These changes can be attributed to the frustration induced by the reduction of Si–O–Si bond angles and the changes in the Si–Si and O–O atomic correlations on the length scale of 4–10 Å when the system is densified. A similar conclusion can be made for GeO2 glass, when the glass is densified Sampath et al. (2003). The addition of extrinsic atoms in glassy networks has been also found to affect the first sharp diffraction peak. Lee and Elliott Lee and Elliott (1995) have noted that the inclusion of extrinsic atoms in v-SiO2 can change the chemical ordering of the interstitial voids in the glassy network, which can alter the shape/width of the FSDP.
While the great majority of earlier studies mostly examined the origin and the behavior of the FSDP in borate, chalcogenide, oxide, and silicate glasses Crupi et al. (2016); Lucovsky and Phillips (2010); Gaskell and Wallis (1996); Du and Corrales (2005), there exist only a few studies Elliott (1995); Uhlherr and Elliott (1995, 1994) that address the structure of the FSDP in tetrahedral amorphous semiconductors, such as a-Si and a-Ge. Elliott and coworkers Uhlherr and Elliott (1995, 1994) have addressed the problem at length, but their studies are primarily focused on the origin of the extended-range oscillations (ERO) in a-Si. The results from their studies, which are based on the (Fourier) inversion of experimental structure-factor data of Fortner and Lannin Fortner and Lannin (1989) and highly defective a-Si models of Holender and Morgan Holender and Morgan (1991), suggest that the ERO arise from the preferential propagation of second-neighbor correlations in the network, which in turn can significantly affect the intensity of the FSDP up to a radial length scale of 20 Å. However, no systematic analysis of the results with respect to the size of models is provided and, thus, in the absence of direct numerical evidence, it is not clear to what extent the intensity of the FSDP is truly affected by atomic correlations originating from radial distances beyond 15 Å.
The key purpose of this paper is to provide a systematic study of the structure of the FSDP, with an emphasis on the position, intensity, and width of the peak, with the size of the models. In addition, the origin of the FSDP in a-Si is addressed by obtaining a quantitative estimate of the contribution of atomic pair correlations from different radial shells and their effect on the intensity and position of the FSDP. The relationship between the peaks in the structure factor and its real-space counterpart, the reduced pair-correlation function, is addressed, and an approximate functional relation between the position of the FSDP in a-Si and the radial distance of the atoms in the second radial shell of the amorphous network is obtained. Throughout this paper, we shall use the term FSDP to refer to the first peak of the structure factor of a-Si at = 1.9–2 Å-1 in discussing our results. Likewise, the term principal peak will be used to indicate the second peak at = 3.6 Å-1. For amorphous silicon, this terminology has been used previously by others Uhlherr and Elliott (1995, 1994), and it is consistent with the fact that the peak at is indeed the first peak of and that it is reasonably sharp and strong with a value of the intensity , which is about 67% of the intensity of the principal peak. A further justification of the use of the terminology will be evident later from our discussion of the results in section IIIA.
The rest of the paper is planned as follows. Section II provides a brief description of the simulation method for producing atomistic models of a-Si via the modified Wooten-Winer-Weaire (WWW) Wooten et al. (1985); Barkema and Mousseau (2000) method, the calculation of the radial pair-correlation function, and the structure factor for these models. This is followed by results and discussion in section III, with an emphasis on the origin and the structure of the FSDP. The conclusions of this study are presented in section IV.
II Models and Methods
For the purpose of generating atomistic models of a-Si, we have employed the well-known WWW method. The details of the method can be found in Refs. Wooten et al. (1985); Barkema and Mousseau (2000). Here, we have used the modified version of the method, developed by Barkema and Mousseau (BM) Barkema and Mousseau (2000). In the modified WWW approach, one starts with a random configuration that consists of atoms in a cubic supercell of length . The volume of the supercell is chosen in such a way that the mass density of the model corresponds to about 2.28 g.cm-3, as observed in a-Si samples produced in laboratories Xie et al. (2013); Laaziri et al. (1999). Initially, following the BM ansatz, the nearest neighbors of each atom are so assigned that a tetravalent network is formed BMn . This is achieved by choosing a suitable nearest-neighbor cutoff distance, up to 3 Å, between Si atoms. The resulting tetravalent network is then used as the starting point of the WWW bond-switching algorithm. New configurations are generated by introducing a series of WWW bond switches, which largely preserve the tetravalent coordination of the network and the energy of the system is minimized using Monte Carlo (MC) simulations. The acceptance or rejection of a proposed MC move is determined via the Metropolis algorithm Metropolis et al. (1953) at a given temperature. Here, the energy difference between two configurations is calculated locally by using the Keating potential Keating (1966), which employs an atomic-index-based nearest-neighbor list of the tetravalent network during MC simulations. In addition, the total energy of the entire system is relaxed from time to time using the Stillinger-Weber potential Stillinger and Weber (1985). Finally, the configurations obtained from the modified WWW method were relaxed using the first-principles density-functional code Siesta Soler et al. (2002). For the models with 216 atoms to 3000 atoms, a full self-consistent-field calculation, using the generalized-gradient approximation (GGA) Perdew et al. (1996) and a set of double-zeta basis functions, was carried out. The remaining models of size from 4096 atoms to 6000 atoms were treated using the non-self-consistent Harris-functional approach Harris (1985) with a single-zeta basis set in the local density approximation (LDA) Perdew and Zunger (1981). To conduct configurational averaging of simulated data, we have generated 10 models for each size starting with different random configurations using independent runs.
Once the atomistic models are generated, the calculation of the structure factor proceeds by computing the reduced pair-correlation function. The latter is defined as , where and are the pair-correlation function and the average number density of a model, respectively. Assuming that the distribution of the atoms in a disordered network is isotropic and homogeneous, the structure factor, , can be written as,
| (1) | |||||
where is the length of the half of the cubic simulation cell. The conventional periodic boundary conditions are used to minimize surface effects and to calculate the pair-correlation function in Eq. (1).
III Results and Discussion
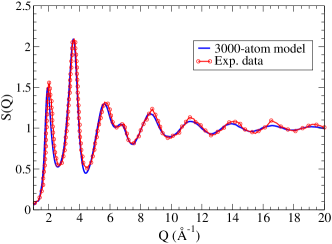
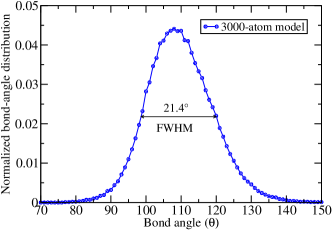
Equation (1) suggests that the shape of the FSDP can be fully determined via the Fourier (sine) transformation of the reduced pair-correlation function , provided that as . Since the shape of the FSDP is primarily determined by the structure factor in the vicinity of 2 Å-1, it is apparent that one requires sufficiently large models of a-Si, in order to satisfy the condition above, for an accurate determination of the FSDP. To this end, we first validate the structural models of a-Si, obtained from the modified WWW method. Since the latter is a well-established method, we restrict ourselves to the pair-correlation function (PCF), the bond-angle distribution (BD), and the coordination number (CN) of Si atoms in the network. It has been shown elsewhere Limbu et al. (2020) that the knowledge of the PCF, the BD, and the CN of the atoms are sufficient to establish whether a structural model can produce the correct electronic and vibrational properties of a-Si or not. The full structure factor and the normalized bond-angle distribution, obtained from a set of 3000-atom models of a-Si, are plotted in Figs. 1 and 2, respectively. For the purpose of configurational averaging, the results were averaged over 10 independent models of an identical size. The simulated values of in Fig. 1 can be seen to agree well with the corresponding experimental data reported in Ref. Laaziri et al. (1999). Likewise, the full width at half maximum (FWHM) of the bond-angle distribution in Fig. 2, about 21.4∘, matches with the observed value of 18∘–24∘ obtained from the Raman “optic peak” measurements Beeman et al. (1985). The FWHM of the bond-angle distribution for the WWW models is also found to be consistent with those obtained from high-quality molecular-dynamics simulations Atta-Fynn and Biswas (2018); Deringer et al. (2018), and data-driven information-based approaches Limbu et al. (2020, 2018), developed in recent years. A further characterization of the models is possible by examining the statistics of the CN of Si atoms, the dihedral-angle distribution, and the presence of various irreducible rings in the amorphous structures. However, since the WWW models have been extensively studied and validated in the literature, we will not linger over the validation issue and get back to the central topic of this paper by listing the coordination-number statistics of the atoms and some key structural properties of the WWW models in Table 1. The corresponding results for the DFT-relaxed models are provided in Table 2.
| Size | Bond angle & width | Coordination number | Bond length | |||
|---|---|---|---|---|---|---|
| 216 | 109.25 | 9.11 | 100 | 0 | 0 | 2.35 |
| 300 | 109.25 | 9.32 | 100 | 0 | 0 | 2.35 |
| 512 | 109.26 | 9.41 | 100 | 0 | 0 | 2.35 |
| 1000 | 109.27 | 9.16 | 100 | 0 | 0 | 2.35 |
| 2000 | 109.27 | 9.31 | 99.95 | 0 | 0.05 | 2.35 |
| 3000 | 109.26 | 9.39 | 99.94 | 0 | 0.06 | 2.35 |
| 4096 | 109.26 | 9.26 | 99.95 | 0 | 0.05 | 2.35 |
| 5000 | 109.27 | 9.31 | 99.97 | 0 | 0.03 | 2.35 |
| 6000 | 109.26 | 9.39 | 99.96 | 0 | 0.04 | 2.35 |
| Model size | Bond angle & width | Coordination number | Bond length | |||
|---|---|---|---|---|---|---|
| 216 | 109.11 | 10.14 | 100 | 0 | 0 | 2.36 |
| 300 | 109.15 | 10.22 | 100 | 0 | 0 | 2.36 |
| 512 | 109.13 | 10.45 | 100 | 0 | 0 | 2.36 |
| 1000 | 109.15 | 10.14 | 100 | 0 | 0 | 2.36 |
| 2000 | 109.14 | 10.3 | 99.95 | 0 | 0.05 | 2.36 |
| 3000 | 109.13 | 10.4 | 99.96 | 0.01 | 0.03 | 2.36 |
| 4096∗ | 109.02 | 10.82 | 99.95 | 0.01 | 0.04 | 2.37 |
| 5000∗ | 109.01 | 10.9 | 99.94 | 0.01 | 0.05 | 2.37 |
| 6000∗ | 109.51 | 10.92 | 99.95 | 0.01 | 0.04 | 2.37 |
III.1 Characterization, origin, and the structure of the FSDP in amorphous silicon
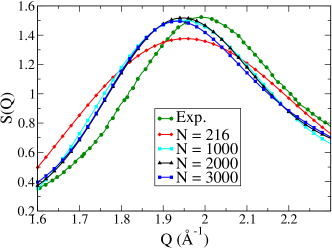
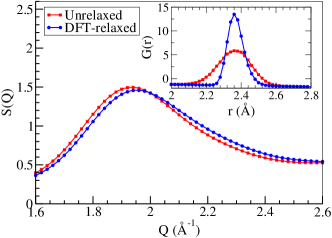
Figure 3 shows the structure factor of a-Si obtained from four different models, of size from 216 atoms to 3000 atoms, and experiments Xie et al. (2013). As before, the simulation data are obtained by averaging over 10 independent models for each size, whereas the experimental data refer to as-implanted samples of a-Si in Ref. Xie et al. (2013). An examination of Fig. 3 leads to the following observations. Firstly, it is apparent that the 216-atom model shows a marked deviation from the experimental data near the FSDP, indicating noticeable finite-size effects originated from small models of linear size of about 16 Å. By contrast, the larger models, consisting of 1000 to 3000 atoms, have produced the peak intensity more accurately. Secondly, all the models consistently underestimate the position of the experimental FSDP Xie et al. (2013) at =1.99 Å-1, by an amount of 0.045 Å-1. One can surmise a number of possible reasons for this discrepancy. These include the inadequacy of the classical potentials, the uncertainty of the actual density of the a-Si sample(s) used in experiments, and a possible sample-to-sample dependence of the experimental results. The last point can be appreciated by noting that the experimental value of , for as-implanted samples of a-Si, reported in Refs. Fortner and Lannin (1989), Xie et al. (2013), and Laaziri et al. (1999) differ from each other by about 0.07 Å-1 (see Fig. 9). Finally, a first-principles total-energy relaxation of the models, using the density-functional code Siesta Soler et al. (2002), somewhat remedies this issue at the expense of the reduction of the peak intensity. This is illustrated in Fig. 4, where we have plotted both the reduced pair-correlation function (see inset) and the configurational-average structure factor from ten 3000-atom models before and after total-energy relaxation. The increase of the peak height of upon relaxation is not surprising in view of the fact that first-principles relaxations minimized the total energy of the system by reducing the bond-length disorder at the expense of a minor increase of the bond-angle disorder. The latter is reflected in the root-mean-square (RMS) width, , of the bond-angle distribution before and after relaxation in Tables 1 and 2, respectively. By contrast, the shape of the structure factor near the FSDP remains more or less the same after relaxation, except for a small shift of the FSDP toward the higher values of .
Having addressed the overall shape of the structure factor and the FSDP for a number of models of varying sizes, we now examine the origin of the FSDP in terms of the real-space structure of a-Si networks. While it is well-understood that the FSDP in a-Si arises from the medium-range order in the network, which entails a length scale of a few to several angstroms, a quantitative characterization of the contribution from different radial shells is still missing in the literature. We address this aspect of the problem by examining the role of radial atomic correlations in forming the FSDP, via the Fourier transform of the reduced PCF, and provide a quantitative measure of the contributions that originate from the increasingly distant radial shells in the amorphous environment of silicon. This can be achieved by writing,
where,
| (2) |
In Eq. (2), is the contribution to from the reduced PCF, , at distances between and . The contribution from a given radial shell can be obtained by a suitable choice of and , where , and an appropriate set {} covers the entire radial (integration) range to obtain the full . For example, a choice of = 0 Å and = 2.8 Å yields , and = 2.8 Å and = 4.9 Å provides . The origin of the FSDP and the principal peak can be studied by computing various in the vicinity of 2 Å-1 and 3.6 Å-1, respectively. The appropriate values of for different radial shells can be obtained by inspecting the reduced PCF of a-Si. This is illustrated in Fig. 5, by plotting the configurational-average obtained from a set of ten 3000-atom models. We should emphasize that the radial shells correspond to the radial regions between two neighboring minima in the reduced PCF. Except for the first radial shell, the radial regions, defined by a pair of consecutive minima in , are not necessarily identical to the corresponding atomic-coordination shells due to the overlap of the atomic distribution from different coordination shells.
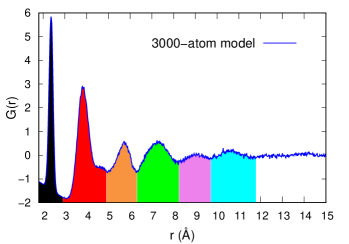
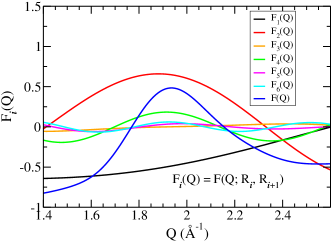
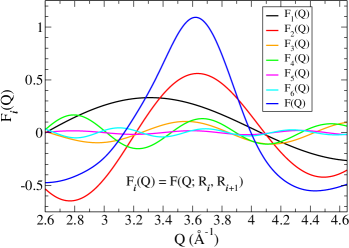
Figure 6 shows the contribution to in the vicinity of 2 Å-1 from the first six radial shells. The plots for different radial shells are indicated by the corresponding shell color as depicted in Fig. 5. It is evident that the chief contribution to the FSDP comes from , which is followed by and in the descending order of magnitude. and play a crucial role in determining both the intensity and the position of the FSDP, while and contribute very little to none. By contrast, monotonically changes in the vicinity of the FSDP and thus contributes to the intensity (and the shape) of the FSDP near to some degree but does not play any noticeable role in determining the position of . It is therefore apparent that the position of the FSDP in a-Si is primarily determined by the information from the second radial shell, followed by the fourth and sixth radial shells, whereas the rest of the distant radial shells provide small perturbative corrections. The enumeration of the radial shell-by-shell contribution to is a significant result to our knowledge, which cannot be quantified from a phenomenological understanding of the Fourier transform of in Eq. (1). A similar analysis reveals that the contribution to the principal peak at 3.6 Å-1 mostly arises from , , , and , in the decreasing order of magnitude. Once again, is found to provide a positive but monotonically decreasing contribution with increasing in the vicinity of the principal peak. Thus, the peak at 3.6 Å-1 is principally contributed by the first four radial shells in the reduced PCF. This observation amply justifies the use of the term ‘principal peak’ to describe the peak at 3.6 Å-1 in the structure factor of a-Si. Figure 7 shows the results for the principal peak using the same color code as in Fig. 5.
III.2 Relation between peaks in S(Q) and G(r)
The results presented in the preceding section on the basis of the partitioning of reveal that the information from the second and fourth radial shells largely determine the structure, i.e., the position, intensity, and width, of the FSDP in a-Si. We now provide a physical interpretation of the numerical results and demonstrate that the emergence of the first two peaks in , near 2 Å-1 and 3.6 Å-1, respectively, can be deduced simply from the knowledge of the reduced PCF and the behavior of the integral, involving the sinc(x) (i.e., ) function, which defines the structure factor. Noting that the structure factor can be written as,
| (3) | |||||
it is elementary that the peaks in (and hence ) should appear approximately for those values of for which both and are maximum. Here, the values in are given by the maxima of . Since the maxima of and are very close to each other sin for , and the maxima of and practically coincide, one may use the maxima of and in determining the approximate location of the first two peaks in . This implies must satisfy, = 1, or , where =0, 1, 2, …etc. Since the first two maxima of are given by 2.35 Å and 3.8 Å, respectively, and = 0 does not admit a physical solution sin , the first major contribution to the comes from the second radial shell for = 3.8 Å and . This gives, = 2.07 Å-1. Likewise, the next contribution comes from, for , the fourth radial shell with a peak at 7.24 Å in . This yields, = 1.95 Å-1. A similar analysis shows that the principal peak () gets its share from the first radial shell, for , at = 3.34 Å-1, which is followed by the second radial shell, for , at = 3.72 Å-1, the fourth radial shell, for , at = 3.69 Å-1, and the third radial shell, for and , at = 3.57 Å-1. The exact position of a peak in is determined by the sum of the contribution from the relevant radial shells, which introduce a minor deviation from the individual estimate above due to the approximate nature of our calculations. Table 3 presents a summary of the results obtained from the reasoning above. The estimated position of the peaks in , for =1 to 6, is listed in the Table. The first column, shown in light gray shading, corresponds to the maxima () of up to a radial distance of 11 Å, whereas the second row, indicated by dark gray cells, lists the values of for =1 to 6. The remaining six rows, between columns 1 and 8, indicate the peak positions in that are obtained by dividing the values by the corresponding value from the first column. The estimated positions of the FSDP and the principal peak for a number of combination of are shown in Table 3 by green and red colors, respectively.
Conversely, assuming that the FSDP is located at 2 Å-1, one arrives at the conclusion, by dint of our logic, that the contribution to the FSDP should come from , and , etc., for = 0 to 3. The first value of , for = 0, does not provide a physical solution but the remaining values at 3.93 Å, 7.07 Å, and 10.21 Å approximately correspond to the second peak, the fourth peak, and the sixth peak of (cf. Fig. 5). A similar analysis can be done for the principal peak. The argument presented here suffices to explain why the information from the distant radial shells, for Å, cannot contribute significantly in the formation of the FSDP. At large radial distances, when the reduced PCF rapidly vanishes and the concomitant numerical noises in become increasingly stronger, cannot find, or sample, suitable values of with a large , for values near the FSDP, to satisfy the condition above. This leads to small for the distant radial shells. We have verified that the analysis presented here is consistent with the results from numerical calculations of .
| Maxima | 1 | 2 | 3 | 4 | 5 | 6 | |
|---|---|---|---|---|---|---|---|
| of | 7.854 | 14.137 | 20.42 | 26.704 | 32.987 | 39.27 | |
| 2.35 | 3.34 | 6.02 | 8.69 | 11.36 | 14.04 | 16.71 | Peaks in |
| 3.8 | 2.07 | 3.72 | 5.37 | 7.03 | 8.68 | 10.33 | Peaks in |
| 5.72 | 1.37 | 2.47 | 3.57 | 4.67 | 5.77 | 6.87 | Peaks in |
| 7.24 | 1.08 | 1.95 | 2.82 | 3.69 | 4.56 | 5.42 | Peaks in |
| 9.16 | 0.86 | 1.54 | 2.23 | 2.92 | 3.6 | 4.29 | Peaks in |
| 10.74 | 0.73 | 1.32 | 1.9 | 2.49 | 3.07 | 3.66 | Peaks in |
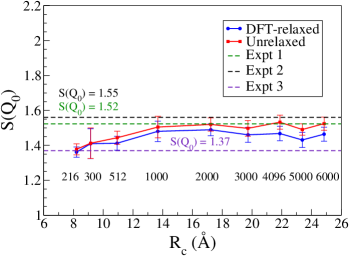
The results and discussion presented so far indicate that the radial information from the reduced PCF of up to a length scale of 15 Å plays a significant role in the formation of the FSDP. To further establish this point, we now conduct a systematic study of the structure of the FSDP in terms of the intensity and the width of the peak. The variation of the peak intensity with the size of the models is studied by plotting the value of against for a number of DFT-relaxed/unrelaxed models, consisting of 216 atoms to 6000 atoms. Since is given by the half of the linear size of the models, Fig. 8 essentially shows the dependence of on the radial pair correlations up to a distance of , through the Fourier transform of . It is clear from the plots (in Fig. 8) that the intensity of the FSDP for both the relaxed and unrelaxed models varies considerably until increases to a value of the order of 14 Å. This roughly translates into a model of size about 1000 atoms. For even larger values of , the peak intensity is more or less converged to 1.48 for the unrelaxed models but considerable deviations exist for the value of DFT-relaxed models from the experimental value of of 1.52 in Ref. Xie et al. (2013). The deviation of the peak intensity from the experimental value for small models of a-Si can be readily understood. Since carries considerable real-space information up to a radial distance of 15 Å, possibly 20 Å for very large models, small models with values less than 15 Å cannot accurately produce the peak position using Eq. (1). On the other hand, the peak intensity for the DFT-relaxed models deviates noticeably (about 0.2–12%) from their unrelaxed counterpart and the experimental value for as-implanted samples in Refs. Xie et al. (2013), Fortner and Lannin (1989), and Laaziri et al. (1999). This apparent deviation for the bigger models is not particularly unusual and it can be attributed, at least partly, to: 1) the use of approximate total-energy calculations in the relaxation of large models, via the non-self-consistent Harris-functional approach using minimal single-zeta basis functions; 2) the intrinsic difficulties associated with quantum-mechanical relaxations of large models; and 3) the sample dependence of experimental results, showing a considerable difference in the value of for as-implanted samples in Fig. 8, which is as high as 0.18 from one experiment to another. Thus, the results obtained in this study are well within the range of the experimental values reported in the literature Fortner and Lannin (1989); Xie et al. (2013); Laaziri et al. (1999).
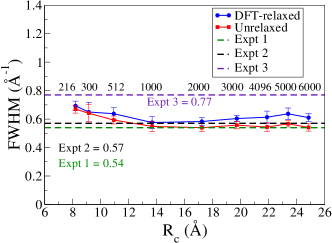
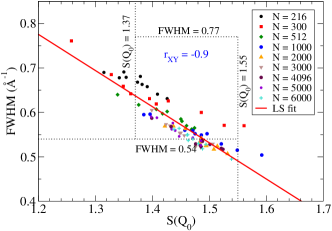
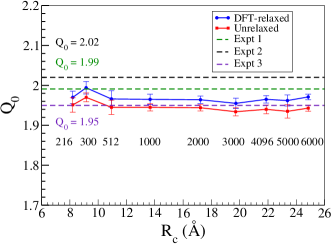
The full width at half maximum, or FWHM, of the FSDP for different models is plotted against in Fig. 9. A somewhat high value of the FWHM for the large DFT-relaxed models is a consequence of the reduction of the peak intensity. As the intensity of the peak reduces, the FWHM increases slightly due to the widening of the diffraction plot away from the peak. An inspection of Figs. 8 and 9 appears to suggest that the values of FWHM and are somewhat correlated with each other. In particular, amorphous-silicon models exhibiting smaller values of (in Fig. 8) tend to produce somewhat larger values of FWHM in Fig 9, irrespective of the size of the models and DFT relaxation. This is apparent in Fig. 10, where FWHM and values for all configurations and sizes are presented in the form of a scattered plot. A simple analysis of FWHM and data by computing the Pearson correlation coefficient, , confirms the suggestion that FWHM and values are indeed linearly correlated with each other and have a correlation coefficient of . The linear least-square (LS) fit of the data are also shown in Fig. 10 by a solid (red) line. The great majority of the FWHM and values in Fig. 10 can be seen to have clustered along the straight line within a rectangular region bounded by the experimental values of FWHM and , from 0.54 to 0.77 Å-1 and 1.37 to 1.55, respectively. Likewise, the dependence of the position of the FSDP with for the unrelaxed and DFT-relaxed models is illustrated in Fig.11. For the unrelaxed models, is observed to converge near 1.96 Å-1, whereas the corresponding value for the DFT-relaxed models hovers around 1.97 Å. In both the cases, is within the range of the experimental values, from 1.95 Å-1 to 2.02 Å-1, shown in Fig. 11.
In summary, a systematic study of a-Si models, consisting of 216 to 6000 atoms, firmly establishes that the structure of the FSDP in a-Si is mostly determined by radial pair correlations up to a distance of 15 Å, as far as the size of the largest models employed in this study is concerned. Further, the major contribution to the FSDP arises from the second and fourth radial shells, along with small residual contributions from the distant radial shells at a distance of up to 15 Å.
III.3 The FSDP and the radial shell structures of a-Si
Earlier, in sections IIIB and IIIC, we have demonstrated that the position of the FSDP, , is primarily determined by and, to a lesser extent, . This leads to a possibility of the existence of a simple functional relationship between and a suitable length scale in the real space involving the radial atomic correlations in the network. In this section, we will show that an approximate relationship between and the average radial distance, , of the atoms in the second (radial) shell does exist. Below, we first provide a rationale behind the origin of this relationship, which is subsequently corroborated by results from direct numerical calculations.
The first hint that an approximate relationship may exist follows from the behavior of with the (mass) density, , of the models. In Fig. 12, we have plotted the variation of against for a-Si. For this purpose, the density of a set of 3000-atom models is varied, within the range from 2.12 g.cm-3 to 2.32 g.cm-3, by scaling the length of the cubic simulation cell and the position of the atoms therein. This involves a tacit assumption that for a small variation of the density, by about 5%, the atomistic structure of the network would remain unchanged and that a simple scaling approach should suffice to generate low/high-density models. Given that the WWW models of a-Si do not include any extended defects and voids in the network, the scaling assumption is reasonably correct and suitable to produce models with a small variation of the density. Figure 12 presents the results from our calculations, which show a linear relationship between and the density, , of the models. This linear variation of with is not particularly unique to a-Si; a similar behavior has been observed experimentally by Inamura et al. Inamura et al. (1997, 2007) for densified silica.
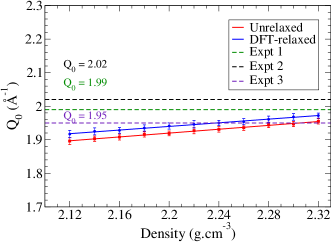
The results from Fig. 12 and the experimental data from Refs. Inamura et al. (1997) and Inamura et al. (2007) suggest that can vary approximately linearly with the average density, , of the models/samples. Since is inversely proportional to the cubic power of the simulation cell size () for a given number of atoms, also varies as when the density is varied by rescaling the volume. Thus, for homogeneous and isotropic models with no significant variation of the local density, which the WWW models satisfy in the absence of extended defects and voids, it is reasonable to assume that , where is the distance between any two atoms in the network, at sites and , of average density . In view of our earlier observation that the position of the FSDP is largely determined by (see Fig. 6), one may posit that values between and in mostly affect the peak position at . These considerations lead to the suggestion that by substituting by its average value of for the atoms in the second radial shell, should remain constant, on average, upon density variations via volume rescaling. Likewise, one can invoke the same reasoning and may expect should be also constant but only approximately, due to the limited role and contribution of the atoms in the fourth radial shell in determining the position of .
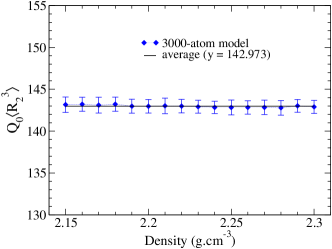
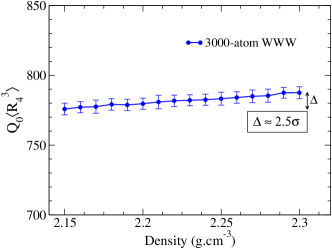
The efficacy of our argument can be verified by results from direct numerical calculations. A plot of (and ) versus the average density in Fig. 13 (and Fig. 14) indeed confirms our prediction. It may be noted that the observed (absolute) deviation, , of values in the density range 2.15–2.3 g.cm-3 in Fig. 13 is of the order of , where is the (largest) standard deviation obtained by averaging results from 10 independent models for each density. By contrast, the corresponding deviation for in Fig. 14 is found to be more than two standard deviation, as indicated in the plot. The large deviation of values is not unexpected in view of the small contribution of (to the FSDP) that originates from the fourth radial shell. Thus, the results from Fig. 13 lead to the conclusion that is approximately proportional to the inverse of the average cubic power of the radial distance, , of the atoms in the second radial shell in a-Si. It goes without saying that the use of , instead of , does not change the conclusion of our work, as the difference between these two values is found to be about 1.92–2.1 Å3, for the mass density in the range of 2.15 to 2.3 g.cm-3, which simply shifts the plot (in Fig. 13) vertically downward by a constant amount.
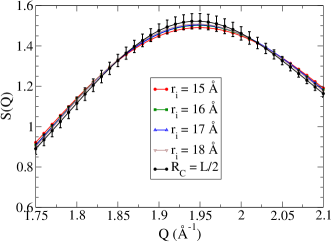
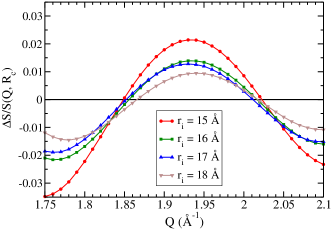
We end this section by making a comment on the possible role of distant radial atomic correlations, or extended-range oscillations (ERO), in on the FSDP, based on our preliminary results from 6000-atom models. Although the presence of ERO in ultra-large models of a-Si beyond 15 Å is an undisputed fact Uhlherr and Elliott (1994), a direct determination of the effect of the ERO on the FSDP in a-Si is highly nontrivial due to the presence of intrinsic noises in at large radial distances. Numerical calculations using 6000-atom models of a-Si indicate that only a minute fraction of the total intensity of the FSDP results from the radial region beyond 15 Å. These calculations do not include any possible artifacts that may arise from the noises in at large distances. The observed deviation in the peak intensity, due to the truncation of the radial distance at 15 Å and at higher values, is found to be about 1–2%, which is less than one standard deviation () associated with , obtained from using the maximal radial cutoff distance , as far as the results from 6000-atom models are concerned. Figure 15 shows the variation of the intensity near the FSDP for five different cutoff values from 15 Å to 18 Å and 24.85 Å. It is apparent that the changes in near are very small as the radial cutoff value increases from 15 Å to 18 Å. These small changes in the intensity values are readily reflected in Fig. 16, where the fractional errors, with respect to , associated with the calculation of are plotted against for = 15 Å to 18 Å. Thus, as far as the present study and the maximum size of the models are concerned, the ERO do not appear to contribute much to the FSDP. However, an accurate study of the ERO in a-Si would require high-quality ultra-large models, consisting of several tens of thousands of atoms, and a suitable prescription to handle noises in at large distances. These and some related issues concerning the origin of the ERO in a-Si and their possible role in will be addressed in a future communication.
IV Conclusions
In this paper, we have studied the origin and structure of the FSDP of a-Si with an emphasis on the position, intensity, and width of the diffraction peak. The study leads to the following results: 1) By partitioning the contribution of the reduced PCF to the FSDP, which originates from the Fourier transform of radial atomic correlations in the real space, a quantitative measure of the contribution to the FSDP from different radial shells is obtained. The results show that the position of the FSDP in a-Si is principally determined by atomic pair correlations in the second, fourth, and sixth radial shells, in the descending order of importance, supplemented by small residual contributions from beyond the sixth radial shell; 2) A convergence study of the position, intensity, and width of the FSDP, using a set of models of size from 216 to 6000 atoms, suggests that the minimum size of the models must be at least 1000 atoms or more in order for the results to be free from finite-size effects. This approximately translates into a radial length of 14 Å, which is consistent with the results obtained from the radial-shell analysis of the reduced PCF; 3) A theoretical basis for the results obtained from numerical calculations is presented by examining the relationship between the peaks in the structure factor and the reduced PCF. Contrary to the common assumption that the peaks in the structure factor and the reduced PCF are not directly related to each other, we have shown explicitly that the knowledge of the reduced PCF alone is sufficient not only to determine the approximate position of the FSDP and the principal peak but also the relevant radial regions that are primarily responsible for the emergence of these peaks in the structure factor, and vice versa; 4) The study leads to an approximate relation between the position of the FSDP and the average radial distance of the atoms in the second radial shell of a-Si networks. For homogeneous and isotropic models of a-Si with no significant variation of the local density, it has been shown that the position of the FSDP is inversely proportional to the cubic power of the average radial distance of the atoms in the second radial shell. The result is justified by providing a phenomenological explanation – based on experimental and computational studies of the variation of the FSDP with the average density of a-Si samples and models – which is subsequently confirmed by direct numerical calculations for a range of density from 2.15 to 2.3 g.cm-3.
Acknowledgements
The work was partially supported by the U.S. National Science Foundation (NSF) under Grant No. DMR 1833035. One of us (P.B.) thanks Profs. Gerard Barkema (Utrecht, The Netherlands) and Normand Mousseau (Montreal, Canada) for providing their modified WWW code.
References
- Salmon et al. (2005) P. S. Salmon, R. A. Martin, P. E. Mason, and G. J. Cuello, Nature 435, 03475 (2005).
- D’ Angelo et al. (2010) G. D’ Angelo, C. Crupi, M. A. González, E. Basile, V. C. Nibali, and C. Mondelli, J. Phys. Chem. B 114, 12565 (2010).
- Elliott (1995) S. Elliott, J. Non-Cryst. Solids 182, 40 (1995).
- Uhlherr and Elliott (1995) A. Uhlherr and S. R. Elliott, Philos. Mag. B 71, 611 (1995).
- Crupi et al. (2016) C. Crupi, G. Carini, G. Ruello, and G. D’Angelo, Philos. Mag. 96, 788 (2016).
- Bychkov et al. (2005) E. Bychkov, C. J. Benmore, and D. L. Price, Phys. Rev. B 72, 172107 (2005).
- Uemura et al. (1975) O. Uemura, Y. Sagara, and T. Satow, Phys. Status Solidi A 32, K91 (1975).
- Susman et al. (1988) S. Susman, D. Price, K. Volin, R. Dejus, and D. Montague, J. Non-Cryst. Solids 106, 26 (1988).
- Vashishta et al. (1989) P. Vashishta, R. K. Kalia, G. A. Antonio, and I. Ebbsjö, Phys. Rev. Lett. 62, 1651 (1989).
- Price et al. (1989) D. Price, S. Susman, K. Volin, and R. Dejus, Phys. B 156-157, 189 (1989).
- Busse and Nagel (1981) L. E. Busse and S. R. Nagel, Phys. Rev. Lett. 47, 1848 (1981).
- Armand et al. (1994) P. Armand, A. Ibanez, Q. Ma, D. Raoux, and E. Philippot, J. Non-Cryst. Solids 167, 37 (1994).
- Susman et al. (1991a) S. Susman, K. J. Volin, D. G. Montague, and D. L. Price, Phys. Rev. B 43, 11076 (1991a).
- Inamura et al. (1997) Y. Inamura, M. Arai, N. Kitamura, S. Bennington, and A. Hannon, Phys. B 241-243, 903 (1997).
- Lee and Elliott (1995) J. Lee and S. Elliott, J. Non-Cryst. Solids 192-193, 133 (1995).
- Debye (1913) P. Debye, Ann. Phys. 348, 49 (1913).
- Inamura et al. (2007) Y. Inamura, Y. Katayama, and W. Utsumi, J. Phys.: Condens. Matter 19, 415104 (2007).
- (18) The effect of temperature on the structure factor of polycrystalline and disordered aggregates can be rather complicated due to the presence of attendant thermal diffuse scattering, which originates from the self-scattering of an atom with respect to itself. Here, we refer to the effect of the Debye-Waller factor, which simply dampens the Bragg peaks of crystalline samples at high temperature.
- Susman et al. (1991b) S. Susman, K. J. Volin, D. L. Price, M. Grimsditch, J. P. Rino, R. K. Kalia, P. Vashishta, G. Gwanmesia, Y. Wang, and R. C. Liebermann, Phys. Rev. B 43, 1194 (1991b).
- Pilla et al. (2003) O. Pilla, L. Angelani, A. Fontana, J. R. Gonçalves, and G. Ruocco, J. Phys.: Condens. Matter 15, S995 (2003).
- Sampath et al. (2003) S. Sampath, C. J. Benmore, K. M. Lantzky, J. Neuefeind, K. Leinenweber, D. L. Price, and J. L. Yarger, Phys. Rev. Lett. 90, 115502 (2003).
- Lucovsky and Phillips (2010) G. Lucovsky and J. C. Phillips, Nanoscale Res. Lett. 5, 550 (2010).
- Gaskell and Wallis (1996) P. H. Gaskell and D. J. Wallis, Phys. Rev. Lett. 76, 66 (1996).
- Du and Corrales (2005) J. Du and L. R. Corrales, Phys. Rev. B 72, 092201 (2005).
- Uhlherr and Elliott (1994) A. Uhlherr and S. R. Elliott, J. Phys.: Condens. Matter 6, L99 (1994).
- Fortner and Lannin (1989) J. Fortner and J. S. Lannin, Phys. Rev. B 39, 5527 (1989).
- Holender and Morgan (1991) J. M. Holender and G. J. Morgan, J. Phys.: Condens. Matter 3, 7241 (1991).
- Wooten et al. (1985) F. Wooten, K. Winer, and D. Weaire, Phys. Rev. Lett. 54, 1392 (1985).
- Barkema and Mousseau (2000) G. T. Barkema and N. Mousseau, Phys. Rev. B 62, 4985 (2000).
- Xie et al. (2013) R. Xie, G. G. Long, S. J. Weigand, S. C. Moss, T. Carvalho, S. Roorda, M. Hejna, S. Torquato, and P. J. Steinhardt, Proc. Natl. Acad. Sci. 110, 13250 (2013).
- Laaziri et al. (1999) K. Laaziri, S. Kycia, S. Roorda, M. Chicoine, J. L. Robertson, J. Wang, and S. C. Moss, Phys. Rev. B 60, 13520 (1999).
- (32) An alternative approach to generate a 4-fold-coordinated disordered network is to employ the reverse Monte Carlo (RMC) approach using a suitable cost function. The resulting tetravalent network can be used as a starting configuration for the WWW bond switches between atoms.
- Metropolis et al. (1953) N. Metropolis, A. W. Rosenbluth, M. N. Rosenbluth, A. H. Teller, and E. Teller, J. Chem. Phys. 21, 1087 (1953).
- Keating (1966) P. N. Keating, Phys. Rev. 145, 637 (1966).
- Stillinger and Weber (1985) F. H. Stillinger and T. A. Weber, Phys. Rev. B 31, 5262 (1985).
- Soler et al. (2002) J. M. Soler, E. Artacho, J. D. Gale, A. García, J. Junquera, P. Ordejón, and D. Sánchez-Portal, J. Phys.: Condens. Matter 14, 2745 (2002).
- Perdew et al. (1996) J. P. Perdew, K. Burke, and M. Ernzerhof, Phys. Rev. Lett. 77, 3865 (1996).
- Harris (1985) J. Harris, Phys. Rev. B 31, 1770 (1985).
- Perdew and Zunger (1981) J. P. Perdew and A. Zunger, Phys. Rev. B 23, 5048 (1981).
- Limbu et al. (2020) D. K. Limbu, S. R. Elliott, R. Atta-Fynn, and P. Biswas, Sci. Rep. 10, 7742 (2020).
- Beeman et al. (1985) D. Beeman, R. Tsu, and M. F. Thorpe, Phys. Rev. B 32, 874 (1985).
- Atta-Fynn and Biswas (2018) R. Atta-Fynn and P. Biswas, J. Chem. Phys. 148, 204503 (2018).
- Deringer et al. (2018) V. L. Deringer, N. Bernstein, A. P. Bartók, M. J. Cliffe, R. N. Kerber, L. E. Marbella, C. P. Grey, S. R. Elliott, and G. Csányi, J. Phys. Chem. Lett. 9, 2879 (2018).
- Limbu et al. (2018) D. K. Limbu, R. Atta-Fynn, D. A. Drabold, S. R. Elliott, and P. Biswas, Phys. Rev. Materials 2, 115602 (2018).
- (45) The positions of the maxima of asymptotically converge to , where is a positive integer. The first four positions of the maxima of , for , are given by =0, 7.725, 14.065, and 20.37. The corresponding values for are at =1.570 (), 7.853 (), 14.137 (), and 20.420 (). This also explains why =0 does not provide a physical solution (as it corresponds to = 0).